Compass STEM gathering 12.06.13...Compass STEM gathering ... Eva Scates-Winston Minnesota State...
65
Compass STEM gathering Moving from research to action December 6, 2013
Transcript of Compass STEM gathering 12.06.13...Compass STEM gathering ... Eva Scates-Winston Minnesota State...

Compass STEM gathering
Moving from research to action
December 6, 2013

Marilee Grant
Welcome
Paul Mattessich

A community indicators project, Minnesota Compass
provides a common foundation of information and
data that people need to identify, understand, and
effectively act on community issues.
What is MN Compass?

Working to
change the
equation

Working to
change the
equation
Inefficient decisions
From: Good intentions
No common base of information
+
=

Working to
change the
equation
Productive decisions
for a strong region
To: Good intentions
Common sense of purpose
Sound, credible information
+
+
=

Minnesota Compass

Minnesota Compass

New STEM section launched in October 2013

Interactive visual

Interactive visual


>50 stakeholders
Core advisory group
Supported by
Boston Scientific
Advisory committee process
Co-conveners:
Paul Mattessich, Wilder Research
Margaret Anderson Kelliher, MN High Tech Association
Doug Paulson, MN Department of Education
Rose Chu, Metropolitan State University
Marilee Grant, Boston Scientific
Core advisory group
Tim Barrett Minnesota High Tech Association
Ronald Bennett University of St. Thomas
Marilee Grant Boston Scientific
Craig Helmstetter Minnesota Compass
Anne Hornickel Minnesota STEM Network
Caryn Mohr Wilder Research
Dan Mueller Wilder Research
Doug Paulson Minnesota Department of Education
Eva Scates-Winston Minnesota State Colleges and Universities
Jessi Strinmoen Rochester Chamber of Commerce
Steven Walvig The Bakken Museum
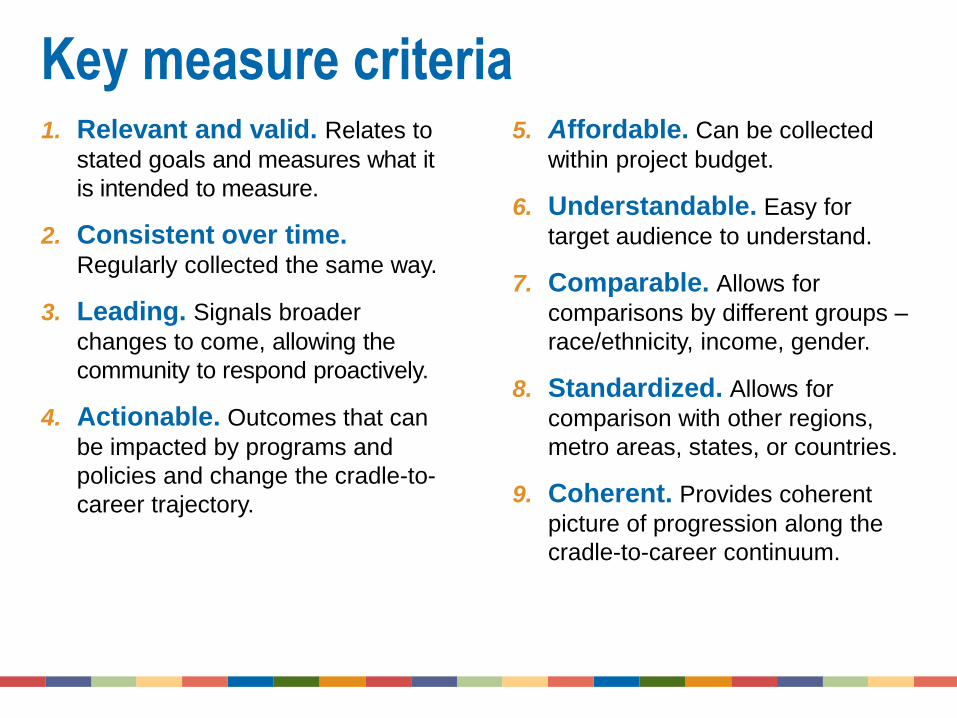
1. Relevant and valid. Relates to
stated goals and measures what it
is intended to measure.
2. Consistent over time. Regularly collected the same way.
3. Leading. Signals broader
changes to come, allowing the
community to respond proactively.
4. Actionable. Outcomes that can
be impacted by programs and
policies and change the cradle-to-
career trajectory.
5. Affordable. Can be collected
within project budget.
6. Understandable. Easy for
target audience to understand.
7. Comparable. Allows for
comparisons by different groups –
race/ethnicity, income, gender.
8. Standardized. Allows for
comparison with other regions,
metro areas, states, or countries.
9. Coherent. Provides coherent
picture of progression along the
cradle-to-career continuum.
Key measure criteria

Caryn Mohr
Key themes from the data
Allison Liuzzi

Almost 455,000 STEM workers in MN.
They are 17% of MN’s current workforce,
and will increase by 18% in 10 years.
Why does STEM education matter
to Minnesota?

Why does STEM education matter
to Minnesota?
That’s just people employed
directly in STEM fields.

Expected job growth is higher for STEM than
non-STEM jobs
18%
13%
20%
14%
16%
12%

STEM education is critical to
Minnesota’s prosperity

Education and workforce alignment

Today, the majority of Minnesota’s STEM workers are
employed in three occupational groups.

And STEM employment is expected grow in all fields
through 2020.

And STEM employment is expected grow in all fields
through 2020.
38,000 new openings
18,000 new openings
11,000 new openings

Nearly three-quarters of
Minnesota’s STEM workforce
are employed in three large
occupational groups
Health
Production and trade
Computers
These three fields alone are
expected to add 67,000 jobs
to Minnesota’s economy
through 2020

Nearly three-quarters of
Minnesota’s STEM workforce
are employed in three large
occupational groups
Health
Production and trade
Computers
These three fields alone are
expected to add 67,000 jobs
to Minnesota’s economy
through 2020
Are recent
postsecondary
graduates ready to
meet these future
workforce needs?

0 10,000 20,000 30,000 40,000 50,000
Architecture
Computer fields
Engineering
Health
Life and physical sciences
Math
STEM mgmt, sales, and related fields
STEM postsecondary education
STEM production and trade fields
STEM social sciences
Degrees/certificates awarded (2012)
New openings projected through 2020
STEM degrees awarded (2012) and new STEM
openings (projected) in Minnesota

Research to action
There are multiple pathways
in STEM, and not all require
the same levels of education
But degrees and certificates
may not always align with
workforce needs
STEM education contributes
to broader 21st century skills
that matter, regardless of field

Research to action
Is alignment between
postsecondary awards and
workforce needs a top
agenda item?
How do jobs that are not yet
created fit into this?
How do we address specific
workforce needs in the context
of broader 21st century skills?

Achievement gaps in STEM

84%
43%
66%
70%
66%
57%
22%
39%
35%
37%
Graduating on time (high school)
College-ready in math and science (highschool)
Meeting state math standards (8th grade)
Meeting state science standards (5th grade)
Meeting state reading standards (3rd grade)
Of Color White
35 point gap
Minnesota's gaps by race along the cradle-to-career
continuum

59%
56%
57%
But we can’t attribute gaps by race in STEM
achievement to a lack of interest

A greater proportion of 8th graders of color
participate in extra-curricular science activities
34%
30%
30%

A greater share of high school students of color are
“very sure” they will major in a STEM field
13%
9%
10%
White
(non-Hispanic

Research to action
There are large gaps in
achievement by race along
the STEM cradle-to-career
continuum
These gaps are not explained
by lack of interest

Research to action
What are our top needs and
messages around achievement
gaps by race in STEM?
How do we harness students’
interest in STEM, in ways that
positively impact achievement?
What else do we need to know
about these gaps?

Gender and STEM

60% 58%
60%
27%
34%
18% 17%
55%
62% 58%
34%
46%
21% 23%
Meeting statereading
standards (3rdgrade)
Meeting statescience
standards (5thgrade)
Meeting statemath standards
(8th grade)
Science activitiesoutside of school
(8th grade)
College-ready inmath and science
(high school)
Degreesawarded in
STEM(postsecondary)
Employment inSTEM
Female Male
Minnesota's gaps by gender along the cradle-to-
career continuum

Relatively small gaps by
gender in many indicators of
STEM across the cradle-to-
career continuum
Larger gender gap between
high school females’ and
males’ college readiness in
math and science

Relatively small gaps by
gender in many indicators of
STEM across the cradle-to-
career continuum
Larger gender gap between
high school females’ and
males’ college readiness in
math and science
So where do we see
notable differences
in STEM by gender?

Within STEM,
there are large
differences in
fields of study
by gender.

And there are large differences in STEM occupation
by gender

Research to action
Many gender gaps across the
STEM cradle-to-career
continuum are relatively small
But when we dig a bit deeper,
we see larger gender gaps in
STEM fields of study and
occupations

Research to action
What are key messages about
gender and STEM? Are there
successes as well as gaps?
What are the implications of
gender differences among
STEM fields?

Framework

Logic model

Logic model

The data story

Research on benchmarks, gaps, and
best practices

Data needs

Data needs

Data needs

Research to action
There are data needs
related to:
STEM integration
Out-of-school time
21st century skills
Teacher preparation
Other factors

Research to action
In what ways do data needs
factor into top priorities for
STEM?
What initiatives are already
underway that can advance
data needs in some areas?
Specifically, how might there
be systematic collection of
other data that are needed?

Where do YOU think we need to act?

Steven Walvig

Stakeholder story
Joe Alfano Minneapolis Public Schools

STEM cradle-to-career continuum


Stakeholder story
Lisa Schlosser Thomson Reuters

Stakeholder story
Anne Hornickel SciMathMN

Doug Paulson

1. What are top priorities for STEM education
in Minnesota?
2. How can you use the resource to tell
your story?
3. In what ways can we support future
research agendas?
Questions for discussion

Thank you!
Paul Mattessich Steven Walvig

Get the data you need! www.mncompass.org
www.mncompass.org

Contact [email protected]
Text “MNCOMPASS” to 22828 to sign up
for our monthly e-newsletter
Or sign up online: mncompass.org
Follow us on Twitter @MNCompass
Connect with MN Compass on Facebook
www.mncompass.org