Comparison Study of the Effectiveness of Two Different ... Study of the Effectiveness of Two ......
12
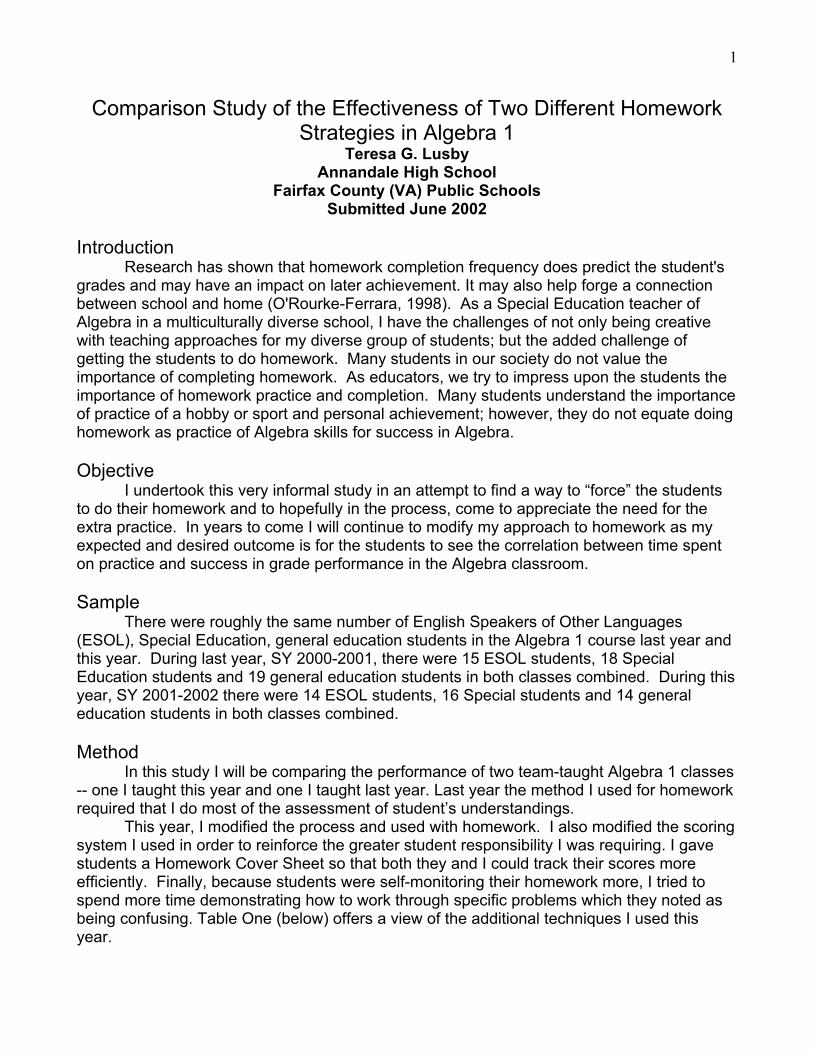
1 Comparison Study of the Effectiveness of Two Different Homework Strategies in Algebra 1 Teresa G. Lusby Annandale High School Fairfax County (VA) Public Schools Submitted June 2002 Introduction Research has shown that homework completion frequency does predict the student's grades and may have an impact on later achievement. It may also help forge a connection between school and home (O'Rourke-Ferrara, 1998). As a Special Education teacher of Algebra in a multiculturally diverse school, I have the challenges of not only being creative with teaching approaches for my diverse group of students; but the added challenge of getting the students to do homework. Many students in our society do not value the importance of completing homework. As educators, we try to impress upon the students the importance of homework practice and completion. Many students understand the importance of practice of a hobby or sport and personal achievement; however, they do not equate doing homework as practice of Algebra skills for success in Algebra. Objective I undertook this very informal study in an attempt to find a way to “force” the students to do their homework and to hopefully in the process, come to appreciate the need for the extra practice. In years to come I will continue to modify my approach to homework as my expected and desired outcome is for the students to see the correlation between time spent on practice and success in grade performance in the Algebra classroom. Sample There were roughly the same number of English Speakers of Other Languages (ESOL), Special Education, general education students in the Algebra 1 course last year and this year. During last year, SY 2000-2001, there were 15 ESOL students, 18 Special Education students and 19 general education students in both classes combined. During this year, SY 2001-2002 there were 14 ESOL students, 16 Special students and 14 general education students in both classes combined. Method In this study I will be comparing the performance of two team-taught Algebra 1 classes -- one I taught this year and one I taught last year. Last year the method I used for homework required that I do most of the assessment of student’s understandings. This year, I modified the process and used with homework. I also modified the scoring system I used in order to reinforce the greater student responsibility I was requiring. I gave students a Homework Cover Sheet so that both they and I could track their scores more efficiently. Finally, because students were self-monitoring their homework more, I tried to spend more time demonstrating how to work through specific problems which they noted as being confusing. Table One (below) offers a view of the additional techniques I used this year.
-
Upload
truongliem -
Category
Documents
-
view
212 -
download
0
Transcript of Comparison Study of the Effectiveness of Two Different ... Study of the Effectiveness of Two ......
1
Comparison Study of the Effectiveness of Two Different Homework Strategies in Algebra 1
Teresa G. Lusby Annandale High School
Fairfax County (VA) Public Schools Submitted June 2002
Introduction Research has shown that homework completion frequency does predict the student's grades and may have an impact on later achievement. It may also help forge a connection between school and home (O'Rourke-Ferrara, 1998). As a Special Education teacher of Algebra in a multiculturally diverse school, I have the challenges of not only being creative with teaching approaches for my diverse group of students; but the added challenge of getting the students to do homework. Many students in our society do not value the importance of completing homework. As educators, we try to impress upon the students the importance of homework practice and completion. Many students understand the importance of practice of a hobby or sport and personal achievement; however, they do not equate doing homework as practice of Algebra skills for success in Algebra. Objective
I undertook this very informal study in an attempt to find a way to “force” the students to do their homework and to hopefully in the process, come to appreciate the need for the extra practice. In years to come I will continue to modify my approach to homework as my expected and desired outcome is for the students to see the correlation between time spent on practice and success in grade performance in the Algebra classroom. Sample
There were roughly the same number of English Speakers of Other Languages (ESOL), Special Education, general education students in the Algebra 1 course last year and this year. During last year, SY 2000-2001, there were 15 ESOL students, 18 Special Education students and 19 general education students in both classes combined. During this year, SY 2001-2002 there were 14 ESOL students, 16 Special students and 14 general education students in both classes combined. Method In this study I will be comparing the performance of two team-taught Algebra 1 classes -- one I taught this year and one I taught last year. Last year the method I used for homework required that I do most of the assessment of student’s understandings. This year, I modified the process and used with homework. I also modified the scoring system I used in order to reinforce the greater student responsibility I was requiring. I gave students a Homework Cover Sheet so that both they and I could track their scores more efficiently. Finally, because students were self-monitoring their homework more, I tried to spend more time demonstrating how to work through specific problems which they noted as being confusing. Table One (below) offers a view of the additional techniques I used this year.

2
Table One Comparative View of Homework Strategies Used
HOMEWORK STRATEGY #1, SY 2000-2001 HOMEWORK STRATEGY #2, SY 2001-2002Focus:
• Include assigned homework on each Chapter Overview.
Scoring:
• Next class the students would earn 8 points for completing the assignment or 4 points, half credit, for completing at least half of the assignment and 0 points for less than half completed or no homework. The teacher would determine the point value by going around the classroom and looking briefly at each student’s homework paper on the student’s desk.
Process:
• Assign homework daily. • Require that all homework be
completed in pencil. • Provide an opportunity for students to
start homework in class. • Provide answers to all homework
problems. • Provide opportunity for students to ask
for clarification and review of problems they didn’t understand.
• Proceed with instruction for the day.
Focus: • Did not use a chapter overview
strategy Scoring:
• In order to correct the homework, the teacher chooses any four problems from homework assignment and checks those four problems for correctness. If any of the chosen problems were problems that were reviewed during homework review time, the student’s corrected work will be accepted.
• Student may earn a possible 5 points on each homework assignment, 1 point for each problem that is solved correctly and an additional 1 point for having completed the assignment.
• Teacher records # points earned onto the Homework Cover Sheet, initials and makes comments.
Process:
• Assign homework on a daily basis at the end of class.
• Require that all homework be completed in pencil.
• Provide an opportunity for the students to start homework in class.
• Require students to self-check odd numbered problems against the answers in the back of the student book.
• Require students to self-correct odd numbered problems that were incorrect.
• Require students to make note of odd numbered problems they are unable to

3
figure out in their attempt to make corrections.
• At the beginning of the next class, students must use a colored marking pen for making corrections to homework problems in class.
• Provide students with answers to even numbered problems.
• Provide students with time to ask questions for clarification on how to correct odd or even numbered problems they did not understand.
• Teacher demonstrates and reviews procedures for solving specific problems as requested by students.
• Have students turn in homework with their Homework Cover Sheet.
• Proceed with instruction for the day. Findings The success or failure of my new strategy might be examined in several ways: (1) by comparing student passing rates with their homework completion rates and (2) by examining student comments and my (teacher) reflections that I had recorded in my journal throughout the year.
Findings that focus on a comparison between students’ passing rates and their homework completion rates suggest that the new homework strategy I used this year did not make much of a difference. A comparative number of ESOL and general education students passed my course this year in relation to last year. 66% of ESOL students passed in 2000-2001 compared to 64% in 2001-2002, while 89% of general education students passed in 2000-2001 compared to 71% in 2001-2002. Of concern to me, however, is the fact that a much larger percentage of my Special Education students did not pass my course this year (61% compared to 31%). (See Appendices A and B for more detail.)
Table Two Student Passing Rates
SY 2000 - 2001 SY 2001 - 2002 Total number of students passing
38 out of 52 24 out of 44
• ESOL students • 10 out of 15 • 9 out of 14 • Special Education
students • 11 out of 18 • 5 out of 16
• General Education students
• 17 out of 19 • 10 out of 14

4
However, upon closer examination of the scores, I noticed that, during both school years, those students who had higher homework completion rates (above 50%) were more likely to have passed the course. However, some students who completed their homework more than 50% of the time still did not pass.
Table Three
Student Homework Completion Ranges
SY 2000 - 2001 SY 2001 - 2002 Passing
Algebra with “C” or Better
Failing Algebra with “D+” or Less
Passing Algebra with “C” or Better
Failing Algebra with “D+” or Less
• ESOL students
• 53-94 %
• 53-82 %
• 70-90 %
• 38-47,62 %
• Special Education students
• 74-98 %
• 32-87 %
• 61-96 %
• 13-68 %
• General Education students
• 61-100 %
• 53 % and 74%
• 66-100 %
• 19-59 %
Of course, student performance includes much more than their completion of
homework assignments, but my assumption is that homework completion plays a large part in success in Algebra. An excerpt of student comments and some of my observations recorded in my research journal during the study suggests that the additional processes I used as part of the new homework strategy did help improve the quality of work done by those who completed their homework.
Homework Strategy #1 SY 2000-2001
Student Comments:
1. I’m glad you don’t check for correctness. 2. Don’t I get at least half-credit? I did 2 problems out of 13!
Teacher Observations:
1. ESOL and Special Education students often did not attempt to do all of their homework.
2. Many of the students seemed to be happy to get anything down on their homework papers regardless of whether or not the answer made any sense.
3. Routinely, students did not ask for many homework problems to be reviewed during homework review time.
4. There was no required format for homework. It was often sloppy and illegible.

5
Homework Strategy #2
SY 2001-2002
Student Comments: 1. We aren’t supposed to look up answers in the back of the book. That’s cheating! 2. I couldn’t figure out how to do problem #, on page ___. Would you show us how to
do that one? Teacher Observations:
1. Students generally attempted their homework. 2. The majority of ESOL and Special Education students as well as general education
students attempted to genuinely work the problems out. 3. Since there was a required format for the homework, student work was usually
legible and neat. 4. Many students asked for clarification of homework problems. 5. Many students self-initiated to come in before or after school for clarification of
homework problems.
Implications This teacher researcher project gave me an opportunity to address the homework
issue that’s been a source of constant challenge. Here are some implications for my teaching:
• Insist on structure for the actual layout of homework on the paper. Even though the students were resistant at first. The layout affords the students room to make corrections.
• Continue to encourage students to check answers in the back of the book. Students came in with more questions both during class and outside of class.
• Have the teacher continue to correct student homework and give credit for correctness. It encourages them to try their best on it.
• Students do like to see timelines. Incorporate the Chapter Assignment overview used during the first year into Strategy #2.
• Modify the second year model in order to achieve higher grade performance without inflating the grades.

6
References Chmura, G. (1993). An Increase in Independent Written Practice Improves Math Test Scores.
“Bright Ideas”- A Collection of Classroom Research Papers from the Annandale Research Team 92-93 Research.
Hermann, K. (1990). Beginning ESL and Cooperative Learning. Annandale Research Team’s Collection of Classroom Research Papers: 1989-1990.
Stephenson, S. (1999). Questions and the Search for Answers. Oakton High & Franklin Middle Teacher Research Project 98-99.

7
Appendix A
CLASS DATA 2000-2001 ALGEBRA 1 HOMEWORK STUDY
CLASS #1 4th
(56) 3rd
(120) 2nd
(112) 1st
(136) TOTAL (424)
% Homework
Points
Final Grade
Student 1 * 40 116 64 126 346 82 D Student2 40 114 80 120 354 83 B Student3 * 36 72 92 96 296 70 B Student4 32 112 72 96 312 74 D Student5 40 76 96 124 336 79 B Student6 40 116 112 122 390 92 C+ Student7 • 32 76 88 -- 196/288 68 C Student8 • 35 72 56 88 251 59 B Student9 * 24 122 72 78 296 70 C Student10 * 56 122 80 -- 258/288 90 C Student11 60 84 84 87 315 74 C+ Student12 • 40 100 104 100 344 81 C+ Student13 • 40 98 88 124 266 63 D+ Student14 48 120 108 107 383 90 C+ Student15 • 52 109 112 76 349 82 C Student16 • 24 78 32 60 194 45 D+ Student17 * 56 122 96 56 330 78 B Student18 * 28 80 100 60 268 63 F Student19 • 44 86 92 108 330 78 D Student20 40 96 80 112 328 77 C+ Student21 • 40 100 108 120 368 87 D+ Student22 48 97 84 88 317 75 B Student23 * 40 80 84 104 308 73 D+ Student24 • 48 120 100 136 404 95 C Student25 • 56 118 108 112 394 93 C+ Student26 40 114 98 98 260 61 C KEY: • Denotes a Special Education Student * Denotes an English Speaker of Other Languages (ESOL) Student Denotes a General Education Student

8
CLASS DATA 2000-2001 ALGEBRA 1 HOMEWORK STUDY
CLASS #2 4th
(56) 3rd
(120) 2nd
(112) 1st
(136) TOTAL (424)
% HomeworkPoints
Final Grade
Student A • 40 66 92 114 312 74 C+ Student B 55 112 112 119 398 94 B Student C • 8 48 0 -- 56/176 32 F Student D * 40 54 -- -- 94/170 55 C+ Student E • 37 68 92 95 292 69 D+ Student F 56 122 112 132 422 100 A Student G • 55 120 108 135 418 99 B Student H 56 118 112 136 422 100 B+ Student I • 40 120 96 124 380 90 C+ Student J * 46 118 76 120 360 85 B Student K 43 86 64 136 329 78 C+ Student L 52 81 104 104 341 80 C Student M 8 80 112 124 324 76 D Student N • 53 120 112 132 417 98 C Student O * 48 89 96 136 369 87 B+ Student P * 25 94 38 69 226 53 F Student Q • 45 102 64 120 331 78 C+ Student R * 56 93 112 136 397 94 B+ Student S • 53 100 92 -- 245/288 85 D+ Student T * 40 84 96 127 347 82 D Student U * 48 -- -- -- 48/56 86 B Student V 22 86 84 108 300 71 D+ Student W 35 112 100 132 379 89 B+ Student X 27 102 108 136 373 88 B Student Y * 24 44 84 70 172 41 C Student Z 44 104 104 105 357 84 C+ Student AA 54 120 112 128 414 98 B+ KEY: • Denotes a Special Education Student * Denotes an English Speaker of Other Languages (ESOL) Student Denotes a General Education Student

9
CLASS DATA 2001-2002
ALGEBRA 1 HOMEWORK STUDY CLASS #3
4th
(24) 3rd
(77.5) 2nd
(66) 1st
(64) TOTAL (231.5)
% Homework Points
Final Grade
Student1 9.5 80.5 39.5 60 189.25 82 A Student2 * 9.5 21.5 26.5 14/20 71.5 38 D+ Student3 • 0 12 0 18 30 13 F Student4 * 5 62 32 45 144 62 D+ Student5 26 91.5 74.5 58 250 107 A Student6 * 11 76.5 53.5 58 199 86 C+ Student7 • 0 0 33 -- 33 14 F Student8 19 84.5 64.5 64 232 100 B+ Student9 11.5 66 26 50 153.5 66 C+ Student10 • 0 39.5 35.5 48 123 53 F Student11 20 86.5 54 64 224.5 97 C+ Student12 19 82 50.5 62 213.5 92 C+ Student13 • 13 54.5 40.5 50 158 68 C Student14 • 20.5 79.5 59 61 220 95 C+ Student15 • 12 55 43 22 132 57 D Student16 * 22.5 80 47.5 56 206 89 C+ Student17 • 0 3 10.5 16 29.5 13 F Student18 * 0 40 24.5 45 109.5 47 D+ Student19 * 12.5 73 45.5 57 188 81 B+ KEY: • Denotes a Special Education Student * Denotes an English Speaker of Other Languages (ESOL) Student Denotes a General Education Student

10
CLASS DATA 2001-2002
ALGEBRA 1 HOMEWORK STUDY CLASS #4 4th
(24) 3rd
(80) 2nd
(66) 1st
(64) TOTAL (234)
% HomeworkPoints
Final Grade
StudentA * 15 5.5 39 40 99.5 42.5 F StudentB • 0 38 17.5 27 82.5 35 F StudentC • 0 36 7 19 62 26 F StudentD * 14 77.5 60 60 211.5 90 B StudentE 11.5 60.5 49 39 160 68 C StudentF 0 10 14 20 44 19 F StudentG • 0 17 29 35 81 35 F StudentH 2 54.5 32.5 48 137 59 D StudentI • 6 48 41 48 143 61 C+ StudentJ • 11.5 44.5 46 58 160 68 D+ StudentK 2.5 39 19 37 97.5 42 F StudentL 16.5 59 46.5 53 175 75 C StudentM 7 78.5 63 59 207.5 89 A StudentN * 14.5 71 45.5 45 176 75 C+ StudentO * 17.5 85.5 46 48 197 84 C+ StudentP • 26 87.5 55.5 56 225 96 B StudentQ * 13.5 56 51.5 59 180 77 C+ StudentR * 26 71.5 43.5 50 191 82 B StudentS 13 92 63 60 228 97 B+ StudentT * 15.5 25 29.5 33 103 44 F StudentU • 17.5 80.5 56.5 52 206.5 88 C+ StudentV • 11.5 46 33 28 118.5 51 F StudentW 0 7 20 27 54 23 D StudentX • 18.5 69.5 -- -- 88/130 68 D StudentY * 3.5 58 49.5 52 163
70 B
KEY: • Denotes a Special Education Student * Denotes an English Speaker of Other Languages (ESOL) Student Denotes a General Education Student

11
Appendix B
DATA FROM 2000-2001 SCHOOL YEAR TOTAL # STUDENTS IN STUDY
ESOL STUDENTS
SPECIAL EDUCATION STUDENTS
GENERAL EDUCATION STUDENTS
52 15 18 19 # OF STUDENTS PASSING ALGEBRA WITH “C” OR BETTER
ESOL STUDENTS
% HW Completion Range
SPECIAL EDUCATION STUDENTS
%HW Completion Range
GENERAL EDUCATION STUDENTS
%HW Completion Range
38 10 41,53-94 11 74-98 17 61-100 # OF STUDENTS FAILING ALGEBRA WITH “D+” OR LESS
ESOL STUDENTS
% HW Completion Range
SPECIAL EDUCATION STUDENTS
%HW Completion Range
GENERAL EDUCATION STUDENTS
%HW Completion Range
14 5 53-82 7 32-87 2 53,74

12
DATA FROM 2001-2002 SCHOOL YEAR TOTAL # STUDENTS IN STUDY
ESOL STUDENTS
SPECIAL EDUCATION STUDENTS
GENERAL EDUCATION STUDENTS
44 14 16 14 # OF STUDENTS PASSING ALGEBRA WITH “C” OR BETTER
ESOL STUDENTS
% HW Completion Range
SPECIAL EDUCATION STUDENTS
%HW Completion Range
GENERAL EDUCATION STUDENTS
%HW Completion Range
24 9 70-90 5 61-96 10 66-100 # OF STUDENTS FAILING ALGEBRA WITH “D+” OR LESS
ESOL STUDENTS
% HW Completion Range
SPECIAL EDUCATION STUDENTS
%HW Completion Range
GENERAL EDUCATION STUDENTS
%HW Completion Range
20 5 38-47,62 11 13-68 4 19-59