Comparison of water flux from Douglas-fir and Oregon white oak of varying age and stature Nathan...
32
Comparison of water flux rom Douglas-fir and Oregon white oak of varying age and stature Nathan Phillips, Barbara Bond Nate McDowell, Andrew Schauer, Mike Ryan, Eric Watrud, Nate Gehres,
-
Upload
clifton-harrell -
Category
Documents
-
view
215 -
download
0
Transcript of Comparison of water flux from Douglas-fir and Oregon white oak of varying age and stature Nathan...

Comparison of water fluxfrom Douglas-fir and Oregon
white oak of varying age and stature
Nathan Phillips, Barbara BondNate McDowell, Andrew Schauer,
Mike Ryan, Eric Watrud, Nate Gehres,

Temperate conifer Dry angiosperm Tropical angiosperm

Landsat TM, Wind River Canopy Crane Research Facility

Betts et al. 1997, Nature

Field et al. 1999

Yoder et al. 1994

XX
X

Mountain Ash Forest, AustraliaA
nn
ual
Wat
er F
lux
(cm
)
0
30
60
90
120
0 50 100 150 2000
30
60
90
120
Forest Age (y)
Stream flow
Evapo-transpiration
Watson et al. 1999

Objectives•Determine whether tall trees show reduced transpiration compared to smaller trees
•Scale whole-tree water use estimates to the ecosystem and compare age classes
•Compare transpiration estimates to ecosystem latent heat fluxes estimated using eddy covariance (Doug-fir only) [thanks KT Paw U, Jiquan Chen, Mattias Falk, Tom King]

Suite of tests:
Parameter Predicted change w/ size
sap flow decrease
stomatal conductance decrease
latent heat flux decrease (?)

Methods
•sap flux measurements: constant thermal dissipation technique (Granier-Type).
•Sampling: 6-9 trees in 20, 40, and 500 y old doug-fir stands; 8 trees each in old/young oak
•Sub-sampling: 2-5 points within trees •Study period: 1998,99 summer months for Doug-fir; 1999 summer for oak
•eddy covariance: 20 and 500 y old Doug-fir stands

Douglas-fir Study Area
Southern Washington
•Douglas fir dominated•3 age class sites within 10 km •2.5 m annual precipitation•9 oC mean annual temperature•350 - 500 m elevation
500 y, 65 m tall 40 y, 35 m tall 20 y, 15 m tall

Wind River, WA
180 210 240 270
Vo
l. s
oil
mo
istu
re (
m3 m
-3)
0.25
0.30
0.35
0.40
0.45
Day of year
0.25
0.30
0.35
0.40
0.45 20 y40 y500 y
1998
1999

Wind River, WA
180 210 240 270
0
1
2
3
420 y40 y500 y
Tra
ns
pir
ati
on
(m
m d
-1)
0
1
2
3
4
1998
1999

Wind River, WA 1998-1999
500 y transpiration (mm d-1)0 1 2 3 4
20
y t
ran
sp
ira
tio
n
(
mm
d-1
)
0
1
2
3
4Y = 0.3 + 2.1Xr2 = 0.61

Sa
pfl
ow
(mm
h-1
)
0.0
0.1
0.2
0.3 20 y500 y
VP
D (
kP
a)
0
1
2
3
4
P
AR
(mm
ol
m-2
s-1
)
0.0
0.5
1.0
1.5
2.0 PAR20 y VPD500 y VPD
August 2 (moist soil) Sept. 14 (dry soil)
Time (h)6 12 18 24 6 12 18 24
Wind River, WA 1998
Phillips et al., AGU 1999
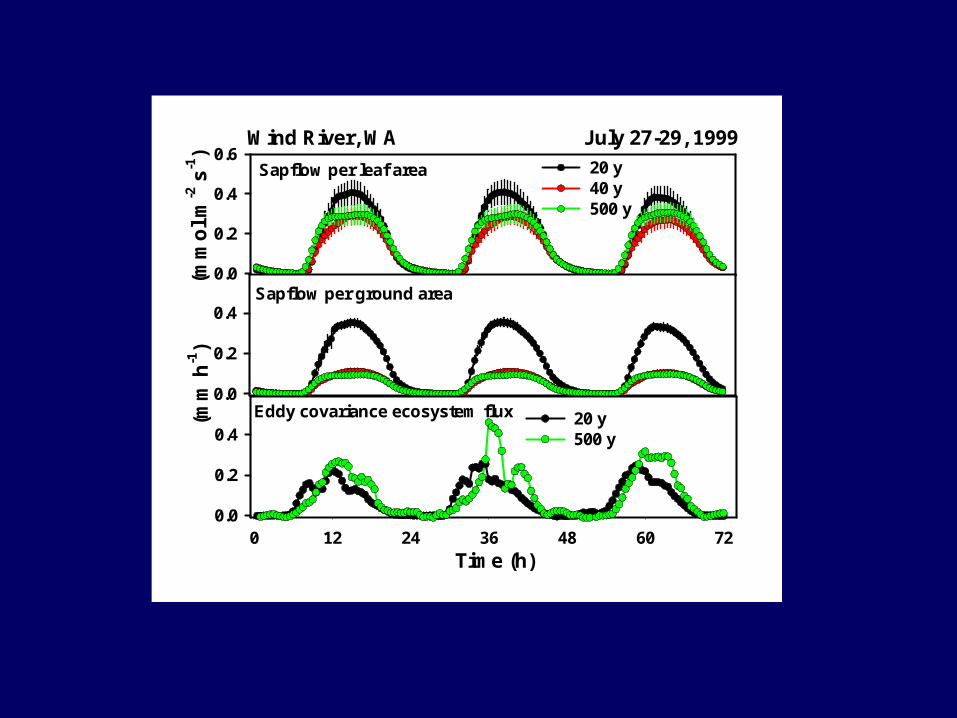
Wind River, WA July 27-29, 1999
0.0
0.2
0.4
0.620 y40 y500 y
(mm
h-1
)
0.0
0.2
0.4
0 12 24 36 48 60 720.0
0.2
0.420 y500 y
Eddy covariance ecosystem flux
Sapflow per ground area
Sapflow per leaf area
(mm
ol
m-2
s-1
)
Time (h)

Wind River, WA July 27-29, 1999
0.0 0.1 0.2 0.3 0.4 0.5
20
y E
dd
y C
ov
. (m
m h
-1)
0.0
0.1
0.2
0.3
0.4
0.5Y= 0.01 + 0.65Xr2 = 0.86
500 y sapflow (mm h-1) 500 y Eddy Cov. (mm h-1)0.0 0.1 0.2 0.3 0.4
20
y S
apfl
ow
(m
m h
-1)
0.0
0.1
0.2
0.3
0.4
0.5Y= -0.02 + 3.4Xr2 = 0.96
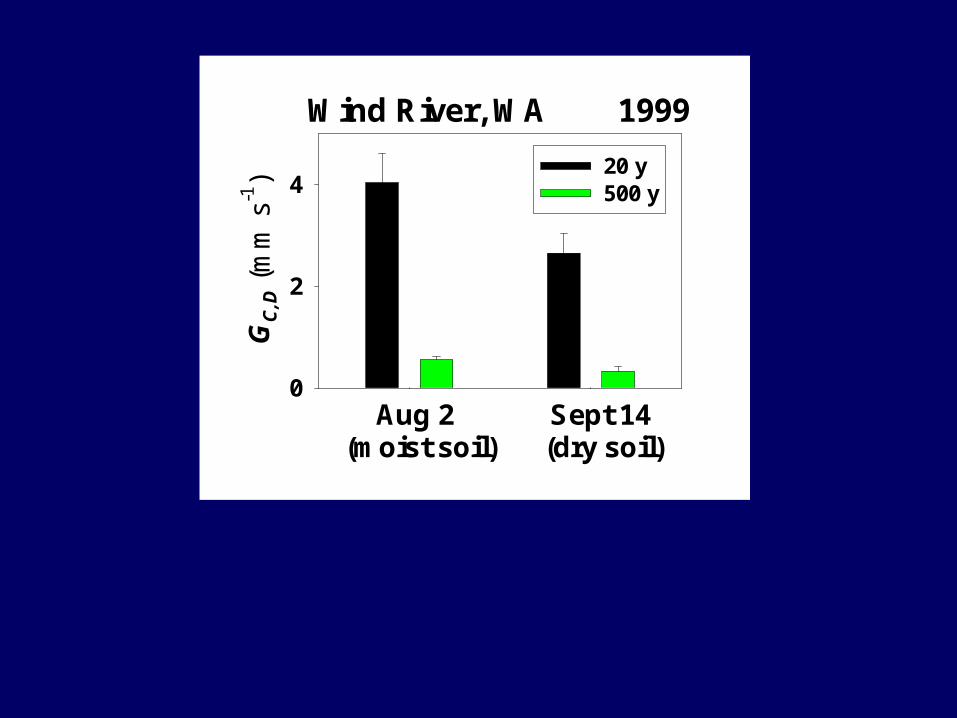
Wind River, WA 1999
Aug 2 Sept 14(moist soil) (dry soil)
GC
,D (
mm
s-1
)
0
2
420 y500 y

Oregon white oak

-600
-400
-200
0
TD
R n
3.5
4.0
4.5YoungOLD
A,B: Corvallis met data - Hyslop Experimental Station, Oregon Climate Service
Day of year (May 1, 1999 - Oct 15, 1999)
Rai
n, E
vap
ora
tio
n (
mm
)
02468
1012
Cumulative Evaporation - Rain
Rain EvaporationA.
B.TDR

Quercus garryana 1999, Corvallis OR
LA
I (m
2 m-2
)0
1
2
3
4p = 0.48 n = 25 traps n = 14 traps
25 m 10 m
LA
/SW
A (
m2 c
m-2
)
0.0
0.1
0.2
0.3
0.4p < 0.00001 (assuming no error in SWA)
SW
A (
m2 h
a-1)
0
5
10

Sa
p F
lux
(g
m-2
s-1
)
0
10
20
30
40
50
0
10
20
30
40
E (
mm
h-1
)
0.00
0.03
0.06
0.09
0.12
OldYoung
May 22 - 28 June 19-23 Sept 28 - Oct 4
Time (d)
Quercus garryana Corvallis, OR , 1999

Quercus garryana Corvallis, ORMay 22 - Oct 4, 1998
Young E (mm h-1)
0.00 0.02 0.04 0.06 0.08 0.10 0.12 0.14
Old
E (
mm
h-1
)
0.00
0.02
0.04
0.06
0.08
0.10
0.12
0.14
Old = 0.001 + 0.40 Youngr2 = 0.95

Quercus garryana Corvallis, OR 1999
25 m 10 m
Tra
nsp
irat
ion
(m
m d
-1)
0.0
0.2
0.4
0.6
0.8
1.0
1.2

Future Directions

3PG Model Structure

Bogh et al. 1999 Remote Sens. Environ.

2 cm

Phillips et al. (NSF in review) adapted from Liu 1985


Nate M.
Nate G.
Heather M, Megan V.H.
Hyun K.
Eric W.
Acknowledgements
Andy S.
Seth M.