Comparison of Two Superparamagnetic Viral-Sized Iron Oxide
10
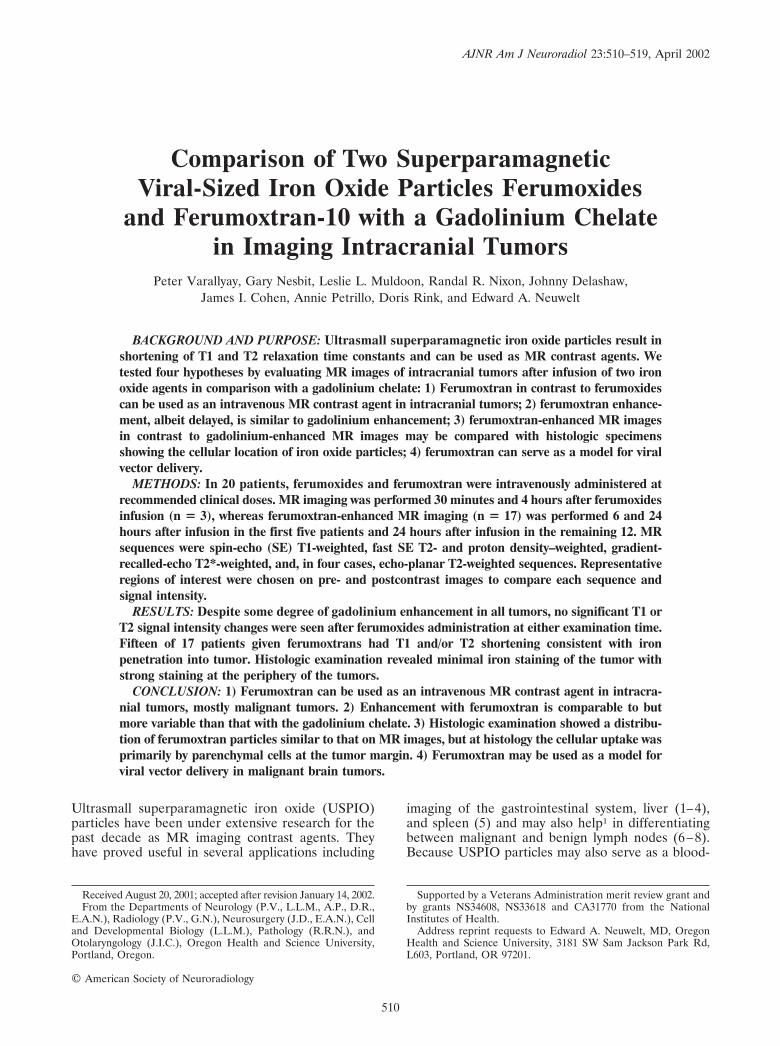
Comparison of Two Superparamagnetic Viral-Sized Iron Oxide Particles Ferumoxides and Ferumoxtran-10 with a Gadolinium Chelate in Imaging Intracranial Tumors Peter Varallyay, Gary Nesbit, Leslie L. Muldoon, Randal R. Nixon, Johnny Delashaw, James I. Cohen, Annie Petrillo, Doris Rink, and Edward A. Neuwelt BACKGROUND AND PURPOSE: Ultrasmall superparamagnetic iron oxide particles result in shortening of T1 and T2 relaxation time constants and can be used as MR contrast agents. We tested four hypotheses by evaluating MR images of intracranial tumors after infusion of two iron oxide agents in comparison with a gadolinium chelate: 1) Ferumoxtran in contrast to ferumoxides can be used as an intravenous MR contrast agent in intracranial tumors; 2) ferumoxtran enhance- ment, albeit delayed, is similar to gadolinium enhancement; 3) ferumoxtran-enhanced MR images in contrast to gadolinium-enhanced MR images may be compared with histologic specimens showing the cellular location of iron oxide particles; 4) ferumoxtran can serve as a model for viral vector delivery. METHODS: In 20 patients, ferumoxides and ferumoxtran were intravenously administered at recommended clinical doses. MR imaging was performed 30 minutes and 4 hours after ferumoxides infusion (n 3), whereas ferumoxtran-enhanced MR imaging (n 17) was performed 6 and 24 hours after infusion in the first five patients and 24 hours after infusion in the remaining 12. MR sequences were spin-echo (SE) T1-weighted, fast SE T2- and proton density–weighted, gradient- recalled-echo T2*-weighted, and, in four cases, echo-planar T2-weighted sequences. Representative regions of interest were chosen on pre- and postcontrast images to compare each sequence and signal intensity. RESULTS: Despite some degree of gadolinium enhancement in all tumors, no significant T1 or T2 signal intensity changes were seen after ferumoxides administration at either examination time. Fifteen of 17 patients given ferumoxtrans had T1 and/or T2 shortening consistent with iron penetration into tumor. Histologic examination revealed minimal iron staining of the tumor with strong staining at the periphery of the tumors. CONCLUSION: 1) Ferumoxtran can be used as an intravenous MR contrast agent in intracra- nial tumors, mostly malignant tumors. 2) Enhancement with ferumoxtran is comparable to but more variable than that with the gadolinium chelate. 3) Histologic examination showed a distribu- tion of ferumoxtran particles similar to that on MR images, but at histology the cellular uptake was primarily by parenchymal cells at the tumor margin. 4) Ferumoxtran may be used as a model for viral vector delivery in malignant brain tumors. Ultrasmall superparamagnetic iron oxide (USPIO) particles have been under extensive research for the past decade as MR imaging contrast agents. They have proved useful in several applications including imaging of the gastrointestinal system, liver (1– 4), and spleen (5) and may also help 1 in differentiating between malignant and benign lymph nodes (6 – 8). Because USPIO particles may also serve as a blood- Received August 20, 2001; accepted after revision January 14, 2002. From the Departments of Neurology (P.V., L.L.M., A.P., D.R., E.A.N.), Radiology (P.V., G.N.), Neurosurgery (J.D., E.A.N.), Cell and Developmental Biology (L.L.M.), Pathology (R.R.N.), and Otolaryngology (J.I.C.), Oregon Health and Science University, Portland, Oregon. © American Society of Neuroradiology Supported by a Veterans Administration merit review grant and by grants NS34608, NS33618 and CA31770 from the National Institutes of Health. Address reprint requests to Edward A. Neuwelt, MD, Oregon Health and Science University, 3181 SW Sam Jackson Park Rd, L603, Portland, OR 97201. AJNR Am J Neuroradiol 23:510–519, April 2002 510
Transcript of Comparison of Two Superparamagnetic Viral-Sized Iron Oxide
Comparison of Two SuperparamagneticViral-Sized Iron Oxide Particles Ferumoxides
and Ferumoxtran-10 with a Gadolinium Chelatein Imaging Intracranial Tumors
Peter Varallyay, Gary Nesbit, Leslie L. Muldoon, Randal R. Nixon, Johnny Delashaw,James I. Cohen, Annie Petrillo, Doris Rink, and Edward A. Neuwelt
BACKGROUND AND PURPOSE: Ultrasmall superparamagnetic iron oxide particles result inshortening of T1 and T2 relaxation time constants and can be used as MR contrast agents. Wetested four hypotheses by evaluating MR images of intracranial tumors after infusion of two ironoxide agents in comparison with a gadolinium chelate: 1) Ferumoxtran in contrast to ferumoxidescan be used as an intravenous MR contrast agent in intracranial tumors; 2) ferumoxtran enhance-ment, albeit delayed, is similar to gadolinium enhancement; 3) ferumoxtran-enhanced MR imagesin contrast to gadolinium-enhanced MR images may be compared with histologic specimensshowing the cellular location of iron oxide particles; 4) ferumoxtran can serve as a model for viralvector delivery.
METHODS: In 20 patients, ferumoxides and ferumoxtran were intravenously administered atrecommended clinical doses. MR imaging was performed 30 minutes and 4 hours after ferumoxidesinfusion (n � 3), whereas ferumoxtran-enhanced MR imaging (n � 17) was performed 6 and 24hours after infusion in the first five patients and 24 hours after infusion in the remaining 12. MRsequences were spin-echo (SE) T1-weighted, fast SE T2- and proton density–weighted, gradient-recalled-echo T2*-weighted, and, in four cases, echo-planar T2-weighted sequences. Representativeregions of interest were chosen on pre- and postcontrast images to compare each sequence andsignal intensity.
RESULTS: Despite some degree of gadolinium enhancement in all tumors, no significant T1 orT2 signal intensity changes were seen after ferumoxides administration at either examination time.Fifteen of 17 patients given ferumoxtrans had T1 and/or T2 shortening consistent with ironpenetration into tumor. Histologic examination revealed minimal iron staining of the tumor withstrong staining at the periphery of the tumors.
CONCLUSION: 1) Ferumoxtran can be used as an intravenous MR contrast agent in intracra-nial tumors, mostly malignant tumors. 2) Enhancement with ferumoxtran is comparable to butmore variable than that with the gadolinium chelate. 3) Histologic examination showed a distribu-tion of ferumoxtran particles similar to that on MR images, but at histology the cellular uptake wasprimarily by parenchymal cells at the tumor margin. 4) Ferumoxtran may be used as a model forviral vector delivery in malignant brain tumors.
Ultrasmall superparamagnetic iron oxide (USPIO)particles have been under extensive research for thepast decade as MR imaging contrast agents. Theyhave proved useful in several applications including
imaging of the gastrointestinal system, liver (1–4),and spleen (5) and may also help1 in differentiatingbetween malignant and benign lymph nodes (6–8).Because USPIO particles may also serve as a blood-
Received August 20, 2001; accepted after revision January 14, 2002.From the Departments of Neurology (P.V., L.L.M., A.P., D.R.,
E.A.N.), Radiology (P.V., G.N.), Neurosurgery (J.D., E.A.N.), Celland Developmental Biology (L.L.M.), Pathology (R.R.N.), andOtolaryngology (J.I.C.), Oregon Health and Science University,Portland, Oregon.
© American Society of Neuroradiology
Supported by a Veterans Administration merit review grant andby grants NS34608, NS33618 and CA31770 from the NationalInstitutes of Health.
Address reprint requests to Edward A. Neuwelt, MD, OregonHealth and Science University, 3181 SW Sam Jackson Park Rd,L603, Portland, OR 97201.
AJNR Am J Neuroradiol 23:510–519, April 2002
510

pool agent, they may be used for MR angiographyand perfusion imaging of the brain and heart (9–11).
Depending on their structure, iron oxide particleshave different intravascular half-lives and are variablytaken up in the reticuloendothelial system. In reactivebrain lesions, they can also be found in the vascularendothelium and in the perivascular space (12). Stud-ies have also shown promise with the use of USPIOparticles in detecting active inflammatory or demyeli-nating lesions because of iron uptake in perivascularmacrophages (12–14). In addition, iron oxide parti-cles can be detected in the central nervous system inneurons after either direct inoculation or blood-brainbarrier (BBB) disruption (15, 16), as well as in ma-lignant glial tumors after intravenous administration(17–20) and in cell lines in vitro (21). In other studies,USPIO particles have been used to assess the vari-ables in maximizing the volume of distribution afterdirect interstitial infusion by convection in a ratmodel (22), as well as to demonstrate antibody tar-geted delivery (23). USPIO particles may be identi-fied at the light and electron microscopic levels, al-lowing evaluation of their exact location within tissues(15, 16), unlike other central nervous system MRimaging agents.
Two iron oxide agents were examined in this study.Ferumoxides (Feridex IV; Advanced Magnetics,Cambridge, MA), which is approved by the U.S. Foodand Drug Administration (FDA) for liver imaging,has a mean particle size of 58.5 nm � 185.8 (volumeweighted). The particle cores are aggregates of ironcrystals incompletely coated with dextran and have alarge size distribution as well as irregularity in shape(24). Ferumoxides tends to be rapidly opsonized andtaken up by the reticuloendothelial system, and there-fore it has a short plasma half-life of 8–30 minutes.Ferumoxtran-10 (Combidex; Advanced Magnetics)has a mean particle size of 29.5 nm � 23.1 (volumeweighted), consists of monocrystalline cores, is moreuniform in shape and size, and is completely coatedwith a thicker dextran layer (24). Ferumoxtran-10 hasa plasma half-life of 25–30 hours, therefore the organuptake duration is much longer than that with feru-moxides.
This study was designed to answer the followinghypotheses: 1) ferumoxtran, in contrast to ferumox-ides, may be used as an intravenous contrast agent forMR imaging of intracranial tumors; 2) ferumoxtranenhancement, albeit delayed, is similar to enhance-ment with a gadolinium-based contrast agent; 3) feru-moxtran-enhanced MR images, in contrast to gado-linium-enhanced MR images, may be compared withhistologic specimens showing the location of the ironoxide particles at the cellular level in tumors; and 4)ferumoxtran may serve as a model for viral vectordelivery.
Methods
Twenty patients (age range, 30–66 years; mean age, 47.2years) with primary and metastatic intracranial tumors wereenrolled in this FDA- and institutional review board–approved
study from December 1999 to December 2001. Six patientswere randomly assigned to receive either ferumoxides or feru-moxtran before a lack of substantial iron accumulation wasfound on MR images after ferumoxides infusion (Table). Atthat point, ferumoxtran was used exclusively. Written informedconsent was obtained from each patient. All patients under-went MR imaging with a gadolinium-based contrast agent(Omniscan [gadodiamide]; Nycomed Imaging, Oslo, Norway)at least 24 hours before but no more than 28 days before ironinfusion.
Ferumoxides was administered intravenously in three pa-tients at the recommended clinical dose of 0.56 mg of iron perkilogram of body weight, and MR imaging was performed 30minutes and 4 hours after infusion. Ferumoxtran was adminis-tered intravenously, under FDA-approved Investigational NewDrug approval, in 17 patients at a dose of 2.6 mg Fe/kg, dilutedin 50 mL of normal saline, infused at 4 mL/min. Because of theincreased intravascular half-life, MR images were obtained 6hours and 24 hours after the infusion of ferumoxtran in the firstfive patients; the remaining 12 patients underwent MR imagingonly at 24 hours because the signal intensity changes werestronger and extended into a larger area at 24 hours.
All patients underwent MR imaging with spin-echo (SE)T1-weighted, fast SE T2-weighted, fast SE proton density–weighted, and gradient-recalled-echo (GRE) T2*-weighted se-quences; one patient underwent echo-planar SE T2-weightedimaging; one patient underwent echo-planar GRE T2*-weighted imaging; and one patient underwent both echo-planarSE T2-weighted and echo-planar GRE T2*-weighted imaging.Multiplanar images were obtained with a 1.5-T superconduct-ing magnet (Gyroscan, Philips, Best, the Netherlands; or Ho-rizon LX, GE Medical Systems, Milwaukee, WI) with a 23-cmfield of view. SE T1-weighted images were obtained with 500/13/2(TR/TE/NEX), fast SE T2-weighted images were acquired with3000/95/2, and fast SE proton density–weighted images were ob-tained with 2500/13/2. GRE T2*-weighted images were acquiredwith 750/23/2, flip angle 10°; multishot (echo-planar imaging fac-tor 3) echo-planar GRE T2*-weighted images were obtained with750/23/2, flip angle 10°; and echo-planar SE T2-weighted imageswere obtained with 4880/90/2 (echo-planar imaging factor 11).The matrix size was 256 � 192, section thickness was 3 mm, andintersection gap was 1 mm.
For quantitative analysis, the two patients with nasopharyn-geal carcinoma (patients 10 and 11) who received ferumoxtranwere excluded because they had only minimal intracranialspread, with mandibular nerve and dural involvement in theregion of the foramen ovale. To compare ferumoxtran accu-mulation with gadolinium enhancement in the remaining 15patients, representative regions of interest (ROIs) were chosenon the ferumoxtran-enhanced SE T1-weighted images in areasof maximal, minimal, and absent ferumoxtran enhancementand, for reference, in an area of normal-appearing brain. Byusing the pre–ferumoxtran-enhanced fast SE T2-weighted andthe gadolinium-enhanced SE T1-weighted images, an ROI wasalso obtained in the area of T2 signal intensity abnormality thatsurrounded the gadolinium-enhancing tumor (ie, brain aroundthe enhancing tumor). The same areas of ROI were carefullyapplied on each of the following images in the 15 patients:pre– gadolinium-enhanced SE T1-weighted, gadolinium-enhanced SE T1-weighted, ferumoxtran-enhanced SE T1-weighted, pre–ferumoxtran-enhanced fast SE T2-weighted,ferumoxtran-enhanced fast SE T2-weighted, and ferumoxt-ran-enhanced GRE T2*-weighted. Most patients were en-rolled in the study after undergoing routine brain MR im-aging with and without the gadolinium-based contrast agent;this did not include a GRE T2*-weighted series. However,two of the 15 patients underwent pre–ferumoxtran-enhancedGRE T2*-weighted imaging; thus, on these images the sameareas of ROI were obtained. One patient underwent feru-moxtran-enhanced echo-planar GRE T2*-weighted imaging,another patient underwent ferumoxtran-enhanced echo-
AJNR: 23, April 2002 USPIO PARTICLES VERSUS GADOLINIUM 511

planar SE T2-weighted imaging, and in a third patient bothferumoxtran-enhanced echo-planar SE T2-weighted andecho-planar GRE T2*-weighted sequences were performed.
Signal intensities were measured in each ROI, and the signalintensity values were normalized to normal brain for eachsequence, making a ratio by dividing the signal intensity valuein a specific ROI with the signal intensity value of the normal-appearing brain area. The normalized quantitative signal intensityvalues of the different ROIs for each sequence were analyzed andcompared, and the level of significance was determined by using apaired-samples t test. A P value of less than .05 was considered toindicate a statistically significant difference.
Minimal signal intensity change was detected in only one ofthe patients receiving ferumoxides; therefore, similar quantita-tive measurements were not made in the three patients whoreceived ferumoxides.
Two neuroradiologists (P.V., G.N.) and a neurosurgeon(E.A.N.) reviewed the images, and a consensus was made ifthere were different opinions regarding where to place thespecific ROIs. The above-described method ruled out the pos-sibility for evaluation to be blinded for gadolinium-enhancedimages and ferumoxtran- or ferumoxides-enhanced images,because the ROIs had to be chosen in areas of ferumoxtranenhancement.
Biopsy specimens were immersion-fixed in neutral bufferedformalin for at least 24–48 hours, then imbedded in egg yolk-gelatin. Serial vibratome sections (100 �m) from throughoutthe biopsy specimens were assessed for iron localization. His-tochemical staining for iron was performed by using the dia-minobenzidine (DAB)–enhanced Perls stain, as described pre-viously (15, 16); sections were counterstained with hematoxylin.
ResultsDespite the presence of gadolinium enhancement
in all tumors, no sign of iron penetration into tumor
(ie, T1 or T2 signal intensity changes) was seen in twoof the three patients at either examination time afterthe intravenous administration of ferumoxides withthe maximum clinically approved dose. One patientwho received ferumoxides had only a tiny area ofincreased T1 signal intensity (much fainter andsmaller than the gadolinium-enhancing area) withoutdetectable T2 signal intensity change, consistent witha very small amount of iron accumulation (Fig 1).
Fifteen of the 17 patients who received ferumoxtranhad T1 and/or T2 shortening consistent with iron accu-mulation in the tumor (Figs 2–4). The hyperintense T1signal intensity changes were readily detectable, and thehypointense fast SE T2 and GRE T2* signal intensitychanges were modest and more variable. The signalintensity changes were stronger and extended into alarger area on the 24-hour ferumoxtran-enhanced im-ages compared with the 6-hour study (Fig 2).
In general, 13 of the 15 brain tumors had signalintensity changes in the approximate region wheregadolinium enhancement was seen (Figs 2–4), butthree of the 13 patients (patients 9, 17, and 20) hadferumoxtran enhancement even in areas of no gado-linium enhancement (Fig 3, Table). Four of the thir-teen patients (patients 8, 12, 16, and 17) had highernormalized T1 signal intensity with ferumoxtran thanwith the gadolinium chelate in the maximal ROI, andfour patients (patients 5, 8, 16, and 17) showed highernormalized T1 signal intensity with ferumoxtran thanwith the gadolinium chelate in the minimal ROI (Ta-ble). Only the two low-grade oligodendrogliomas (Fig
Demographics and imaging results
Patient No./Sex/Age (y)
Histologic Diagnosis Tumor Location USPIO Iron Uptake T1 SignalIntensityChange
T2 SignalIntensityChange
1/F/48 Metastatic large cellcarcinoma
Cerebellum Ferumoxides � � �
2/M/46 Anaplastic oligodendraglioma R temporoparietal Ferumoxides �* � �
3/F/53 Meningioma L frontal Ferumoxides � � �
4/M/54 Gliblastoma multiforme L thalamus, parietal Ferumoxtran-10 � � �
5/M/55 Anaplastic oligodendraglioma L temporal Ferumoxtran-10 �† � �
6/M/54 Oligodendroglioma L frontotemporal Ferumoxtran-10 � � �
7/F/47 Hamartoma L temporal Ferumoxtran-10 �* � �
8/F/30 Medulloblastoma Cerebellum Ferumoxtran-10 �† � �
9/M/58 Anaplastic oligodendraglioma R temporoparietal Ferumoxtran-10 �† � �
10/M/55 Squamous cell carcinoma Nasopharynx withskull base invasion
Ferumoxtran-10 � � �
11/M/50 Squamous cell carcinoma Nasopharynx withskull base invasion
Ferumoxtran-10 � � �
12/F/42 Meningioma L petroclival Ferumoxtran-10 �† � �
13/M/57 Oligodendroglioma R parietal Ferumoxtran-10 � � �
14/M/55 Anaplastic glioma L temporal Ferumoxtran-10 �* � �
15/F/54 Glioblastoma multiforme R temporoparietal Ferumoxtran-10 � � �
16/F/66 Glioblastoma multiforme R frontal Ferumoxtran-10 �† � �
17/F/57 Anaplastic oligodendraglioma R frontal Ferumoxtran-10 �† � �
18/M/54 Pituitary adenoma Intra- and suprasellar Ferumoxtran-10 � � �
19/M/39 Glioblastoma multiforme L fronto-opercular Ferumoxtran-10 � � �
20/M/46 Anaplastic oligodendraglioma R posterior temporal Ferumoxtran-10 �† � �
Note.—L indicates left; R, right; �, yes; �, no.* Iron accumulation was only minimal compared with gadolinium enhancement.† Ferumoxtran enhancement as measured with ROI (see Methods) was regionally more prominent than gadolinium enhancement.
512 VARALLYAY AJNR: 23, April 2002

5) demonstrated no signal intensity changes (neitherT1 nor T2) with ferumoxtran (Table). The two naso-pharyngeal carcinomas also revealed T1 and T2shortening in the areas of abnormal gadolinium en-hancement in the parapharyngeal area and in theregion of the involved skull base. The venous struc-tures had variable T1 signal hyperintensity and per-sistent T2 hypointensity due to the persistent bloodconcentration of ferumoxtran secondary to its longplasma half-life.
The T1 and T2 shortening effects of ferumoxtranwere obvious (Figs 6 and 7) with progressive accumu-lation of the USPIOs from 6 to 24 hours (P � .05). Inthe area of maximal ferumoxtran enhancement, thedegree of enhancement was similar and significant
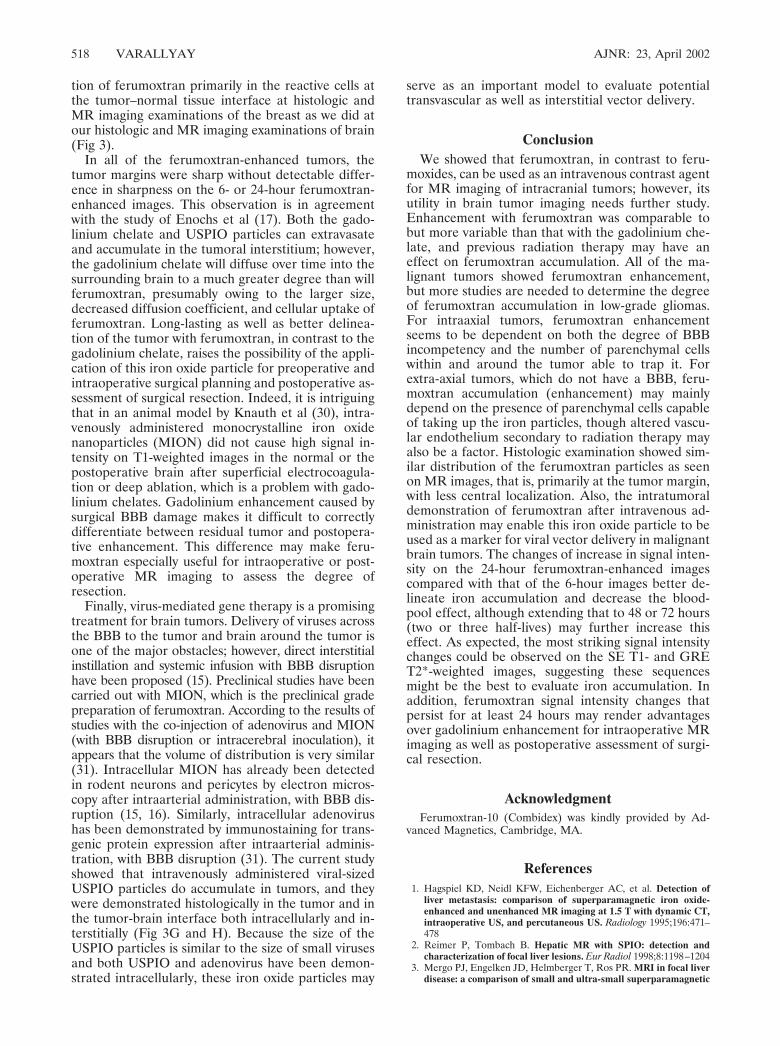
(P � .001) with ferumoxtran and gadolinium, with nosignificant difference between the ferumoxtran-en-hanced SE T1 and gadolinium-enhanced SE T1 signalintensities (Fig 6). In the area of minimal ferumoxt-ran enhancement, both gadolinium (P � .001) andferumoxtran (P � .005) demonstrated significant en-hancement compared with the precontrast images,but gadolinium-enhanced SE T1-weighted imagesshowed higher signal intensity compared with that onferumoxtran-enhanced SE T1-weighted images (P �.05) (Fig 6). In the area of maximal and minimalferumoxtran enhancement, significant decrease (P �.001, P � .01, respectively) in signal intensity was seenbetween the precontrast and ferumoxtran-enhancedfast SE T2-weighted images (Fig 7).
FIG 1. Patient 2 with anaplastic oligodendroglioma.A, Gadolinium-enhanced SE T1-weighted image shows an intensely enhancing tumor nodule in the posterior right temporal lobe.B and C, Four hours after ferumoxides infusion, SE T1-weighted image (B) shows only a tiny area of increased signal intensity (arrow),
whereas the GRE T2*-weighted image (C) demonstrates no decreased signal intensity (arrow). The rounded hypointense lateral regionin C is from a craniotomy plate.
FIG 2. Patient 5 with anaplastic oligo-dendroglioma.
A and B, SE T1-weighted images ob-tained 6 hours (A) and 24 hours (B) afterferumoxtran infusion show progressiveperipheral and patchy central enhance-ment in the left temporal tumor.
AJNR: 23, April 2002 USPIO PARTICLES VERSUS GADOLINIUM 513
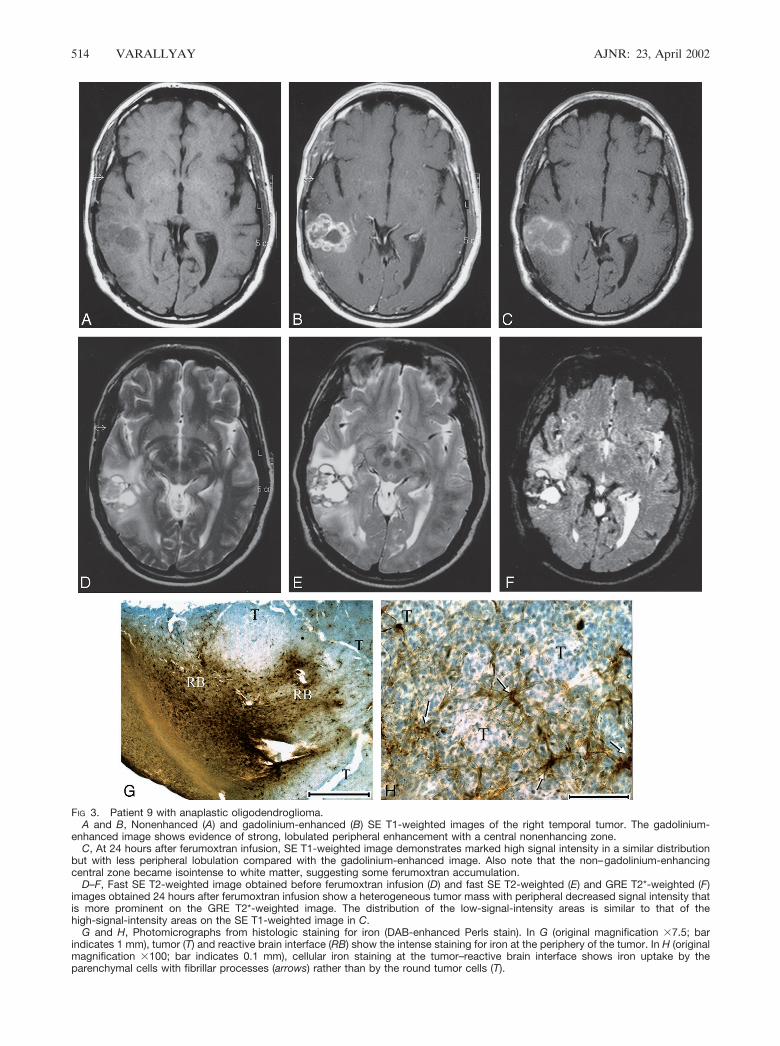
FIG 3. Patient 9 with anaplastic oligodendroglioma.A and B, Nonenhanced (A) and gadolinium-enhanced (B) SE T1-weighted images of the right temporal tumor. The gadolinium-
enhanced image shows evidence of strong, lobulated peripheral enhancement with a central nonenhancing zone.C, At 24 hours after ferumoxtran infusion, SE T1-weighted image demonstrates marked high signal intensity in a similar distribution
but with less peripheral lobulation compared with the gadolinium-enhanced image. Also note that the non–gadolinium-enhancingcentral zone became isointense to white matter, suggesting some ferumoxtran accumulation.
D–F, Fast SE T2-weighted image obtained before ferumoxtran infusion (D) and fast SE T2-weighted (E) and GRE T2*-weighted (F)images obtained 24 hours after ferumoxtran infusion show a heterogeneous tumor mass with peripheral decreased signal intensity thatis more prominent on the GRE T2*-weighted image. The distribution of the low-signal-intensity areas is similar to that of thehigh-signal-intensity areas on the SE T1-weighted image in C.
G and H, Photomicrographs from histologic staining for iron (DAB-enhanced Perls stain). In G (original magnification �7.5; barindicates 1 mm), tumor (T) and reactive brain interface (RB) show the intense staining for iron at the periphery of the tumor. In H (originalmagnification �100; bar indicates 0.1 mm), cellular iron staining at the tumor–reactive brain interface shows iron uptake by theparenchymal cells with fibrillar processes (arrows) rather than by the round tumor cells (T).
514 VARALLYAY AJNR: 23, April 2002
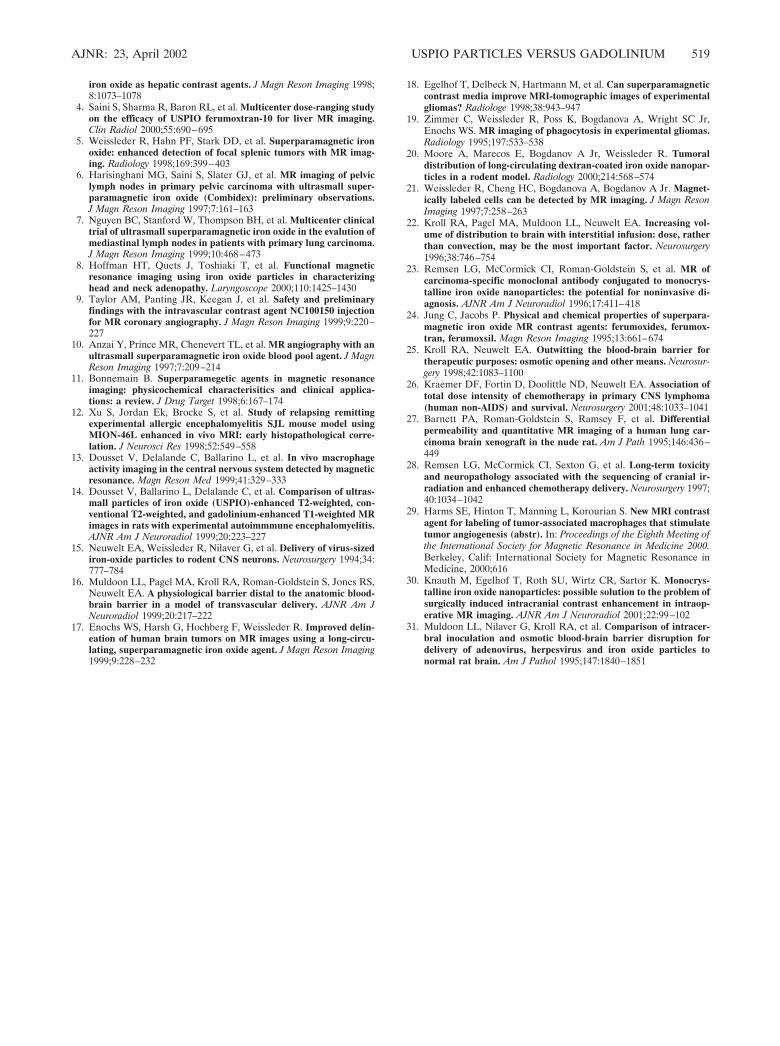
The lack of pre–ferumoxtran-enhanced GRE T2*-weighted images in all but two patients did not allowus to statistically compare the ferumoxtran-enhancedGRE T2* signal intensities with the pre–ferumoxtran-enhanced GRE T2* signal intensities. However, in theminimal ferumoxtran-enhancing region and brainaround enhancing tumor, there were significantly lowernormalized signal intensities (P � .005, P � .05, respec-tively) on GRE T2*-weighted images than on fast SET2-weighted images, with easier visual detectability ofT2 shortening on GRE T2*-weighted images (Fig 7). Inthe two patients who also had nonenhanced and feru-moxtran-enhanced GRE T2*-weighted images, we
could measure the percentage of signal intensity de-crease, which was compared with the fast SE T2 signalintensity decrease. The first patient showed 77% sig-nal intensity decrease on GRE T2*-weighted imagesand 65% signal intensity decrease on fast SE T2-weighted images in the maximal ferumoxtran-enhanc-ing ROI, and 55% signal intensity decrease on GRET2*-weighted images and 10% signal intensity de-crease on fast SE T2-weighted images in the minimalferumoxtran-enhancing ROI. The second patientdemonstrated 62%, 38%, 30%, and 13.5% signal in-tensity decrease, respectively. The four ferumoxtran-enhanced echo-planar imaging studies revealed no
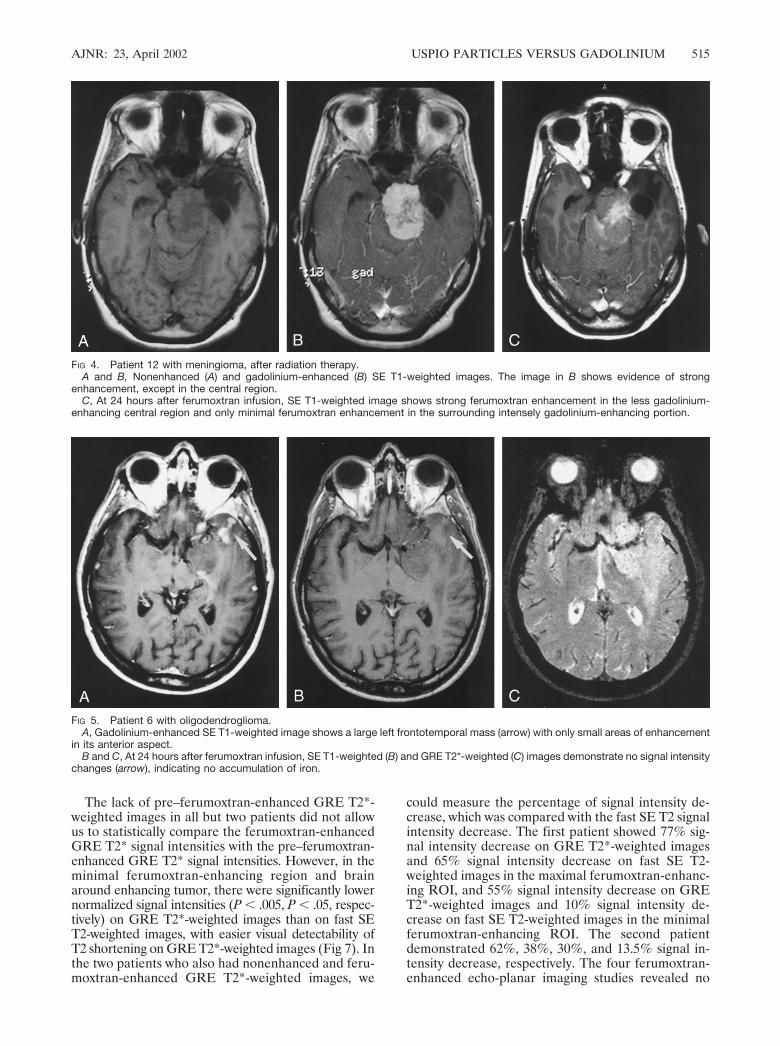
FIG 4. Patient 12 with meningioma, after radiation therapy.A and B, Nonenhanced (A) and gadolinium-enhanced (B) SE T1-weighted images. The image in B shows evidence of strong
enhancement, except in the central region.C, At 24 hours after ferumoxtran infusion, SE T1-weighted image shows strong ferumoxtran enhancement in the less gadolinium-
enhancing central region and only minimal ferumoxtran enhancement in the surrounding intensely gadolinium-enhancing portion.
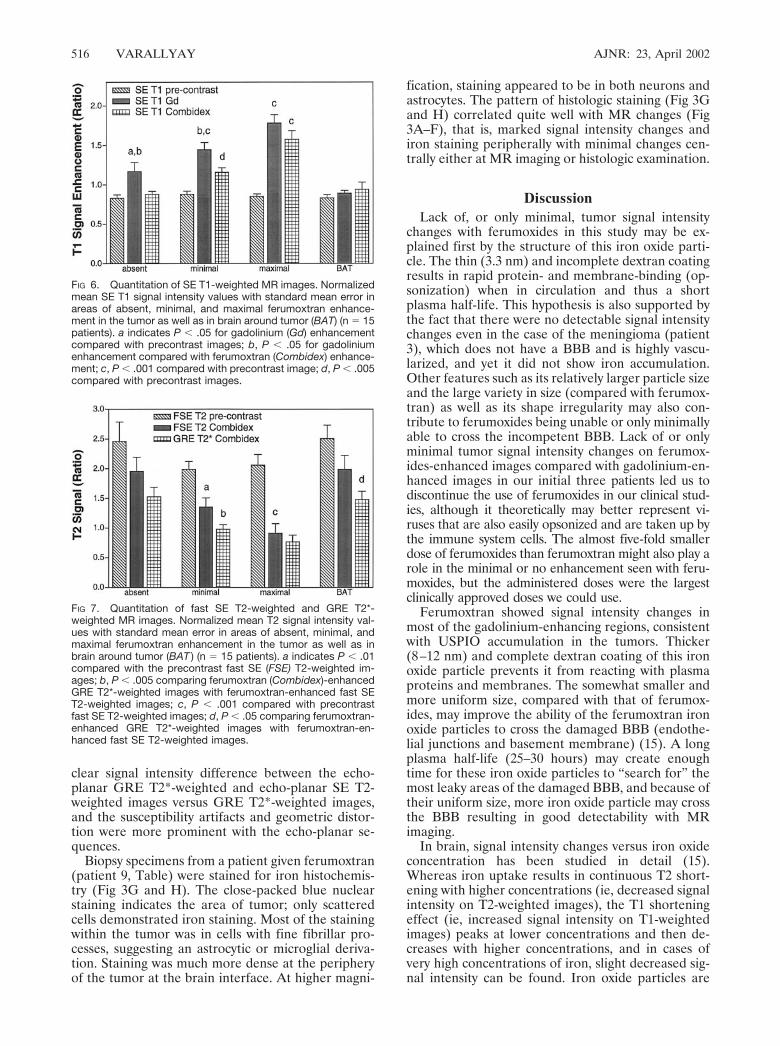
FIG 5. Patient 6 with oligodendroglioma.A, Gadolinium-enhanced SE T1-weighted image shows a large left frontotemporal mass (arrow) with only small areas of enhancement
in its anterior aspect.B and C, At 24 hours after ferumoxtran infusion, SE T1-weighted (B) and GRE T2*-weighted (C) images demonstrate no signal intensity
changes (arrow), indicating no accumulation of iron.
AJNR: 23, April 2002 USPIO PARTICLES VERSUS GADOLINIUM 515
clear signal intensity difference between the echo-planar GRE T2*-weighted and echo-planar SE T2-weighted images versus GRE T2*-weighted images,and the susceptibility artifacts and geometric distor-tion were more prominent with the echo-planar se-quences.
Biopsy specimens from a patient given ferumoxtran(patient 9, Table) were stained for iron histochemis-try (Fig 3G and H). The close-packed blue nuclearstaining indicates the area of tumor; only scatteredcells demonstrated iron staining. Most of the stainingwithin the tumor was in cells with fine fibrillar pro-cesses, suggesting an astrocytic or microglial deriva-tion. Staining was much more dense at the peripheryof the tumor at the brain interface. At higher magni-
fication, staining appeared to be in both neurons andastrocytes. The pattern of histologic staining (Fig 3Gand H) correlated quite well with MR changes (Fig3A–F), that is, marked signal intensity changes andiron staining peripherally with minimal changes cen-trally either at MR imaging or histologic examination.
DiscussionLack of, or only minimal, tumor signal intensity
changes with ferumoxides in this study may be ex-plained first by the structure of this iron oxide parti-cle. The thin (3.3 nm) and incomplete dextran coatingresults in rapid protein- and membrane-binding (op-sonization) when in circulation and thus a shortplasma half-life. This hypothesis is also supported bythe fact that there were no detectable signal intensitychanges even in the case of the meningioma (patient3), which does not have a BBB and is highly vascu-larized, and yet it did not show iron accumulation.Other features such as its relatively larger particle sizeand the large variety in size (compared with ferumox-tran) as well as its shape irregularity may also con-tribute to ferumoxides being unable or only minimallyable to cross the incompetent BBB. Lack of or onlyminimal tumor signal intensity changes on ferumox-ides-enhanced images compared with gadolinium-en-hanced images in our initial three patients led us todiscontinue the use of ferumoxides in our clinical stud-ies, although it theoretically may better represent vi-ruses that are also easily opsonized and are taken up bythe immune system cells. The almost five-fold smallerdose of ferumoxides than ferumoxtran might also play arole in the minimal or no enhancement seen with feru-moxides, but the administered doses were the largestclinically approved doses we could use.
Ferumoxtran showed signal intensity changes inmost of the gadolinium-enhancing regions, consistentwith USPIO accumulation in the tumors. Thicker(8–12 nm) and complete dextran coating of this ironoxide particle prevents it from reacting with plasmaproteins and membranes. The somewhat smaller andmore uniform size, compared with that of ferumox-ides, may improve the ability of the ferumoxtran ironoxide particles to cross the damaged BBB (endothe-lial junctions and basement membrane) (15). A longplasma half-life (25–30 hours) may create enoughtime for these iron oxide particles to “search for” themost leaky areas of the damaged BBB, and because oftheir uniform size, more iron oxide particle may crossthe BBB resulting in good detectability with MRimaging.
In brain, signal intensity changes versus iron oxideconcentration has been studied in detail (15).Whereas iron uptake results in continuous T2 short-ening with higher concentrations (ie, decreased signalintensity on T2-weighted images), the T1 shorteningeffect (ie, increased signal intensity on T1-weightedimages) peaks at lower concentrations and then de-creases with higher concentrations, and in cases ofvery high concentrations of iron, slight decreased sig-nal intensity can be found. Iron oxide particles are
FIG 6. Quantitation of SE T1-weighted MR images. Normalizedmean SE T1 signal intensity values with standard mean error inareas of absent, minimal, and maximal ferumoxtran enhance-ment in the tumor as well as in brain around tumor (BAT) (n � 15patients). a indicates P � .05 for gadolinium (Gd) enhancementcompared with precontrast images; b, P � .05 for gadoliniumenhancement compared with ferumoxtran (Combidex) enhance-ment; c, P � .001 compared with precontrast image; d, P � .005compared with precontrast images.
FIG 7. Quantitation of fast SE T2-weighted and GRE T2*-weighted MR images. Normalized mean T2 signal intensity val-ues with standard mean error in areas of absent, minimal, andmaximal ferumoxtran enhancement in the tumor as well as inbrain around tumor (BAT ) (n � 15 patients). a indicates P � .01compared with the precontrast fast SE (FSE) T2-weighted im-ages; b, P � .005 comparing ferumoxtran (Combidex)-enhancedGRE T2*-weighted images with ferumoxtran-enhanced fast SET2-weighted images; c, P � .001 compared with precontrastfast SE T2-weighted images; d, P � .05 comparing ferumoxtran-enhanced GRE T2*-weighted images with ferumoxtran-en-hanced fast SE T2-weighted images.
516 VARALLYAY AJNR: 23, April 2002

much more effective in MR relaxation than theirmore common paramagnetic (gadolinium) counter-part (24) and can be detected in vivo at lower con-centrations down to 1 �g (15, 16). In the currentseries, ferumoxtran resulted in increased T1 and de-creased T2 signal intensity; thus, at the applied doses,the iron accumulation is not concentrated enough tocause decreased T1 signal intensity.
The findings from this study corroborate the obser-vation of Enochs et al (17) that different pathologictissues can show different enhancement with distinctclasses of MR contrast agents. It is widely acceptedthat BBB breakdown may be variable not only in thecase of different histologic types of tumors but alsowithin one tumor mass (25–27). The question remainsof the mechanism and the necessary conditions forenhancement by different contrast agents other thangadolinium-based contrast agents. It is reasonable toassume that even if the BBB becomes incompetentfor low-molecular-weight gadolinium, it does not nec-essarily mean that it is leaky enough to allow largersized particles (ferumoxtran) to enter the interstitium(27). Ferumoxtran accumulation (enhancement) mayalso be related to cell metabolic activity. Studies haveshown that metabolically active cells such as malig-nant glial cells take up the iron oxide particles byendocytosis in vitro (21). Some investigators (17–20)have also demonstrated that this iron uptake by ma-lignant glial cells may also occur in vivo, but accordingto our animal experiments tumor cell uptake of feru-moxtran in vivo is often poor. Further studies arenecessary to determine the exact location of ironparticles in the tumor and in adjacent tissues in vivo.
Ferumoxtran enhancement also seems to dependon the amount of parenchymal cells capable of takingup the iron particles. Histologic staining of the tumorand brain around enhancing tumor (Fig 3G and H)from a patient with distinct ferumoxtran enhance-ment (Fig 3A–F) showed iron uptake by scatteredcells within the tumor and strong iron staining at thetumor periphery and brain around enhancing tumor.Although some stained cells may be tumor, as evi-denced by small round morphology, most staining isfound in cells with fine fibrillar processes with astro-cytic morphology. The results suggest that two majorphenomena come into play for ferumoxtran enhance-ment. First is crossing the BBB, allowing passage offerumoxtran from the intravascular space. Second isthe presence of parenchymal cells capable of accumu-lating the ferumoxtran particles. Absent or minimalferumoxtran enhancement in areas within tumor thatshow gadolinium enhancement may thus be due to avariably incompetent BBB for the smaller gadoliniumand the larger ferumoxtran molecules and/or a vari-able presence or ability of the cells that take up iron.Further evaluation of these hypotheses with multipletumor samples is underway.
Only in the two low-grade oligodendrogliomas (pa-tients 6 and 13, Fig 5) was there no sign of ferumox-tran penetration into the tumor despite the evidenceof BBB breakdown by gadolinium enhancement. Thehamartoma (patient 7) had only slight ferumoxtran
enhancement compared with the more prominentgadolinium enhancement, and this faint ferumoxtranenhancement occurred in the gadolinium-enhancingareas. The difference between gadolinium and feru-moxtran enhancement in these low-grade gliomas(patients 6, 7, and 13) may be the result of the above-described possible mechanisms.
The meningioma (patient 12, Fig 4) demonstratedvariable ferumoxtran enhancement despite promi-nent gadolinium enhancement. This could suggesteither variable vascular endothelium barrier muchmore permeable to the gadolinium chelate than to thelarger ferumoxtran, except in its central portion, orthe lack of parenchymal cells capable of trappingferumoxtran. In patient 14, the anaplastic gliomashowed just scattered areas of ferumoxtran enhance-ment within the more homogeneously gadolinium-enhancing tumor. These two cases, in which the pa-tients underwent radiation therapy, suggest that priorradiation may have had an effect on the vascularendothelium, causing endothelial proliferation, andthereby impeded ferumoxtran penetration (28). Alarge pituitary tumor (patient 18) also showed onlymodest ferumoxtran enhancement despite excellentgadolinium enhancement, which may be primarily areflection of only a few cells capable of taking up theiron within the tumor.
The presence of ferumoxtran enhancement in re-gions of no gadolinium enhancement (patients 9, 17,and 20) may suggest a separate mechanism of passingacross the BBB than the intercellular junctions. Pa-tient 20 with anaplastic oligodendroglioma showedsignificantly increased T1 and decreased T2 signalintensities in the brain around enhancing tumor,where gadolinium enhancement could not be ob-served at all. Although the time interval between thetwo images was 26 days and there was mild intervalprogression both in size of the solid tumor and masseffect, this ferumoxtran enhancement occurredclearly in areas of increased T2 signal intensity in thewhite matter, where 26 days before no gadoliniumenhancement was seen. However, the solid tumordemonstrated less ferumoxtran enhancement thangadolinium enhancement. Ferumoxtran does notcross the intact BBB even in much higher doses withintraarterial administration (15). Three possibilitiesor a combination thereof may account for this phe-nomenon. First, an accumulation mechanism may ex-ist for ferumoxtran but not for gadolinium. Second,ferumoxtran may extend from gadolinium-enhancingto non–gadolinium-enhancing regions by means ofdiffusion (less likely), convection, and/or intracellulartransport (more likely) (15). Third, ferumoxtran maycross the endothelium by a distinct mechanism otherthan the intercellular junctions in these regions. An-imal studies and/or larger patient series will beneeded to address this issue.
The other previously mentioned finding that re-quires further evaluation is the intensive peripheralferumoxtran accumulation rather than accumulationin the center of tumor. In assessing invasive breastcancer, Harms et al (29) also reported the accumula-
AJNR: 23, April 2002 USPIO PARTICLES VERSUS GADOLINIUM 517
tion of ferumoxtran primarily in the reactive cells atthe tumor–normal tissue interface at histologic andMR imaging examinations of the breast as we did atour histologic and MR imaging examinations of brain(Fig 3).
In all of the ferumoxtran-enhanced tumors, thetumor margins were sharp without detectable differ-ence in sharpness on the 6- or 24-hour ferumoxtran-enhanced images. This observation is in agreementwith the study of Enochs et al (17). Both the gado-linium chelate and USPIO particles can extravasateand accumulate in the tumoral interstitium; however,the gadolinium chelate will diffuse over time into thesurrounding brain to a much greater degree than willferumoxtran, presumably owing to the larger size,decreased diffusion coefficient, and cellular uptake offerumoxtran. Long-lasting as well as better delinea-tion of the tumor with ferumoxtran, in contrast to thegadolinium chelate, raises the possibility of the appli-cation of this iron oxide particle for preoperative andintraoperative surgical planning and postoperative as-sessment of surgical resection. Indeed, it is intriguingthat in an animal model by Knauth et al (30), intra-venously administered monocrystalline iron oxidenanoparticles (MION) did not cause high signal in-tensity on T1-weighted images in the normal or thepostoperative brain after superficial electrocoagula-tion or deep ablation, which is a problem with gado-linium chelates. Gadolinium enhancement caused bysurgical BBB damage makes it difficult to correctlydifferentiate between residual tumor and postopera-tive enhancement. This difference may make feru-moxtran especially useful for intraoperative or post-operative MR imaging to assess the degree ofresection.
Finally, virus-mediated gene therapy is a promisingtreatment for brain tumors. Delivery of viruses acrossthe BBB to the tumor and brain around the tumor isone of the major obstacles; however, direct interstitialinstillation and systemic infusion with BBB disruptionhave been proposed (15). Preclinical studies have beencarried out with MION, which is the preclinical gradepreparation of ferumoxtran. According to the results ofstudies with the co-injection of adenovirus and MION(with BBB disruption or intracerebral inoculation), itappears that the volume of distribution is very similar(31). Intracellular MION has already been detectedin rodent neurons and pericytes by electron micros-copy after intraarterial administration, with BBB dis-ruption (15, 16). Similarly, intracellular adenovirushas been demonstrated by immunostaining for trans-genic protein expression after intraarterial adminis-tration, with BBB disruption (31). The current studyshowed that intravenously administered viral-sizedUSPIO particles do accumulate in tumors, and theywere demonstrated histologically in the tumor and inthe tumor-brain interface both intracellularly and in-terstitially (Fig 3G and H). Because the size of theUSPIO particles is similar to the size of small virusesand both USPIO and adenovirus have been demon-strated intracellularly, these iron oxide particles may
serve as an important model to evaluate potentialtransvascular as well as interstitial vector delivery.
ConclusionWe showed that ferumoxtran, in contrast to feru-
moxides, can be used as an intravenous contrast agentfor MR imaging of intracranial tumors; however, itsutility in brain tumor imaging needs further study.Enhancement with ferumoxtran was comparable tobut more variable than that with the gadolinium che-late, and previous radiation therapy may have aneffect on ferumoxtran accumulation. All of the ma-lignant tumors showed ferumoxtran enhancement,but more studies are needed to determine the degreeof ferumoxtran accumulation in low-grade gliomas.For intraaxial tumors, ferumoxtran enhancementseems to be dependent on both the degree of BBBincompetency and the number of parenchymal cellswithin and around the tumor able to trap it. Forextra-axial tumors, which do not have a BBB, feru-moxtran accumulation (enhancement) may mainlydepend on the presence of parenchymal cells capableof taking up the iron particles, though altered vascu-lar endothelium secondary to radiation therapy mayalso be a factor. Histologic examination showed sim-ilar distribution of the ferumoxtran particles as seenon MR images, that is, primarily at the tumor margin,with less central localization. Also, the intratumoraldemonstration of ferumoxtran after intravenous ad-ministration may enable this iron oxide particle to beused as a marker for viral vector delivery in malignantbrain tumors. The changes of increase in signal inten-sity on the 24-hour ferumoxtran-enhanced imagescompared with that of the 6-hour images better de-lineate iron accumulation and decrease the blood-pool effect, although extending that to 48 or 72 hours(two or three half-lives) may further increase thiseffect. As expected, the most striking signal intensitychanges could be observed on the SE T1- and GRET2*-weighted images, suggesting these sequencesmight be the best to evaluate iron accumulation. Inaddition, ferumoxtran signal intensity changes thatpersist for at least 24 hours may render advantagesover gadolinium enhancement for intraoperative MRimaging as well as postoperative assessment of surgi-cal resection.
AcknowledgmentFerumoxtran-10 (Combidex) was kindly provided by Ad-
vanced Magnetics, Cambridge, MA.
References1. Hagspiel KD, Neidl KFW, Eichenberger AC, et al. Detection of
liver metastasis: comparison of superparamagnetic iron oxide-enhanced and unenhanced MR imaging at 1.5 T with dynamic CT,intraoperative US, and percutaneous US. Radiology 1995;196:471–478
2. Reimer P, Tombach B. Hepatic MR with SPIO: detection andcharacterization of focal liver lesions. Eur Radiol 1998;8:1198–1204
3. Mergo PJ, Engelken JD, Helmberger T, Ros PR. MRI in focal liverdisease: a comparison of small and ultra-small superparamagnetic
518 VARALLYAY AJNR: 23, April 2002
iron oxide as hepatic contrast agents. J Magn Reson Imaging 1998;8:1073–1078
4. Saini S, Sharma R, Baron RL, et al. Multicenter dose-ranging studyon the efficacy of USPIO ferumoxtran-10 for liver MR imaging.Clin Radiol 2000;55:690–695
5. Weissleder R, Hahn PF, Stark DD, et al. Superparamagnetic ironoxide: enhanced detection of focal splenic tumors with MR imag-ing. Radiology 1998;169:399–403
6. Harisinghani MG, Saini S, Slater GJ, et al. MR imaging of pelviclymph nodes in primary pelvic carcinoma with ultrasmall super-paramagnetic iron oxide (Combidex): preliminary observations.J Magn Reson Imaging 1997;7:161–163
7. Nguyen BC, Stanford W, Thompson BH, et al. Multicenter clinicaltrial of ultrasmall superparamagnetic iron oxide in the evalution ofmediastinal lymph nodes in patients with primary lung carcinoma.J Magn Reson Imaging 1999;10:468–473
8. Hoffman HT, Quets J, Toshiaki T, et al. Functional magneticresonance imaging using iron oxide particles in characterizinghead and neck adenopathy. Laryngoscope 2000;110:1425–1430
9. Taylor AM, Panting JR, Keegan J, et al. Safety and preliminaryfindings with the intravascular contrast agent NC100150 injectionfor MR coronary angiography. J Magn Reson Imaging 1999;9:220–227
10. Anzai Y, Prince MR, Chenevert TL, et al. MR angiography with anultrasmall superparamagnetic iron oxide blood pool agent. J MagnReson Imaging 1997;7:209–214
11. Bonnemain B. Superparamegetic agents in magnetic resonanceimaging: physicochemical characterisitics and clinical applica-tions: a review. J Drug Target 1998;6:167–174
12. Xu S, Jordan Ek, Brocke S, et al. Study of relapsing remittingexperimental allergic encephalomyelitis SJL mouse model usingMION-46L enhanced in vivo MRI: early histopathological corre-lation. J Neurosci Res 1998;52:549–558
13. Dousset V, Delalande C, Ballarino L, et al. In vivo macrophageactivity imaging in the central nervous system detected by magneticresonance. Magn Reson Med 1999;41:329–333
14. Dousset V, Ballarino L, Delalande C, et al. Comparison of ultras-mall particles of iron oxide (USPIO)-enhanced T2-weighted, con-ventional T2-weighted, and gadolinium-enhanced T1-weighted MRimages in rats with experimental autoimmmune encephalomyelitis.AJNR Am J Neuroradiol 1999;20:223–227
15. Neuwelt EA, Weissleder R, Nilaver G, et al. Delivery of virus-sizediron-oxide particles to rodent CNS neurons. Neurosurgery 1994;34:777–784
16. Muldoon LL, Pagel MA, Kroll RA, Roman-Goldstein S, Jones RS,Neuwelt EA. A physiological barrier distal to the anatomic blood-brain barrier in a model of transvascular delivery. AJNR Am JNeuroradiol 1999;20:217–222
17. Enochs WS, Harsh G, Hochberg F, Weissleder R. Improved delin-eation of human brain tumors on MR images using a long-circu-lating, superparamagnetic iron oxide agent. J Magn Reson Imaging1999;9:228–232
18. Egelhof T, Delbeck N, Hartmann M, et al. Can superparamagneticcontrast media improve MRI-tomographic images of experimentalgliomas? Radiologe 1998;38:943–947
19. Zimmer C, Weissleder R, Poss K, Bogdanova A, Wright SC Jr,Enochs WS. MR imaging of phagocytosis in experimental gliomas.Radiology 1995;197:533–538
20. Moore A, Marecos E, Bogdanov A Jr, Weissleder R. Tumoraldistribution of long-circulating dextran-coated iron oxide nanopar-ticles in a rodent model. Radiology 2000;214:568–574
21. Weissleder R, Cheng HC, Bogdanova A, Bogdanov A Jr. Magnet-ically labeled cells can be detected by MR imaging. J Magn ResonImaging 1997;7:258–263
22. Kroll RA, Pagel MA, Muldoon LL, Neuwelt EA. Increasing vol-ume of distribution to brain with interstitial infusion: dose, ratherthan convection, may be the most important factor. Neurosurgery1996;38:746–754
23. Remsen LG, McCormick CI, Roman-Goldstein S, et al. MR ofcarcinoma-specific monoclonal antibody conjugated to monocrys-talline iron oxide nanoparticles: the potential for noninvasive di-agnosis. AJNR Am J Neuroradiol 1996;17:411–418
24. Jung C, Jacobs P. Physical and chemical properties of superpara-magnetic iron oxide MR contrast agents: ferumoxides, ferumox-tran, ferumoxsil. Magn Reson Imaging 1995;13:661–674
25. Kroll RA, Neuwelt EA. Outwitting the blood-brain barrier fortherapeutic purposes: osmotic opening and other means. Neurosur-gery 1998;42:1083–1100
26. Kraemer DF, Fortin D, Doolittle ND, Neuwelt EA. Association oftotal dose intensity of chemotherapy in primary CNS lymphoma(human non-AIDS) and survival. Neurosurgery 2001;48:1033–1041
27. Barnett PA, Roman-Goldstein S, Ramsey F, et al. Differentialpermeability and quantitative MR imaging of a human lung car-cinoma brain xenograft in the nude rat. Am J Path 1995;146:436–449
28. Remsen LG, McCormick CI, Sexton G, et al. Long-term toxicityand neuropathology associated with the sequencing of cranial ir-radiation and enhanced chemotherapy delivery. Neurosurgery 1997;40:1034–1042
29. Harms SE, Hinton T, Manning L, Korourian S. New MRI contrastagent for labeling of tumor-associated macrophages that stimulatetumor angiogenesis (abstr). In: Proceedings of the Eighth Meeting ofthe International Society for Magnetic Resonance in Medicine 2000.Berkeley, Calif: International Society for Magnetic Resonance inMedicine, 2000;616
30. Knauth M, Egelhof T, Roth SU, Wirtz CR, Sartor K. Monocrys-talline iron oxide nanoparticles: possible solution to the problem ofsurgically induced intracranial contrast enhancement in intraop-erative MR imaging. AJNR Am J Neuroradiol 2001;22:99–102
31. Muldoon LL, Nilaver G, Kroll RA, et al. Comparison of intracer-bral inoculation and osmotic blood-brain barrier disruption fordelivery of adenovirus, herpesvirus and iron oxide particles tonormal rat brain. Am J Pathol 1995;147:1840–1851
AJNR: 23, April 2002 USPIO PARTICLES VERSUS GADOLINIUM 519