
Comparison of the Pharmacological Profiles of Murine ... Comparison of the Pharmacological Profiles...
29
1 Comparison of the Pharmacological Profiles of Murine Antisense Oligonucleotides Targeting Apolipoprotein B and Microsomal Triglyceride Transfer Protein Richard G. Lee, Wuxia Fu, Mark J. Graham, Adam E. Mullick, Donna Sipe, Danielle Gattis, Thomas A. Bell, Sheri Booten, and Rosanne M. Crooke From Cardiovascular Antisense Drug Discovery Group, Isis Pharmaceuticals Carlsbad, CA 92010 Short title: Comparison of Antisense Suppression of ApoB and MTP Address correspondence to: Richard Lee, PhD, 2855 Gazelle Ct, Carlsbad, CA 92010 Fax: 760-603-2600 Email: [email protected] Abbreviated title: ApoB vs MTP ASO Suppression in Mice Abbreviations: MTP, microsomal triglyceride transfer protein; ALT, alanine aminotransferase; AST, aspartate aminotransferase; CE, cholesteryl ester; FC, free cholesterol; ASO, antisense oligonucleotide; TG, triglyceride; FSP27, fat soluble protein 27; ACC1, acetyl-coA carboxylase 1; SREBP1c, sterol regulatory binding protein 1c; PPAR, peroxisome proliferator activated receptor by guest, on June 25, 2018 www.jlr.org Downloaded from
Transcript of Comparison of the Pharmacological Profiles of Murine ... Comparison of the Pharmacological Profiles...

1
Comparison of the Pharmacological Profiles of Murine Antisense Oligonucleotides Targeting Apolipoprotein B and Microsomal Triglyceride
Transfer Protein
Richard G. Lee, Wuxia Fu, Mark J. Graham, Adam E. Mullick, Donna Sipe, Danielle Gattis, Thomas A. Bell, Sheri Booten, and Rosanne M. Crooke
From Cardiovascular Antisense Drug Discovery Group, Isis Pharmaceuticals Carlsbad, CA 92010
Short title: Comparison of Antisense Suppression of ApoB and MTP
Address correspondence to: Richard Lee, PhD, 2855 Gazelle Ct, Carlsbad, CA 92010 Fax: 760-603-2600 Email: [email protected] Abbreviated title: ApoB vs MTP ASO Suppression in Mice Abbreviations: MTP, microsomal triglyceride transfer protein; ALT, alanine aminotransferase; AST, aspartate aminotransferase; CE, cholesteryl ester; FC, free cholesterol; ASO, antisense oligonucleotide; TG, triglyceride; FSP27, fat soluble protein 27; ACC1, acetyl-coA carboxylase 1; SREBP1c, sterol
regulatory binding protein 1c; PPAR, peroxisome proliferator activated receptor
by guest, on June 25, 2018w
ww
.jlr.orgD
ownloaded from

2
Abstract
Therapeutic agents that suppress apolipoprotein B (apoB) and microsomal triglyceride transfer protein (MTP) levels/activity are being developed in the clinic to benefit patients who are unable to reach target LDL-C levels with maximally tolerated lipid-lowering drugs. In order to compare and contrast the metabolic consequences of reducing these targets, murine-specific apoB or MTP antisense oligonucleotides (ASOs) were administered to chow and high fat fed C57BL/6, or chow and western diet fed LDLr -/- mice for periods ranging from two to twelve weeks and detailed analyses of various factors affecting fatty acid metabolism were performed. Administration of these drugs significantly reduced both target hepatic mRNA and protein leading to similar reductions in hepatic VLDL/triglyceride secretion. MTP ASO treatment consistently led to increases in both hepatic triglyceride accumulation
and biomarkers of hepatotoxicity relative to apoB ASO due in part to enhanced expression of PPAR target genes and the inability to reduce hepatic fatty acid synthesis. Thus, while both drugs effectively lowered LDL-C levels in mice, the apoB ASO produced a more positive liver safety profile. Keywords: Apolipoprotein B, microsomal triglyceride transfer protein, dyslipidemia, steatosis, lipoprotein metabolism, lipid droplets, familial hypercholesterolemia
by guest, on June 25, 2018w
ww
.jlr.orgD
ownloaded from

3
Introduction
Coronary heart disease (CHD) is the leading cause of death in the United States (1). While multiple risk factors associated with this disease process are being extensively investigated, it is well established that lowering plasma low density lipoprotein cholesterol (LDL-C) reduces cardiovascular risk events (2). Currently, the most effective therapeutic agents for the treatment of elevated LDL-C levels and, ultimately, CHD are the statins (3). While these drugs have proven to be potent and efficacious, a significant percentage of high risk patients are unable to attain their ATP-III recommended LDL-C goals for several reasons including ineffectiveness or intolerance to statins, either alone, or in combination with other dyslipidemia agents (4,5). These factors have led to a continued search for new drugs with unique mechanisms of action that lower plasma LDL-C levels.
Two proteins involved in the formation of apoB-containing lipoprotein particles that have
recently received considerable attention as potential therapeutic targets are apolipoprotein B (apoB) and microsomal triglyceride transfer protein (MTP)(6-8). Both are essential for the assembly and secretion of the apoB-containing lipoproteins, i.e. very low density lipoproteins (VLDL) synthesized in the liver and chylomicrons produced by enterocytes of the small intestine. In the liver, apoB100 is the main structural protein component of VLDL and LDL particles.
Extensive biochemical studies indicate that apoB protein is primarily regulated at the post-
transcriptional level (9). Initially, nascent apoB protein is transferred through the ER membrane and into the ER lumen. In the absence of sufficient lipid or functional MTP, apoB fails to be lipidated and undergoes retrograde translocation into the cytosol, where it is ubiquitinated and degraded. However, in the presence of sufficient lipid, apoB is lipidated in an MTP-dependent, two-step process, leading to the formation and secretion of a mature VLDL particle (10). VLDL then enters the circulation and is acted upon by both lipolytic and lipid transfer enzymes that convert TG rich VLDL into cholesteryl ester (CE)-rich LDL particles. Therefore, reduction of apoB and/or MTP lowers LDL levels by decreasing the number of particles secreted into the circulation. In contrast, statins lower LDL-C principally by enhancement of LDL receptor-mediated clearance of LDL particles from the circulation (3).
Pharmacological suppression of hepatic apoB production via antisense oligonucleotide (ASO) treatment has also led to reductions in VLDL-C and LDL-C and the amelioration of atherosclerosis in murine preclinical models (11,12). Further, while a murine-specific apoB ASO reduced apoB production and secretion from the liver, hepatic steatosis and elevation of transaminases were not observed in these mice (11). In high fat fed mice administered the apoB ASO, liver triglyceride (TG) accumulation was shown to be reduced as a result of secondary, compensatory mechanisms that lead to reduced lipogenesis and increased fatty acid oxidation. Additionally, there were no effects on dietary fat absorption, chylomicron formation or increases in intestinal TG accumulation due to limited ASO distribution to the small intestine.
Given the importance of MTP to VLDL production, we also wished to evaluate the effects of an
inhibitor of MTP in DIO and LDLr -/- mice. However, experiments directly comparing the therapeutic reduction of apoB and MTP have not been possible because apoB is not targetable by small molecule approaches. Therefore, to perform such studies, we designed an ASO to murine MTP and directly compared its activity to that of an apoB antisense drug, ISIS 147764 (11), in preclinical pharmacology models.
by guest, on June 25, 2018w
ww
.jlr.orgD
ownloaded from

4
Materials and Methods Antisense Oligonucleotides- A series of uniform chimeric 20-mer phosphorothioate oligonucleotides containing 2’-O-methoxyethyl (2’ MOE) groups at positions 1–5 and 15–20 targeted to murine apoB, MTP, and a control ASO were synthesized and purified on an automated DNA synthesizer using phosphoramidite chemistry as previously described (13). The sequences evaluated were as follows: apoB ASO-ISIS 147764 (5’-GTCCCTGAAGATGTCAATGC-3’), MTP ASO-ISIS 144477 (5’-CCCAGCACCTGGTTTGCCGT-3’), and one of two control ASOs-ASO 1 (5’- AGCATAGTTAACGAGCTCCC-3’), or ASO 2 (5’ – AGCATAGTTAACGAGCTCCC – 3’), with underlining indicating 2’MOE modified bases. Mice- Six week old male C57BL/6 or LDLr -/- (Jackson Laboratory) mice were housed 3-5 to a cage on a 12-hour light-dark cycle for the duration of the studies. All procedures and protocols were approved by an institutional animal care and use committee. C57BL/6 mice were fed either chow or a high fat (60% calories as fat, Research Diets D12492) diet (DIO model), for three weeks. Following the diet acclimation period, mice were randomized based on TPC and non-HDL-C and then administered assigned ASOs in saline (5 mg/ml) by intraperitoneal injection at a dose of 25, 12.5, or 6.25 mg/kg twice weekly for either two or six weeks. LDLr -/- mice were fed either a standard chow diet or a Western Diet (Harland Teklad Diet 88137) consisting of 42% of calories as fat and 0.15% cholesterol for 1 week. The mice were then bled, randomized based on TPC and non-HDL-C, and administered either control ASO (50 mg/kg/wk), apoB ASO (50 mg/kg/wk), or MTP ASO (50 mg/kg/wk) for periods ranging from two to twelve weeks while remaining on diet. For twelve week studies, mice received intraperitoneal injections of ASO once weekly for 6 weeks and then once every other week for the remainder of the study. Body weight was monitored throughout the study, with no significant differences between control and treated mice observed in any of the studies. At the end of treatment period, animals were fasted for four hours and sacrificed for blood and tissue analysis. Plasma Chemistry and Lipoprotein Cholesterol Analysis- Plasma lipids and aminotransferase concentrations were quantified on an Olympus AU400e automated clinical chemistry analyzer (Melville, NY). HPLC analysis of LDLr -/- mice cholesterol distribution amongst VLDL-C, LDL-C, and high density lipoprotein (HDL-C) fractions was performed as described previously. Percent area under curve VLDL-C, LDL-C, and HDL-C was determined using Peakfit™ v 4.12 (Seasolve Software®, Framingham MA) and then multiplied by TPC to determine VLDL-C, LDL-C, and HDL-C, respectively. Histology- Oil Red O staining on sections of snap-frozen liver and intestinal samples were performed as
described (14). For quantitation of lipid droplets, digital 10X (1,700 x 1,100 m) images (four images per treatment group, with each image taken from a different mouse) of Oil Red O stained sections were analyzed with the ChromaColor™ software to identify all ORO stained droplets. Those densitometric images were then were quantified using Image Pro Plus™ software, which sorted the droplets into one
of four sizes: 5-50 m2, 51-100 m2, 101-1000 m2, or >1000 m2, with the largest size class considered to be an artifact of the staining procedure. Western Blotting- Liver homogenates were prepared and immunoblotted as described. Glyceraldehyde-3-phosphate dehydrogenase (GAPDH) or tubulin was used as a protein loading control for all blots. For the quantitation of hepatic proteins, two samples from each treatment group were run on two separate blots (n=4 samples/treatment). Western blots were visualized and band density was analyzed using the LI-COR Odyssey™ imaging system. Fluorescence of the bands of interest were normalized to load controls and expressed as mean fold change relative to control ASO. For small intestine, a single blot was analyzed (n=2 samples/treatment).
by guest, on June 25, 2018w
ww
.jlr.orgD
ownloaded from

5
Tissue Lipid Composition- Liver TG, free cholesterol, and total cholesterol were extracted and analyzed as described previously (15). Intestinal lipid was quantitated after fasting the mice for 4-5 hours. Mice were then sacrificed and the small intestine, from the pyloric valve to the caecum, was collected and divided into three equal pieces. The luminal contents were flushed with PBS from the proximal section and each section was cut longitudinally with scissors, flattened, and the mucosal layer was scraped off with a glass slide. An aliquot of the cells was suspended in PBS. One-fifth of the suspension was brought to 1N NaOH for protein determination by the Lowry method, while three-fifths of the lipid was extracted by the Bligh-Dyer method described previously. The extract was solubilized with 2% Triton X -100 in dH2O and lipids were quantified using colorimetric assays as described for the liver lipid extraction. MTP Activity Assay- Aliquots of livers isolated from DIO mice treated with ASO for six weeks were snap frozen and sent to Chylos® Inc., (New York, NY), where MTP activity was quantitated as described previously (16). Quantitation of TG and cholesterol absorption- DIO mice administered ASO for 6 weeks were fasted overnight and then received an intraperitoneal injection of poloxamer 407 at a dose of 1 mg/g body weight. One hour after injection, a baseline retro-orbital bleed was collected and the mice were orally
gavaged with 2.5 Ci of 3H triolein in 200 l of olive oil. Animals were then bled 90 and 180 min post
gavage, and counts per minute (cpm) values were quantified from 20 l of serum by liquid scintillation counting (Beckman® LSC Instrument). Cholesterol absorption in DIO mice treated with ASO for six weeks was quantitated using the dual fecal isotope method as described previously (17). Hepatic ApoB and TG secretion- Hepatic and apoB secretion was carried out as previously described (18). Analysis of hepatic fatty acid synthesis- Quantitation of hepatic fatty acid synthesis was carried out using the tritiated water method described previously (19). Quantitative Real-Time (RT) PCR- RT-PCR was performed as described (11). Sequences of the primer probe sets used are provided in Supplemental Table 1. All data were normalized to cyclophilin A mRNA levels and were expressed as percent of hepatic mRNA expression in control ASO treated mice. Statistical analysis- The majority of pharmacology experiments were performed in at least two independently performed studies with groups of four to twelve animals. All values are expressed as mean ± SEM. To determine statistical significance, one- and two-way ANOVA analysis with Tukey’s post hoc test was carried out using GraphPad Prism 5™ software with statistical significance being set at p<0.05.
by guest, on June 25, 2018w
ww
.jlr.orgD
ownloaded from

6
Results
Second generation ASOs targeting either murine apoB (ISIS 147764), whose pharmacology has been described in detail in two previous manuscripts (11,12), or MTP (ISIS 144477), which, in primary mouse hepatocytes reduced MTP mRNA in a dose dependent manner (Supplemental Figure 1), were used for all studies. In order to compare the pharmacological effects of apoB and MTP ASOs on safety, efficacy, and hepatic steatotic progression, three mouse models were used. Initially ASOs were administered to chow fed C57BL/6 mice twice weekly (12.5-50 mg/kg/wk) for either two or six weeks in order to assess their efficacy and tolerability. To further investigate effects on liver TG accumulation between apoB and MTP ASO treatment, the two compounds were administered to DIO mice, a model of hepatic steatosis, for either two or six weeks. Finally, because the severe familial hypercholesterolemia patient population is the primary indication for both apoB and MTP drugs, male LDLr-/- mice were fed either chow or Western diets and administered ASOs at 50 mg/kg/wk for six weeks.
In all three mouse models, ASO administration led to significant, dose dependent suppression of
hepatic target mRNA expression, reaching 70-90% reduction when compared to control ASO treated animals at the high dose after six weeks of treatment (Figure 1). Consistent with the mRNA data, DIO and LDLr -/- mice treated with the apoB ASO demonstrated reductions in hepatic target protein levels when compared to control ASO treatment (Figure 2). The MTP ASO treated DIO and LDLr -/- reductions in hepatic target protein were also consistent with the degree of hepatic MTP mRNA suppression. Furthermore measurement of hepatic MTP activity in DIO mice after six weeks of MTP ASO treatment showed that the reduction in activity (-71%) was consistent with both the hepatic MTP mRNA and total protein reductions (Figure 2C). Administration of the apoB ASO significantly increased MTP activity by 25% when compared to control.
As expected, reduction of hepatic apoB and MTP led to significant reductions in TPC in the DIO
mice and LDLr -/- mice fed chow or Western diet (Tables 1 & 2). In DIO mice (Table 1), the reductions in TPC were due to reductions in both non-HDL-C and HDL-C, a plasma lipid profile that is similar to that observed in ApoB +/- or MTP +/- mice (20,21). In addition, neither apoB nor MTP ASO had any effect on plasma TG, which was not surprising given the relatively low plasma TG levels of this model. However, both apoB and MTP ASO treatment significantly decreased plasma TG in Western diet fed LDLr -/- mice by -69% and -75% respectively (Table 2). More detailed evaluation of plasma samples taken from apoB and MTP ASO treated LDLr-/- mice indicated that the TPC and plasma TG reductions were primarily due to decreases in apoB-containing lipoproteins, however there was a significant decrease (-30%) in HDL-C in the chow fed LDLr -/- mice (Table 2). For VLDL, similar reductions were observed for both apoB ASO (-58% for chow, -82% for Western diet) and MTP ASO (-71% for chow, -85% for Western diet) treatment. However, LDL-C was reduced to a greater extent by apoB ASO (-61% for chow, -73% for Western diet) versus MTP ASO (-40% for chow, -42% for Western diet) administration. Therefore, in DIO and LDLr -/- mouse models, 6 weeks of treatment with the apoB or MTP ASOs led to significant reductions in hepatic apoB or MTP protein that in turn led to decreased plasma TPC and, in a severely hyperlipidemic model, decreased plasma TG.
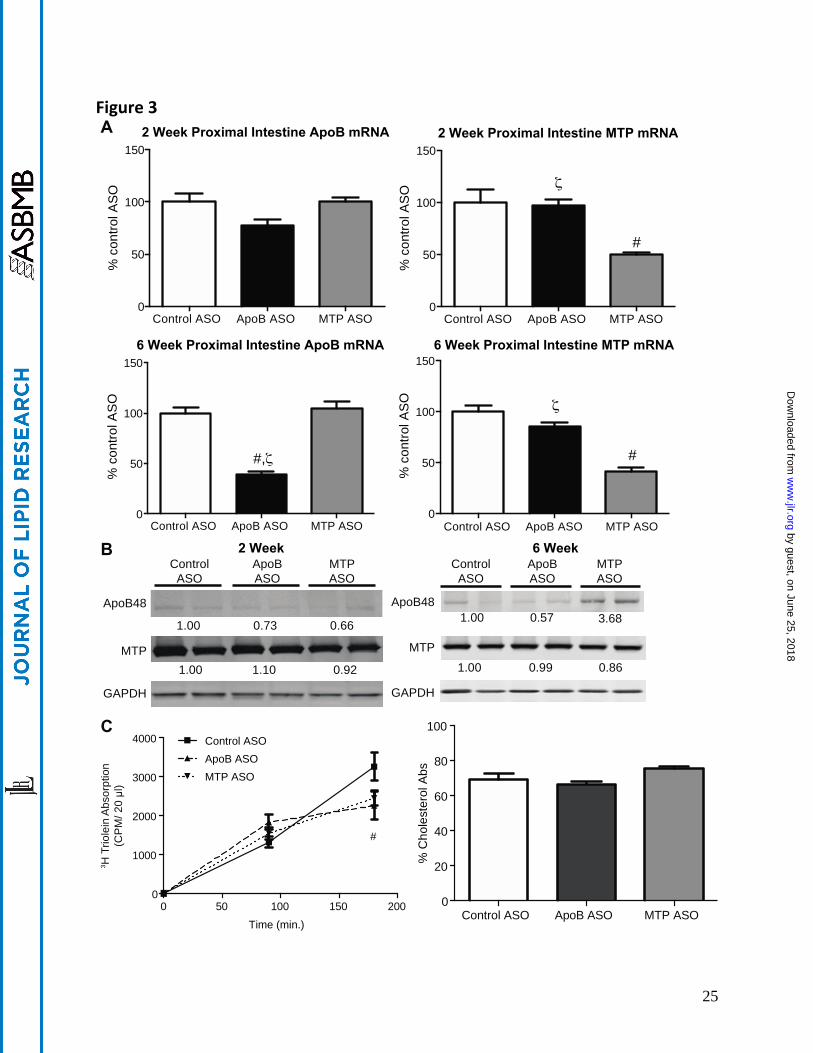
Suppression of intestinal expression of either apoB or MTP can reduce lipid absorption and
potentially lower plasma lipid levels by impairing intestinal secretion of apoB48 containing chylomicron particles. To determine if the amelioration of dyslipidemia observed with ASO treatment was due to alterations in intestinal metabolism, lipid absorption (Figure 3) was quantified. Dietary food intake and animal body weights were unaffected by either apoB or MTP ASO treatment, nor was there evidence of steatorrhea/loose stools (data not shown). Proximal intestinal apoB mRNA expression was unchanged
by guest, on June 25, 2018w
ww
.jlr.orgD
ownloaded from

7
after two weeks of apoB ASO treatment, but was significantly reduced by 62% after six weeks (Figure 3A). Intestinal apoB48 protein also appeared to be reduced, albeit more modestly than the apoB mRNA expression, with 6 weeks of ASO treatment (Figure 3B). However, due to the weak and variable apoB48 protein bands, it is difficult to draw a distinct conclusion from the western blot results. After two and six weeks of treatment, the MTP ASO led to significant reductions of -50% and -59% in proximal SI MTP mRNA expression, respectively. Unlike the apoB ASO, the MTP ASO had little to no effect on intestinal MTP protein expression, and increased apoB48 protein expression. The reduced efficacy of the ASOs relative to liver was expected based on the observation in previous studies of limited distribution of ASO (22) to the intestine.
To determine if the reduction of intestinal apoB and MTP led to physiologic effects on lipid and
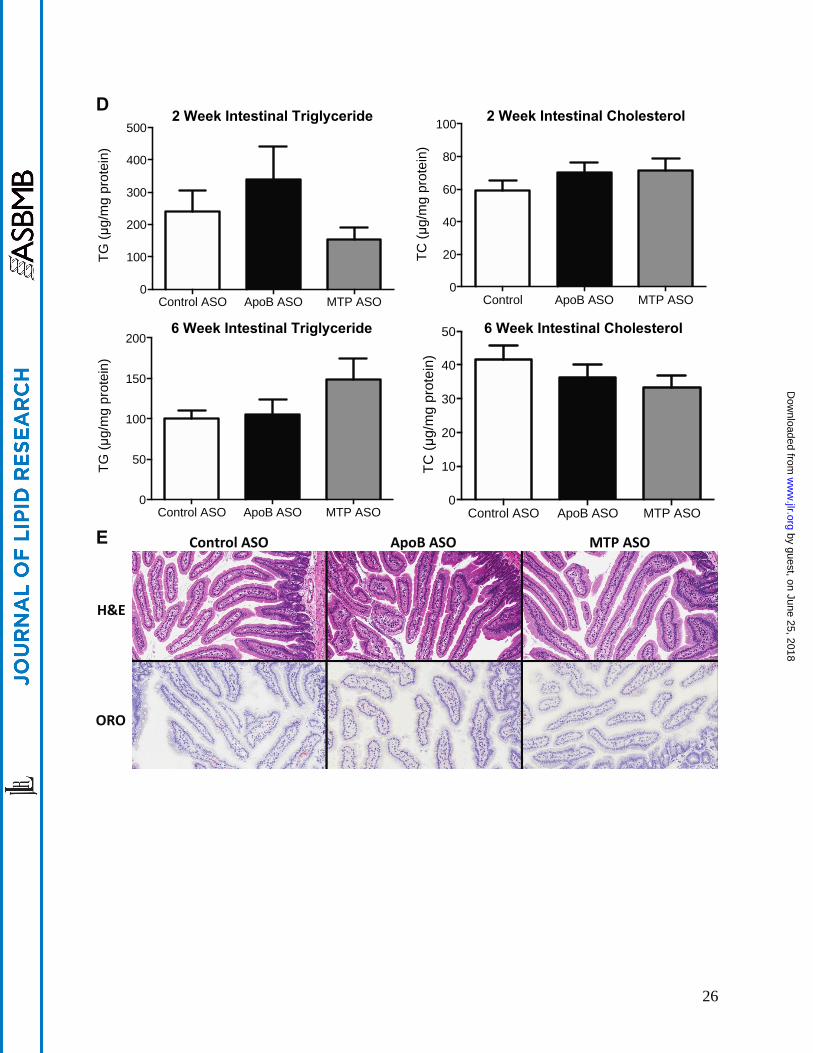
sterol absorption, we measured TG and cholesterol absorption in DIO mice treated with ASOs for six weeks (Figure 3C). Poloxamer 407 treated mice were administered a tritiated triolein gavage and appearance of radioactivity was quantitated over a 3 hour period. It was observed that apoB ASO treated animals had a modest, but significantly reduced, secretion of tritiated triolein into the plasma (-30%) at the three hour time point when compared to control ASO. The MTP ASO also showed a non-significant tendency (-25%), to reduce tritiated triolein when compared to the control ASO. Neither compound demonstrated a significant effect on cholesterol absorption as measured by the dual fecal isotope method. Proximal intestine histology and lipid content were also analyzed. Consistent with minimal effects on total lipid absorption, there were no significant changes in TG or total cholesterol concentrations when quantitated and compared to the control ASO treated mice (Figure 3D), nor were there observable increases in neutral lipid accumulation detected using H&E and ORO staining methods(Figure 3E).
It should be noted that in two previous publications (11, 12), no reductions were observed in
intestinal apoB48 protein levels, nor were there any effects on lipid absorption observed following extended administration of the apoB ASO in the DIO and LDLr-/- mice used in those experiments. However, in this most recent study, a modest, but significant reduction in apoB48 levels was noted. Nonetheless, the apparent reduction in apoB48 protein levels did not produce either increased intestinal lipid deposition or reduced cholesterol/TG absorption. This variation in the protein modulation may be attributed to differences in mouse progeny, dietary constituents, experimental protocols or test reagents in studies performed over the last decade.
After demonstration that both the apoB and MTP ASO were sufficiently efficacious, we evaluated the safety profile of the two ASOs using a number of parameters (Tables 1-3). Liver TG and CE concentrations were evaluated in chow fed C57BL/6, DIO and LDLr-/- mice. In chow fed C57BL/6 mice, hepatic TG levels (Table 3) were only increased by the MTP ASO at six weeks. Liver CE concentrations, however, were significantly increased in apoB ASO treated animals after two weeks and in both apoB and MTP ASO treated animals after six weeks. Hepatic free cholesterol concentrations were similar between all groups at both time points (data not shown). Despite these differences in liver TG accumulation, administration of either apoB or MTP ASO to chow fed mice did not lead to changes in either body weight progression or hepatic transaminases (data not shown) indicating that in the absence of a dietary challenge, both apoB and MTP ASO were well tolerated.
A markedly different safety profile was observed in the face of a dietary challenge. Two weeks of
high dose (50 mg/kg/wk) apoB or MTP ASO treatment in DIO mice led to a significant 3.3-fold elevation in liver TG when compared to controls (Table 3). However after six week apoB ASO administration, hepatic TG concentrations were relatively unchanged from those levels observed after two weeks. In
by guest, on June 25, 2018w
ww
.jlr.orgD
ownloaded from

8
contrast, six weeks treatment with the MTP ASO resulted in a further 3.2-fold increase in liver TG relative to the two week treatment values. Similar to chow fed mice, DIO mice treated with MTP and apoB ASO showed significant increases in hepatic CE after both two and six weeks. As in the chow fed animals, liver free cholesterol was similar in all groups (data not shown). Analysis of hepatic transaminases revealed that, unlike observations made in chow fed mice, two week high dose MTP ASO treatment significantly increased ALT and AST by 7.4-fold and 3.1-fold, respectively, when compared to control. Similarly, six week high dose MTP ASO treatment in DIO mice significantly increased both plasma ALT and plasma AST by 8.5-fold and 2.4-fold, respectively, when compared to control (Table 1). In contrast, both two week and six week high dose apoB ASO treatment led to a non-significant increase in ALT levels of 2.1 and 1.5 fold, respectively, with no change in AST. Finally, DIO mice dosed at 25 and 12.5 mg/kg/wk with either the MTP ASO or apoB ASO demonstrated no significant changes in plasma transaminase levels. Interestingly, in chow fed LDLr -/- mice, only apoB ASO led to significant increases (2.1- fold) in ALT concentrations when compared to controls. As with DIO mice, Western diet fed LDLr -/- mice treated with the MTP ASO displayed significant increases in plasma ALT and AST concentrations of 2.8-fold and 1.4 fold, respectively, when compared to control (Table 2), while apoB ASO treatment tended to increase plasma ALTs by 1.6-fold. Unlike chow and DIO mice, chow fed LDLr -/- mice dosed with the apoB or MTP ASO showed similar increases in liver TG. In Western diet fed LDLr -/- apoB ASO significantly increased hepatic TG 2.4-fold, while MTP ASO showed a 3.9-fold increase in liver TG that was significantly greater than both apoB ASO and control ASO treatments (Table 3). As with the chow and DIO mice, liver CE was significantly increased to a similar extent with both apoB ASO and MTP ASO treatment, and hepatic free cholesterol concentrations did not change with either treatment (data not shown).
Therefore, upon receiving a dietary challenge, DIO and LDLr -/- mice treated with the MTP ASO
developed more extensive hepatic steatosis and liver injury, as evidenced by elevated transaminases, when compared to apoB ASO treatment. Using these models, we attempted to identify the factors that would lead to such differences in the development of steatosis observed between the two targets.
To determine if the discrepancies in hepatic TG accumulation between apoB and MTP ASO
treatment were due to differences in VLDL secretion, apoB and TG accumulation was quantified in ASO treated mice administered a Triton WR1339/ 35S methionine bolus (Figure 4). Our data showed that apoB and MTP ASO administration significantly reduced TG secretion to a similar extent in both DIO and Western diet fed LDLr -/- mice when compared to control. However, quantitation of 35S apoB protein secretion in DIO mice demonstrated that, relative to MTP, the apoB ASO was a more potent inhibitor of apoB48 secretion at both the 120 and 180 minute time points. The relative insensitivity of apoB48 to MTP suppression has been well documented both in vitro and in vivo (23-25). Therefore the differences in TG accumulation between apoB ASO and MTP ASO treated mice were not due to differences in reduction of hepatic TG secretion.
Densitometric analysis of Oil Red O (ORO) stained histological sections (Figure 5A and 5B),
described in detail in the materials and methods, was used to examine treatment differences in lipid droplet density and size distribution after two and six week treatment. At two weeks (Figure 5C), the total lipid droplet area (i.e. ORO stained area) of apoB and MTP ASO treated livers showed similar significant elevations when compared to the control ASO animals, consistent with the liver TG concentrations obtained from tissue extractions (Table 3). Further analysis of lipid droplet size distribution demonstrated that a majority of the lipid droplets in all three ASO treatments were of small diameter (5-50 um2). However, with MTP ASO treatment there was a significant increase in the number
by guest, on June 25, 2018w
ww
.jlr.orgD
ownloaded from

9
of larger lipid droplets and percentage of total lipid area of larger lipid droplets (51-100 m2) when compared to controls (Figure 5C).
Analysis of livers from animals treated for six weeks revealed a more pronounced histological
phenotype (Figure 5B). In silico quantitation (Figure 5C) showed that much like liver TG concentrations, MTP ASO had significantly more total lipid area when compared to both apoB and control, while apoB ASO had a total lipid area that was intermediate between the control and MTP ASO. Much like the two week time point, apoB ASO treatment tended to increase the number of lipid droplets and the
percentage of total lipid area in the 5-50 and 51-100 m2 size classes. The MTP ASO showed a significantly different lipid droplet size distribution, with a majority of the lipid droplets and lipid droplet
area found in the larger lipid droplets (101-1000 and >1000 m2). The formation and maintenance of lipid droplets relies upon a number of important
transcription factors, including PPAR and protein cofactors. Previous studies have demonstrated that
PPAR can increase lipid droplet size via increased expression of fat-specific protein 27 (FSP27) (26).
Based on microarray data and studies described previously (11,12), we had identified PPAR as being regulated by apoB ASO. Quantitation of hepatic mRNA (Table 4) revealed that, while there were no significant differences compared to control ASO, two weeks of apoB ASO treatment led to significant
decreases in hepatic mRNA expression of PPAR and PPAR-regulated genes FSP27 and CD36, as well as, the adipocyte-specific marker adipsin relative to the MTP ASO. Furthermore, both apoB and MTP ASO treatment significantly reduced hepatic SCD-1 mRNA expression, a key enzyme in the lipogenic pathway (27). After 6 weeks of apoB ASO treatment, DIO mice again showed significant reductions in hepatic
PPAR mRNA when compared to MTP ASO treated mice (Table 5). In contrast, the hepatic expression of
PPAR and its target genes CD36 and FSP27, as well as the adipocyte-specific marker adipsin, which is
more highly expressed with PPAR over-expression (28), were significantly greater in MTP ASO treated animals.
As increased hepatic de novo lipogenesis can also contribute to liver TG accumulation, we
studied this synthetic process by evaluating transcriptional factors and fatty acid synthesis in mice treated with ASO for 6 or 12 weeks. The differences in liver TG concentrations after 12 weeks of treatment were similar to shorter duration studies (4.3 mg/g liver wet weight (WW) with control ASO vs 20.3 mg/g liver WW with apoB ASO vs 81.7 mg/g liver WW with MTP ASO). DIO mice administered the highest dose of apoB or MTP ASO showed similar reductions in acetyl-coA carboxylase 1 (ACC1) mRNA expression (Table 5), a key enzyme involved in fatty acid synthesis. Furthermore, after six weeks of ASO
treatment hepatic AMPK2 mRNA significantly increased by 66% when compared to control. While hepatic ACC1 protein expression was also reduced by both drug treatments, apoB ASO treated animals showed more pronounced protein reduction relative to MTP ASO treatment (Figure 6) after six weeks of ASO treatment. When hepatic lipogenesis was quantified after six and twelve weeks of treatment, this process tended to be reduced at both time points with the apoB ASO but these changes did not achieve statistical significance (p=0.28 and p=0.14, respectively). MTP ASO treatment tended to suppress lipogenesis at six weeks (p=0.58), but had no effect after twelve weeks (p=0.96). Therefore, the differences in TG accumulation between apoB and MTP ASO treatment appear to be due in part to the 1) inability of MTP ASO treated animals after long term treatment to suppress lipogenesis, 2)
development of larger lipid droplets with the MTP ASO and 3) reduced PPAR pathway mRNA expression produced by apoB ASO relative to the MTP ASO.
by guest, on June 25, 2018w
ww
.jlr.orgD
ownloaded from

10
Another potential contributing factor to hepatic steatosis is reduced fatty acid oxidation. An accepted in vivo biomarker for fatty acid oxidation is beta hydroxybutyrate (3HB) (29). In DIO mice treated for two weeks, plasma 3HB levels were significantly increased with both apoB and MTP ASO treatment (Table 1), indicating that these animals were compensating for elevated levels of hepatic TG levels by increasing fatty acid oxidation. However, after six weeks of treatment, 3HB levels remained elevated only with MTP ASO treatment, possibly because apoB ASO treated mice no longer had elevated liver TG concentrations.
by guest, on June 25, 2018w
ww
.jlr.orgD
ownloaded from

11
Discussion
Given that antisense drugs share similar pharmacokinetic properties and distribute predominantly in the liver, rather than intestine, we performed head-to-head comparisons with target-specific antisense drugs to evaluate the metabolic consequences of hepatic apoB and MTP suppression. Our studies reveal that the ASO-mediated modulation of either apoB or MTP mRNA resulted in similar reductions in their respective hepatic mRNA levels, with comparable concurrent suppression in hepatic TG secretion and serum lipid levels. Despite equivalent impairment of VLDL secretion, MTP reduction produced persistent increased hepatic TG accumulation that resulted in increased ALT elevations relative to the apoB ASO.
In earlier publications from our laboratory (11,12), we suggested that antisense suppression of apoB does not result in hepatic steatosis due to secondary compensatory changes in the expression of
multiple enzymes involved in lipogenic and -oxidative pathways in the liver. Data presented here confirm and extend those observations. When liver fat was quantified in DIO mice administered the apoB ASO, there was an early, transient increase in hepatic TG levels observed after 2 weeks of treatment, but by 6 weeks, liver TG returned to levels present in control animals (Table 3). A number of experiments using transcriptional profiling and metabolomic analyses were performed to determine the physiological sequelae of apoB reduction. Those analyses revealed that apoB ASO treatment down-
regulated several key lipogenic genes, including SCD-1, ACC1, and PPARConsistent with these findings, hepatic fatty acid synthesis, as determined by tritiated water analytical methods, demonstrated that de novo lipogenesis was decreased in vivo (Figure 6).
In addition to decreased fatty acid synthesis, another adaptive response to increased liver TG is
to enhance oxidation of fatty acid stores (30). Extensive studies have shown that AMP-activated protein
kinase (AMPKis a key energy sensor, whose expression has been correlated with increased fatty acid oxidation as well as decreased lipogenesis (30,31). As described previously and shown herein,
AMPK mRNA levels were increased after apoB ASO treatment (Table 5). An established method to
detect hepatic beta oxidation is to evaluate -hydroxybutyrate (3HB), or ketone levels, in vivo (32,33). Using that technique, it appeared that 3HB was increased in apoB ASO treated DIO mice after two weeks of treatment (Table 1), when liver TG levels were elevated in comparison to controls (Table 3), but after six weeks, when hepatic TG levels were similar to controls, 3HB levels returned to those observed in control ASO treated mice. This was in contrast to MTP ASO treated animals, which had elevated plasma TG and 3HB levels and at the highest administered dose, and increased transaminase levels at both the two and six week time points. Interestingly, sustained fatty acid oxidation has been shown to increase reactive oxygen species (ROS), which through many well documented pathways, including the peroxidation of polyunsaturated fatty acids, leads to enhanced oxidative stress, thus potentially contributing to the development of liver injury (30).
In MTP ASO treated mice, many lipogenic genes were also down-regulated, with similar
reductions as observed in apoB ASO treated mice such as SCD-1, while less robust down-regulation was
demonstrated for ACC1Finally, AMPK levels were unaffected by MTP ASO treatment. Regardless of these reductions in lipogenic genes, de novo fatty acid synthesis, as determined using tritiated water, was not significantly reduced in MTP treated mice (Figure 6), perhaps due to more modest effects on ACC1 mRNA and protein. ACC1 is a key enzyme that catalyzes the synthesis of malonyl CoA and plays a pivotal role in both de novo lipogenesis and mitochondrial fatty acid oxidation (34). These observations suggest that blocking VLDL secretion with either an MTP or apoB ASO may trigger common metabolic pathways to compensate for increased hepatic TG deposition, including down-regulation of lipogenesis
by guest, on June 25, 2018w
ww
.jlr.orgD
ownloaded from

12
and increased -oxidation. These adaptive processes have also been observed in mice with a targeted apoB38.9 mutation (35) as well as, hepatocytes isolated from humans with familial hypobetalipoproteinemia (36).
Another potential contributor to the consistent hepatic steatosis observed in MTP, but not apoB
ASO treated mice relates to differential effects upon PPAR regulated genes that are thought to be involved in lipid droplet formation and homeostasis. We observed key differences between apoB and
MTP ASO treatment in lipid droplet size (Figure 5) and the expression of PPAR and FSP27 genes (Table 4 and 5) previously implicated in lipid droplet metabolism. Others have previously shown that FSP27, a
lipid droplet associated protein, is also integral to the PPAR-dependent development of hepatic steatosis in mice (37). In vitro evidence indicates that FSP27 over-expression results in TG accumulation and increased lipid droplet size in AML12 cells, primary hepatocytes (37), and COS cells due in part to decreases in fatty acid oxidation and TG turnover. Furthermore, recent in vivo experiments
demonstrated that over-expression of FSP27 in liver specific PPAR -/- mice partially restored hepatic TG accumulation (37). Recent evidence indicates that FSP27 facilitates lipid droplet fusion and expansion (38,39), which in turn reduces lipolytic activity by limiting lipolytic enzymes (i.e. HSL and ATGL) access to substrate. This reduces TG turnover from lipid droplets, which causes accumulation of lipid within the droplet. In the MTP ASO treated animals, hepatic FSP27 mRNA expression and lipid droplet size were increased relative to controls and apoB ASO treated animals. It is possible that the elevated FSP27 expression in MTP ASO treated animals is shunting the TG normally exported in VLDL particles away from the fatty acid oxidation pathway and into lipid droplets where the TG cannot be mobilized. Therefore, differential effects on both fatty acid synthesis and lipid droplet morphology may help explain the difference in liver TG levels observed between high dose apoB and MTP ASO treatment.
In summary, although both apoB and MTP play central roles in hepatic lipoprotein secretion, pharmacological suppression of these proteins leads to distinct differences in metabolic sequelae. While there were similar reductions in hepatic TG secretion after six weeks of ASO treatment, MTP ASO treated mice accumulated significantly more hepatic TG than apoB ASO treated mice. Our data suggest that this is likely due to the complex, multiphasic interplay of factors including decreased lipogenesis and changes in lipid droplet metabolism, as exemplified by reductions in hepatic lipid droplet size and FSP27 mRNA expression with apoB ASO treatment relative to MTP ASO treatment. While we believe that the factors elucidated in this manuscript contribute in some way to the phenotypes observed in mice after apoB and MTP ASO treatment, other metabolic processes may certainly occur. Further work is necessary to define the precise signaling mechanisms and potential alternate pathways that differentiate the effects of long term reductions in apoB and MTP in liver metabolism and lipid homeostasis. Acknowledgements: The authors would like to thank Drs. Stanley T. Crooke, Brett Monia, Michael McCaleb, Brenda Baker, Walter Singleton and Richard Geary for helpful discussions and review of the manuscript, and Yuhong Jiang for her technical assistance in Oil Red O staining of liver and intestine. Sources of Funding: All studies were funded by Isis Pharmaceuticals. Disclosures: All authors are employees of and have ownership interest in Isis Pharmaceuticals.
by guest, on June 25, 2018w
ww
.jlr.orgD
ownloaded from

13
References
1. Heron, M. 2007. Deaths: leading causes for 2004, Natl.Vital Stat.Rep. 56: 1-95. 2. LaRosa, J. C. 2007. Low-density lipoprotein cholesterol reduction: the end is more important
than the means, Am.J.Cardiol. 100: 240-242. 3. Baigent, C., A. Keech, P. M. Kearney, L. Blackwell, G. Buck, C. Pollicino, A. Kirby, T. Sourjina, R.
Peto, R. Collins, and R. Simes. 2005. Efficacy and safety of cholesterol-lowering treatment: prospective meta-analysis of data from 90,056 participants in 14 randomised trials of statins, Lancet 366: 1267-1278.
4. Armitage, J. 2007. The safety of statins in clinical practice, Lancet 370: 1781-1790. 5. Stein, E. 2002. The lower the better? Reviewing the evidence for more aggressive cholesterol
reduction and goal attainment, Atheroscler.Suppl 2: 19-23. 6. Lilly, S. M., and D. J. Rader. 2007. New targets and emerging therapies for reducing LDL
cholesterol, Curr.Opin.Lipidol. 18: 650-655. 7. Burnett, J. R., and M. W. Huff. 2006. Cholesterol absorption inhibitors as a therapeutic option
for hypercholesterolaemia, Expert.Opin.Investig.Drugs 15: 1337-1351. 8. Akdim, F., E. S. Stroes, and J. J. Kastelein. 2007. Antisense apolipoprotein B therapy: where do
we stand?, Curr.Opin.Lipidol. 18: 397-400. 9. Davis, R. A. 1999. Cell and molecular biology of the assembly and secretion of apolipoprotein B-
containing lipoproteins by the liver, Biochim.Biophys.Acta 1440: 1-31. 10. Shelness, G. S., and J. A. Sellers. 2001. Very-low-density lipoprotein assembly and secretion,
Curr.Opin.Lipidol. 12: 151-157. 11. Crooke, R. M., M. J. Graham, K. M. Lemonidis, C. P. Whipple, S. Koo, and R. J. Perera. 2005. An
apolipoprotein B antisense oligonucleotide lowers LDL cholesterol in hyperlipidemic mice without causing hepatic steatosis, J.Lipid Res. 46: 872-884.
12. Mullick, A. E., W. Fu, M. J. Graham, R. G. Lee, D. Witchell, T. A. Bell, C. P. Whipple, and R. M. Crooke. 2011. Antisense oligonucleotide reduction of apoB-ameliorated atherosclerosis in LDL receptor-deficient mice, J Lipid Res 52: 885-896.
13. Koller, E., T. M. Vincent, A. Chappell, S. De, M. Manoharan, and C. F. Bennett. 2011. Mechanisms of single-stranded phosphorothioate modified antisense oligonucleotide accumulation in hepatocytes, Nucleic Acids Res 39: 4795-4807.
14. Sheehan, D. C., and B. B. Hrapchak (1980) Theory and Practice of Histotechnology, CV Mosby, St Louis.
15. Lee, R. G., K. L. Kelley, J. K. Sawyer, R. V. Farese, Jr., J. S. Parks, and L. L. Rudel. 2004. Plasma cholesteryl esters provided by lecithin:cholesterol acyltransferase and acyl-coenzyme a:cholesterol acyltransferase 2 have opposite atherosclerotic potential, Circ.Res. 95: 998-1004.
16. Rava, P., H. Athar, C. Johnson, and M. M. Hussain. 2005. Transfer of cholesteryl esters and phospholipids as well as net deposition by microsomal triglyceride transfer protein, J Lipid Res 46: 1779-1785.
17. Wang, D. Q., and M. C. Carey. 2003. Measurement of intestinal cholesterol absorption by plasma and fecal dual-isotope ratio, mass balance, and lymph fistula methods in the mouse: an analysis of direct versus indirect methodologies, J.Lipid Res. 44: 1042-1059.
by guest, on June 25, 2018w
ww
.jlr.orgD
ownloaded from
14
18. Zhang, Y. L., A. Hernandez-Ono, P. Siri, S. Weisberg, D. Conlon, M. J. Graham, R. M. Crooke, L. S. Huang, and H. N. Ginsberg. 2006. Aberrant hepatic expression of PPARgamma2 stimulates hepatic lipogenesis in a mouse model of obesity, insulin resistance, dyslipidemia, and hepatic steatosis, J.Biol.Chem. 281: 37603-37615.
19. Shimano, H., J. D. Horton, I. Shimomura, R. E. Hammer, M. S. Brown, and J. L. Goldstein. 1997. Isoform 1c of sterol regulatory element binding protein is less active than isoform 1a in livers of transgenic mice and in cultured cells, J Clin Invest 99: 846-854.
20. Farese, R. V., Jr., S. L. Ruland, L. M. Flynn, R. P. Stokowski, and S. G. Young. 1995. Knockout of the mouse apolipoprotein B gene results in embryonic lethality in homozygotes and protection against diet-induced hypercholesterolemia in heterozygotes, Proc Natl Acad Sci U S A 92: 1774-1778.
21. Leung, G. K., M. M. Veniant, S. K. Kim, C. H. Zlot, M. Raabe, J. Bjorkegren, R. A. Neese, M. K. Hellerstein, and S. G. Young. 2000. A deficiency of microsomal triglyceride transfer protein reduces apolipoprotein B secretion, J.Biol.Chem. 275: 7515-7520.
22. Yu, R. Z., T. W. Kim, A. Hong, T. A. Watanabe, H. J. Gaus, and R. S. Geary. 2007. Cross-species pharmacokinetic comparison from mouse to man of a second-generation antisense oligonucleotide, ISIS 301012, targeting human apolipoprotein B-100, Drug Metab Dispos 35: 460-468.
23. Haghpassand, M., D. Wilder, and J. B. Moberly. 1996. Inhibition of apolipoprotein B and triglyceride secretion in human hepatoma cells (HepG2), J Lipid Res 37: 1468-1480.
24. Nicodeme, E., F. Benoist, R. McLeod, Z. Yao, J. Scott, C. C. Shoulders, and T. Grand-Perret. 1999. Identification of domains in apolipoprotein B100 that confer a high requirement for the microsomal triglyceride transfer protein, J Biol Chem 274: 1986-1993.
25. Raabe, M., M. M. Veniant, M. A. Sullivan, C. H. Zlot, J. Bjorkegren, L. B. Nielsen, J. S. Wong, R. L. Hamilton, and S. G. Young. 1999. Analysis of the role of microsomal triglyceride transfer protein in the liver of tissue-specific knockout mice, J.Clin.Invest 103: 1287-1298.
26. Nishino, N., Y. Tamori, S. Tateya, T. Kawaguchi, T. Shibakusa, W. Mizunoya, K. Inoue, R. Kitazawa, S. Kitazawa, Y. Matsuki, R. Hiramatsu, S. Masubuchi, A. Omachi, K. Kimura, M. Saito, T. Amo, S. Ohta, T. Yamaguchi, T. Osumi, J. Cheng, T. Fujimoto, H. Nakao, K. Nakao, A. Aiba, H. Okamura, T. Fushiki, and M. Kasuga. 2008. FSP27 contributes to efficient energy storage in murine white adipocytes by promoting the formation of unilocular lipid droplets, J.Clin.Invest 118: 2808-2821.
27. Miyazaki, M., M. T. Flowers, H. Sampath, K. Chu, C. Otzelberger, X. Liu, and J. M. Ntambi. 2007. Hepatic stearoyl-CoA desaturase-1 deficiency protects mice from carbohydrate-induced adiposity and hepatic steatosis, Cell Metab 6: 484-496.
28. Yu, S., K. Matsusue, P. Kashireddy, W. Q. Cao, V. Yeldandi, A. V. Yeldandi, M. S. Rao, F. J. Gonzalez, and J. K. Reddy. 2003. Adipocyte-specific gene expression and adipogenic steatosis in the mouse liver due to peroxisome proliferator-activated receptor gamma1 (PPARgamma1) overexpression, J.Biol.Chem. 278: 498-505.
29. Hodson, L., and K. N. Frayn. 2011. Hepatic fatty acid partitioning, Curr Opin Lipidol 22: 216-224. 30. Browning, J. D., and J. D. Horton. 2004. Molecular mediators of hepatic steatosis and liver injury,
J.Clin.Invest 114: 147-152. 31. Hardie, D. G., and D. A. Pan. 2002. Regulation of fatty acid synthesis and oxidation by the AMP-
activated protein kinase, Biochem.Soc.Trans. 30: 1064-1070. 32. Tremblay-Mercier, J., D. Tessier, M. Plourde, M. Fortier, D. Lorrain, and S. C. Cunnane. 2010.
Bezafibrate mildly stimulates ketogenesis and fatty acid metabolism in hypertriglyceridemic subjects, J Pharmacol Exp Ther 334: 341-346.
by guest, on June 25, 2018w
ww
.jlr.orgD
ownloaded from

15
33. Glien, M., G. Haschke, K. Schroeter, A. Pfenninger, G. Zoller, S. Keil, M. Muller, A. W. Herling, and D. Schmoll. 2011. Stimulation of fat oxidation, but no sustained reduction of hepatic lipids by prolonged pharmacological inhibition of acetyl CoA carboxylase, Horm Metab Res 43: 601-606.
34. Savage, D. B., C. S. Choi, V. T. Samuel, Z. X. Liu, D. Zhang, A. Wang, X. M. Zhang, G. W. Cline, X. X. Yu, J. G. Geisler, S. Bhanot, B. P. Monia, and G. I. Shulman. 2006. Reversal of diet-induced hepatic steatosis and hepatic insulin resistance by antisense oligonucleotide inhibitors of acetyl-CoA carboxylases 1 and 2, J.Clin.Invest 116: 817-824.
35. Lin, X., G. Schonfeld, P. Yue, and Z. Chen. 2002. Hepatic fatty acid synthesis is suppressed in mice with fatty livers due to targeted apolipoprotein B38.9 mutation, Arterioscler Thromb Vasc Biol 22: 476-482.
36. Zhong, S., A. L. Magnolo, M. Sundaram, H. Zhou, E. F. Yao, E. Di Leo, P. Loria, S. Wang, M. Bamji-Mirza, L. Wang, C. J. McKnight, D. Figeys, Y. Wang, P. Tarugi, and Z. Yao. 2010. Nonsynonymous mutations within APOB in human familial hypobetalipoproteinemia: evidence for feedback inhibition of lipogenesis and postendoplasmic reticulum degradation of apolipoprotein B, J Biol Chem 285: 6453-6464.
37. Matsusue, K., T. Kusakabe, T. Noguchi, S. Takiguchi, T. Suzuki, S. Yamano, and F. J. Gonzalez. 2008. Hepatic steatosis in leptin-deficient mice is promoted by the PPARgamma target gene Fsp27, Cell Metab 7: 302-311.
38. Gong, J., Z. Sun, L. Wu, W. Xu, N. Schieber, D. Xu, G. Shui, H. Yang, R. G. Parton, and P. Li. 2011. Fsp27 promotes lipid droplet growth by lipid exchange and transfer at lipid droplet contact sites, J Cell Biol 195: 953-963.
39. Jambunathan, S., J. Yin, W. Khan, Y. Tamori, and V. Puri. 2011. FSP27 promotes lipid droplet clustering and then fusion to regulate triglyceride accumulation, PLoS One 6: e28614.
by guest, on June 25, 2018w
ww
.jlr.orgD
ownloaded from

16
Figure Legends
Figure 1- ApoB and MTP ASOs Reduce Liver Target mRNA Expression in Three Different Mouse Models. A, Chow fed (n=5-8/group) or B, DIO C57BL/6 mice (n=4) were administered ASO for either 2 or 6 weeks. C, Chow fed or western diet fed LDLr -/- were administered ASO for six weeks. Quantitative RT-PCR was carried out as described in material and methods. Number on x-axis indicates mg/kg/wk dose. # denotes significantly different (p<0.05) when compared to control ASO. ζ denotes significantly different when compared to MTP ASO treatment. Figure 2- ApoB and MTP ASO Administration Reduced Liver Target Protein Expression in Several Murine Models. A, DIO C57BL/6 mice were administered ASO (50 mg/kg/wk) for either 2 or 6 weeks. B,
Chow fed or western diet fed LDLr -/- were administered ASO for six weeks. 50 g of liver protein was immunoblotted with polyclonal Abs raised against apoB, MTP, or GAPDH (load control). Numbers below bands are mean density (n=4) relative to control ASO treated mice. C, Quantitation of hepatic MTP activity (n=5/group) in DIO mice administered ASO for 6 weeks. # denotes significantly different (p<0.05) when compared to control ASO. ζ denotes significantly different when compared to MTP ASO treatment.
Figure 3- Intestinal Effects of ApoB and MTP ASOs in DIO Mice. A, Proximal intestine mRNA expression of targeted genes in 50 mg/kg/wk control ASO, apoB ASO, and MTP ASO (n=5/group) treated DIO
animals were determined by quantitative PCR as described in Materials and Methods section. B, 100 g of protein isolated from the proximal intestine was immunoblotted with polyclonal Abs raised against apoB, MTP, or GAPDH (load control). Numbers below bands are mean density (n=2) relative to control ASO treated mice. C, Quantitation of 3H-triolein absorption in DIO mice administered ASO for six weeks was carried out as described in materials and methods. Cholesterol absorption was carried out in DIO mice administered ASO for six weeks using the dual fecal isotope method. D, Proximal intestine triglyceride and total cholesterol was quantitated as described in the material and methods. E, Images of Oil Red O stained snap frozen proximal intestinal sections from mice treated with ASO for six weeks. Oil Red O stained sections were counterstained with hematoxylin. Bars represent mean and error bars represent SEM. # denotes significantly different (p<0.05) when compared to control ASO. ζ denotes significantly different (p<0.05) when compared to MTP ASO treated at same dose.
Figure 4- Hepatic ApoB and TG secretion in ApoB or MTP ASO (50 mg/kg/wk) Treated DIO Mice. Fasted DIO mice (n= 4 / treatment group) were injected with a 35S Met / Triton WR1339 bolus. Animals were then bled at the 60, 120, and 180 minute time points and apoB-100, apoB-48 and TG levels analyzed. A, TG levels at each time point were determined by colorimetric assay in control ASO (square w/ dashed line), apoB ASO (diamond w/ solid line), and MTP ASO (triangle w/ dashed line) treated DIO
(left panel) and western diet fed LDLr -/- (right panel) mice. B, 5 l of plasma from the 120 and 180 minute time points were analyzed by SDS-PAGE. The gels were dried down and exposed to film. C, Films were scanned and densitometry on the apoB100 and apoB48 bands were assessed for control ASO (grey bars), apoB ASO (black bars), and MTP ASO (hatched bars) treated mice. Bars represent mean and error bars represent SEM. # denotes p<0.05 when compared to control ASO. ζ denotes significantly different (p<0.05) when compared to MTP ASO treatment.
Figure 5- Effects of ApoB and MTP ASO (50 mg/kg/wk) on Liver Lipid Droplets in DIO mice. A, Representative images of H&E and Oil Red O stained liver sections from DIO mice treated for 2 weeks with control ASO (50 mg/kg/wk), apoB ASO (50 mg/kg/wk), or MTP ASO (50 mg/kg/wk). B,
by guest, on June 25, 2018w
ww
.jlr.orgD
ownloaded from

17
Representative images of H&E and ORO stained liver sections from DIO mice treated for 6 weeks with control ASO (50 mg/kg/wk), apoB ASO (50 mg/kg/wk), or MTP ASO (50 mg/kg/wk). Oil Red O stained sections were counterstained with hematoxylin. C, Quantitation of lipid droplet number and size distribution in DIO mice administered ASO for 2 or 6 weeks. Oil Red O stained liver sections from ASO treated DIO mice (n=4/group) were analyzed as described in material and methods. Bars represent mean and error bars represent SEM. # denotes p<0.05 when compared to control ASO. ζ denotes significantly different (p<0.05) when compared to MTP ASO treatment.
Figure 6- Effects of ApoB and MTP ASOs on Fatty Acid Synthesis in DIO Mice. A, Hepatic expression of ACC1 protein in DIO mice administered 50 mg/kg/wk of ASO for six weeks. B, Hepatic fatty acid synthesis in DIO mice (n=6-12/group) administered 50 mg/kg/wk of ASO for 6 weeks. C, Hepatic fatty acid synthesis in DIO mice (n=5/group) administered 50 mg/kg/wk of ASO for 12 weeks. Fatty acid synthesis was measured using the tritiated water method described in materials and methods. Bars represent mean and error bars represent SEM.
by guest, on June 25, 2018w
ww
.jlr.orgD
ownloaded from

18
Table 1- Plasma Lipids, Alanine Aminotransferase (ALT), Aspartate Aminotransferase (AST) and Beta
Hydroxybutyrate Levels in DIO C57BL/6 Mice Administered ASOs for Either Two or Six Weeks
ALT (U/L)
AST (U/L)
TPC (mg/dl) Non-HDL-C
(mg/dl)
HDL-C (mg/dl)
Plasma TG
(mg/dl)
Plasma 3HB
(mmol/L)
2 Wk DIO C57BL/6
Control ASO (50) 33 ± 4 56 ± 4 169 ± 12 25 ± 2 137 ± 10 95 ± 2 274 ± 28
ApoB ASO (50) 71 ± 9 60 ± 4 92 ± 2#,ζ 12 ± 1#,ζ 79 ± 1#,ζ 73 ± 7 514 ± 42#
ApoB ASO (25) 74 ± 24 101 ± 18 144 ± 9 20 ± 2 118 ± 7 93 ± 9 294 ± 66
ApoB ASO (12.5) 41 ± 1 53 ± 5 148 ± 6 22 ± 1 119 ± 4 85 ± 3 336 ± 27
MTP ASO (50) 243 ± 30#,ζ 172 ± 22#,ζ 143 ± 11 23 ± 2 114 ± 9 65 ± 4 484 ± 48#
MTP ASO (25) 81 ± 9 89 ± 6 145 ± 4 21 ± 1 117 ± 4 79 ± 9 499 ± 72#
MTP ASO (12.5) 45 ± 7 61 ± 3 176 ± 5 24 ± 1 140 ± 4 72 ± 2 437 ± 43#
6 Wk DIO C57BL/6
Control ASO (50) 41 ± 5 76 ± 17 161 ± 20 31 ± 2 129 ± 18 90 ± 3 251 ± 32
ApoB ASO (50) 62 ± 26 59 ± 9 72 ± 1# 12 ± 0.2#,ζ 64 ± 1# 78 ± 11 355 ± 53
ApoB ASO (25) 50 ± 13 65 ± 9 91 ± 6# 13 ± 1#,ζ 79 ± 6# 94 ± 3 372 ± 89
ApoB ASO (12.5) 47 ± 18 51 ± 5 140 ± 1 26 ± 1 116 ± 1 95 ± 8 334 ± 32
MTP ASO (50) 349 ± 75#,ζ 184 ± 40#,ζ 114 ± 10# 23 ± 2 95 ± 7 70 ± 2 580 ± 64#
MTP ASO (25) 96 ± 25 76 ± 6 102 ± 8# 22 ± 2# 84 ± 7# 80 ± 2 484 ± 53
MTP ASO (12.5) 89 ± 26 82 ± 17 126 ± 4 26 ± 2 105 ± 5 83 ± 4 383 ± 56
Values represent mean ± SEM, n=4/group. Number in parenthesis indicates mg/kg/wk dose. # denotes significantly different (p<0.05) when compared to control ASO. ζ denotes significantly different when compared to MTP ASO treated at same dose.
by guest, on June 25, 2018w
ww
.jlr.orgD
ownloaded from

19
Table 2- Plasma Lipids, Alanine Aminotransferase (ALT), and Aspartate Aminotransferase (AST) Levels
in Chow or Western Diet Fed LDLr -/- Mice Administered ASOs for Six Weeks
ALT (U/L)
AST (U/L)
TPC (mg/dl)
VLDL-C (mg/dl)
LDL-C (mg/dl)
HDL-C (mg/dl)
Plasma TG (mg/dl)
6 Wk Chow LDLr -/-
Control ASO (50) 29 ± 1 66 ± 6 348 ± 24 17 ± 2.6 235 ± 15 97 ± 14 156 ± 11 ApoB ASO (50) 62 ± 12#,ζ 78 ± 10 167 ± 10#
7 ± 1 92 ± 7# 68 ± 6#
82 ± 6#
MTP ASO (50) 38 ± 7 76 ± 12 205 ± 10# 5 ± 4 140 ± 8#
60 ± 3
102 ± 6#
6 Wk Western Diet LDLr -/-
Control ASO (50) 92 ± 23 139 ± 21 1546 ± 50 646 ± 42 787 ± 14 113 ± 9 585 ± 25 ApoB ASO (50) 149 ± 31ζ 128 ± 10ζ 407 ± 58#,ζ 114 ± 35#
209 ± 36#,ζ 84 ± 10 182 ± 33#
MTP ASO (50) 258 ± 46# 207 ± 25#
671 ± 81# 98 ± 28#
457 ± 57# 116 ± 8 147 ± 25#
Values represent mean ± SEM, For chow fed LDLr -/- mice n=8-9/group, for western diet fed LDLr -/- mice n=7-8/group. Number in parenthesis indicates mg/kg/wk dose. # denotes significantly different (p<0.05) when compared to control ASO. ζ denotes significantly different when compared to MTP ASO treatment.
by guest, on June 25, 2018w
ww
.jlr.orgD
ownloaded from

20
Table 3- Effect of ApoB and MTP ASO Administration on Liver Neutral Lipid Accumulation in Chow Fed
and Dietary Challenged C57BL/6 and LDLr -/- Mice.
2 Week Chow (mg/g tissue)
6 Week Chow (mg/g tissue)
2 Week DIO (mg/g tissue)
6 Week DIO (mg/g tissue)
6 Week Chow LDLr -/- (mg/g tissue)
6 Week WD LDLr (mg/g tissue)
Liver Triglyceride
Control ASO (50) 6.9 ± 1.6 11.4 ± 1.1 10.2 ± 1.6 15.1 ± 5.1 14.9 ± 1.3 45.3 ± 10.4
ApoB ASO (50) 11.9 ± 1.0 15.2 ± 1.3ζ 33.9 ± 3.4# 35.3 ± 7.9 ζ 28.6 ± 2.5# 108.3 ± 11.5#,ζ
MTP ASO (50) 12.3 ± 2.1 23.4 ± 3.6# 33.9 ± 4.9# 110.7 ± 17.7# 31.3 ± 2.5# 175.2 ± 27.1#
Liver Cholesteryl Ester
Control ASO (50) 3.7 ± 0.2 3.6 ± 0.3 1.2 ± 0.4 2.6 ± 0.7 1.7 ± 0.4 8.1 ± 1.5
ApoB ASO (50) 5.3 ± 0.4# 4.5 ± 0.1#,ζ 3.5 ± 0.7# 11.9 ± 2.8# 5.5 ± 0.4#,ζ 31.1 ± 2.6#
MTP ASO (50) 4.4 ± 0.2 5.3 ± 0.2# 4.1 ± 0.5# 10.5 ± 0.6# 3.6 ± 0.5# 27 ± 3.5#
Values represent mean ± SEM. For chow n=5/group and DIO mice n=5/group. For chow fed LDLr -/-
mice n=8-9/group, for western diet fed LDLr -/- mice n=11-13/group. Number in parenthesis indicates
mg/kg/wk dose. # denotes significantly different (p<0.05) when compared to control ASO. ζ denotes
significantly different (p<0.05) when compared to MTP ASO treatment.
by guest, on June 25, 2018w
ww
.jlr.orgD
ownloaded from

21
Table 4- Hepatic mRNA Expression of a Subset of Key Metabolic Genes Following Two Weeks of 50 mg/kg/wk ASO Treatment in DIO Mice
Week 2 Control ASO ApoB ASO MTP ASO
Fatty Acid Metabolism
SREBP1-c 100 ± 12 36 ± 6# 40 ± 9#
ACC1 100 ± 17 57 ± 14 92 ± 18
SCD-1 100 ± 31 13 ± 4# 14 ± 3#
AMPK2 100 ± 12 103 ± 12 82 ± 7
PPAR Related Genes
PPAR 100 ± 7 62 ± 7ζ 128 ± 27
FSP27 100 ± 21 95 ± 14ζ 178 ± 26
CD36 100 ± 12 84 ± 8ζ 165 ± 27
Adipsin 100 ± 23 43 ± 17ζ 204 ± 48
Values represent mean ± SEM, n=5/group. # denotes significantly different (p<0.05) when compared to
control ASO. ζ significantly different (p<0.05) when compared to MTP ASO treatment.
by guest, on June 25, 2018w
ww
.jlr.orgD
ownloaded from

22
Table 5- Hepatic mRNA Expression of a Subset of Key Metabolic Genes Following Six Weeks of 50 mg/kg/wk ASO Treatment in DIO Mice
Week 6 Control ASO ApoB ASO MTP ASO
Lipogenic Pathway
SREBP1-c 100 ± 9 116 ± 13ζ 70 ± 6
ACC1 100 ± 8 41 ± 4# 65 ± 11#
SCD-1 100 ± 22 3 ± 1# 14 ± 4#
AMPK2 100 ± 10 166 ± 13#,ζ 101 ± 8
PPAR Related Genes
PPAR 100 ± 8 44 ± 5#,ζ 162 ± 9#
FSP27 100 ± 14 64 ± 8ζ 231 ± 34#
CD36 100 ± 9 75 ± 3ζ 275 ± 21#
Adipsin 100 ± 22 33 ± 17ζ 389 ± 86#
Values represent mean ± SEM. N=4/group. # denotes significantly different (p<0.05) when compared to
control ASO. ζ denote significantly different (p<0.05) when compared to MTP ASO treatment.
by guest, on June 25, 2018w
ww
.jlr.orgD
ownloaded from

23
Figure 1
Chow Hepatic ApoB mRNA
0
50
100
150
#,
#
#,
#,
#,
% C
on
tro
l A
SO
Chow Hepatic MTP mRNA
0
50
100
1502 Weeks
6 Weeks
##
#
#
# #
% C
on
tro
l A
SO
12.52550
MTP ASOApoB ASO
12.52550 50Control
ASO
12.52550
MTP ASOApoB ASO
12.52550 50Control
ASO
12.52550
MTP ASOApoB ASO
12.52550 50Control
ASO
MTP ASOApoB ASOControl
ASO
MTP ASOApoB ASOControl
ASO
12.52550
MTP ASOApoB ASO
12.52550 50Control
ASO
A
B
C
DIO Hepatic ApoB mRNA
0
50
100
150
#,
# #
# #
#,
#,
#,
% C
on
tro
l A
SO
DIO Hepatic MTP mRNA
0
50
100
1502 Weeks
6 Weeks
Chow
Western
Diet
##
# ## #
% C
on
tro
l A
SO
Hepatic ApoB LDLr -/-
0
50
100
150
#,
#,
% C
on
tro
l
% C
ontr
ol
Hepatic MTP LDLr -/-
0
50
100
150
200#,
#
#
by guest, on June 25, 2018w
ww
.jlr.orgD
ownloaded from

24
Figure 2
A
B
C
Control ASO ApoB ASO MTP ASO0
5
10
15 #,
#
MT
P A
ctivity (
% t
ran
sfe
r)
Control ASO ApoB ASO MTP ASO
ApoB100
ApoB48
MTP
GAPDH
1.00 0.24 1.91
1.00 0.33 1.85
1.00 0.91 0.15
ApoB100
ApoB48
MTP
GAPDH
1.00 1.20 0.09
1.00 0.09 1.64
1.00 0.10 1.21
Control ASO ApoB ASO MTP ASO
ApoB100
ApoB48
MTP
GAPDH
Control ASO ApoB ASO MTP ASO
1.00 0.28 2.48
1.00 0.26 0.95
1.00 0.79 0.19
ApoB100
ApoB48
MTP
GAPDH
Control ASO ApoB ASO MTP ASO
1.00
1.00
1.00
0.14 2.64
0.25 0.71
0.87 0.12
Chow Western Diet
2 Weeks 6 Weeks
by guest, on June 25, 2018w
ww
.jlr.orgD
ownloaded from
25
Figure 3
A
B
C
2 Week Proximal Intestine ApoB mRNA
Control ASO ApoB ASO MTP ASO0
50
100
150
% c
on
tro
l A
SO
2 Week Proximal Intestine MTP mRNA
Control ASO ApoB ASO MTP ASO0
50
100
150
% c
on
tro
l A
SO
#
6 Week Proximal Intestine ApoB mRNA
2 Week 6 Week
Control ASO ApoB ASO MTP ASO0
50
100
150
% c
on
tro
l A
SO
#,
6 Week Proximal Intestine MTP mRNA
Control ASO ApoB ASO MTP ASO0
50
100
150
% c
on
tro
l A
SO
#
Control
ASO
ApoB
ASO
MTP
ASO
ApoB48
GAPDH
MTP
1.00 0.73 0.66
1.00 1.10 0.92
ApoB48
MTP
GAPDH
1.00 0.57 3.68
1.00 0.99 0.86
Control
ASO
ApoB
ASO
MTP
ASO
Time (min.)
0 50 100 150 2000
1000
2000
3000
4000 Control ASO
ApoB ASO
MTP ASO
#
3H
Tri
ole
in A
bso
rption
(CP
M/ 2
0 μ
l)
Control ASO ApoB ASO MTP ASO0
20
40
60
80
100
% C
ho
leste
rol A
bs
by guest, on June 25, 2018w
ww
.jlr.orgD
ownloaded from
26
D
E
2 Week Intestinal Triglyceride
Control ASO ApoB ASO MTP ASO0
100
200
300
400
500
TG
(μ
g/m
g p
rote
in)
2 Week Intestinal Cholesterol
Control ApoB ASO MTP ASO0
20
40
60
80
100
TC
(μ
g/m
g p
rote
in)
6 Week Intestinal Triglyceride
Control ASO ApoB ASO MTP ASO0
50
100
150
200
TG
(μ
g/m
g p
rote
in)
6 Week Intestinal Cholesterol
Control ASO ApoB ASO MTP ASO0
10
20
30
40
50
TC
(μ
g/m
g p
rote
in)
H&E
ORO
Control ASO ApoB ASO MTP ASO
by guest, on June 25, 2018w
ww
.jlr.orgD
ownloaded from

27
Figure 4
A
B
C
0 60 120 1800
500
1000
1500
Time (min.)
TG
mg
/dl
#
#
##
#
ApoB100
ApoB48
120 120
Time (min.)
120180 180 180
Control ASO ApoB ASO MTP ASO
ApoB100
120 1800
50
100
150
% C
on
tro
l
# ,
#
#
ApoB48
DIO Mice WD Fed LDLr -/- Mice
120 1800
50
100
150
% C
on
tro
l
#, #,
Control ASO
ApoB ASO
MTP ASO
0 60 120 1800
500
1000
1500
2000
2500
Time (min.)
Time (min.)Time (min.)
TG
(m
g/d
l)
Control ASO (50)
ApoB ASO (50)
MTP ASO (50)
#
#
#
##
#
by guest, on June 25, 2018w
ww
.jlr.orgD
ownloaded from

28
Figure 5
A
B
C
H & E
ORO
Control ASO ApoB ASO MTP ASO
H & E
ORO
Control ASO ApoB ASO MTP ASO
2 Week Total Lipid Droplet Area
Control ASO ApoB ASO MTP ASO0
1 105
2 105
3 105
4 105
Tota
l L
ipid
Are
a (μ
m2)
##
2 Week Distribution By Number
5-50 51-100 101-1000 >10000
2000
4000
6000
10000
15000
20000
# o
f L
ipid
Dro
ple
ts
Lipid Droplet Size (μm2)
# #
#
6 Week Total Lipid Droplet Area
Control ASO ApoB ASO MTP ASO0
2 105
4 105
6 105
8 105
1 106
Tota
l L
ipid
Are
a (μ
m2) #
6 Week Distribution by Number
2 Week Distribution By Area
6 Week Distribution by Area
5-50 51-100 101-1000 >10000
500
1000
1500
2000
10000
20000
30000
# o
f L
ipid
Dro
ple
ts
Lipid Droplet Size (μm2)
##
#
5-50 51-100 101-1000 >10000
5
10
15
20
80
100
120
% o
f T
ota
l L
ipid
Are
a
Lipid Droplet Size (μm2)
Control ASO
ApoB ASO
MTP ASO
#
#
5-50 51-100 101-1000 >10000
50
100
150
% o
f T
ota
l L
ipid
Are
a
Lipid Droplet Size (μm2)
#
#
#
by guest, on June 25, 2018w
ww
.jlr.orgD
ownloaded from

29
Figure 6
A
B
C
ACC1
SRB1
Control ASO ApoB ASO MTP ASO
Control ASO ApoB ASO MTP ASO0
2
4
6
8
μm
ol
3H
wa
ter
inc.
into
fatty a
cid
/hr/
gra
m W
W liv
er
μm
ol
3H
wa
ter
inc.
into
fatt
y a
cid
/hr/
gra
m W
W liv
er
Control ASO ApoB ASO MTP ASO0
2
4
6
8
10
by guest, on June 25, 2018w
ww
.jlr.orgD
ownloaded from


![Pharmacological management for agitation and … Professionals/Pharmacological... · [Intervention Review] Pharmacological management for agitation and aggression in people with acquired](https://static.fdocuments.net/doc/165x107/5a9dcaaa7f8b9a0d5a8c29c1/pharmacological-management-for-agitation-and-professionalspharmacologicalintervention.jpg)
