
Comparison of the Number of Patients with Medication ... · Comparison of the Number of Patients...
1
BACKGROUND Comparison of the Number of Patients with Medication Changes Following Comprehensive versus Targeted Medication Reviews in a Medication Therapy Management Program Allison K. Buhl, BA, PharmD Candidate 2015; 1 Jill Augustine, PharmD, MPH; 1 Chanadda Chinthammit, BSPharm; 1 Kevin P. Boesen, PharmD 1,2 1 University of Arizona College of Pharmacy, Department of Pharmacy Practice & Science; 2 SinfoníaRx OBJECTIVE METHODS RESULTS DISCUSSION CONCLUSIONS REFERENCES APhA Annual Meeting; Orlando, FL, USA; March 28-31, 2014 • To determine whether CMRs resulted in more pharmacist-initiated prescriber interventions and medication changes compared to other interventions made as a result of TMRs. Table 2. Odds Ratio Analysis • This quality improvement project compared the outcomes of CMRs to non-CMR TMR follow-ups by assessing data obtained from the MMC’s annual CMS reports. • To qualify for the MMC’s MTM services in 2012, patients needed to be Medicare Part D beneficiaries and meet health plan qualification criteria. Their prescription information needed to be received by the MMC during 2012. • Report data was pulled from the center’s software application, RxCompanion, and stored on a secure server. • The CMS reports contained the type of review conducted for each patient, CMR dates for patients who received a CMR, the number of prescriber interventions per member, and the number of post-intervention medication changes per member. • To determine the number of medication changes, RxCompanion reviewed pharmacy claims following the interventions. • Data analysis was conducted using STATA SE, version 12.1. • Odds ratios were calculated using Wilcoxon Rank Sum. • This determined the likelihood of receiving an intervention and the likelihood of having an intervention result in a medication change following a CMR or another type of TMR follow-up. Table 1. CMR vs. TMR Intervention and Medication Change Values • CMRs showed a significantly greater likelihood of resulting in a pharmacist-initiated prescriber intervention than non-CMR measures. • The non-CMR group, however, was more likely to have a prescriber intervention result in a medication change. • These results imply that other interventions may be at least as effective as CMRs in producing medication changes to favorably impact healthcare outcomes. • The limitations of this study included: • Selection bias may exist as the intervention assignment was not randomized. • The results of this study may not be fully applicable to other MTM programs with different operational procedures since data in this study was extracted from a specialized MTM program. • As this study involved a single MTM program, we cannot definitively say that TMRs have comparable efficacy to CMRs across the entire MTM population. • Many members of the CMR group also received TMRs, and the impact of TMRs on this group was not determined. 1. United States Government. Medicare Prescription Drug, Improvement, and Modernization Act of 2003. December 8, 2003. Available at: https://www.govtrack.us/congress/bills/108/hr1. Accessed June 14, 2013. 2. Centers for Medicare & Medicaid Services. Medication Therapy Management. December 19, 2013. Available at: http://www.cms.gov/Medicare/Prescription-Drug- Coverage/PrescriptionDrugCovContra/MTM.html. Accessed January 23, 2014. CMR Group Non-CMR Group Total Members 43,490 375,159 418,649 Prescriber Interventions 35,207 253,494 288,701 Interventions per Member* 0.81 0.68 0.69 % Total Interventions 12.2% 87.8% NA Medication Changes 9,796 88,467 98,263 Medication Changes per Member** 0.23 0.24 0.23 % Total Medication Changes 10.0% 90.0% NA *Analyzed using Wilcoxon rank sum. P-value < 0.001 **Analyzed using Wilcoxon rank sum. P-value = 0.12 Odds Ratio (95% Confidence Interval) Prescriber Intervention 0.70 (0.69-0.72) Medication Change 1.24 (1.21-1.28) *Analyzed using Wilcoxon rank sum. P-value < 0.001 **Analyzed using Wilcoxon rank sum. P-value = 0.12 • Since 90% of all interventions occurred in the TMR-only group, the non-CMR interventions utilized by the MMC may be more effective than CMR interventions. • As CMS looks to expand participation in MTM programs, they should consider modifying the performance metrics associated with the program by removing the CMR focus. AUTHOR DISCLOSURE • The authors have no disclosures to report. • For further information regarding this project, please contact Allison Buhl at [email protected]. • For further information regarding the MMC, please contact Kevin Boesen at [email protected]. RESULTS, cont. Figure 1. Intervention and Medication Change Comparisons Medication Therapy Management (MTM) • In 2003, the Medicare Modernization Act mandated that Medicare Part D insurance plans include MTM services to be provided by qualified healthcare professionals. 1 • Centers for Medicare and Medicaid’s (CMS) minimum qualification criteria for 2012 MTM dictated that beneficiaries have multiple chronic health conditions, multiple medications, and an annual combined drug cost of more than $3,100.20. 2 Comprehensive and Targeted Medication Reviews • Comprehensive medication reviews (CMRs) are detailed pharmacist-patient discussions covering all medications and disease states including any potential medication related problems. • Targeted medication reviews (TMRs) are systematic reviews of a patient's medication profile. Potential medication related problems identified by the review can be addressed through a CMR or other means including targeted patient consultations and direct provider outreach. • CMS has set the only MTM performance metric as a Display Measure which reports the percentage of patients who receive a CMR during the year. 2 Medication Management Center (MMC) • The MMC is an MTM provider based out of the University of Arizona College of Pharmacy. • Pharmacists, licensed pharmacy interns, and certified pharmacy technicians collaborate to deliver CMRs and other types of interventions based on potential medication related problems identified through a unique TMR process. • Non-CMR based interventions include telephonic interviews, faxes to providers, and letters to members. 0.81 0.23 0.68 0.24 0 0.1 0.2 0.3 0.4 0.5 0.6 0.7 0.8 0.9 Interventions* Medication Changes** Amount per Member CMR Group Non-CMR Group
Transcript of Comparison of the Number of Patients with Medication ... · Comparison of the Number of Patients...
BACKGROUND
Comparison of the Number of Patients with Medication Changes Following Comprehensive
versus Targeted Medication Reviews in a Medication Therapy Management Program Allison K. Buhl, BA, PharmD Candidate 2015;1 Jill Augustine, PharmD, MPH;1 Chanadda Chinthammit, BSPharm;1 Kevin P. Boesen, PharmD1,2
1University of Arizona College of Pharmacy, Department of Pharmacy Practice & Science; 2SinfoníaRx
OBJECTIVE
METHODS
RESULTS
DISCUSSION
CONCLUSIONS
REFERENCES
APhA Annual Meeting; Orlando, FL, USA; March 28-31, 2014
• To determine whether CMRs resulted in more pharmacist-initiated prescriber interventions and medication
changes compared to other interventions made as a result of TMRs.
Table 2. Odds Ratio Analysis
• This quality improvement project compared the outcomes of CMRs to non-CMR TMR follow-ups by assessing
data obtained from the MMC’s annual CMS reports.
• To qualify for the MMC’s MTM services in 2012, patients needed to be Medicare Part D beneficiaries and
meet health plan qualification criteria. Their prescription information needed to be received by the MMC
during
2012.
• Report data was pulled from the center’s software application, RxCompanion, and stored on a secure server.
• The CMS reports contained the type of review conducted for each patient, CMR dates for patients who
received a CMR, the number of prescriber interventions per member, and the number of post-intervention
medication changes per member.
• To determine the number of medication changes, RxCompanion reviewed pharmacy claims following the
interventions.
• Data analysis was conducted using STATA SE, version 12.1.
• Odds ratios were calculated using Wilcoxon Rank Sum.
• This determined the likelihood of receiving an intervention and the likelihood of having an intervention result
in a medication change following a CMR or another type of TMR follow-up.
Table 1. CMR vs. TMR Intervention and Medication Change Values
• CMRs showed a significantly greater likelihood of resulting in a pharmacist-initiated prescriber intervention than
non-CMR measures.
• The non-CMR group, however, was more likely to have a prescriber intervention result in a medication change.
• These results imply that other interventions may be at least as effective as CMRs in producing medication changes to
favorably impact healthcare outcomes.
• The limitations of this study included:
• Selection bias may exist as the intervention assignment was not randomized.
• The results of this study may not be fully applicable to other MTM programs with different operational
procedures since data in this study was extracted from a specialized MTM program.
• As this study involved a single MTM program, we cannot definitively say that TMRs have comparable efficacy to
CMRs across the entire MTM population.
• Many members of the CMR group also received TMRs, and the impact of TMRs on this group was not
determined.
1. United States Government. Medicare Prescription Drug, Improvement, and Modernization Act of 2003. December 8, 2003. Available at:
https://www.govtrack.us/congress/bills/108/hr1. Accessed June 14, 2013.
2. Centers for Medicare & Medicaid Services. Medication Therapy Management. December 19, 2013. Available at: http://www.cms.gov/Medicare/Prescription-Drug-
Coverage/PrescriptionDrugCovContra/MTM.html. Accessed January 23, 2014.
CMR Group Non-CMR Group Total
Members 43,490 375,159 418,649
Prescriber
Interventions35,207 253,494 288,701
Interventions per
Member*0.81 0.68 0.69
% Total Interventions 12.2% 87.8% NA
Medication Changes 9,796 88,467 98,263
Medication Changes
per Member**0.23 0.24 0.23
% Total Medication
Changes10.0% 90.0% NA
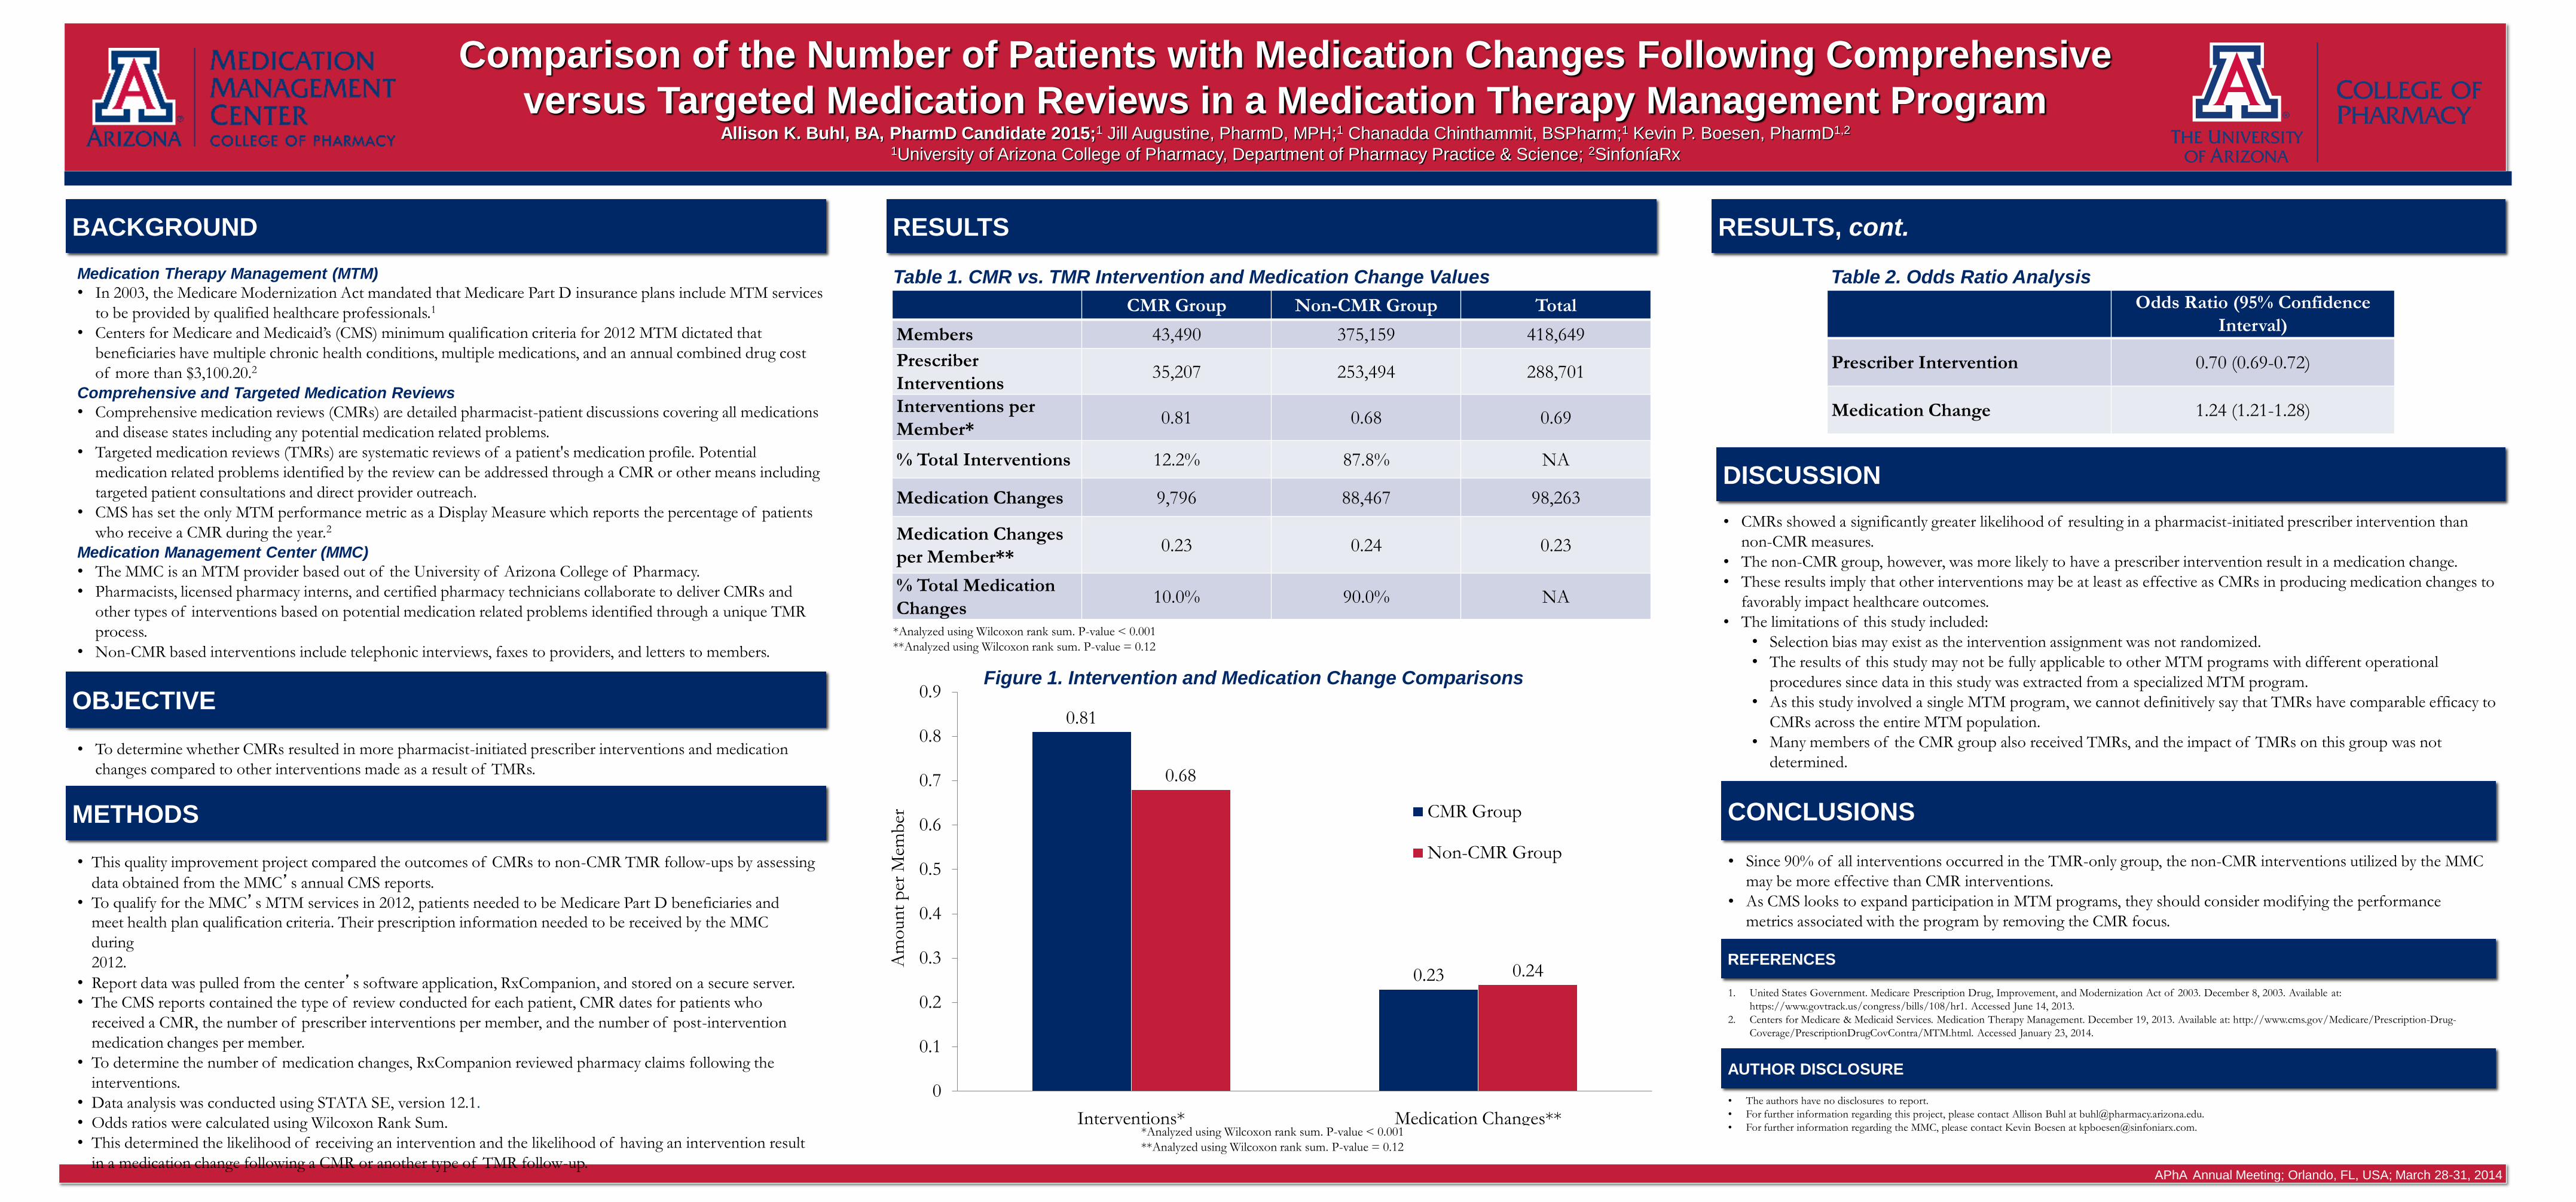
*Analyzed using Wilcoxon rank sum. P-value < 0.001
**Analyzed using Wilcoxon rank sum. P-value = 0.12
Odds Ratio (95% Confidence
Interval)
Prescriber Intervention 0.70 (0.69-0.72)
Medication Change 1.24 (1.21-1.28)
*Analyzed using Wilcoxon rank sum. P-value < 0.001
**Analyzed using Wilcoxon rank sum. P-value = 0.12
• Since 90% of all interventions occurred in the TMR-only group, the non-CMR interventions utilized by the MMC
may be more effective than CMR interventions.
• As CMS looks to expand participation in MTM programs, they should consider modifying the performance
metrics associated with the program by removing the CMR focus.
AUTHOR DISCLOSURE
• The authors have no disclosures to report.
• For further information regarding this project, please contact Allison Buhl at [email protected].
• For further information regarding the MMC, please contact Kevin Boesen at [email protected].
RESULTS, cont.
Figure 1. Intervention and Medication Change Comparisons
Medication Therapy Management (MTM)
• In 2003, the Medicare Modernization Act mandated that Medicare Part D insurance plans include MTM services
to be provided by qualified healthcare professionals.1
• Centers for Medicare and Medicaid’s (CMS) minimum qualification criteria for 2012 MTM dictated that
beneficiaries have multiple chronic health conditions, multiple medications, and an annual combined drug cost
of more than $3,100.20.2
Comprehensive and Targeted Medication Reviews
• Comprehensive medication reviews (CMRs) are detailed pharmacist-patient discussions covering all medications
and disease states including any potential medication related problems.
• Targeted medication reviews (TMRs) are systematic reviews of a patient's medication profile. Potential
medication related problems identified by the review can be addressed through a CMR or other means including
targeted patient consultations and direct provider outreach.
• CMS has set the only MTM performance metric as a Display Measure which reports the percentage of patients
who receive a CMR during the year.2
Medication Management Center (MMC)
• The MMC is an MTM provider based out of the University of Arizona College of Pharmacy.
• Pharmacists, licensed pharmacy interns, and certified pharmacy technicians collaborate to deliver CMRs and
other types of interventions based on potential medication related problems identified through a unique TMR
process.
• Non-CMR based interventions include telephonic interviews, faxes to providers, and letters to members.
0.81
0.23
0.68
0.24
0
0.1
0.2
0.3
0.4
0.5
0.6
0.7
0.8
0.9
Interventions* Medication Changes**
Am
oun
t p
er M
emb
er CMR Group
Non-CMR Group


