Comparison of technological treatment options Middlesex University, Danish Technical University,...
40
Comparison of technological treatment options Middlesex University, Danish Technical University, University of Ljubljana, ENVICAT, Anjou Recherche. ScorePP Dissemination Workshop (2-3 February 2010)
-
Upload
carla-staton -
Category
Documents
-
view
215 -
download
0
Transcript of Comparison of technological treatment options Middlesex University, Danish Technical University,...
Comparison of technological treatment options
Middlesex University, Danish Technical University, University of Ljubljana, ENVICAT, Anjou Recherche.
ScorePP Dissemination Workshop(2-3 February 2010)

To address the technologies available for eliminating the discharge of priority pollutants to receiving waters as a result of different activities and to carry out a comparative analysis to assess the most appropriate and feasible reduction technologies
Overall objectives

• Stormwater BMPs
• Greywater treatment and reuse systems for household
wastewater
• Industrial wastewater treatment
• Municipal wastewater treatments
• Sludge disposal
• Assessment of the feasibility of the different treatment
options for PPs
Treatment options considered in ScorePP

Stormwater Best Management Practices

• Stormwater control systems close to the source
• Control water quantity & quality
• Provide social amenity
• Infiltration/detention followed by discharge at a controlled rate
• Used individually, in a treatment train or in combination with conventional piped systems
Stormwater BMPs
• Structural and non-structural
• Constructed wetlands• Detention basin• Retention pond• Lagoon• Green roof• Settlement tank• Filter strips• Swales• Infiltration basins • Soakaways• Porous asphalt • Porous paving
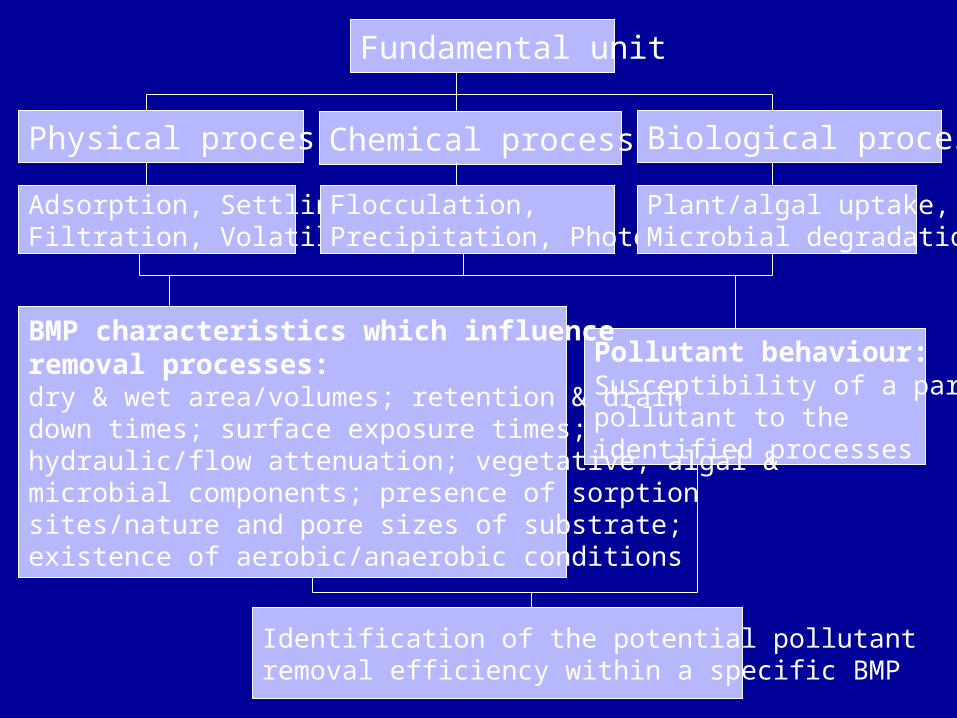
Fundamental unit
Physical processes Chemical processes Biological processes
Pollutant behaviour: Susceptibility of a particular pollutant to the identified processes
Adsorption, Settling, Filtration, Volatilisation
BMP characteristics which influence removal processes:dry & wet area/volumes; retention & drain down times; surface exposure times; hydraulic/flow attenuation; vegetative, algal & microbial components; presence of sorption sites/nature and pore sizes of substrate; existence of aerobic/anaerobic conditions
Flocculation, Precipitation, Photolysis
Plant/algal uptake, Microbial degradation
Identification of the potential pollutant removal efficiency within a specific BMP

Order of preference for the use of BMPs to remove Pb and Benzo (a) pyrene

Comparison of theoretical ranking with measured data: Organic PPs in SSF CW
Priority pollutant Matamoros et al., (2007) Score PP methodology
Removal efficiency (%)
Ranked data Ranked data
Pentachlorobenzene >99 2 1
Endosulphan >99 2 2.5
Lindane >99 2 5
Pentachlorophenol 94 4 2.5
Chlorpyrifos 83 5 4
Alachlor 80 6 7
Simazine 25 7 6
Diuron 0 8 8

• In the absence of field data, enables end-users to evaluate BMPs from the perspective of the removal of non-standard pollutants of concern; demonstrates critical discrimination across BMPs although infiltration basins and sub-surface flow constructed wetlands consistently rank most highly for the removal of priority pollutants
• BMP order of preference for the removal of PPs compares well with field data available to date but more field data required to refine and calibrate this approach
• Provides input to development of emission control strategies (e.g. ScorePP)
• Does not take into consideration the suitability of different options for specific geographical locations, e.g. potential for groundwater contamination due to infiltration in unsuitable soil type.
Summary of the ability of stormwater BMPs to remove PPs

Household Greywater Treatment and Reuse Systems
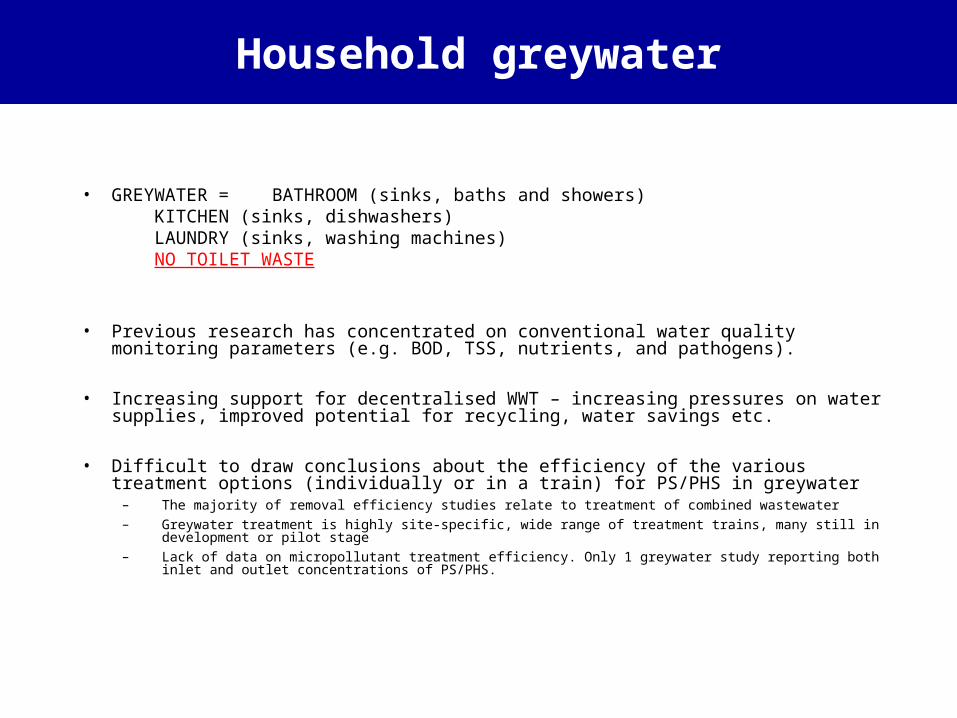
• GREYWATER = BATHROOM (sinks, baths and showers) KITCHEN (sinks, dishwashers) LAUNDRY (sinks, washing machines) NO TOILET WASTE
• Previous research has concentrated on conventional water quality monitoring parameters (e.g. BOD, TSS, nutrients, and pathogens).
• Increasing support for decentralised WWT – increasing pressures on water supplies, improved potential for recycling, water savings etc.
• Difficult to draw conclusions about the efficiency of the various treatment options (individually or in a train) for PS/PHS in greywater
– The majority of removal efficiency studies relate to treatment of combined wastewater
– Greywater treatment is highly site-specific, wide range of treatment trains, many still in development or pilot stage
– Lack of data on micropollutant treatment efficiency. Only 1 greywater study reporting both inlet and outlet concentrations of PS/PHS.
Household greywater

Priority substance properties
Priority substance
sources
GreywaterPre-treatment
systems
Recyclingsystems
Water savings
Cost-benefit analysis
Nutrient recycling
Priority substance presence
Priority substanceconcentrations/
loads
Removal efficiencies
Operationalrisks
Health risksconnections
Risks to theenvironment
Electricity consumption
Chemical consumption
Operational costs
Installation costs
InformationInformation reviewed

A6
A2 A3 A4
Primary settling tank Sand-filter
UV-filter Service water tank
A0
A1 A5
Multi-stage Rotating Biological Contactor
Secondary settling tank
A7
RBC, Nordhavnsgården, CopenhagenRBC, Nordhavnsgården, Copenhagen
•Proportional potable water use volumes and wastewater volumes based on Danish water use statistics (DANVA, 2007; Kjellerup and Hansen, 1994; Nordhavnsgården monitoring data).

GW treatment and reuse scenarios
Scenario Treatment type Source of treated greywater Reuse of treated greywater
A No treatment - -
B Indoor – RBC Bathroom Toilet
C Indoor – RBC Bathroom Toilet + Irrigation
D Indoor – RBC Bathroom Toilet + Laundry
E Indoor – RBC Bathroom + Laundry Toilet
F Indoor – RBC Bathroom + Laundry Toilet + Laundry
G Indoor – RBC Bathroom + Laundry Toilet + Irrigation
H Indoor – RBC Bathroom + Laundry Toilet + Laundry + Irrigation
I Indoor – RBC Bathroom + Laundry + Kitchen Toilet + Laundry
J Indoor – RBC Bathroom + Laundry + Kitchen Toilet + Irrigation
K Indoor – RBC Bathroom + Laundry + Kitchen Toilet + Laundry + Irrigation
L Outdoor – reedbed Bathroom Groundwater recharge
M Outdoor – reedbed Bathroom + Laundry Groundwater recharge

Example of a treatment and reuse scenario
Daily potable
water use85 l p-1 d-1
Toilet0 l p-1 d-1
Irrigation0 l p-1 d-1
Bathroom43 l p-1 d-1
Laundry17 l p-1 d-1
Kitchen25 l p-1 d-1
Irrigation7 l p-1 d-1
Laundry17 l p-1 d-1
Toilet27 l p-1 d-1
Surplus33 l p-1 d-1
Scenario K
Potable H2O saving = 51 l p-1 d-1 (43 %)WWTP influent reduction = 20 %
Municipal Wastewater
Treatment Plant61 l p-1 d-1
GreywaterTreatment
Plant85 l p-1 d-1
Sludge

Potable water
Toilet0 µg p-1 d-1
Irrigation
Bathroom3.039 µg p-1 d-1
Laundry4.65 µg p-1 d-1
Kitchen1.58 µg p-1 d-1
Irrigation0 µg p-1 d-1
Laundry0 µg p-1 d-1
Toilet11.155 µg p-1 d-1
Surplus0.109 µg p-1 d-1
Potable H2O saving = 27 l p-1 d-1 (23 %) WWTP influent reduction = 11 %
Municipal Wastewater
Treatment Plant20.229 µg p-1 d-1
GreywaterTreatment
Plant3.039 µg p-1 d-1
Sludge2.735 µg p-1 d-1
[A]
[B]
[C]
[D]
[E][F]
Greywater pollutant dynamics (cadmium)
No decrease in load to
WWTP unless sludge is removed
Decrease in WWTP Cd
influent loading of
2.74 µg p-1 d-1 Potential Cd removal
efficiency of 13.5 %

• Domestic greywater is a significant source of micropollutants to the urban water cycle but there is a lack of knowledge about micropollutant presence and fate in greywater
• Wide range of potential greywater treatment trains and reuse options; combined with the variable pollutant characteristics makes modelling difficult.
• Sludge management is critical in determining the emission barrier potential
• WFD PS/PHS not necessarily highest priority in terms of quantity used and/or risks associated with use
• Need to employ source control measures for decreasing the Greywater pollutant contents (e.g. green labeling and procurement, substitution options, information campaigns, and regulatory controls).
Summary of Greywater Treatment scenarios

On-site treatment systems for industrial wastewater

Industrial wastewater treatment processes appropriate for the removal of suspended solids and insoluble liquids (6 techniques identified as A1 to A6)
• Industrial wastewater treatment processes appropriate for the removal of inorganic/non-biodegradable/poorly biodegradable soluble pollutants (15 techniques identified as B1 to B15)
• Biodegradable soluble pollutants (4 techniques identified as C1 to C4)
Classification of BAT techniques

• CAS number• Emission String number• Production process• NOSE-P classification• Production activity• NACE classification• Possibilities for substitution• Applicable treatment processes• BREF code of relevant document• Treatment efficiency and/or achievable emission levels
Industrial wastewater treatment database for individual PPs
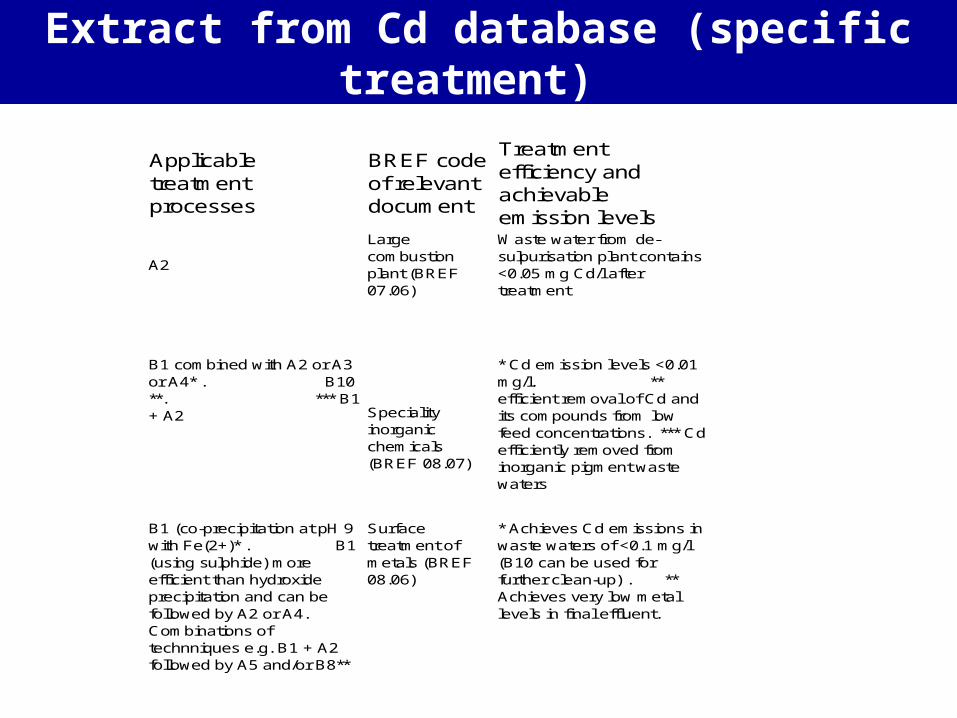
Extract from Cd database (specific treatment)
Applicable treatment processes
BREF code of relevant document
Treatment efficiency and achievable emission levels
A2
Large combustion plant (BREF 07.06)
Waste water from de-sulpurisation plant contains <0.05 mg Cd/l after treatment
B1 combined with A2 or A3 or A4* . B10 **. *** B1 + A2 Speciality
inorganic chemicals (BREF 08.07)
* Cd emission levels <0.01 mg/l. ** efficient removal of Cd and its compounds from low feed concentrations. *** Cd efficiently removed from inorganic pigment waste waters
B1 (co-precipitation at pH 9 with Fe(2+)* . B1 (using sulphide) more efficient than hydroxide precipitation and can be followed by A2 or A4. Combinations of technniques e.g. B1 + A2 followed by A5 and/or B8**
Surface treatment of metals (BREF 08.06)
* Achieves Cd emissions in waste waters of <0.1 mg/l (B10 can be used for further clean-up) . ** Achieves very low metal levels in final effluent.

Extract from Cd database (generic treatment)
A2Wastewater treatment (BREF 02.03)
98% removal
B1 dittoPerformance dependent on situation
B8 dittoNanofiltration achieves >90% removal
B9 ditto Using zeolites as adsorbent
B10 ditto
Cation exchangers (Na) give good removal of Cd and compounds at low feed concentrations
C2 ditto
>99.8% removal when sufficient sulphate present to support sulphide formation; emission levels <0.01 mg/l from influent of 1 mg/l.
Electrodialysis and Reverse Osmosis widely used for soluble Cd
Non-ferrous metal processing (BREF 12.01)
>99.8% removal
Generic treatment options for Cd
Specific treatment option for electroplating wastewaters

• Databases for 25 non-substitutable industrial PPs showing on-site reductions (removal efficiencies or achievable effluent levels) show a variability of data availability and a wide range of different performances.
• Information relating to a specific pollutant is often limited and therefore generic techniques relating to similar pollutant characteristics or overall treatment type are also included.
• The scientific principles involved in the treatment processes together with the equipment and process details are well established.
Summary of Industrial Wastewater Treatment

Municipal wastewater treatment plants

• Removal of pollutants in conventional and alternative wastewater treatment plants
• Fate of priority pollutants in different treatment stages in conventional waste water treatment plants
• Tools to predict the removal and fate of priority pollutants in WWTP
Topics addressed

Example of modelling results for primary treatment
0
20
40
60
80
100
% r
em
ov
al
pe
r m
ec
ha
nis
m
% Volatilsation % Adsorption % Biodegradation Literrature
``
STPWIN Byrns FATE
Percentage removal per mechanism during primary wastewater treatment according to the three tested models

Example of modelling results for secondary treatment
Percentage removal per mechanism during secondary wastewater treatment according to the three tested models for pollutants with log Kow < 4.5
0
20
40
60
80
100
120
met
hylen
e ch
lor.
chlo
rofo
rm
benze
ne
sim
azin
e
trich
loro
ethyl
.
atra
zine
tetra
chlo
ride
naphth
alen
e
tetra
chlo
roet
hyl.
lindan
e
endosu
lphan
chlo
rfenvi
nphosHCH
TCB
octyl
phenols
anth
race
ne
met
hylen
e ch
lor.
chlo
rofo
rm
benze
ne
sim
azin
e
trich
loro
ethyl
.
atra
zine
tetra
chlo
ride
naphth
alen
e
tetra
chlo
roet
hyl.
lindan
e
endosu
lphan
chlo
rfenvi
nphosHCH
TCB
octyl
phenols
anth
race
ne
met
hylen
e ch
lor.
chlo
rofo
rm
benze
ne
sim
azin
e
trich
loro
ethyl
.
atra
zine
tetra
chlo
ride
naphth
alen
e
tetra
chlo
roet
hyl.
lindan
e
endosu
lphan
chlo
rfenvi
nphosHCH
TCB
octyl
phenols
anth
race
ne
% r
em
ov
al
pe
r m
ec
ha
nis
m
``
STPWIN Byrns FATE

Summary of municipal wastewater treatment
• Experimental data exists for 14 of the priority substances originally identified in the WFD
• The removal and fate of an additional 19 priority substances has been predicted using a combination of models (Byrns; FATE; STPWIN)
• Overall, the data collected on 33 priority pollutants can be summarised as:– 19 pollutants presented a removal efficiency higher than 80% (benzene,
naphthalene, tetrachloroethylene, chlorfenvinphos, 1,2,4-trichlorobenzene, pentachlorophenol, endrin, p-p-DDT, fluoranthene, nonylphenols, hexachlorobenzene, 4-para-nonylphenol, benzo(b)fluoranthene, aldrin, benzo(g,h,i)perylene, o-p-DDT, DDE, DEHP and PBDE),
– 12 PPs exhibited removal efficiencies between 50 and 80% (methylene chloride, chloroform, trichloroethylene, carbon tetrachloride, lindane, α-endosulphan, HCH, octylphenols, anthracene, dieldrin, DDD and benzo(a)pyrene)
– 2 PPs (simazine and atrazine) demonstrated removal efficiencies lower than 40%.

PP behaviour in wastewater sludges
and evaluation of sludge disposal options
30
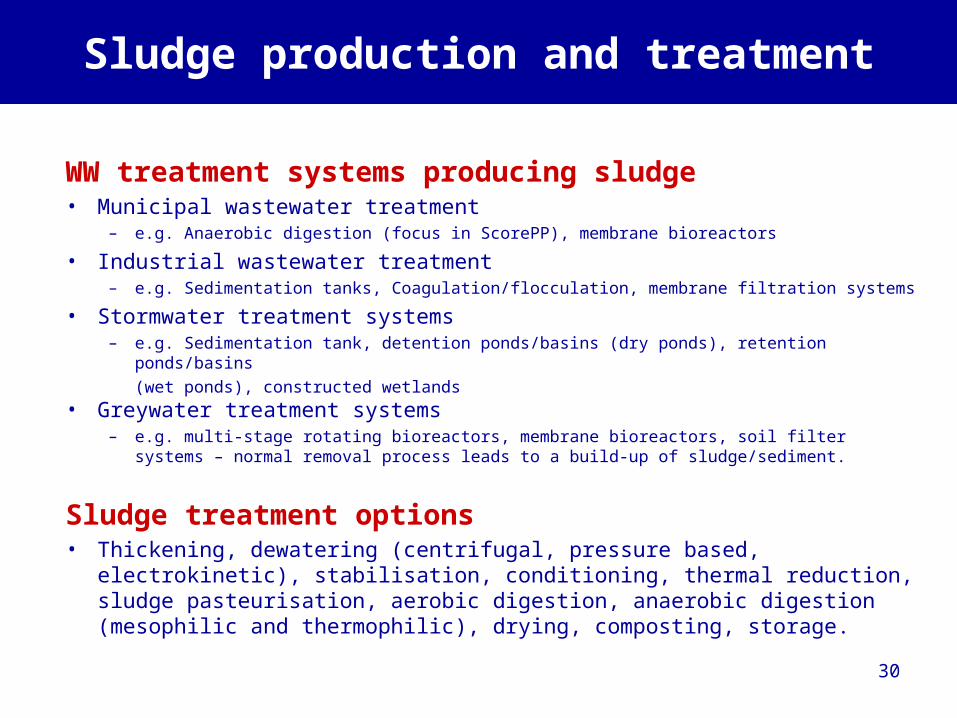
WW treatment systems producing sludge• Municipal wastewater treatment
– e.g. Anaerobic digestion (focus in ScorePP), membrane bioreactors
• Industrial wastewater treatment– e.g. Sedimentation tanks, Coagulation/flocculation, membrane filtration systems
• Stormwater treatment systems– e.g. Sedimentation tank, detention ponds/basins (dry ponds), retention ponds/basins
(wet ponds), constructed wetlands
• Greywater treatment systems– e.g. multi-stage rotating bioreactors, membrane bioreactors, soil filter systems – normal
removal process leads to a build-up of sludge/sediment.
Sludge treatment options• Thickening, dewatering (centrifugal, pressure based, electrokinetic),
stabilisation, conditioning, thermal reduction, sludge pasteurisation, aerobic digestion, anaerobic digestion (mesophilic and thermophilic), drying, composting, storage.
Sludge production and treatment

Summary of sludge treatment
• Primarily designed to reduce volume, odour and pathogenic risk prior to disposal/reuse
• Guideline limits will become increasingly stringent for sludges being disposed of by agricultural land application, landfilling or incineration.
• Reuse options encouraged where feasible e.g. sewage sludge in building materials, metal recovery from electroplating sludge, exploitable by-products.
• The sustainability of many reuse options need careful examination

Assessment of the feasibility of treatment options.

Priority Pollutant Focus
Feasibility assessment has concentrated on 12 PPs.

Agreed criteria for treatment techniques
Screening Criteria Indicators Benchmarks
Technical feasibility Extent to which appropriate technology exists
Level of establishment or development
Technical efficiency Effectiveness of treatment technology
Potential or actual ability of treatment technology to remove target PP
Financial considerations Costs associated with treatment option
Investment costs and operational/maintenance costs
Environmental impact Level of impact on receiving water quality
Average annual dilution required for receiving water to achieve EQS

Scored matrices – Lead example
Treatment type Treatment option Criteria
Tech.Feas.
Tech. Effic.
Financ.Cons.
Env.Imp.
Total score
Pre-Environmental Release Treatment* = Insufficient data available** = Data not calculable as percentage removal efficiency*** = data not calculable as a dilution rate- = Incalculable total score due to data gaps
Industrial treatments
B1 + A2 + A4 1 ** 1 3 -
B1 + A2 1 ** 1 3 -
A4 1 * 1 * -
A4 + B8 1 1 1-2 *** -
A2 1 ** 1 2 -
A4 + B1 + A2 + B10 1 ** 1* 2 -
Municipal wastewater treatment
WWTP 2 3 * 3 -
Post-Environmental Release Treatment
Stormwater BMP treatments
Retention pond 1 3 1 1 6
Infiltration trench 1 3 2 1 7
Infiltration basin 1 2 1 1 5
Porous paving 1 3 2 1 7
Filter strip 1 3 3 1 8
Swale 1 3 1-3 1 6-8
Porous asphalt 1 3 2-3 1 7-8
Settlement tank 1 3 1-2 1 6-7

• A treatment feasibility approach has been developed despite the existence of data gaps and the problems associated with non-comparability of inconsistent units
• Scoring protocols have been allocated according to the available data but may not be suitable for all situations e.g. the relevance of the local context
• Some parameters (e.g. pollutant removal efficiencies; dilution ratios) may be oversimplifications in representing specific criteria.
Summary of treatment feasibility approach

Application to substance flow analysis (SFA) approach

Treatment Barrier Database
38
Assessment of the potential treatments
Information on a selected treatment
Treatment barrier database

• A unit process based approach applied to stormwater treatment by BMPs enables removal of PHS/PS to be assessed.
• Greywater treatment and reuse can make a valuable contribution to potable water savings and WWTP flow reductions but quality improvements are strongly dependent on sludge management
• The existing BAT techniques together with developing treatment options demonstrate taht a comprehensive range of efficient options are available for the industrial control of PPs in process waters.
Conclusions

• A combination of experimental and modelling data provides relevant information regarding the removal of PHS/PS in conventional WWTPs.
• Sludge treatment needs serious future consideration as it is becoming increasingly unacceptable to practice current disposal routes for contaminated sludges.
• A treatment feasibility approach has been developed and provides the basis for a multi-criteria analysis.
Conclusions (continued)