Comparison of sensory properties of whey and soy protein ...
132
Abstract RUSSELL, TARA ALEXANDRA. Comparison of sensory properties of whey and soy protein concentrates and isolates (Under the direction of Dr. MaryAnne Drake). Whey and whey components, particularly whey proteins, are now viewed as valuable ingredients due to recent discoveries of functionality and bioactive roles. The food/beverage industry has recently recognized the application and marketing benefits of soy protein. Characterization and comparison of the flavor properties of value-added ingredients such as whey and/or soy protein are needed to identify specific ingredient applications and marketing strategies. However, minimal research has been conducted in the comparison of sensory properties of whey and soy protein. The objectives of this study were to develop a sensory lexicon for whey and soy proteins, and to identify and compare the descriptive sensory properties of whey and soy proteins. Proteins were rehydrated [10 % solids, (w/v)] and evaluated in triplicate by a highly trained sensory panel (n=10) trained to use the developed language. Twenty-four descriptive sensory attributes were identified by a descriptive panel to evaluate appearance, flavor, and texture/mouthfeel. Following identification of the lexicon, twenty-two samples (14 whey proteins and 8 soy proteins) were selected for descriptive sensory analysis. Consumer testing was used to investigate consumer (n=147) perception of whey and soy protein. Results were analyzed by univariate and multivariate analysis of variance. Both whey and soy proteins were differentiated using the identified language (p<0.05). Different sensory attributes distinguished whey proteins from soy proteins. Consumer testing results revealed that consumers were knowledgeable of distinct health benefits of dairy and soy products. The lexicon developed has application in documentation of flavor of
Transcript of Comparison of sensory properties of whey and soy protein ...

Abstract
RUSSELL, TARA ALEXANDRA. Comparison of sensory properties of whey and
soy protein concentrates and isolates (Under the direction of Dr. MaryAnne Drake).
Whey and whey components, particularly whey proteins, are now viewed as
valuable ingredients due to recent discoveries of functionality and bioactive roles. The
food/beverage industry has recently recognized the application and marketing benefits of
soy protein. Characterization and comparison of the flavor properties of value-added
ingredients such as whey and/or soy protein are needed to identify specific ingredient
applications and marketing strategies. However, minimal research has been conducted in
the comparison of sensory properties of whey and soy protein. The objectives of this
study were to develop a sensory lexicon for whey and soy proteins, and to identify and
compare the descriptive sensory properties of whey and soy proteins. Proteins were
rehydrated [10 % solids, (w/v)] and evaluated in triplicate by a highly trained sensory
panel (n=10) trained to use the developed language. Twenty-four descriptive sensory
attributes were identified by a descriptive panel to evaluate appearance, flavor, and
texture/mouthfeel. Following identification of the lexicon, twenty-two samples (14 whey
proteins and 8 soy proteins) were selected for descriptive sensory analysis. Consumer
testing was used to investigate consumer (n=147) perception of whey and soy protein.
Results were analyzed by univariate and multivariate analysis of variance. Both whey
and soy proteins were differentiated using the identified language (p<0.05). Different
sensory attributes distinguished whey proteins from soy proteins. Consumer testing
results revealed that consumers were knowledgeable of distinct health benefits of dairy
and soy products. The lexicon developed has application in documentation of flavor of

products containing whey and/or soy protein concentrate or isolate, thus facilitating a
common language for improved quality assurance within the food/beverage industry.
Results os this study will also enhance ongoing research and product development with
these nutritional and functional ingredients.

Comparison of sensory properties of whey and soy protein concentrates and isolates
by
Tara Alexandra Russell
A thesis submitted to the Graduate Faculty of North Carolina State University
in partial fulfillment of the requirements for the Degree of Master of Science
Department of Food Science
Raleigh
2004
APPROVED BY:
____________________
Dr. M.A. Drake Chair of Advisory Committee
____________________ _____________________
Dr. L.A. Jaykus Dr. T.H. Sanders

Biography
Tara Alexandra Russell was born on April, 19, 1976 in Canandaigua, New York to
Rosemarie and Timothy Russell. Tara has two younger sisters, identical twins, Tiffany
Russell and Amy Kimble, and a younger brother, Timothy Russell II.
Tara graduated from Canandaigua Academy in 1994. In pursuit of a career in the medical
field, she graduated with a Bachelor of Science in Food science from North Carolina
State University. After years of Business management in the medical field, she returned
to NC State and found her passion for sensory analysis through her mentor Dr.
MaryAnne Drake. Tara begun her graduate degree with the Department of Food Science
at North Carolina State University in 2002, with an Interdisciplinary minor consisting of
both Business and Statistics.
ii

Acknowledgements
The author wishes to express her deepest gratitude to her parents, Rosemarie and
Timothy Russell, for their support, guidance, and unconditional love. Ms. Russell would
like to thank her sibilings, Tiffany, Amy, and Tim, and also her uncle, Craig Dayton, for
their support throughout the years. She would also like to thank her daughter, Alexandra
Rose Russell, for her enthusiastic spirit, energy, and love.
The author especially thanks Dr. Maryanne Drake for her guidance, mentorship, support,
and her passion for sensory. She would also like to thank, Dr. LeeAnn Jaykus for her
dedication in the author’s aspirations, friendship, and words of encouragement and
support throughout the years. Many thanks to Dr. Tim Sanders, Dr. Jon Allen, Peggy
Begin, Lynette Kleman, Dr. Kelly Stevens, Shane Judd, Domenick Luccarelli, Joy
Wright, Mary Carunchia-Whetsine, Janine Beucler, Nikkishia Young, and Michele
Keziah. Special thanks to Joel Campbell for his love, confidence, and support in the
author.
iii

Table of Contents
Page
List of Tables . . . . . . . . . . vi List of Figures . . . . . . . . . vii Chapter 1. Introduction . . . . . . . . 1
Review of Literature . . . . . . . . 3 Whey . . . . . . . . . 3 Whey History . . . . . . . 3 Whey Production . . . . . . 4 Types of Whey and Whey Products . . . . 4 Components of Whey (Composition) . . . . 9 Whey Processing . . . . . . 13 Properties and Applications . . . . . 17 Whey Flavor (Analysis) . . . . . 19 Sensory Analysis . . . . . . 22 Sensory Analysis of Whey . . . . . 24 Health Benefits . . . . . . 25 Soy . . . . . . . . . 26 Soy History . . . . . . . 26 Soy Production . . . . . . 27 Types of Soy Products . . . . . 28 Components of Soy (Composition) . . . . 31 Properties and Applications . . . . . 33 Processing of Soy . . . . . . 34
Soybean Oil Extraction . . . . . 37 Flavor of Soy . . . . . . . 39 Health Benefits . . . . . . 41
Cost of Soy . . . . . . . 45 Sensory Analysis of Soy . . . . . 46
Conclusion . . . . . . . . . 48 References . . . . . . . . . 49
Chapter 2. Manuscript Comparison of sensory properties of whey and soy protein concentrates and isolates . . . . . . . . 58
Abstract . . . . . . . . . 59 Introduction . . . . . . . . . 60 Materials and Methods . . . . . . . 62 Sample Acquisition . . . . . . . 62 Sample Preparation . . . . . . . 63 Lexicon Development . . . . . . . 63 Descriptive Sensory Analysis . . . . . . 63 Consumer Testing . . . . . . . 64 Proximate Analysis . . . . . . . 65
iv

Statistical Analysis . . . . . . . 66 Results and Discussion . . . . . . 66
Conclusion . . . . . . . . 72 References . . . . . . . . 73
Appendices . . . . . . . . . .114 Appendix 1 . . . . . . . . . .115 Appendix 2 . . . . . . . . . .116 Appendix 3 . . . . . . . . . .117 Appendix 4 . . . . . . . . . .120 Appendix 5 . . . . . . . . . .123
v

List of Tables Page
Literature Review . . . . . . . . . 75 Table 1. Composition of liquid whey . . . . . . 76 Table 2. United States exports of whey product by country . . . 77 Table 3. Types of whey protein . . . . . . 78 Table 4. Nutritional composition of whey protein products . . . 79 Table 5. Composition of whey protein concentrate 80% (WPC80) and whey protein isolate (WPI) . . . 81 Table 6. Branched chain amino acid content of key proteins . . . 82 Table 7. PDCAAS values of various proteins . . . . 83 Table 8. Composition of commercial soy protein products . . . 85 Table 9. Functional properties of soy protein concentrate and soy protein . 86 Table 10. Composition in Soy Products . . . . . 88 Manuscript . . . . . . . . . . 89 Table 1. Soy proteins acquired for initial sensory language development . 90 Table 2. Whey proteins acquired for initial sensory language development . 91 Table 3. Initial whey and soy protein lexicon identified from roundtable discussion of 50 whey and soy proteins . . 92 Table 4. Products selected for descriptive sensory analysis . . . 93 Table 5. Lexicon for whey and soy proteins (WPC80, WPI, SPC, and SPI) . 94 Table 6. Proximate analysis results for whey and soy proteins . . 95 Table 7. Mean values of descriptive sensory attributes for whey and soy proteins . . . . . . 98 Table 8. Eigenvector loadings of each attribute for whey and soy protein principle component analysis . . . . 99 Table 9. Eigenvector loadings of each attribute for sensory analysis of whey proteins (WPC and WPI) . . .101 Table 10. Eigenvector loadings of each attribute for sensory analysis of
soy proteins (SPC and SPI) . . . .104 Table 11. Correlations between descriptive sensory attributes of whey and
soy proteins . . . . .106 Table 12. Correlations between descriptive sensory attributes of whey proteins . . . . . .107 Table 13. Correlations between descriptive sensory attributes of soy proteins . . . . .108 Table 14. Demographic information and consumer knowledge of soy and whey protein and protein products (n = 147) . .109 Table 15. Rank score of health claims that influence purchase intent of protein bars . . . . .112 Table 16. Ranking score of product features that influence purchase intent of protein bars . . . . . .113
vi

List of Figures Page
Literature Review . . . . . . . . . 75 Figure 1. Processing of whey powders. . . . . . 80 Figure 2. Composition of a soybean . . . . . . 84 Figure 3. Soy processing products . . . . . . 87 Manuscript . . . . . . . . . . 94 Figure 1. Principal component biplot of descriptive analysis of whey and soy proteins (PC1 and PC2) . . . . . 96 Figure 2. Principal component biplot of descriptive analysis of whey and soy proteins (PC3 and PC4) . . . . . 97 Figure 3. Principal component biplot of descriptive analysis of whey proteins (PC1 and PC2) . . . . . .100 Figure 4. Principal component biplot of descriptive analysis of whey proteins (PC3 and PC4) . . . . . .102 Figure 5. Principal component biplot of descriptive analysis of soy proteins (PC1 and PC2) . . . . . .103 Figure 6. Principal component biplot of descriptive analysis of soy proteins (PC3 and PC4) . . . . . .104
vii
1
Chapter 1. Introduction
In previous years, whey was an insignificant by-product of cheese making, used
mainly in animal feed or discarded (National Dairy Council, 2003). With advances in
technology and recent discoveries of functional and bioactive roles for whey, whey and
whey components are now viewed as valuable ingredients. The recognition of whey as a
source of unique physiological and functional attributes has increased incorporation of
whey and whey components into a variety of foods. Whey protein concentrate (WPC)
and whey protein isolate (WPI) are high protein, low-carbohydrate ingredients that are
currently in demand due to increased awareness of nutrition and alternative methods for
weight control. Dairy products, especially whey protein products, contain high
concentrations of vitamins and minerals.
Many consumers have chosen to take more control over managing their health
through diet, especially with the new diet techniques, such as low-carbohydrate high
protein diets. Consumers desiring to lower their cholesterol levels through diet often turn
to foods such as soy products. Soy protein is a functional ingredient that provides a wide
range of functional and nutritional properties. Soy has a variety of health benefits;
therefore, FDA approval of soy health claims has been a key driving force for an upward
trend in soy consumption. Both soy protein concentrate (SPC) and soy protein isolate
(SPI) are cost effective and offer unique amino acid profiles. Processing of SPC and SPI
from soybeans is not as complex as processing WPC and WPI. However, both whey and
soy proteins are abundant within the United States (U.S.).
The total number of consumers purchasing nutraceutical products such as whey is
increasing. This new market growth of functional nutraceutical products includes a wide

2
variety of foods from meal replacement bars to beverages. However, consumer trends are
drifting towards nutraceutical products that offer an innovative taste (Williams, 2001).
Characterization of flavor and flavor variability of whey and soy protein are crucial to
development of products containing there ingredients. Consumer perception of these
products is crucial to effectively design and market ingredient applications for whey and
soy proteins.

3
Literature Review
Whey
Whey History
Whey is the greenish-yellow colored liquid which is drained off of the coagulated
cheese curd during the cheese making process (Smithers et al., 1996). Whey, theoretically
has a bland flavor (Laye et al., 1995) but rapidly oxidizes, forming stale off-flavors (Morr
and Ha, 1991). Whey contains nearly half of all solids found in whole milk (Chandan,
1997). The majority of the solids found in whey are proteins, fat, minerals, and lactose
(Table 1).
For years, the disposal of liquid whey was problematic and often discharged into
local waterways, ocean/seas, and fields, or was used in animal feed (Smithers et al.,
1996). Discharging whey into lakes and rivers removed the economic burden of
disposing of whey in waste treatment facilities. Over the past few years, the
Environmental Protection Act (EPA) has placed restrictions on land-spreading as a
method for whey disposal, which is an incentive to find other uses for whey and whey
products (Casper, 1999).
Whey cannot be used in liquid form so it is spray dried into whey powder
(Smithers et al., 1996). The composition of whey powder can be further altered to
concentrate specific whey components. These processes have resulted in various
applications of whey making it economically convenient to use whey in human food
since it contains a high concentration of protein. A popular but low financial return for
manufacturing companies is the use of whey in animal feed.

4
Whey Production
The U.S. is recognized as the leading whey producer in the world (American
Dairy Products Institute, 1998a). Since the 1970’s, whey production in the United States
has more than tripled (American Dairy Products Institute, 1998a). More than one quarter
of the world’s whey and lactose is manufactured at over 200 facilities in the U.S.
(USDEC, 2003). The continuing long-term trend of U.S. whey exports attests to the high
quality and increasing use of U.S. whey products. From 1998-2001, total U.S. dry whey
exports grew 46% (USDEC, 2003). The U.S. is the top whey supplier in a large number
of countries where the food and beverage manufacturing sector is dynamic and
innovative. Each year, more than 80 billion liters of whey are produced worldwide
(Smithers et al., 1996). deWit (1998) estimated that 700,000 tons of the true whey
proteins produced worldwide are available for use as ingredients in food. The United
States Export Dairy Council (USDEC, 2003) reported 5.6 tons of whey protein
concentrates exported in 1996 compared to 24.5 tons exported in 2001 (Table 2). The
cost of whey protein varies depending on milk prices. Currently, the demand for a higher
protein, lower carbohydrate diet in the marketplace has further increased whey protein
value. WPC80 (whey protein concentrate 80%) is valued at approximately $2.50/lb
(Davisco Foods International, MN, 2004) and WPI is approximately $4.50/lb (Davisco
Foods International, MN, 2004).
Types of Whey and Whey Products
There are many types of cheese, and thus there are many sources of whey. The
latest technology allows suppliers to vary the protein, mineral, and fat levels in their

5
whey products. U.S. whey suppliers can modify whey product composition and
functionality through such technologies as demineralizing, crystallizing, or ultrafiltration.
Whey products can range in protein levels from less than 12% to over 90%, and mineral
levels between 1% and 28% (Table 3, USDEC, 2003). Modified whey products with
enhanced functional and nutritional characteristics are also widely available and typically
customized for optimal performance (USDEC, 2003). There are two basic types of liquid
whey: sweet whey and acid whey. Various types of whey powders include sweet whey
powder, acid whey powder, whey protein concentrate (WPC), WPC34, WPC50, WPC60,
WPC75, WPC80, and whey protein isolate (WPI) (USDEC, 2003).
There are different whey products currently being manufactured, but liquid whey
or whey powder was previously considered a by-product of the cheese making process. It
was not until the 1970s that the use of liquid whey changed from being disposed of in the
municipal water systems to use in food products (McDonough et al., 1974). Currently,
most liquid whey is spray dried and used in a variety of food products (Varnam and
Sutherland, 1994). Liquid whey contains approximately 93% water, 0.6% protein,
(Huffman, 1996) and 0.05% fat (Smithers et al., 1996). The main functional component
of liquid whey is the high level of calcium and B vitamins (Sienkiewicz and Riedel,
1990). Liquid whey and whey powders have relatively low protein content and limited
functional properties so they are not used in food products as often as WPC or WPI
(Varnam and Sutherland, 1994).
Two principal types of liquid whey are sweet whey and acid whey. Both originate
from the manufacturing process of natural cheese or rennet casein. Both sweet whey
powder and acid whey powder are made by drying fresh whey. Acid whey by definition

6
has a pH of 5.1 or lower. Acid whey is a by-product of the manufacturing process of acid
casein or directly acidified cheeses such as cottage and cream cheese (Mulvihill, 1992)
and contains all the original constituents of acid whey except the water (USDEC, 2003).
Acid whey is made by acidifying milk to a pH of 4.6, at which point the casein
coagulates and precipitates. Acid whey is higher in mineral content, especially calcium
phosphate than sweet whey. Acid whey can be used in snack foods, salad dressings, and
frozen entrees. The protein content of acid whey is 11-13.5% which is similar to the
range of sweet whey powder at 11-14.5% (Table 4) (USDEC, 2003).
Sweet whey is an off-white to cream-colored product and is manufactured by
removing a substantial portion of water from fresh sweet whey; which is the whey
separated from the production of renneted cheeses (American Dairy Products Institue,
1998a). Sweet whey is most commonly used in the food industry and has a pH of 5.8-6.3
and a titratable acidity of 0.1 (Varnam and Sutherland, 1994). Sweet whey powder has a
fat content of 1-1.5% which is higher than acid whey powder (0.5-1%) (Table 4)
(USDEC 2003). An equal amount of protein, 11-13.5% exists in both sweet whey and
acid whey, however the lactose content is higher in sweet whey (63-75%).
Two other types of liquid whey are demineralized whey and reduced lactose whey.
Demineralized whey, a reduced mineral whey, is obtained by the removal of a portion of
minerals from pasteurized whey (USDEC, 2003). Demineralized whey is produced by
separation techniques such as ion exchange (Varnam and Sutherland, 1994) and must not
exceed 7% ash content (USDEC, 2003). The primary use of demineralized whey is for
use in a food matrix where mineral content and concentration are crucial. Products in
which demineralized whey is used include infant foods, diet food formulations, and
7
prepared dried mixes. Reduced-lactose whey, also known as mineral concentrated whey,
is a cream to dark cream-colored product and is manufactured by drying whey that has
been treated to remove a portion of the lactose (American Dairy Products Institute,
1998a). The lactose content of the dry product is less than 60% (dry weight) and is
removed by physical separation techniques such as precipitation, filtration or dialysis
(American Dairy Products Institute, 1998a; USDEC, 2003). This type of whey has
become increasingly popular as a nutritional ingredient in products such as powdered
beverages, sauces, meats, baked goods and others (USDEC, 2003).
Liquid whey can be further processed into spray dried products such as whey
protein concentrate (WPC), WPC34, WPC50, WPC60, WPC75, WPC80, and whey
protein isolate (WPI). Whey protein that is concentrated to a protein content ranging from
35-80% is referred to as whey protein concentrate (WPC). WPC is white to light cream in
color with a purportedly bland and generally clean flavor. Five WPC types exist, WPC 34,
WPC 50, WPC 60, WPC 75, and WPC80. All types are produced by membrane
separation processes whereby non-protein constituents are filtered out from pasteurized
liquid whey (Figure 1) (USDEC, 2003) followed by a clarification process to remove any
cheese fines. The whey is then evaporated to concentrate the solids before spray drying
(Huffman, 1996). The finished dry product may contain 34 to 80% protein depending on
the product (Table 4). The composition of non-fat dry milk is comparable to WPC34, and
WPC34 has been used as a milk substitute. WPC50 contains 50-53% protein, 35%
lactose, 5% fat, and 7% ash. WPC80 contains the greatest amount of protein, 80%,
compared to the five types listed previously. WPC80 has a fat content of 4% to 8%.
Production of WPC80 is essentially the same as WPC34 and WPC50, whereby protein is

8
concentrated though physical separation techniques such as precipitation, filtration, ion
exchange or dialysis. After the ultrafilteration step, a diafiltration step is added in the
production of WPC80 for the purpose of concentrating the protein from 50% to 80%
(Huffman, 1996). Acidity can also be adjusted in all types of WPC by the addition of safe
and suitable pH ingredients (USDEC, 2003).
Another whey product is whey protein isolate (WPI). Like WPC, WPI is white to
cream in color with a purportedly bland and generally clean flavor. The protein content of
WPI is higher than WPC, containing no less than 90% protein. WPI has a lactose content
of 0.5% which is lower than that of WPC 80%. WPI has a fat content of 0.5% to 1% and
less than 1% lactose (USDEC, 2003). The USDEC (2003) recommends that after any
type of processing, whey protein powder be stored in temperatures less than 27°C and in
a dry, cool environment with a relative humidity less than 65%. The moisture content is
approximately 4.5% for both WPC and WPI (Table 5) (USDEC, 2003). WPI is produced
in a similar manner to WPC; however, two additional steps are needed. In the first step,
whey undergoes a microfiltration process that reduces the fat content. In the second step,
residual lactose is removed by lactose hydrolysis (USDEC, 2003). The individual
components of liquid whey can also be marketed and include lactose, minerals, and
specific proteins (lactoferrin, lactoperoxidase, glycomoacropeptide (GMP), α-
lactoglobulin and β-lactoglobulin). The components of whey will be discussed in the next
section, however liquid or spray dried whey permeate is also considered a type of whey.
Whey permeate (WP), a deproteinized lactose solution of whey (El-Salam, 1995),
is composed of 59% lactose, 10% protein, and 27% ash (USDEC, 2003). WP primarily
consists of lactose in a water solution with various minerals and soluble nitrogen
9
(Fitzpatrick and Smith, 2001; Fitzpatrick and O’Keefe, 2001; Geilman, 1992) and is a by-
product of the production of WPC and WPI. WP can be in liquid or spray dried form,
both having different compositions. Liquid WP is comprised of lactose (4.8%) and
minerals (0.5%) (Macedo, 2002) and spray dried WP has 6.35-8.6% ash and 37% lactose
(El-Salam, 1985). WP mineral content consists of sodium, potassium and citrate in
concentrations similar to skim milk (El-Salam, 1985). The temperature at which WP is
produced will vary the concentration of each mineral.
WP can also be called modified whey and consists of two major products, feed
grade and food grade. Food grade permeate has a very low protein content of 3.5 to 8%
but a range of 65 to 85% lactose (USDEC, 2003). WP accounts for approximately 90% of
the liquid whey volume and WP from the production of WPC and WPI contains
approximately 4% non-protein nitrogenous materials (Chandan, 1997). WP has a
relatively high concentration of salts and non-protein-nitrogen (NPN, a protein derived
from non protein sources), particularly if the permeate is from acid whey (Hardham,
1998). WP is a by-product of whey protein concentrate, a source of dairy solids
consisting of 59% lactose, 10 % protein, and 27% ash (dry weight), and is obtained by
the removal of protein, selected minerals and lactose from whey (Chapter 4, USDEC,
2003). WP is cost efficient and can be used as a replacement for many dairy solid
applications such as sports drinks, bakery, and confectionary products (Von Elbe, 2001).
Components of Whey
The composition of whey protein products varies depending on several factors,
including the source of the milk, production method, type of cheese, and manufacturer’s
10
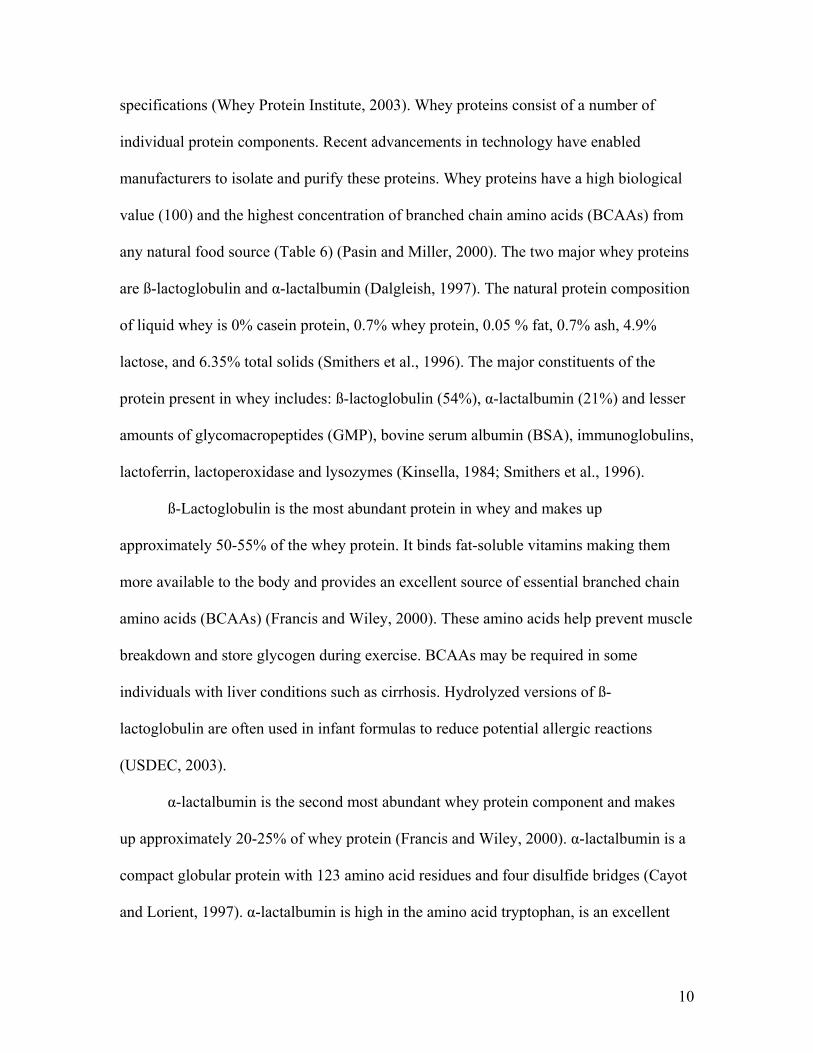
specifications (Whey Protein Institute, 2003). Whey proteins consist of a number of
individual protein components. Recent advancements in technology have enabled
manufacturers to isolate and purify these proteins. Whey proteins have a high biological
value (100) and the highest concentration of branched chain amino acids (BCAAs) from
any natural food source (Table 6) (Pasin and Miller, 2000). The two major whey proteins
are ß-lactoglobulin and α-lactalbumin (Dalgleish, 1997). The natural protein composition
of liquid whey is 0% casein protein, 0.7% whey protein, 0.05 % fat, 0.7% ash, 4.9%
lactose, and 6.35% total solids (Smithers et al., 1996). The major constituents of the
protein present in whey includes: ß-lactoglobulin (54%), α-lactalbumin (21%) and lesser
amounts of glycomacropeptides (GMP), bovine serum albumin (BSA), immunoglobulins,
lactoferrin, lactoperoxidase and lysozymes (Kinsella, 1984; Smithers et al., 1996).
ß-Lactoglobulin is the most abundant protein in whey and makes up
approximately 50-55% of the whey protein. It binds fat-soluble vitamins making them
more available to the body and provides an excellent source of essential branched chain
amino acids (BCAAs) (Francis and Wiley, 2000). These amino acids help prevent muscle
breakdown and store glycogen during exercise. BCAAs may be required in some
individuals with liver conditions such as cirrhosis. Hydrolyzed versions of ß-
lactoglobulin are often used in infant formulas to reduce potential allergic reactions
(USDEC, 2003).
α-lactalbumin is the second most abundant whey protein component and makes
up approximately 20-25% of whey protein (Francis and Wiley, 2000). α-lactalbumin is a
compact globular protein with 123 amino acid residues and four disulfide bridges (Cayot
and Lorient, 1997). α-lactalbumin is high in the amino acid tryptophan, is an excellent

11
source of essential amino acids, and is the primary protein found in human breast milk
(Dalgleish et al, 1997;USDEC, 2003). One of the key benefits of α-lactalbumin is that it
is the only whey protein component capable of binding calcium (DMI, 2003), making it
essential for delivery of calcium to the fetus and infant.
Glycomacropeptide (GMP) is a minor protein component, comprising 15-20% of
whey protein (Burrington, 2000; USDEC, 2003). It is produced during the production of
renneted cheeses from the reaction of chymosin rennet with κ-casein (Pasin, 2000). GMP
can be found in sweet whey but not acid whey since acid whey is formed when the pH is
lowered to 4.6 causing isoelectric precipitation of casein rather than rennet hydrolysis
(Walzem, 1999). GMP is a biologically active protein that positively affects the digestive
system by suppressing the appetite. Therefore, GMP is considered to be a "digestion
regulator". GMP promotes excretion of a pancreatic hormone called cholecystokinin,
which causes a feeling of satiety (Walzem, 1999; Pasin, 2000; Burrington, USDEC 2003).
Another positive effect of GMP is that it helps control and inhibit the formation of dental
plaque and dental cavities (DMI, 2003).
Bovine serum albumin (BSA) consists of 582 amino acid residues with one free
sulfhydryl group and 17 intramolecular disulfide bonds (Cayot and Lorient, 1997).
Approximately 5-10% of whey protein is BSA, the smallest protein component of whey.
Nevertheless, BSA has valuable fat binding properties (Francis and Wiley, 2000). BSA
can be reversibly denatured by heat or by adding acid or base at 40-50°C (Cayot and
Lorient, 1997). BSA also functions to bind fatty acids in the production of the antioxidant
glutathione (Frank, 2001; Whey Protein Institue, 2001).
12
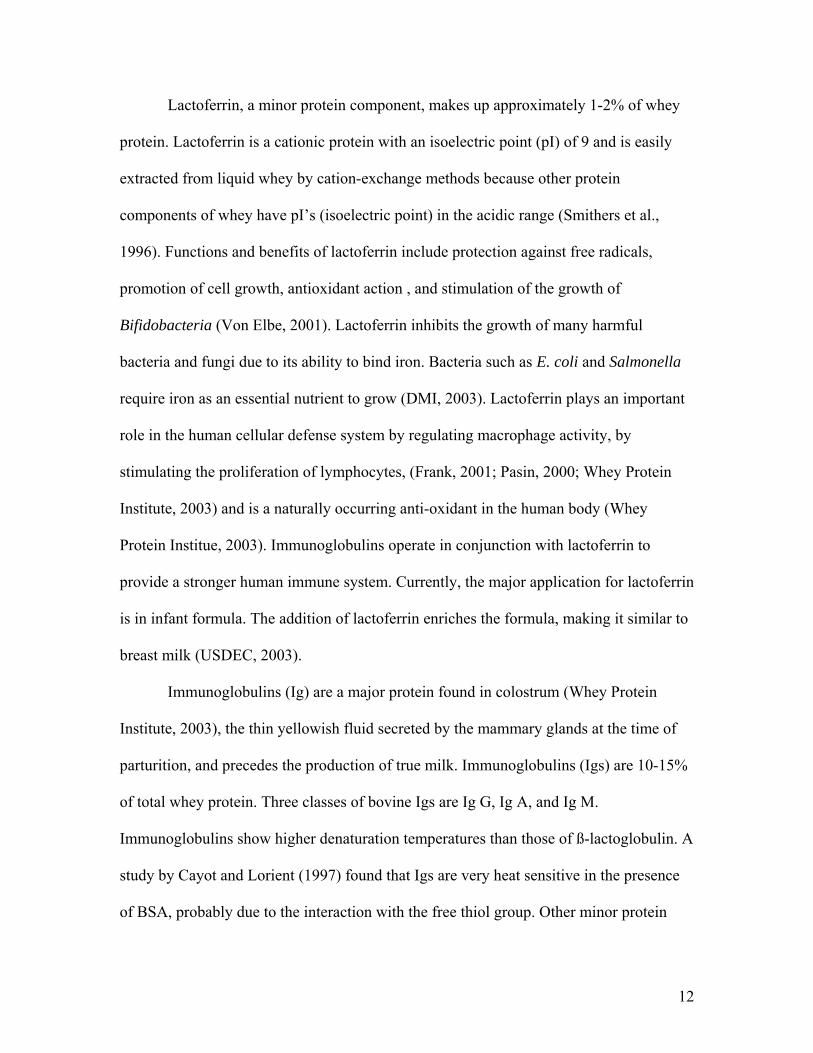
Lactoferrin, a minor protein component, makes up approximately 1-2% of whey
protein. Lactoferrin is a cationic protein with an isoelectric point (pI) of 9 and is easily
extracted from liquid whey by cation-exchange methods because other protein
components of whey have pI’s (isoelectric point) in the acidic range (Smithers et al.,
1996). Functions and benefits of lactoferrin include protection against free radicals,
promotion of cell growth, antioxidant action , and stimulation of the growth of
Bifidobacteria (Von Elbe, 2001). Lactoferrin inhibits the growth of many harmful
bacteria and fungi due to its ability to bind iron. Bacteria such as E. coli and Salmonella
require iron as an essential nutrient to grow (DMI, 2003). Lactoferrin plays an important
role in the human cellular defense system by regulating macrophage activity, by
stimulating the proliferation of lymphocytes, (Frank, 2001; Pasin, 2000; Whey Protein
Institute, 2003) and is a naturally occurring anti-oxidant in the human body (Whey
Protein Institue, 2003). Immunoglobulins operate in conjunction with lactoferrin to
provide a stronger human immune system. Currently, the major application for lactoferrin
is in infant formula. The addition of lactoferrin enriches the formula, making it similar to
breast milk (USDEC, 2003).
Immunoglobulins (Ig) are a major protein found in colostrum (Whey Protein
Institute, 2003), the thin yellowish fluid secreted by the mammary glands at the time of
parturition, and precedes the production of true milk. Immunoglobulins (Igs) are 10-15%
of total whey protein. Three classes of bovine Igs are Ig G, Ig A, and Ig M.
Immunoglobulins show higher denaturation temperatures than those of ß-lactoglobulin. A
study by Cayot and Lorient (1997) found that Igs are very heat sensitive in the presence
of BSA, probably due to the interaction with the free thiol group. Other minor protein

13
constituents of whey protein are lactoperoxidase (0.5%) and lysozyme (>0.1%) (DMI,
2003). Lactoperoxidase is commonly known as a natural antimicrobial agent.
Processing Whey
Processing steps can alter the characteristics of whey products. These steps
include heating, pH, and chemical treatments which can result in the modification of
whey protein structure and functionality. Whey powder has a high mineral content,
therefore a demineralization step must be used before whey can be used in many food
and/or beverage applications. Removal of a portion of the minerals will yield
demineralized whey, consisting of 11% fat, 70% lactose, 0.5% fat, and 3% moisture
(USDEC, 2003). Demineralization can be conducted by a variety of different methods
such as electrodialysis, diafiltration or ion exchange (Walzem, 2003; USDEC 2003).
Once demineralization has occurred, concentration, crystallization, and spray drying are
carried out to obtain the final product, demineralized whey powder (Walzem, 2003;
USDEC, 2003).
Dried whey ingredients are manufactured after pasteurization and clarification of
liquid whey (Laye et al., 1995). After clarification and pasteurization, liquid whey is
cooled and held to stabilize the calcium phosphate complex. Much of the liquid whey
produced cannot be used in its liquid form and is spray dried into whey powder (Smithers
et al., 1996). The pH is adjusted to 6.0 in order to stabilize calcium phosphate and remove
phospholipoproteins (Cayot and Lorient, 1997). Phospholipoproteins are released from
the milk fat globule membrane into the whey during cheese making (Morr & Ha, 1991).
These phopholipoproteins, along with small sized milk fat globules that are not removed

14
from the whey, are concentrated along with protein in the retentate fraction during
ultrafiltration (UF) of liquid whey. By removing the phopholipoproteins from cheese
whey prior to UF and diafiltration (DF) in the manufacture of WPC and WPI,
improvements are made in compositional and functional properties (Morr & Foegeding,
1990). Removal of lipids and other constituents allows for an increase in flavor stability
and overall a better functional whey protein product.
There are several industrial methods suitable to selectively further concentrate the
whey protein including, ultrafiltration (UF), ion exchange (IE), and microfiltration (MF).
The most commonly used method is UF, where low molecular weight compounds such as
lactose, minerals, non-protein nitrogen, and vitamins are filtered from the whey to form
the permeate and the proteins are concentrated in the retentate (McDonough, 1974).
During UF, whey is pumped or filtered through a low molecular weight membrane
filtration unit which causes the whey to divide into the retentate (a protein concentrate)
and a permeate (the lactose and mineral part) (Chandan, 1997; McDonough, 1974).
Nearly all true protein, fat, and colloidal salts are retained in the retentate, while water-
soluble vitamins and selected minerals are fractioned between the retentate and the
permeate. The extent of this division depends on the initial composition, molecular
weight and concentration of the components (Patel, 1997). The byproducts of whey
protein production, i.e., lactose, minerals, non-protein nitrogen and vitamins, which are
filtered from the whey, are together called permeate (McDonough, 1974).
The retentate (a protein concentrate) is comprised of protein, fat, colloidal salts,
fat soluble vitamins, and selected minerals. After pasteurization, the retentate may be
evaporated and then spray-dried. Spray drying is conducted at a lower temperature than

15
milk spray drying to avoid protein denaturation (DMI, 2003). WPC is manufactured by
spray drying the resulting products after the removal of sufficient non-protein
constituents from pasteurized whey so that the finished dry product contains greater than
25% protein. The non-protein constituents are removed by physical separation techniques
such as precipitation, filtration or dialysis. Safe and suitable pH-adjusting ingredients
may be used to adjust the acidity of WPC.
WPI is obtained by removing sufficient non-protein constituents from whey so
that the finished dry product contains no less than 90% protein (Burrington, 2000). WPI
contains greater than 90% protein and typically contains less lactose than other whey
ingredients, usually around 4% (Morr and Foegeding, 1990). The fat is first removed by
microfiltration and the whey is then ultrafiltered and diafiltered to recover the minerals
and lactose (deWit and Moulin, 2001). Two other processes, electrodialysis and ion
exchange can be used. In addition to concentrating protein and fractionating whey into
individual proteins, whey protein ingredients like WPC and WPI can be subjected to
controlled enzyme hydrolysis in order to yield smaller protein fragments. A specific level
of hydrolysis can be targeted for a specific functional benefit. As the level of hydrolysis
increases, the digestibility, absorption, and retention of nitrogen increases and the
allergenicity of the protein decreases (Burrington, 2000).
By the use of an ion exchange system, up to 100% of the minerals can be
removed from the WPI (Varnam and Sutherland, 1994). A WPI produced by ion
exchange tends to retain less calcium, phosphorus, potassium and greater sodium than
WPI produced by microfiltration (Varnam and Sutherland, 1994). Microfiltered WPI
contains the glycomacropeptide fraction, whereas WPI manufactured by ion exchange

16
will not (Varnum and Sutherland, 1994). For WPI produced by ion exchange, during the
pasteurization step, liquid whey is brought to acidic pH causing the whey proteins to be
positively charged. The positively charged whey proteins are then pumped into a tank
that contains negatively charged resin beads while all other components such as fat,
lactose, and minerals, are removed. Once the resin is loaded with protein, the pH of the
tank is made alkaline so the proteins detach from the resin and a very dilute whey protein
is eluted, microfiltrated, diafiltered, and spray dried (Huffman, 1996).
Reverse osmosis (RO) is used to remove water and is a filtration step used in the
production of many WPCs and WPIs. Reverse osmosis partially concentrates the whey
prior to vacuum evaporation. Removal of lactose and minerals requires reverse osmosis
and ultrafiltration processing (Smith et al., 1999; USDEC, 2003). Before the whey
concentrate is spray dried, lactose crystallization is induced to decrease the
hygroscopicity. Crystallization occurs in agitated tanks and takes anywhere from 4 to 24
hours. A fluidized bed may be used to produce large agglomerated particles with free-
flowing, non-hygroscopic, no caking characteristics (Smith et al., 1999, USDEC, 2003;
DMI, 2003).
A recent process to manufacture whey protein powder, patented by Invensys APV,
is known as the Super Concentrated Whey (SCW) process (Anonymous, 2003). The
SCW uses a specialized APV evaporator prior to crystallization of the lactose and spray
drying. The process follows for a period of 10-15 hours, in order to achieve the correct
level of crystallization before the liquid is spray dried. This method is known to be a
highly efficient way of concentrating the whey to 68-70% protein (Anonymous, 2003).

17
Properties and Applications
Whey protein products such as WPCs and WPIs are highly functional groups of
dairy ingredients widely used in various food applications (Foegeding et al., 2002). They
are widely used as ingredients in foods due to their unique functional properties, i.e.
emulsification, gelation, thickening, foaming, and fat and flavor binding capacity (Bryant
and McClements, 1998). US whey products possess many different functional properties
that lend themselves naturally to multiple applications as food ingredients. Over the years,
utilization of whey proteins as functional ingredients has increased.
Kinsella (1984) described functional properties of whey proteins as
physicochemical properties which govern the performance and behavior of proteins in
food systems during processing, storage, preparation, and consumption. The functional
properties of whey proteins affect the way the protein interacts with other components,
especially when placed in a food application. A number of factors influence the
functional properties of whey proteins such as the source of whey, protein content,
treatment used during manufacturing, lipid, and mineral content. Whey proteins possess a
wide range of functional properties such as fat and flavor binding, solubility, gelation,
emulsification, and foaming (USDEC, 2003). Of the various whey protein powders that
exist, WPI has a higher level of protein than WPC. Both WPC and WPI have astounding
functional attributes such as emulsification, whipping, fat binding, solubility, heat
setting/gelling properties, and water binding/thickening properties (McDonough et al.,
1974).
WPC has many valuable functional properties as a food ingredient. WPC can
modify properties in food such as flavor/texture, visual, hydration, surfactant, structural,

18
textural, and rheological (DMI, 2003). The functional properties of whey protein
concentrate are adversely affected by the residual lipid content of WPC (Morr and Ha,
1991). Whey proteins offer a wide range of potential functionality. WPC have lower
protein content and are more limited in functionality than those of higher protein content
such as WPI. Whey protein concentrates are typically very soluble though their water
binding capacities are relative low (Smith et al., 1999; USDEC, 2003). Whey proteins
remain soluble over a wide pH range and in particular near pH 4.5, so they may be used
in acidic drinks as protein supplements. They may also bring emulsifying properties and
turbidity to products (DMI, 2003).
The functional properties of whey proteins are often governed by a specific
conformational state. Therefore, any modification or alteration affecting that state will
affect the functionality (Mulvihill, 1992). Several factors that can cause protein
denaturation are heat, pressure, interfacial forces, extreme pH changes, and organic
solvents (Boye et al., 1997). Heat treatment is the most commonly used agent in food
processing and the extent to which proteins unfold (denature), influences the overall
functional and nutritional quality (Boye et al., 1997). BSA and Ig are the most heat
sensitive of the whey proteins, based on solubility at pH 4.6 (Harper and Zadow, 1984).
Moderate heat treatment of whey protein concentrate has shown to improve its foaming
properties (Harper et al, 1984; Richert et al., 1974) and emulsification properties
(Schmidt et al., 1984). The pH of a protein solution affects the denaturation temperature
of proteins.

19
Whey Flavor
Whey itself has a purportedly bland and delicate flavor (Laye et al., 1993) which
allows it to blend well with most products. Depending on the food application, whey
protein can bring out already present flavors. When whey protein is heated, volatile
sulfides are produced. Free amino acids are converted to flavorful compounds by heat
and chemical interaction with other compounds. The release of the highly hydrophobic c-
terminal end of casein and short chain fatty acid from milk triglycerides can impart
bitterness and increase the rate of rancidity in dairy products (Shipe et al., 1984). Whey
proteins provide a range of aromatic flavors to products. In beverages, whey is bland and
the slight sweet flavor allows other fruit and chocolate flavors to come through. In soups
and sauces, spice, and herb flavors are accentuated. Whey minerals also enhance dairy,
meat, and savory foods (USDEC, 2003).
Off-flavors can form during the storage of spray dried whey products. Reactions
that can contribute to off-flavors are Maillard browning and lipid oxidation. Ferretti and
Flanagan (1971) found 55 different compounds that were formed during the accelerated
storage (70°C and 75% relative humidity) of dried whey. The most abundant volatile
compounds were maltitol, 2-acetylfuran, furfuryl alcohol, acetic acid, and
dimethylsulfone. They also found 24 non-enzymatic reaction products in whey powder
stored at 4°C for 3 years (Ferretti and Flanagan, 1971). These experiments demonstrated
that degradative Maillard and lipid oxidation reactions occurred in low moisture, low
lipid whey products.
Maillard browning occurs when there is a reducing sugar and a free amino group
(BeMiller and Whistler, 1996). The Maillard reaction and Strecker degradation of alpha

20
amino acids are responsible for the formation of heterocyclic compounds with distinct
aromas and low odor thresholds. When the reducing sugar and free amino group react,
many flavor compounds such as cooked and caramelized flavors are formed (Bemiller
and Whistler, 1996). Even at refrigeration temperatures, Maillard reactions can occur, but
at higher temperature the reactions occur more readily and volatiles are frequently formed
during cooking. Also, Maillard reactions are commonly associated with foods that have
been dehydrated by heat, such as dried whey powder (Whitfield, 1992). The rate and
extent of Maillard reactions in dried whey and WPC can be controlled by alternating
temperature, pH, storage time, addition or elimination of specific enzymes, and/or water
activity (Morr & Ha, 1991). These reactions whether in liquid whey or spray dried whey
protein products, produce undesirable off-flavors.
Badings et al. (1980) concluded that oxidation flavors were related to the
breakdown of unsaturated fatty acids and were due to aldehydes and ketones (Badings et
al., 1980). Lipid oxidation reactions were thought to initiate the deterioration of flavor in
whey products through the formation of lipid oxidation products that contribute to off-
flavors and the promotion of Maillard reactions (Tomaino et al., 2001). According to
Morr and Ha (1991), aged, stale off-flavor is the single most important flavor criticism of
dried whey and whey protein products. Two major factors, previously described,
contribute to the formation of off-flavors in whey protein products, i.e., lipid oxidation
and Maillard browning. Factors that may impact the development of off-flavors in WPC
include: processing treatments, drying conditions, lipid oxidation and non-enzymatic
browning reactions, and temperature conditions (Morr and Ha, 1991). WPC contains a
variable amount of residual lactose and 3-7% lipid materials that are susceptible to
21
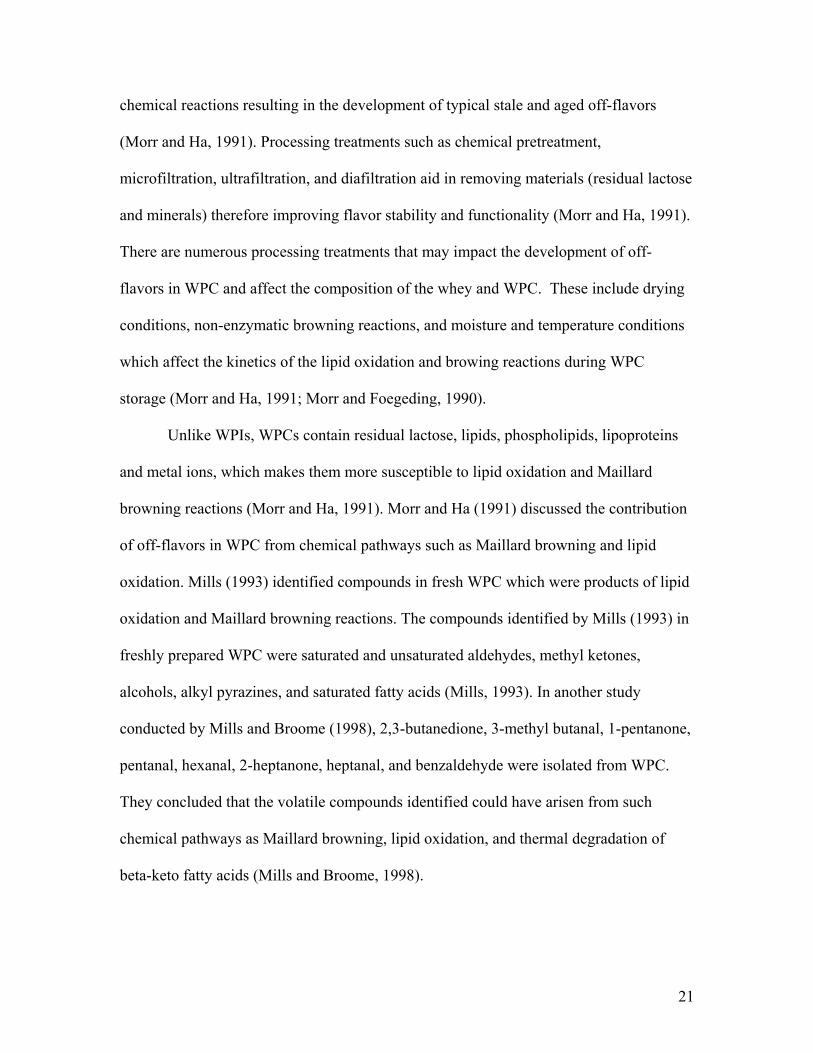
chemical reactions resulting in the development of typical stale and aged off-flavors
(Morr and Ha, 1991). Processing treatments such as chemical pretreatment,
microfiltration, ultrafiltration, and diafiltration aid in removing materials (residual lactose
and minerals) therefore improving flavor stability and functionality (Morr and Ha, 1991).
There are numerous processing treatments that may impact the development of off-
flavors in WPC and affect the composition of the whey and WPC. These include drying
conditions, non-enzymatic browning reactions, and moisture and temperature conditions
which affect the kinetics of the lipid oxidation and browing reactions during WPC
storage (Morr and Ha, 1991; Morr and Foegeding, 1990).
Unlike WPIs, WPCs contain residual lactose, lipids, phospholipids, lipoproteins
and metal ions, which makes them more susceptible to lipid oxidation and Maillard
browning reactions (Morr and Ha, 1991). Morr and Ha (1991) discussed the contribution
of off-flavors in WPC from chemical pathways such as Maillard browning and lipid
oxidation. Mills (1993) identified compounds in fresh WPC which were products of lipid
oxidation and Maillard browning reactions. The compounds identified by Mills (1993) in
freshly prepared WPC were saturated and unsaturated aldehydes, methyl ketones,
alcohols, alkyl pyrazines, and saturated fatty acids (Mills, 1993). In another study
conducted by Mills and Broome (1998), 2,3-butanedione, 3-methyl butanal, 1-pentanone,
pentanal, hexanal, 2-heptanone, heptanal, and benzaldehyde were isolated from WPC.
They concluded that the volatile compounds identified could have arisen from such
chemical pathways as Maillard browning, lipid oxidation, and thermal degradation of
beta-keto fatty acids (Mills and Broome, 1998).

22
Advances in the technology of specific manufacturing methods for processing
whey have solved many problems. Aged, stale off flavors were identified in dry whey
protein concentrate (Morr and Ha, 1991). WPC products ideally exhibit a bland flavor
immediately after drying, but develop a typically stale off-flavor during storage due to
lipid oxidation and Maillard browning (Morr and Ha, 1991). Improved UF and DF
technology is utilized to manufacture WPC with lower lactose content (<5% w/w) which
effectively improves the flavor stability of WPC by reducing the amount of lactose
available for Maillard browning reactions (Morr and Foegeding, 1990). Morr and
Foegeding (1990) found commercial WPIs to exhibit a considerably higher flavor quality
and functionality than WPCs (Morr and Foegeding, 1990). The poor flavor and relatively
high lactose and mineral content of the WPCs represent a serious problem which limits
their acceptance and use by the food industry (Morr and Foegeding, 1990).
Sensory Analysis
Sensory evaluation is a scientific discipline used to evoke, measure, analyze, and
interpret reactions to characteristics of foods and materials perceived by the senses of
sight, smell, taste, touch and hearing (Meilgaard et al., 1999). Sensory analysis methods
are used in quality control, product development, marketing research, and development
applications. The primary goal of sensory analysis is to conduct valid and reliable tests in
producing data for which important and sound decisions can be made (Meilgaard et al.,
1999). Lawless and Heymann (1999) identified the two primary areas of sensory analysis
to be analytical and affective tests.

23
Analytical tests consist of discrimination tests, threshold determination, and
descriptive analysis (Lawless and Heymann, 1999; Meilgaard et al., 1999).
Discrimination tests consist of three different sub-categories all of which are based on the
perceived differences between two products, e.g., paired-comparison, triangle testing, and
duo-trio testing (Stone and Sidel, 1993; Lawless and Heymann, 1999). Discrimination
tests are to be used when there is a slight or minimal difference between samples
(Chambers and Wolf, 1996) and is applicable in product reformulation, product
positioning, ingredient changes, and cost reduction changes (Chambers and Wolf, 1996;
Marketing Research Methodological Foundations, 2003).
Threshold testing is a method to determine the strength or concentration of a
stimulus required to produce effects on four different levels (Chambers and Wolf, 1996).
The four different levels include detection threshold, recognition threshold, difference
threshold, and terminal threshold (Chambers and Wolf, 1996). These methods are used in
determining product acceptability, detecting product contaminants, and to assist in
product formulation (Chambers and Wolf, 1996; Stone and Sidel, 1993).
Descriptive analysis is the description of both qualitative and quantitative sensory
aspects of a product using trained panelists (Meilgaard et al., 1999). Qualitative aspects
involve selecting the characteristics in a product (appearance, flavor, aroma and/or
texture). Quantitative aspects involve intensity ratings of the characteristics of a product.
Adults or children are the panelists used as an instrumentation source. Panelists are
screened, selected, (approximately 6-15 people), and then trained. Descriptive panels
usually require 50-100 hours of training prior to collecting and using panel data

24
(Meilgaard et al., 1999). After an extensive training, panelists have the expertise to
evaluate aspects of a food product qualitatively and quantitatively.
Affective tests consist of two categories, qualitative tests and quantitative tests.
Qualitative tests consist of focus groups, focus panels, or one-on-one interviews (in
person, by phone, or by email) (Meilgaard et al., 1999). Quantitative tests consist of
preference tests and acceptance tests (Meilgaard et al., 1999). Affective tests typically use
consumers or panelists that are untrained for a particular product evaluation.
Sensory Analysis of Whey
Sensory analysis has been applied to whey products. A sensory study was
performed by Morr and Foegeding (1990) on three commercial WPIs which were
compared to eight commercial WPCs. The three WPIs exhibited a bland flavor with a
slight indication of old whey powder off-flavor with 0-2 intensity on a 5-point scale. The
eight WPCs exhibited a stale, old whey powder flavor with a 4-5 intensity rating on a 5-
point scale. These results indicated that lipid and lactose concentration may be very
important in controlling the flavor stability of WPCs and WPIs.
Formal descriptive sensory analysis has also been applied to liquid whey and
dried whey ingredients. Carunchia Whetstine et al. (2003) and Karagul-Yuceer et al.
(2003) used descriptive sensory analysis in conjunction with instrumental analysis to
characterize the flavor of liquid whey. Drake et al. (2003) identified and developed a
descriptive sensory language to profile the flavor of dried dairy ingredients, including
WPC and WPI. Drake et al. (2003) found off flavors in WPC such as animal/wet dog,

25
cardboard, metallic and high astringency intensities (Drake et al., 2003). Clearly, whey
products are not necessarily mild and bland in flavor.
Health Benefits
Whey protein is a major component of the diet and is increasingly important to
the human diet. Whey products are an excellent source of vitamins such as thiamin,
riboflavin, pantothenic acid, and vitamin B6 and B12 (USDEC, 2003). Whey protein
products range in the content of protein, minerals, and fat levels to ensure optimal
performance and functionality. Incorporating whey proteins into food products provides
exceptional nutritional benefits.
Whey and whey components contain a number of valuable minerals. These
minerals help to enhance the functionality of whey proteins. These include monovalent
sodium, potassium and chloride ions, magnesium, citrate and phosphate (Anonymous,
2001). Whey is also an excellent source of bioavailable calcium which prevents bone loss
in both hypoestrogenic female athletes as well as post-menopausal women (Pasin and
Miller, 2000).
WPCs have high protein levels and overall are very nutritious. Whey proteins are
a good source of sulfur-containing amino acids which are proven to maintain antioxidant
levels in the body (Pasin and Miller, 2000). The whey protein ß-lactoglobulin is an
excellent source of essential and branched chain amino acids which are required in some
individuals with liver conditions (USDEC, 2003). Incorporating whey products into the
diet of those who suffer from cirrhosis may have a positive effect and overall health
26
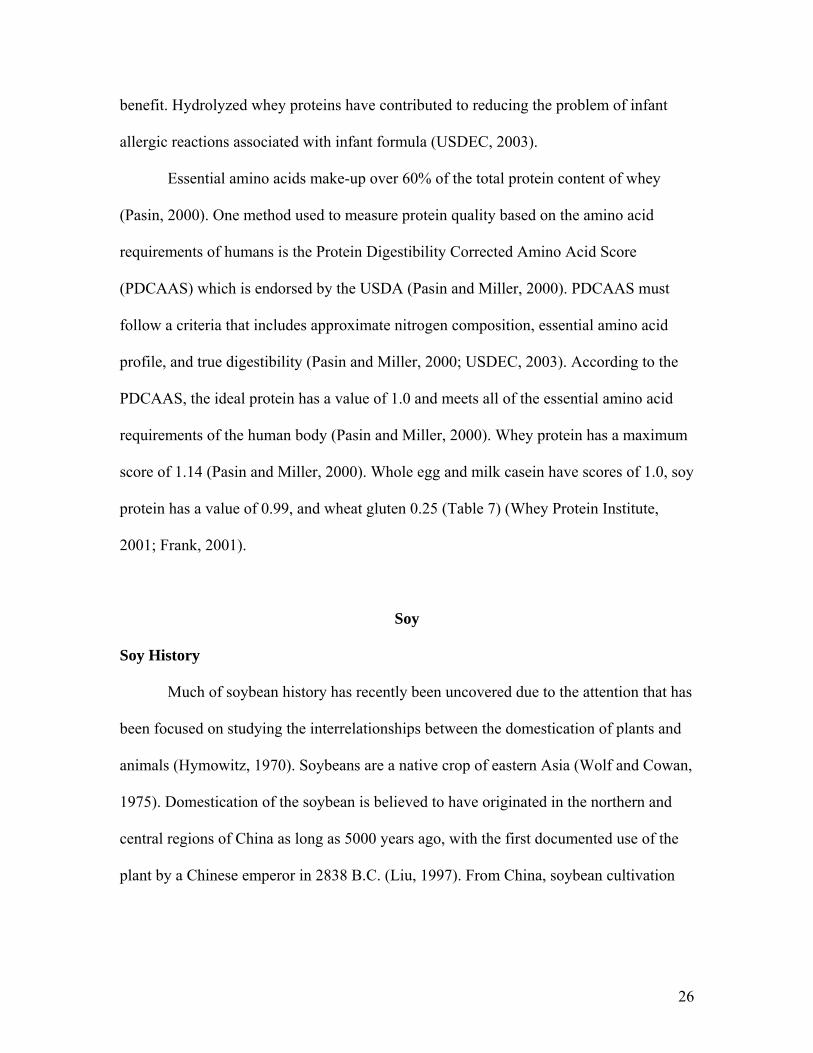
benefit. Hydrolyzed whey proteins have contributed to reducing the problem of infant
allergic reactions associated with infant formula (USDEC, 2003).
Essential amino acids make-up over 60% of the total protein content of whey
(Pasin, 2000). One method used to measure protein quality based on the amino acid
requirements of humans is the Protein Digestibility Corrected Amino Acid Score
(PDCAAS) which is endorsed by the USDA (Pasin and Miller, 2000). PDCAAS must
follow a criteria that includes approximate nitrogen composition, essential amino acid
profile, and true digestibility (Pasin and Miller, 2000; USDEC, 2003). According to the
PDCAAS, the ideal protein has a value of 1.0 and meets all of the essential amino acid
requirements of the human body (Pasin and Miller, 2000). Whey protein has a maximum
score of 1.14 (Pasin and Miller, 2000). Whole egg and milk casein have scores of 1.0, soy
protein has a value of 0.99, and wheat gluten 0.25 (Table 7) (Whey Protein Institute,
2001; Frank, 2001).
Soy
Soy History
Much of soybean history has recently been uncovered due to the attention that has
been focused on studying the interrelationships between the domestication of plants and
animals (Hymowitz, 1970). Soybeans are a native crop of eastern Asia (Wolf and Cowan,
1975). Domestication of the soybean is believed to have originated in the northern and
central regions of China as long as 5000 years ago, with the first documented use of the
plant by a Chinese emperor in 2838 B.C. (Liu, 1997). From China, soybean cultivation

27
spread throughout Japan, Korea, and Southeast Asia, becoming an important source of
food and medicine (Messina, 1995).
Soybeans were first brought to Europe in 1712, however utilization was limited
by poor climate and soil conditions (Liu, 1997). It was not until their introduction to
North America in 1765 by Samuel Bowen that the Western world began to realize the
value of soybeans (Hymowitz, 1970). Other early importers included Benjamin Franklin,
who sent soybean seeds from London to Philadelphia in 1770 (Hymowitz, 1970).
Although the influx of soybeans increased throughout the 18th century, it was not until the
19th century that production of soybeans was widespread throughout North America.
With the advancements in soybean oil processing in 1915, soybeans made the transition
from a limited seed crop to a commercially viable commodity (Wolf and Cowan, 1975).
During the 1920’s, thousands of new varieties of soybean were brought to America from
China, as demand increased (Liu, 1997). In 1939, US soybean production rose to over 90
million bushels annually and by the mid-1950’s the US surpassed China as the global
leader in soybean production and exportation (Liu, 1997). Historically, soy protein isolate
was developed for making spun fibers for use in meat analogs and sometimes,
restructured meats (Campbell 1981; Riaz 1999).
Soy Production
U.S. soybean production in harvest year 1999-2000 was 71.9 billion metric tons,
46.2% of the total world production (ADPI, 1998a). In 1999, the U.S. exported 32% of its
total soybean production at a total value of $4.5 billion (Soya Bluebook, 2001). Since
1970, soybean production has been at least double that of any other oilseed, increasing in

28
world oilseed production share from 32% in 1965 to over 50% in the 1980’s and 1990’s
(Smith and Huyser, 1987; Soy and Oilseed Bluebook, 2001).
U.S. soybean and product exports increased to $6.66 billion in 2000 (USB, 2001).
The two leading importers of U.S. soybeans are Japan, at $758 million, and Mexico, at
$678 million (USB, 2001). In 2000, US farmers produced 2.770 billion bushels of
soybeans, averaging a price of $4.40 per bushel. Soybean oil provides 80% of the fat and
oil consumption in the U.S. (USB, 2001). In 1947, 85% of the soybean crops were
harvested for seed processing in the production of soybean oil (Orthoefer, 1978). Within
the last ten years, soybean oil was the major cash product of soybean production.
Soybean oil is the world’s leading vegetable oil and accounts for well over half of
the fats and oils incorporated into food products in the U.S. Soybean oil can be found in
salad oils, shortening and margarine, used for cooking, soap, paints, resins, and drying oil
products (Scott and Aldrich, 1993; Orthoefer, 1978). Until recently, soybean oil was the
primary high value product obtained from the soybean. Currently, a multitude of soy
protein products are produced in addition to soybean oil.
Types of Soy Products
There are many varieties of soybean products produced throughout the US and
internationally. Of the types of soybean products, other than oil, only four types are
formed from the original soybean. The four major types are full-fat soy flour, defatted
soy flour, soy protein concentrate (SPC), and soy protein isolate (SPI). During processing,
the original soybean macrostructure is completely destroyed in each of the four forms.
Therefore, all four forms vary in fat, carbohydrate, protein content and especially

29
functionality (Cowan et al., 1973). The four groups are classified on a moisture-free basis,
with SPI having the highest protein content (90-92%), SPC at 65-72%, and all soy flours
ranging from 56-59% protein (Soy Protein Council, 1987). Isolated and concentrated soy
proteins can be used in a wide variety of foods. Soy flours, soy protein concentrate, and
soy protein isolate are the three basic types made from defatted soybean flakes (Scott and
Aldrich, 1983).
The soybean is recognized as a valuable source of edible oil and an excellent
source of protein for human and animals (Liener, 1994). Extracted flakes contain about
50% protein and are used as a source of protein in animal feed (Ferrier, 1975). SPC are
originally spent soy flakes that have been grinded and sized to contain 65% or more
protein, in addition to other components. These other components, carbohydrates and
dietary fiber, have strong flavor compounds, flatulence-promoting sugars, and have been
leached before drying (Lusas and Rhee, 1995). Further description of the leaching
process will be discussed later. SPC and SPI, compared to soy flours, can be used in the
same foods but SPC and SPI can be used in greater quantities due to their improved
flavor, color, and high protein content (Kinsella, 1979).
Traditional soyfoods, those foods prepared from whole soybeans (Scott and
Aldrich, 1983), are typically divided into two sub-categories of soy food types: non-
fermented and fermented soy products. Traditional non-fermented soyfoods include soy
milk, fresh green soybeans, whole dry soybeans, soy nuts, soy sprouts, whole-fat soy
flour, and tofu (Goblitz, 1995). Soy nuts are typically dry roasted and characteristically
eaten as a snack food. Soy sprouts, prepared by soaking, washing and sprouting of
soybeans, are consumed as a vegetable throughout the year in many Asian countries and

30
in the US are typically seen in soups, salads, and side dishes. Soymilk and tofu begin
with the soaking of the whole soybeans, rinsing, grinding, and filtering. The insoluble
residue is called okara and can be used in dishes or a fermentation step can be added to
yield a product called tempeh (Liu, 1997). Further processing of the filtered soybean
liquid produces soymilk. Tofu is made from processing the soymilk, then adding a
coagulant to precipitate the protein from the soymilk. The precipitate is pressed into a
solid, then dried, frozen or fried (Liu, 1997).
Traditional fermented soyfoods include: miso, tempeh, soy sauces, natto, and
fermented tofu (Golbitz, 1995). Tempeh is a product produced from the fermentation of
dehulled, boiled soybeans by Rhizopus oligosporus. This fermentation yields a cake-like
product with a clean yeasty odor, covered completely by mycelium. Tempeh is usually a
main dish or a meat substitute in a vegetarian or Asian diet. When it is sliced and deep-
fried, it has a pleasant aroma, crunchy texture and nutty flavor (Liu, 1997). Miso,
meaning fermented bean paste, is used as a base for soups or as a flavoring. Varieties of
miso are rice miso, barley miso, and soybean miso. The production of miso starts with
rice, barley, or soybeans that have been soaked, cooked, cooled, and inoculated with a
mixure of strains of Aspergillus orzae and Aspergillus soyae. The product is fermented
and ripened prior to blending and mashing to form the final product (Liu, 1997).

31
Components of Soy (Composition)
Soybeans are composed of approximately 37% protein, 18% oil, 15% soluble
carbohydrate, 15% insoluble carbohydrate, and 14% moisture (Figure 2) (ASA, 2003).
Humans can easily digest soy protein products. Approximately 92-100% of soy protein is
digestible in humans (Riaz, 1999).
Amino acids are the building blocks of protein necessary for human growth and
maintenance. Soy protein is a good source of all the essential amino acids except
methionine and tryptophan. Eight essential amino acids can be found in soybeans some of
which are not naturally produced in the human body but are important to human nutrition
(ASA, 2003). The high lysine content of soy protein makes it a good complement to
cereal proteins, which are low in lysine. Soybean protein does not have gliadin or
glutenin, the unique proteins of wheat gluten. Gluten is the protein in wheat, which is
required to form leavened bread. As a result, leavened breads can only be made from
wheat and rye flours. Soy flour can be added to wheat flour in bread, but cannot replace
all of the wheat flour. Soy proteins have a relatively high solubility in water or dilute salt
solution at pH values below or above the isoelectric point. Soybeans are the highest
natural source of dietary fiber, 4.6 grams (per 100 grams) (ASA, 2003). Soy flour and
grits are the least refined forms of soy protein used for human consumption (Soy Protein
Council, 1987). Soy flour and grits are obtained by grinding and screening defatted flakes
to various sizes (Hettiarachy and Kalapathy, 1997). Soy flours are available in enzyme-
active forms, which are non-heat treated. This form of soy flour contains active enzymes,
which facilitates the natural bleaching of wheat flour for use in bakery applications. Soy
flours are available in various degrees of water solubility, expressed as Protein

32
Dispersibility Index or Nitrogen Solubility Index (Lusas and Rhee, 1995). Per 100 gram
sample, defatted soy flour contains 51.4 grams of protein, 33.9 grams of carbohydrate,
17.5 grams dietary fiber, and 1.22 grams of fat (USB, 2003). Uses of soy flour and grits
include milk replacers, baked goods, pasta products, and infant formulas as well as
additives to coarsely ground meat products, candies, confections, and desserts (Rakosky,
1974; Soy Protein Council, 1987).
SPC contains a minimum of 65% - 72% protein on a moisture-free basis (Lusas
and Rhee, 1995). SPCs are essentially flours whereby water or alcohol-soluble
components, including flatulence-promoting sugars and strong flavor compounds, are
leached before drying (Lusas and Rhee, 1995). SPC, compared to soy flours, can be used
in the same foods as flours but in greater quantities due to their improved flavor, color,
and higher protein content (Kinsella, 1979). Soy concentrates are made of defatted soy
meal, resulting in a very low amount of fat (1%) (Liu, 1997). An increased level of
purification from soy flour to concentrates results in a compositional change, especially
the protein and carbohydrate content (Liu, 1997). SPC on a moisture-free basis contain
65-72% protein, 0.5-1.0% fat, and 19-21% carbohydrate, 3.4-4.8% of which is crude
fiber (Table 8) (Liu, 1997).
As the degree of purification increases from soy flour to isolates, the composition
changes, especially the protein and carbohydrate content (Liu, 1997). In SPI both soluble
and insoluble carbohydrates are removed causing an increase in protein content (Liu,
1997). SPI, on a moisture-free basis, contains 90-92% protein, 3-4% carbohydrate, 0.1-
0.2 % of which is dietary fiber, and 0.5-1.0 % fat (Table 8) (Liu, 1997).

33
SPC and SPI are made from soy meal and contain very low amounts of fat (0.5-
1%) (USB, 2001). Both SPC and SPI are the most refined forms of soy protein used as
food sources. SPC and SPI are obtained by further processing defatted flakes and flour to
remove the low molecular weight components which include the water soluble sugars,
ash, and other minor constituents of defatted soy flakes or flour (Hettiarachy and
Kalapathy, 1997; Liu, 1997). The major difference between SPC and SPI lies in the
protein and carbohydrate value. SPC is less purified than SPI, and therefore SPC has a
lower protein and a higher carbohydrate content (Soy Protein Council, 1987). The soluble
carbohydrates are removed in soy concentrates whereas in isolates both insoluble and
soluble carbohydrates are removed.
Properties and Applications
Soy protein ingredients must possess appropriate functional properties for food
applications and consumer acceptability (Table 9) (Kinsella, 1979). These are the
intrinsic physicochemical characteristics which affect the behavior of protein in food
systems during processing, manufacturing, storage and preparation, including sorption,
solubility, gelation, surfactancy, ligand-binding, and film formation. Until the
development of soy protein concentrate and soy protein isolate in the late 1900’s, the
major reason for adding soy protein to foods in the US was for functionality rather than a
source of dietary protein (Wolf and Cowan, 1975). SPC and SPI are used for nutritional
and functional food applications in nearly all consumer food categories (Soy Protein
Council, 1987). Functionality of SPC and SPI are related to surface-active properties,
gelling abilities, and fat and water absorption (Orthoefer, 1978). The form of isolate used

34
in a specific food application varies according to its characteristics such as solubility,
gelation, emulsification, dispersibility, viscosity, and retort (Orthoefer 1978; Richert and
Kolar, 1987; Soy Protein Council, 1987).
Solubility is one of the most important properties of a soy protein when used in a
beverage application. Other requirements include that the protein should form a clear and
translucent solution that is bland, possess low viscosity, and demonstrate stability over a
wide range of pH, ionic strength and temperature conditions. The interactions of soy
proteins with water are important in relation to dispersibility, water absorption and
swelling, viscosity, gelation and surfactant properties. These properties directly influence
the important functions of soy proteins in beverages (Kinsella, 1979). Other specific
functional properties are crucial in other ingredient applications.
Processing of Soy
SPC is obtained by removing the water-soluble sugars, ash, and other minor
constituents from defatted soy flakes or flour. There are three process to commercially
prepare concentrates, i.e., acid leaching (isoelectric pH 4.5), aqueous ethanol (60-80%)
extraction, and moist heat-water leaching (Figure 3) (ASA, 2003). All three processes
differ by the method used to remove the low molecular weight components while
insolubilizing major proteins (Hettiarachy and Kalapathy, 1997). In all three treatments
protein becomes insolubilized while a portion of the carbohydrate remains soluble so that
separation becomes possible by centrifugation. Solids containing mainly proteins and
insoluble carbohydrates are then dispersed in water, neutralized to pH 7, and spray dried

35
to produce soy concentrates. Most commercial soy concentrates are made by the aqueous
alcohol extraction or acid leaching process (Liu, 1997).
Aqueous alcohol extraction is commonly employed for commercial production of
soy protein concentrates. In this process, alcohol-soluble carbohydrate and minor
flavor/odor compounds are extracted from defatted soy flour using a countercurrent
stream of aqueous alcohol in a plateless column. The extracted wet flakes containing
proteins and insoluble polysaccharides are continuously removed, desolventized, and
dried to yield concentrates with bland flavor. The concentrates produced have low
nitrogen solubility due to denaturation by alcohol (Liu, 1997).
In the acid-leaching process, defatted soy flakes are leached with water in a ratio
of 20:1 at the isoelectric pH (pH 4.5) of soy proteins to remove soluble carbohydrate.
This procedure takes 30-45 minutes at 40°C. The insoluble residue containing protein is
separated by decanting or centrifugation, neutralizing to pH 7, and then spray dried. Soy
protein concentrates with high nitrogen solubility and low microbial count can be
produced using this process (Liu, 1997). For the leaching process, defatted soy flakes are
heat treated to denature protein and are then insoluble in water. Soluble carbohydrate and
salts are then removed from insoluble protein and polysaccharide material by water
leaching. The product is then spray dried which yields soy protein concentrate (Liu,
1997).
SPI is the most refined product made from defatted soybean meal (Soy Protein
Council, 1987). SPI is typically processed by solvent extraction, aqueous extraction,
drying, and toasting. SPIs are commercially prepared from defatted soy meal by using
aqueous or alkali extraction of proteins at a pH range of 7-10 (USB, 2003). By adjusting

36
the pH to the isoelectric point of the proteins, the soy protein globulins are precipitated.
The insoluble carbohydrates are removed by centrifugation followed by precipitation of
soy protein at its isoelectric point. This process reversibly and then irreversibly modifies
the solubility of the proteins (Liu, 1997). Initially soluble in pH 7.6 and 0.5 ionic strength
buffer, the proteins are no longer completely soluble after isoelectric precipitation. The
precipitated protein is separated by mechanical decanting, washed, and neutralized to a
pH of 6.8, and then spray dried. The result is a highly purified form of soy protein with
minimal beany flavor (Liu, 1997). Exposure to moderately high pH followed by
readjustment to neutral pH has been found to activate soy protein and improve functional
properties (Pour-El and Swenson, 1976). Isolates from different manufacturers are similar
in their chemical compositions but dissimilar in physical properties because of processing
variations (Liu, 1997). The source of the soy protein and process of manufacturing should
be considered when evaluating SPI.
Both SPC and SPI can be manufactured by processes called thermoplastic
extrusion and steam texturization. These texturizing processes are for use as meat
extenders (Johnson et al., 1992). Dairy products and milk are often replaced by soy foods
such as soy milk, tofu, soy protein, or other soy fractions used as dietary supplements.
Soy protein powders are versatile in that the powder can be added to beverages, prepared
as premixed beverages, and mixed with food. The form of isolate used in a specific food
application varies according to its characteristics such as solubility, gelation,
emulsification, dispersibility, viscosity, and retort treatment (Soy Protein Council, 1987).

37
Soybean Oil Extraction
Nearly all of the soybeans produced in the U.S. are processed in oil extraction
plants (Ferrier, 1975). The general steps of oilseed extraction are oilseed preparation,
solvent extraction, solvent and oil recovery, meal desolventizing, and finishing (Becker,
1978). Hexane is the accepted solvent for oil extraction of soybeans and oilseeds
throughout the world. Modern soybean processing generally involves oil extraction by
the use of hexane to produce crude soybean oil and defatted meal (Becker, 1978;
Orthoefer, 1978). Solvent extraction of soybeans is a diffusion process in which the
solvent (hexane) selectively dissolves miscible oil components (Proctor, 1997; Milligan,
1976). Solvent extraction primarily encompasses first the recovery of lipids from a seed
structure which has been prepared to facilitate its penetration by a solvent, and second the
diffusion of the lipid-solvent mixture or miscella to the surface of the solid (Milligan,
1976).
Oil processing begins with the cleaning, cracking and dehulling of dried soybeans.
The cracked beans are then conditioned in a steam-jacketed cooker, a vertical stack type
dryer or a rotary steam-tube dryer type (Mount et al., 1987). Next, conditioned, cracked
beans are flaked by passing between horizontal, pressurized, smooth rollers producing
flakes approximately 0.01-0.0015 inches thick (Proctor, 1997). Properly prepared flakes
are essential to a consistent and high-quality extraction (Becker, 1978). Flaking is
important prior to solvent extraction as solvent can much more readily flow through a bed
of flakes than through a bed of soy meats or fine particles (Proctor, 1997).
After flaking, the flakes are transported to the extractor by enclosed mass-flow
type conveyors designed to minimize flake breakage (Mount et al., 1987). The extractor

38
is the heart of the process and must convey large volumes of solids, contact these solids
with equally large volumes of circulating liquids, and efficiently separate liquids and
solids in such a way as to minimize stage-to-stage carryover of liquid on solids (Milligan,
1978). During extraction, the miscella becomes richer in oil, resulting in the oil/hexane
mixture obtained by flake extraction consisting of 70-75% oil and 25-30% hexane
(Mount et al., 1987; Proctor, 1997). After extraction, the miscella is filtered to remove the
suspended fines, and the solvent is stripped from the oil by a combination of thin film
evaporators to ensure complete removal of solvent (Ortheofer, 1978). The oil, essentially
free of solvent, is cooled to ambient temperature and pumped to storage (Mount et al.,
1987).
Lecithin is the phospholipid fraction separated from soybean crude oil, containing
phosphatidylcholine, phosphatidylethanolamine, phosphatidylinositol, and phosphatidic
acid (Liu, 1997). Lecithin is extracted from soybean oil and used for everything from
pharmaceuticals to protective coatings. It is a natural emulsifier and lubricant. During
processing, soybeans are cleaned, cracked, dehulled, and rolled into flakes (ASA, 2003).
Once the soybean oil is removed, the remaining flakes can be processed into various
edible soy protein products for human consumption and protein-enriched animal feed
(ASA, 2003). Further processing produces high protein food ingredients such as soy
protein concentrates and isolated soy protein. Currently, soybean oil remains the primary
product of soy production in the US.

39
Flavor of Soy
Some flavor components in soybeans and soy protein concentrates are resistant to
removal by methods such as distillation and extraction under normal conditions (Messina,
1997; Arai et al., 1966). One way to hide or help inactivate the soy protein flavor is the
texture of a food product. In non-aqueous products, soy protein has a much smaller
chance to interact with flavor compounds and the beany taste is less noticeable than in
products where the soy protein is fully hydrated. Soy protein can be enrobed with fat to
further mask the beany flavor (Gremli, 1974).
Due to the various methods of SPI processing - solvent extraction, aqueous
extraction, drying and toasting - a common problem is the formation of lipid-derived off-
flavors (Sessa, 1979). Soy proteins are notorious for containing a strong affinity for
aldehydes which irreversibily bind to proteins. The binding to the protein causes a loss in
olfactory effect and increases protein denaturation (Sessa, 1979). When a flavor
compound is added to soy protein without heat treatment, a change in the flavor is
noticed (Gremli, 1974). The change is due to the soy protein interfering with the added
flavor. It interferes by suppressing or combining with the soy protein resulting in altered
perception. In addition, some of the compounds of the original composition interact with
the soy protein (Gremli, 1974).
It is important to understand which compounds will react with soy protein when
placing SPI or SPC in a food matrix. Additionally, it is important to recognize if the
overall reaction of soy protein is reversible or irreversible. Strong soybean-like flavors
have been found when hydroperoxides were generated by the oxidative action of soy
lipoxygenase, an indigenous soybean enzyme, on pure linoleic and linolenic acid (Sessa,

40
1979). Two components of off-flavors found in denatured soy protein concentrate were
n-hexanal and n-hexanol (Arai et al., 1966). Enzymatic proteolysis in soy protein loosens
the binding of the protein structure, which in turn releases the flavor compounds n-
hexanal and n-hexanol (Arai et al., 1966). Volatile compounds such as n-hexanal and n-
hexanol contribute to beany flavors; nonvolatile oxygenated fatty acids impart a bitter
taste to soybeans. A study by Sessa (1979) demonstrated trihydroxy fatty acids generated
by the action of soy lipoxygenases on linoleic acid generated a bitter taste at low
concentrations.
More recently, Boatright and Crum (1997) identified an acid derivative, 2-pentyl
pyridine, a flavor compound associated with roasted and fried foods, in SPI. 2-pentyl
pyridine was found to be a major contributor of off-flavor in SPI, imparting a fish-like
odor (Boatright and Crum, 1997). Zhou and Boatright (2000) found that the formation of
2-pentyl pyridine in SPI was due to a synthesis reaction of 2,4-decadienal and ammonium
hydroxide during the processing of SPI. Compounds that contribute to the beany odor in
SPI were studied by Boatright and Lei (1999), who found two additional odorants,
dimethyl trisulphide, and trans-2-4-decadienal. The study concluded that the two
chemical odorants found were described as fatty odors, characteristic of oxidized aroma.
Overall, additional knowledge and research targeting the different off-flavors found in
soy protein powders is needed to improve product formulation, leading to increased sales
of products containing soy. The improvements in eliminating off-flavors in soy products
would allow consumers to enjoy the many health benefits of soy.

41
Health Benefits and Deficits
Americans spend more than $60 billion dollars per year on prescription
medications (FDA, 2003). Dietary and lifestyle changes that people institute themselves
have increased in popularity and have the potential to naturally enhance overall health
and well being. Soy protein could easily be promoted and implemented as a part of a
daily diet by incorporating it into various food matrixes. Soybeans contain all three of the
macronutrients required for good nutrition: protein, carbohydrate, and fats, as well as
vitamins and minerals. Soybeans are the only plant food that contains complete protein
along with all the essential amino acids (Johnson et al., 1992). The soybean amino acid
composition is equivalent to that of meat, milk, or egg protein (Soy Protein Council,
1987).
An antinutritional factor of soybeans is phytate. Phytate is the calcium-
magnesium-potassium salt of inositol hexaphosphoric acid commonly known as phytic
acid (Liu, 1997). The phytate content of soybeans used in the diet increases the
requirement for certain metallic minerals. Phytate decreases absorption of calcium and
zinc in humans but it is partially eliminated in soybeans by treatment with heat,
enzymatic hydrolysis, ion exchange chromatography, and pH control which occurs
during soy isolate production (Groff and Gropper, 1999).
Soy proteins are high in the amino acids glycine and arginine, which decrease
cholesterol and lower insulin levels (Burrington, 2000). The high protein content and
amino acid structure of soy is a major health benefit (Messina, 1995). Soybeans provide
all nine essential amino acids and a form of protein acceptable in most diets (Riaz, 1999).
Soy protein isolate has a digestibility of 93-97%, which is among the highest of all soy

42
products (Lusas, 1995; Liu, 1997). Soybeans, unlike other legumes, also have high levels
of methionine (a sulfur-containing essential amino acid) and cysteine, therefore they
easily meet the recommended level of protein for the human diet (Messina,1997).
Liener (1994) found that soy protein must undergo a specific amount of heat
treatment in order to have full nutritional potential. Liener (1994) also identified the
heat-labile anti-nutritional factors in untreated soybeans as protease inhibitors, lectins and
anti-vitamins. Lectins, also known as hemaglutinins, have the ability to agglutinate red
blood cells from various species of animals. Lectins have a high binding affinity for
carbohydrates and a number of cell surfaces which may in part be responsible for the
poor nutritive value of raw soybeans (Liener, 1994). Protease inhibitors such as the
Kunitz trypsin inhibitor and the Bowman Birkman inhibitor, along with lectins are
assumed to be responsible for growth depression. Feeding studies with mice indicated
these compounds reduced protein digestibility (Leiner, 1994). Leiner (1994) stated the
most effective means of inactivating these antinutritional components in soy protein is by
heat treatment. Thus, processed forms of soy such as flour, SPC, and SPI are free of these
compounds.
Soy isoflavones are commonly classified as a soy nutriceutical yielding many
health benefits (Soy Protein Council, 1997). Isoflavones are a class of phytoestrogens
which are estrogenic compounds in plants (Liu, 1997). The only significant dietary
sources of isoflavones in the human diet are soybeans (Table 10) (Friedman and Brandon,
2001). Isoflavones are similar in structure to that of estrogen therefore classifying them as
phytoestrogens. Isoflavones act as estrogens and anti-estrogens which make them well-
suited for the diets of post-menopausal women (Friedman and Brandon, 2001). In recent

43
years, studies have shown that soy products which have high isoflavone content may help
reduce symptoms of menopause in women (Burrington, 2000; Leiner, 1994; Adlercreutz,
2000).
Kirk et al. (1998) designed a study to determine if isoflavones in SPI conferred
protection from atherosclerosis, reduced total plasma cholesterol levels, and protected
against lipoprotein oxidation in atherosclerosis susceptible mice. The study found that
isoflavones from soy protein did provide protection in mice from atherosclerosis and
reduced the total plasma cholesterol level. Recent research proposed that soy isoflavones
have the potential to reduce LDL cholesterol in humans (Ho et al., 2000). A study by
Hudnall (1999) found that a 1 oz. serving size of soy protein isolate yielded 57 mg of
isoflavones, and a 1 oz. portion of soy protein concentrate yielded 12 mg of isoflavones.
It was concluded that incorporating soybean products into the human diet is currently the
most potent dietary tool for naturally treating hypercholesterolemia and reducing LDL
cholesterol, without prescription medication (Hudnall, 1999; Sirtori et al., 1993).
Other advantages to consumption of soy in the human diet are soy protein itself
(Messina, 1995). Soy proteins are thought to stimulate the liver to remove more
cholesterol, especially LDL cholesterol, from the blood (Burrington, 2000). On October
26, 1999, the US Food and Drug Administration (FDA) recognized the cholesterol-
lowering effects of soy protein and approved the use of a health claim. The health claim
approved the relationship between the consumption of soy protein and reduced risk of
coronary heart disease. Such health claims were made possible by the Nutrition Labeling
and Education Act of 1990 (NLEA) which allowed for statements on food labels that
associated a health benefit with a specific food component (FDA, 2004).

44
In 2000, the American Heart Association (AHA) also recognized that the
consumption of soy protein significantly lowered low-density lipoproteins (LDL) and
total cholesterol levels, therefore promoting a healthy heart. By lowering the total
cholesterol level, this reduced the risk for cardiovascular disease (Friedman and Brandon,
2001). The health claim below can be utilized on a soy product or product containing soy
protein that meets requirements including low saturated fat and low cholesterol with a
minimum of 6.25g of soy protein per serving. The per serving level was determined by
dividing the daily qualifying level (25g) by four to represent breakfast, lunch, dinner, and
snack. The model health claim for foods containing soy protein which meets FDA
regulations is as follows:
(1) Diets low in saturated fat and cholesterol that includes 25 grams of soy
protein may reduce the risk of heart disease. One serving of _______ [name of
food] provides _____ grams of soy protein (Federal Register, 1999).
(2) 25 grams of soy protein a day, as part of a diet low in saturated fat and
cholesterol, may reduce the risk of heart disease. A serving of [name of food]
provides ____ grams of soy protein (Federal Register, 1999).
Soybeans are nutritionally wealthy with an abundance of other nutritional factors,
which make them an ideal supplement to the human diet. Soybeans are also rich in
antioxidants, which have a wide range of anti-aging and disease prevention properties.
A study performed by Cowan et al. (1973) substituted soy protein for animal protein in
human subjects and found a significant reduction in total cholesterol and low density
lipoprotein (LDL) cholesterol within the blood plasma and serum. The study found that

45
both hypercholesterolemia and atherosclerosis were primarily due to the animal protein
used as the protein component of the diet. Investigation found that substituting isolated
soy protein for the animal protein could prevent hypercholesterolemia and atherosclerosis
(Carroll et al., 1995). A possible explanation for the cholesterol lowering effect of soy
protein is the protein’s ability to modulate the LDL receptor levels in the liver (Friedman
and Brandon, 2001).
Food allergies occur in 4-6% of children, especially infants (Friedman and
Brandon, 2001). Allergens associated with soybeans are of concern as soy products
become more widely used (Leiner, 1994). Soy-based infant formulas are widely used for
children who suffer from an allergy to cow’s milk or to meet the infants dietary needs
when breast milk is not available (Friedman and Brandon, 2001).
Cost of Soy
In 2000, soybeans represented 79% of U.S. exports and 54% of the world’s
soybean trade originated from the U.S. (USB, 2001). U.S. soybean and product exports
were $6.66 billion in 2000 (USB, 2001). China is the largest single country customer for
U.S. soybeans at $1.0 billion annually, followed by Japan at $758 million and Mexico at
$678 million (USB, 2001). The Philippines is the largest customer for U.S. soybean meal
at $122 million and Mexico and Korea are the largest U.S. customers of soybean oil, $39
million and $34 million, respectively (USB, 2001).
In 2000, the Soy Stats reported 74.5 million acres of soybeans were planted in the
United States, resulting in 2.770 billion bushels of soybeans. Farmers in Louisiana earned
$5.05 per bushel in 2000 and the two lowest paid soybean farmers, in the states of North

46
Dakota and Virginia, earned $4.20 per bushel (USB, 2001). The average price paid to
farmers in 2000 was $4.40 per bushel, which is the lowest price paid since 1972 (USB,
2001). The largest amount of soybeans planted in the U.S. in 2000 was in Iowa which
planted 10,700 acres of soybeans. Illinois planted 10,500 acres, the second largest amount
of soybeans planted. Production in Minnesota was 293 million bushels; Illinois, 460
million bushels; and Iowa, 459 million bushels. Currently, soy flour sells for $0.25/lb,
SPC for $0.90/lb, and SPI for $1.80/lb (The Solae Company, St. Louis, MO, 2004). The
use of soy protein concentrate and isolates in simulated meat products has grown rapidly
over the years therefore increasing the demand and value of soy (Wolf and Cowan, 1975).
Sensory Analysis of Soy
Sensory aspects of soy are an ongoing problem where sensory research often
labels soy as having characteristics of "beany", grassy, and bitter flavors (Kinsella, 1979).
Business and marketing techniques rely on the nutritional value, functionality, and price
of soy protein to mask the flavor problems associated with soy (Schutte and Ouweland,
1979). Schutte and Ouweland (1979) addressed two major problems in soy protein
materials, i.e., the off-flavors inherent to soy and the absence of attractive positive flavors
such as those found in meat.
There is limited research to determine the sensory flavor properties and consumer
perceptions of soy protein powders. Kalbrener et al. (1971) congregated a 17 member
trained panel to evaluate odors and flavor of commercial soy protein products including
soy flours, soy concentrates and isolates. Results showed that the most objectionable
flavors were beany and bitter. The use of threshold analysis indicated that the undesirable

47
taste constituents of soy were detectable and quite intense at very low concentrations
(Kalbrener et al., 1971). A study on the sensory evaluation of soy concentrates and flours
was performed by Cowan et al. (1973). The descriptions of the soy protein products were
beany, bitter, nutty, and toasted. The attribute identified as beany was frequently reported
as a predominant odor (Cowan et al., 1973).
As stated, the beany characteristic of soybeans is an unacceptable flavor that can
limit application of soy proteins. Drake et al. (2000) investigated dairy yogurt
fortification with soy protein concentrate. Sensory evaluation of yogurt with 1%, 2%, and
2.5% added SPC resulted in increases in soy flavor. Although the delicate flavor of
fermented dairy was seen as promising in reducing the objectionable characteristic flavor
of soy, levels of dairy flavor attributes were decreased with increased levels of added
SPC (Drake et al., 2000).
An interesting study by Wansink et al. (2002) included 132 Indians and Pakistanis
living in the US that participated in a taste profile study. Three groups of consumers were
analyzed: people who ate soy primarily for taste-related reasons, those who ate it
primarily for health-related reasons, and those who did not eat soy at all. Among the three
groups of consumers analyzed, people who ate soy primarily for taste-related reasons
were more likely to appreciate fine food from various cultures. The quantitative phase of
the research indicated that soy was consumed due to health related reasons or because
consumers tested liked the taste and texture of soy. The study provided evidence that soy
is incorporated into various cultures and consumed not only for health related reasons but
for its versatile flavor (Wansink et al., 2002).

48
Conclusion
Recently, fortified products have been a significant growth category for the food
industry. Functional foods that include either whey protein or soy protein comprise a
continuously growing product category. Consumers will be looking for products with
ingredients that help control specific unwanted health symptoms as well as boost
immunity. While nutraceutical and functional properties of whey and soy proteins are in
demand, flavor will still ultimately drive consumer liking and product success. The
objectives of this study are to identify and compare descriptive sensory properties of
whey and soy protein products and to compare consumer acceptance and attitudes
towards these products.

49
References
Adlecreutz, C.H.T., W. Mazur, P. Bartels, V.V. Elomma, S.S. Watanabe, K. Wahala, M. Landstrom, E. Lundin, A. Bergh, J.E. Damber, P. Aman, A.Widmark, A. Johansson, J.X. Zhang, G. Hallmans. 2000. Phytoestrogens and Prostate Disease. ASNS: Journal of Nutrition. 130:658S-659S American Dairy Products Institue (ADPI). 1998a. Whey Products: Utilization and Production Trends. Chicago, IL. American Dairy Products Institue (ADPI). 1998b. Ingredient Description Brochure. Dry Milks, Whey and Whey Products, Lactose. Chicago, IL. American Soybean Association (ASA). 2004. “soy protein” www.asasoy.com Anonymous. 2001. Do it with dairy. DMI. Whey. p. 1-3. www.doitwithdairy.com/infolib/ingspecsheet/factwhey.htm Anonymous. 2003. Technical background article received on 5 May 2003 from Invensys APV. Efficient processing of whey and permeate. ProcessingTalk. www.processingtalk.com Arai, S., H. Suzuki, M. Fujimaki, Y. Sukurai. 1966. Studies of Flavor Components in Soybeans. Part VI. Some Evidence for occurrence of protein-flavor binding. Agricultural Biol. Chem. 30 (10):364-369. Badings, H.T., R. Neeter. 1980. Recent advances in the study of aroma compounds of milk and dairy products. Netherlands Milk Dairy Journal. vol. 34: 9-30. Becker, W. 1978. Solvent Extraction of Soybeans. J Am Oil Chem Soc 55:754-761. BeMiller, J.N., and R.L.Whistler. 1996. Carbohydrates. In Food Chemistry, 3rd Edition. Fennema, O.R. (Ed.). Marcel Decker. New York. p.175-176 Boatright, W.L., and A.D. Crum. 1997. Odor and flavor contribution of 2-pentyl pyridine to soy protein isolates. J Am Oil Chem Soc 74:1575-1581. Boatright, W.L., and Q. Lei. 1999. Compounds contributing to the “beany” odor of aqueous solutions of soy protein isolates. J Food Sci 64:667-670. Boye, J.I., C.Y. Ma, V.R. Harwalkar. 1997. Thermal denaturation and coagulation of proteins. In Food Proteins and Their Applications. Damodaran, S. and Paraf, A., Eds.; Marcel Dekker, Inc. New York, New York.

50
Bryant, C.M. and D.J. McClements. 1998. Molecular basis of protein functionality with special consideration of cold-set gels derived from heat-denatured whey. Trends in Food Science and Technology. 9:143-151. Burrington, K. 2000. Nutritional and Beneficial Ingredients. Food Product Design. November 3000. p.1-12. Cambell, M.F. 1981. Processing and product characteristics for textured soy flours, concentrates, and isolates. J Am Oil Chem Soc 58:336-338. Carroll, K.K. and E.M. Kurowska. 1995. Soy Consumption and Cholesterol Reduction: Review of Animal and Human Studies. First International Symposium of the Role of Soy in preventing and treating chronic disease. Feb. 20-23, 1994, Mesa, A.Z. Journal of Nutrition. 125:594S-597S. Casper, J. L., W. L. Wendorff, D. L. Thomas. 1999. Functional Properties of Whey Proteins Concentrates from Caprine and Ovine Specialty Cheese Wheys. Journal of Dairy Science. 82: 265-271. Cayot, P. D., and Lorient. 1997. Structure-function relationships of whey proteins. In Food proteins and their applications. Damodaran, S. Paraf, A. Eds., Marcel Dekker, Inc. New York, New York. 1997. Chambers IV, Edgar and M.B. Wolf, 1996. Sensory Testing Methods: Second Edition. ASTM, Pennsylvania. Chandan, R. 1997. Dairy-Based Ingredients. Eagan Press Handbook Series. St. Paul, MN. Cowan, J.C., J.J. Rackis, and W.J. Wolf. 1973. Soybean protein flavor components: a review. J. Am. Oil Chem. Soc. 50: 427a-444a. Carunchia-Whetstine, M., J. Parker, M.A. Drake, and D.K. Larick. 2003. Determining flavor and flavor variability in commercially produced liquid Cheddar whey. Journal of Dairy Science. 86(2): 439 Dalgleish, D.G., V. Senaratne, S. Francois. 1997. Interactions between α-lactalbumin and β-lactoglobulin in the early stages of heat denaturation. J. Agric. Food Chem. 45: 3459-3464. Davisco Foods International, MN. 2004 Personnal Correspondance. DeMan, J.M. 1999. Proteins Chapter 3. In Principles of Food Chemistry. 3rd Edition. Aspen Publishers, Inc. Maryland. p.44-158

51
de Wit, J.N. and Moulin, J. 2001. Whey protein isolates: manufacture, properties, and applications. Industrial Proteins. vol 9 p.6-8 DMI. 2003. www.doitwithdairy.com. “whey protein”. http://www.doitwithdairy.com/ingredients/wheycon/inwheycondef.htm Drake, Dr. Maryanne. 2003. Personal correspondence. Drake, M.A., Karagul-Yuceer, Y. K.R. Cadwallader, C.V. Civille. And P.S. Tong. 2003. Determination of the sensory attributes of dried milk powders and dairy ingredients. Journal of Sensory Studies. 18:199-216. Drake, M.A., X.Q. Chen, S. Tamarapu, and B. Leenanon. 2000. Soy protein fortification affects sensory, chemical, and microbiological properties of dairy yogurts. Journal of Food Science. 65(7):1244-1247. El-Salam, M.H.A., S. El-Shibiny, and M.B. Mahfouz. 1985. Chemical composition and nutritive value of spray dried permeate powder. Journal of the Society of Dairy Technology. 38(2): 53-55. FDA, 2004.”nutrition labeling and education act” www.fda.gov Federal Register, Food Labeling: Health Claims; Soy Protein and Coronary heart Disease United States Federal Register: Rules and Regulations (online). 1999. 64, 57699-57733.
�http://frwebgate3.access.gpo.gov/cgbin/waisgate.cgi?WAISdocID 84817666+0+0+0&WAISaction=retrieve. Ferretti, A. and W.P. Flanagan. 1971. Volatile constituents of whey powder subjected to accelerated browning. Journal of Dairy Science. 54:1764-1768 Ferrier, L.K. 1975. Simple processing of whole soybeans. In Soybean Production, Protection and Utilization: proceedings of a conference for scientists of Africa, the Middle East, and South Asia, October 14-17, 1974. Addis Ababa, Ethiopia [Urbana] University of Illinois at Urbana-Champaign. P.179-188. Fitzpatrick, J. J., and M.A.S. Smith. 2001. Effect of manganese on Lactobacillus casei fermentation to produce lactic acid from whey permeate. Process Biochemistry. 36 (7): 671-675. Fitzpatrick, J. J., and U. O’Keefe. 2001. Influence of whey protein hydrolysate addition to whey permeate batch fermentations for producing lactic acid. Process Biochemistry. 37 (2):183-186.

52
Foegeding, E. A., J.P. Davis, D. Doucet, and M. McGuffey. 2002. Advances in modifying and understanding whey protein functionally. Trends Food Science. 13:151-159 Frank, Paula. 2001. “Finding the Whey”. p. 1-3. www.legacy-meadowfresh.com/Finding_The_Whey.html Friedman, M. and D.L. Brandon. 2001. Nutritional and Health Benefits of Soy Proteins. Journal of Agricultural Food Chem. 49:1069-1086. Francis, F.J. and Wiley. 2000. “Whey: Composition, Properties, Processing and Uses”. Wiley Encyclopedia of Food Science and Technology. 2nd Edition. New York. p.2652-2661. Geilman, W.G., D. Schmidt, C. Herfurth-Kennedy, J. Path, and J.Cullor. 1992. Production of an Electrolyte Beverage From Milk Permeate. Journal of Dairy Science. 75: 2364-2369. Goblitz, P. 1995. Traditional soyfoods: processing and products. Journal of Nutrition. 123(35):570-572 Groff and Gropper, 1999. Advance Nutrition and Human Metabolism. St. Paul, Wadsworth Publishing. 3rd Edition. p. Gremli, H.A. 1974. Interaction of Flavor Compounds with Soy Protein. Journal of Am. Oil Chem. Soc. 51:95A-97A. Harper, W.J. and J. Zadow. 1984. Heat induced changes in whey protein concentrates. N.Z.J. Dairy Sci Technol. 19:229-237. Hettiarachy, N. and K. Kalapathy. 1997. Soybean Protein Properties. In: Liu K. Soybeans: Chemistry, Technology, and Utilization. New York: Chapman & Hall. p.412-441. Ho S.C., J.L.F. Woo, S.S.F. Leung, A.L.K. Sham, T.H. Lam, E.D. Janus. 2000. Intake of soy products is associated with better plasma lipid profiles in the Hong King Chinese Population. Journal of Nutrition. 130:2590-2593. Huffman, Lee M. 1996. Processing whey protein for use as a food ingredient. Food Technology. Vol 50 (Feb): 49-52 Hudnall, M.1999. Soy as superhero: Guardian against many maladies of aging. Environmental Nutrition.22(2): 1-2. Hymowitz, T. 1970. On the domestication of the soybean. Economic Botany. October-December 1970. 24(4):408-421

53
Johnson, L.A., D.J. Meyers, D.J. Burden. 1992. Soy Protein’s History, Prospects in food, Feed. Intl. New on Fats, Oils and Related Materials (INFORM), AOCS Press. 3:429-444. Kalbrener, J.E., A.C. Eldridge, H.A. Moser, W.J. Wolf. 1971. Sensory evaluation of commercial soy flours, concentrates and isolates. Cereal Chemistry. 48:595-600. Karagul-Yuceer, Y., M.A. Drake, K.R. Cadwallader. 2003. Aroma-active components of liquid Cheddar whey. Journal of Food Science. 68(4):1215-1219. Kinsella, J.E. 1979. Functional Properties of Soy Proteins. Journal of Am Oil Chem Soc 56:242-257. Kinsella, J.E. 1984. Milk proteins: Physicochemical and functional properties. CRC Critical Reviews in Food Science and Nutrtition. 21:197-262. Kim, S-H., C.V. Moor, A. Seo, J.G. Surack.1989. Effect of whey pretreatment on composition and functional properties of whey protein concentrate. Journal of Food Science. 54:25-29 Kirk, E.A., P. Sutherland, F.A.Wang, A. Shait, and R.C. Leboeuf. 1998. Dietary isoflavones reduce plasma cholesterol atherosclerosis C57BL/6 mice but not LDL receptor deficient mice. Journal of Nutrition. 128:954-959 Lawless, H.T., and H. Heymann. 1999. Sensory Evaluation of Food: Principles and Practices. Aspen, Maryland. Laye, I., Fitzgerald, G.F., Uniacke-Loew, T., Daly, C., Fox, P.F. 1993. The contribution of lactococcal starter proteinases to proteolysis in Cheddar cheese during ripening. International Dairy Journal. 76:2455-2467. Liener, I.E. 1994. Implications of Antinutritional Components in Soybean Foods. Critical Reviews in Food Science and Nutrition. 34(1):31-67. Liu, K. 1997. Chemistry and Nutritional Value of Soybean Components. In Soybeans: Chemistry, Technology, and Utilization. Liu K. Chapman & Hall: New York, NY. p.25-113. Lusas, EW, Rhee, KC. 1995. Soy Protein Processing and Utilization. In Practical Handbook of Soybean Processing and Utilization, Erickson DR. (Ed). AOCA Press: Champaign, IL and United Soybean Board: St. Louis, MO. P.117-160.

54
Macedo, M.G. Lacroix, C., and Champagne, P. 2002. Combined effects of temperature and medium composition on exopolysaccride production by Lactobacillus rhamnosus RW-9595M in whey permeate based medium. Biotechnology Progress 18(2): 167-173. McDonough, F.E., Hargrove, R.E., Mattingly, W.A., Posati, L.P., Alford, J.A. 1974. Composition and properties of why protein concentrates from ultrafiltration. Journal of Diary Science. 57:1438-1443. Meilgaard, M. Civille, G.V, and Carr, B.T. 1999. Sensory Evaluation Techniques. 3rd Edition. CRC Press, Inc. Boca Raton, FL. Messina, M. 2002. Symposium Highlights Significant Research on Soy and Human Health. United Soybean Board. The Soy Connection. 10(1) 1-6. Messina, M. 1995. Modern Applications for an Ancient Bean: Soybeans and the Prevention and Treatment of Chronic Disease. First International Symposium on the Role of Soy in Preventing and Treating Chronic Disease. 1994. Feb. 20-23, Mesa, AZ. Journal of Nutrition. 125-567S-569S. Messina, M. 1997. Soyfoods: Their Role in Disease Prevention and Treatment. In Soybeans: Chemistry, Technology, and Utilization. Lui K. Champan & Hall: New York, NY. p.443-477. Milligan, E.D. 1976. Survey of Current Solvent Extraction Equipment. J Am Oil Chem Soc 53:286-290. Mills, O.E. 1993. Flavor of whey protein concentrate. New Zealand Dairy Research Institute. In Food Flavors, ingredients, and composition: Proceedings of the 7th International Flavor Conference. Elsevier. New York. p.139-149. Mills, O.E., Broome, A.J. 1998. Isolation of flavor compounds from protein material. In Flavor Analysis: Development in Isolation and Characterization. Mussinan, C.J. Morello, M.J. (Ed.) American Chemical Society. Washington, D.C. p.85-91. Morr, C.V. and E.Y.W. Ha. 1991. Off-flavors of whey protein concentrates: A literature review. International Dairy Journal. 1:1-11. Morr, C.V., and E.A. Foegeding. 1990. Composition and functionality of commercial whey and milk protein concentrates and isolate: A status report. Food Technology. 44: 100-111. Mount, T.L., W.J. Wolf, and W.H. Martinez. 1987. Processing and Utilization. In Soybeans: Improvement, Production and Uses, 2nd Ed., Wilcox JR (Ed). American Society of Agronomy, Inc. Madison, WI. p819-866.

55
Mulvihill, D.M. 1992. Production, functional properties and stylization of milk protein products. In Advance Dairy Chemistry. Fox, P.F. Ed. Elsevier Science Publishers LTD. New York, NY. vol 1. National Dairy Council. 2003. “whey protein” www.nationaldairycouncil.org Ortheofer, F.T. 1978. Processing and Utilization. In Soybean Physiology, Agronomy, and Utilization. Norman AG. (Ed). Academic Press, Inc. p.219-246. Pasin, G. and S.L. Miller. 2000. U.S. Whey Products and Sports Nutrition. U.S. Dairy Export Council. www.usdec.org p.1-18. Patel, R. S., and V. V. Mistry. 1997. Physiochemical and Structural Properties of Ultrafiltered Buffalo Milk and Milk Powder. Journal of Dairy Science. 80:812-817. Pour-El, A. and T.A. Swenson. 1976. Gelation parameters of enzymatically modified soy protein isolates. Cereal Chem. 53: 438-442. Proctor, A.1997. Soybean Oil Extraction and Processing. In Soybeans: Chemistry, Techology, and Utilization. Liu K. Champan and Hall: New York, NY. p.297-346. Riaz, M.N. 1999. Soybeans as Functional Foods. Cereal Foods World. 44:88-92. Rakosky, J. 1974. Soy grits, concentrates and isolates in meat products. J Am Oil Chem Soc 51(1): 123A-127A. Richert, S.H., C.V. Morr, C.M. Cooney. 1974. Effect of heat and other factors upon foaming properties of whey protein concentrates. J. Food Science. 39:42-48. Richert, S.J., Kolar, C.W. 1987. Value of isolated soy protein in food products. In Cereals and Legumes in the Food Supply. Dupont J, Osmna EM (Eds). Iowa State University Press: Ames, IA. p.73-90. Schmidt, R., V.S. Packard, H.A. Morris. 1984. Effect of processing on whey protein functionality. J Dairy Sci. 67:2723-2733. Schutte L, and G.A.M. van den Ouweland. 1979. Flavor Problems in the Application of Soy Protein Materials. J Am Oil Chem Soc 56:289-290. Scott, W.O., and S.R. Aldrich. 1983. Soybeans, Food, Feed and Future. In Modern Soybean Production, Scott WO, Aldrich SR. S & A Publications, Inc.: Champaign, IL. P209-219 Sessa, D.J. 1979. Flavor considerations of soy protein products. Food Product Development. Feb 1979 p.62-64.
56
Shipe, W.F., R. Bassette, D.D. Deane, W.L. Dunkley, E.G. Hammond, W.J. Harper, D.H. Kleyn, M.E. Morgan, J.H. Nelson, and R.A. Scanlan. 1978. Off flavors of milk: Nomenclature, standards, and bibliography. J. Dairy Sci. 61:855-869. Sienkiewicz, T., C. Riedel. 1990. Whey and whey utilization possibilities for utilization in agriculture and foodstuffs products. Buersche Druckerei. Leipzig, Germany. Sirtori, C.R., Even, R. and Lovati, M.R. 1993. Soybean protein diet and plasm cholesterol: from therapy to molecular mechanism. Ann. N.Y. Acad. Sci. 676:188. Smith, K., K.J. Burrinton, J.H. Von Elbe. 1999. Whey Applications in Confections. Oral presentations for US Dairy Export Council. Smith, K.J., and W. Huyser. 1987. World Distribution and Significance of Soybean. In Soybeans: Improvement, Production, and Uses. 2nd Ed., Wilson JR (Ed). American Society of Agronomy, Inc.: Madison, WI. p.1-22. Smithers, G.W., J.F. Ballard, A.D. Copeland, K. J. De Silva, D.A. Dionysius, G.L. Francis, C.G. Paul, A. Griece, G.H. McIntosh, I.R. Mitchell, R.J. Pearce, G.O. Regester. 1996. New Opportunities from the Isolation and Utilization of Whey Proteins. Symposium: Advances in Dairy Foods Processing and Engineering. Journal of Dairy Science. 79:1454-1459. Soya and Oilseed Bluebook. 2001. Soyatech, Inc.: Bar Harbor, ME. 2001. Soy Protein Council. 1987. Soy Protein Products: Characteristics, Nutritional Aspects and Utilization. Soy Protein Council. Washington, D.C. 1987. Stone, H.L. and J.L. Sidel. 1993. Sensory Evaluation Practices, 2nd Ed. Academic Press, San Diego. The Solae Company. St. Louis, MO. Personal Correspondance. 2004 Tomaino, R.T., Parker J.D., and Larick D.K. 2001. Anaylsis of free fatty acids in whey products by solid-phase microextraction. Journal of Agriculture and Food Chemistry. 49:3993-3998. USB, 2001. The 2001 edition of the Soy Stats by the United Soybean Board. www.unitedsoybean.org USDEC, 2003. Reference manual for U.S. whey and lactose products. www.usdec.org

57
Varnam, A.H., and J.P. Sutherland. 1994. “Milk and milk products: Technology, Chemistry and Microbiology”. Chapman and Hall, 1994. NY, NY. Chapters 1,4,7. Von Elbe, J.H. 2001. Utilization of Whey Proteins in Confections. Presentation for US Dairy Export Council. Walzem, R.D.L. 1999. Health Enhancing Properties of Whey Proteins and Whey Fractions. U.S. Dairy Export Council. P.1-7. www.usdec.org/pdffiles/manuals/7health.pdf. Wansink, B. and JaeHak Cheong. 2002. Taste Profiles that correlate with soy consumption in developing countries. Pakistan Journal of Nutrition. 1(6):276-278 Whey Protein Institute. 2003. Benefits of Whey Proteins. www.wheyoflife.org/benefits. Whitfield, F.B. 1992. Volatiles from interactions of Maillard reaction and lipids. Critical Reviews in Food Science and Nutrition. 31: 1-58. Williams, L.A. Oct/Nov 2001. Trend setting drinks: The new developments and trends that will be shaping their industry in the years to come. The World of Food Ingredients. p.45-48, 50, 52. Wolf, W.J., Cowan, J.C. 1975. Soybeans as a food source. CRC Press: Cleveland, OH. Zhang, Y., W.J. Ritter, C.C. Barker, P.A. Traci, and C.T. Ho. 1994. Volatile formation by lipid-mediated Maillard reactions in model systems. In ACS Symposium 558-lipids in Food Flavors. C.T. Ho, T.G. Hartman (Ed.) p.49-60. American Chemical Society, Washington D.C. Zhou, A. and W.L. Boatright. 2000. Precursors for formation of 2-pentyl pyridine in processing of soybean protein isolates. J Food Sci 65(7):1155-1159.

58
Manuscript
Comparison of sensory properties of whey and soy protein concentrates and isolates
Tara A. Russell¹ and MaryAnne Drake¹*
¹Department of Food Science, North Carolina State University, Box 7624, Raleigh, NC
27695
*Author to Contact
Email: [email protected]
Phone: (919) 513-4598
Fax: (919) 515-7124

59
Abstract
In previous years, whey was treated as an insignificant by-product of cheese
making, used mainly in animal feed or discarded. Whey and whey components,
particularly whey proteins, are now viewed as valuable ingredients due to recent
discoveries of functional and bioactive roles. Production and application of soy protein
has also increased in recent years. Characterization and comparison of the flavor
properties of these value-added ingredients is needed to identify specific ingredient
applications and marketing strategies. The goal of this study was to develop a sensory
lexicon for whey and soy proteins, and to subsequently identify and compare the
descriptive sensory properties of whey and soy proteins. Consumer perception of these
products was also investigated. Twenty-four descriptive sensory attributes were identified
to evaluate appearance, flavor, and texture/mouthfeel. Following development of the
lexicon, twenty-two samples (14 whey proteins and 8 soy proteins) were selected for
descriptive sensory analysis. Proteins were rehydrated (10 % solids, (w/v)) and evaluated
in triplicate by a highly trained sensory panel (n=10) trained to use the developed
language. Results were analyzed by univariate and multivariate analysis of variance.
Both whey and soy proteins were differentiated using the identified language (p<0.05).
Different sensory attributes distinguished whey proteins from soy proteins. Consumers
were knowledgeable of distinct health benefits of dairy and soy products. These results
will enhance ongoing research and product development with these nutritional and
functional ingredients.
Key Words: sensory analysis; whey protein concentrate; whey protein isolate;
soy protein concentrate; soy protein isolate; descriptive analysis

60
Introduction
In previous years, whey was treated as an insignificant by-product of cheese
making, used mainly in animal feed or discarded (National Dairy Council, 2003). With
advances in technology and recent discoveries of functional and bioactive roles for whey,
whey and whey components are now viewed as valuable ingredients. The recognition of
whey as a source of unique physiological and functional attributes provides opportunity
for the food industry to incorporate whey and whey components into a variety of foods.
Both whey protein concentrate (WPC 80) and whey protein isolate (WPI) provide a high
protein, low carbohydrate source which is currently in demand due to increased
awareness of nutrition and alternative methods for weight control.
deWit and Moulin (2001) estimated that 700,000 tons of whey produced
worldwide are used as ingredients in food. The United States Dairy Export Council
(USDEC) reported 5.6 tons of whey protein concentrates exported in 1996 compared to
24.5 tons exported in 2001. The cost of whey protein varies depending on milk prices.
Currently, the demand for a higher protein, low carbohydrate diet in the marketplace has
further increased whey protein value. Whey protein concentrate (WPC) contains protein
in concentrations less than 90% while whey protein isolates (WPI) contain a minimum of
90% protein. Spray dried whey powder costs approximately $0.25/lb while WPC80 is
approximately $2.50/lb (Davisco Foods International, Le Sueur, MN, 2004) and WPI is
approximately $4.50/lb (Davisco Foods International, Le Sueur, MN, 2004).
Whey protein products such as WPCs and WPIs are highly functional and
nutritional groups of dairy ingredients widely used in various food applications
(Foegeding et al., 2002). However, flavor of whey proteins can impact finished product
61
quality and consumer acceptance. Drake et al. (2003) identified and developed a
descriptive sensory language to profile the flavor of dried dairy ingredients, including
WPC and WPI. They found wide flavor variability in whey proteins and off flavors such
as animal/wet dog, cardboard, metallic and high astringency intensities.
Soy protein is an ingredient that also provides a wide range of functional and
nutritional properties. Soy protein has health benefits, therefore, FDA approval of soy
health claims has been a key driving force for an upward trend in soy consumption (FDA,
2004). Soy protein concentrate (SPC) and soy protein isolate (SPI) are the most refined
forms of soy protein used as food sources. The major difference between SPC and SPI is
in the protein and carbohydrate concentrates. SPC contains 60-80% protein while SPI
contains equal or greater than 90% protein. The use of soy protein concentrates and
isolates in food and beverage products has grown rapidly over the years increasing the
demand and value of soy. Currently, soy flour sells for $0.25 per lb, SPC for $0.90/lb,
and SPI for $1.80/lb (The Solae Company, St. Louis, MO, 2004). As with whey products,
price increases with increasing protein content.
Sensory aspects of soy are an ongoing problem. Sensory research often labels soy
as having sensory characteristics of “beany”, grassy, and bitter flavors (Kinsella, 1979).
Business and marketing techniques use the nutritional value, functionality, and price of
soy protein to mask the flavor problems associated with soy (Schutte and van den
Ouweland, 1979). Drake et al. (2000) investigated dairy yogurt fortification with soy
protein concentrate. The delicate flavor of fermented dairy products was seen as
promising in reducing the objectionable characteristic flavor of soy protein; however
levels of dairy flavor attributes were decreased with increased levels of added SPC

62
(Drake et al., 2000). There is a general lack of research on the sensory properties of soy
proteins.
Both SPC and SPI are cost effective and offer unique amino acid profiles. Whey
proteins, WPC80 and WPI also offer unique health and nutritional benefits. Processing
of SPC and SPI from soybeans is not as complex as processing of WPC and WPI.
However, both whey and soy proteins are abundant within the US. The total number of
consumers purchasing nutraceutical products is on the rise (USB, 2004). Consumer
trends are migrating towards nutraceutical products that offer an innovative taste. This
new market growth of functional nutraceutical products includes a wide variety of foods
from bars to beverages. Both whey and soy protein provide low carbohydrate and high
protein. Characterization of flavor and flavor variability of both whey and soy protein is a
key issue with the demand for great tasting healthy products. Consumer perception of
these products is crucial to effectively design and market ingredient applications for whey
and soy proteins. The objectives of this study were to identify and compare descriptive
sensory properties of whey and soy protein products and examine consumer perception of
whey and soy protein.
Materials and Methods
Sample Acquisition
Fifty-two samples (14 WPC80, 9 WPI, 9 SPC, and 20 SPI) were received from
commercial suppliers in the United States and international sources between January and
March 2004 (Table 1, 2). All products obtained were less than 1 month old at the time of
receipt. All samples were stored at room temperature in the dark until analysis.

63
Sample Preparation
To avoid light oxidation, samples were prepared for sensory analysis with
overhead lights off. The powders were reconstituted at 10% solids (w/v) in deodorized
distilled water. Products were mixed with a Braun™ multiquick electric hand mixer
(Gillette Commercial Operations, Boston, MA). Rehydrated samples were stored at 5°C
in glass jars for 24 hours prior to sensory analysis. Products were removed from
refrigeration 1 hour prior to test time. Approximately 30 ml of product were dispensed
into 2 oz. plastic Sweetheart™ cups (Sweetheart Cup Co., Owings Mills, MD) with
plastic lids and random 3-digit codes. Products were gently shaken prior to dispensing to
avoid settling.
Lexicon Development
Sensory properties of the fifty-two collected WPC, WPI, SPC, and SPI were
initially identified by 14 individuals who had extensive training (>75 hours each) with the
descriptive analysis of dairy foods, including dried dairy ingredients. Samples were
evaluated and preliminary attributes and definitions were identified (Table 3). Sensory
properties identified included aroma, flavor, and texture/mouthfeel.
Descriptive Sensory Analysis
Twenty-two (22) commercial products (WPC80, WPI, SPC, and SPI) were
selected for sensory analysis (Table 4). Samples were selected based on representative
sensory properties and country of origin, such that an international sampling was
obtained. Ten panelists were selected based on interest, time availability and knowledge

64
of basic tastes as well as dairy associated flavors. Each panelist (10 females) had greater
than 500 hours of previous descriptive analysis training involving basic tastes as well as
dairy flavor identification and quantification using the Spectrum Method™ (Meilgaard et
al, 1999). Panelists met for ten 2-hour training sessions to identify and discuss sensory
properties of rehydrated whey and soy proteins using the identified lexicon. The lexicon
was fine-tuned and the panelists were trained to identify and score attributes (Table 5).
Products were evaluated individually by each panelist in an odor-free room dedicated to
descriptive sensory analysis. The panelists were given distilled water and unsalted
crackers to cleanse their palate between samples. Panelists did not swallow the samples to
avoid saturation of the senses. Each product was evaluated in triplicate by each panelist
in a randomized balanced block design.
Consumer Testing
Consumer testing incorporated a paper ballot questionnaire probing consumer
perception of products containing whey and soy protein. The questionnaire was
approved by the University Institutional Review Board. An informed consent form was
signed by all participants (n=147) before taking the questionnaire. Consumers were
faculty, staff, and students of North Carolina State University campus and employees at
nearby businesses. They were recruited using email and fliers. Panelists received a $5.00
gift card for their participation. Panelists were asked questions to determine what type of
“bar” products they normally purchased, the frequency of consumption of protein bars,
level of knowledge about the use and function of proteins in food products, health
benefits and product claims provided by soy products, health benefits and product claims

65
provided by dairy products, purchase of food and/or beverage products that contain added
protein, and type of food and/or beverage products likely to purchase and consume if
high in protein. Consumers were also asked in separate questions to rank important
attributes (most important to least important) when purchasing protein bars with labeled
health claims and product features. Consumers were asked in separate questions to best
indicate how they felt about the following statements: “cow’s milk is a healthy food”,
“soy milk is a healthy food”, cow’s milk tastes good”, and “soy milk tastes good”.
Consumers were asked to mark one of the following five possible answers: strongly agree,
agree, neither agree nor disagree (don’t know), disagree, or strongly disagree.
Proximate Analysis
Proximate analysis (fat, moisture, protein, and ash) was conducted by a
commercial facility, in duplicate on each of the 22 selected whey and soy proteins using
standard methods. Fat content was determined by Mojonnier analysis (Mojonnier Bros.
Co., Chicago, IL). Moisture was determined by vacuum oven, ash by muffle furnace, and
protein by the Kjeldahl method. A conversion factor of 6.38 was used to convert total
nitrogen to protein for whey protein and a 6.25 conversion factor was used for soy
proteins.
Statistical Analysis
Statistical analysis was conducted using SAS (version 8.2, Cary, NC). Analysis
of variance (PROC GLM) with means separation was used to compare attribute mean
intensities. Principle component biplots (PROC PRINCOMP) were constructed to

66
evaluate differences between whey and soy proteins and examine differences among
whey and soy proteins individually. For consumer data, a rank test for a randomized
complete block design was conducted (Friedman’s rank test) to determine differences in
mean consumer rank scores for ranked questions. For other consumer questions,
frequencies were tabulated.
Results and Discussion
Proximate analysis results, provided by a commercial facility, indicated that fat,
ash, and moisture varied among the whey and soy proteins (Table 6). As expected, fat
contents were higher among SPC and WPC80 compare to SPI and WPI. Moisture and
ash content also varied widely among and between whey and soy proteins. Three soy
protein isolates SPI1, SPI2, and SPI4, did not fall within the defined content for protein
isolates (which should be equal to or greater than 90% protein). Two whey protein
isolates, WPI1 and WPI2, had average protein values less than 90%. The fat, ash and
moisture content differed between the whey protein concentrates and whey protein
isolates. The fat content of whey protein isolates was lower than whey protein
concentrates. However, the average ash and moisture contents were similar. Similar
trends in moisture and ash content were observed for SPC and SPI.
Among the WPC80 samples, WPC2 was documented on the certificate of analysis
from the manufacturer to contain 75% protein. Proximate analysis results indicated that
the mean protein value was 79.4%, therefore meeting the criteria of classification of
WPC75. However, for the other WPC80 samples, WPC1, WPC3, WPC4, WPC5, and
WPC6, the mean protein content was less than 80%. The mean protein content for all

67
WPIs except for samples WPI5, WPI7, and WPI8 was less than 90%. The mean moisture
content of WPI3 was 6.1%, which exceeds the maximum of 4.5% moisture for WPI. All
WPC samples were less than 8% fat, which is the standard recommended value by the
USDEC (2003). However, WPI6 had a mean fat value of 6%, which exceeds the
maximum 1% fat recommended by the USDEC (2003).
All SPC samples evaluated, except SPC2, had mean protein values greater than
70% which meets the standard definition by the American Soybean Association (ASA)
(2004) for SPC (Table 6). The percent moisture content of SPC and SPI should be no
more than 6%, (ASA, 2004). All soy protein samples were also within the 6% maximum
ash value recommended by the ASA except SPC4, which had a mean ash value of 6.3%.
In addition, all SPCs were within the standard maximum value of 3% fat. However, SPI1
had a mean value of 14.3% fat.
Analysis of variance of descriptive sensory results revealed many differences
between and among whey and soy proteins (Table 7). In general, mean flavor intensities
of rehydrated proteins were low (< 3.0). These intensities are typical for these types of
products (Drake et al., 2003). Principle component analysis was conducted on whey and
soy protein data sets individually and combined to more closely examine distinctive
sensory differences within soy and whey proteins. For the whey and soy protein data
combined, a cumulative of 72% of the data variability was explained by the first four
principle components. Fifty-nine percent (59%) of the variability was explained on the
first two components (Figure 1). PC1 explained 45% of the variability and was
characterized by color, sweet aromatic, cereal, brothy, roasted, metallic/meat serum, flour
paste, yeasty, sweet taste, viscosity, and chalkiness as determined by evaluating the

68
eigenvector loadings (Table 8). PC2 described 14% of the variability and was
characterized by cardboard/wet brown paper, animal/wet dog, soapy, salty taste, and
astringency. PC3 and 4 explained an additional 13% of the variability (Figure 2). PC3
explained 7% of the variability and was characterized by opacity, fecal /dirty, and sour
taste. PC4 explained 6% of the variability and was comprised of the attributes pasta,
malty and bitterness (Table 8). Soy proteins and whey proteins were distinct from each
other. In general, soy proteins were characterized by the flavor attributes flour, roasted,
cereal, and high intensities of chalkiness and viscosity. In contrast, whey proteins were
characterized by cardboard, brothy, and soapy flavors. These results indicate that soy and
whey proteins have distinctive flavor differences. Several sensory attributes found in this
study of whey and soy proteins have been used by previous researchers to describe other
whey and/or soy products (Civille and Lyon, 1996; Carunchia-Whetstine et al., 2003;
Drake et al., 2003; Friedeck et al., 2003).
Principal component analysis was also conducted on whey and soy protein data
sets individually to more closely examine distinctive sensory differences within soy and
whey proteins. In regards to whey proteins, a cumulative of 71% of the data variability
was explained by the first four principle components. Fifty-one percent (51%) of the
variability was explained by the first two components (Figures 3). PC1 explained 36% of
the variability and was characterized by opacity, color, sweet aromatic, cardboard/wet
paper, astringency, and viscosity (Table 9). PC1 primarily differentiated WPC80 from
WPI while PC2, 3, and 4 differentiated individual whey proteins from one another. In
general, WPI exhibited lower flavor intensities than WPC80. This characteristic has been
documented in previous studies (Drake et al., 2003) and may be due to the lower fat and
69
carbohydrate content of WPI compared to WPC80. PC2 described 15% of the variability
and was characterized by pasta, animal/wet dog, and salty taste. PC3 and 4 explained a
further 20% of the variability (Figure 4). PC3 explained 11% of the variability and was
characterized by soapy, sweet taste, sour taste, and chalkiness. PC4 explained 9% of the
variability and was comprised of the attributes cereal, brothy, metallic, and bitter taste
(Table 9). Many of the primary flavors observed in the whey proteins (animal/wet dog,
cardboard, sweet aromatic) have also been previously documented in liquid whey and
other dried whey ingredients (Carunchia-Whetstine et al., 2003; Drake et al., 2003).
For soy proteins, 76% of the variability was explained on the first four principal
components (Figure 5 and 6). PC1 explained 26% of the variability and was
characterized by sweet aromatic, pasta, animal/wet dog, flour paste, fecal/dirty, yeasty,
salty, viscosity and astringency (Table 10). PC2 described 19% of the variability and was
characterized by opacity, cardboard, and brothy. PC3 explained 17% of the variability
and was characterized by color, cereal, roasted, malty, and bitter. PC4 explained 14% of
the variability and was comprised of the attribute sweet. Unlike whey proteins, where
WPC80 and WPI were clearly distinguished, sensory properties of SPC and SPI were not
distinct. Samples SPC1, SPC2 and SPI4 were characterized by low intensities of aromas
and flavors. Flavors present in other soy proteins but absent in SPI4, SPC1 and SPC2
were fecal, yeasty, brothy, bitter taste, and sour taste. SPI3 had a distinct fecal note and
SPC3 was more chalky (mean intensity 5.5) than the other soy protein samples. In
contrast, sample SPI1 exhibited a higher viscosity and sweet aromatic than the other soy
proteins. Similar attributes identified in these soy proteins were documented in soymilks
(N’Kouka et al., 2004).

70
Correlation analysis was conducted on whey and soy combined as well as on
whey and soy results individually. Analysis of the combined whey and soy data
(Table 11) revealed the presence of a number of positive and negative correlations.
Sweet aromatic was positively correlated with cereal, pasta, and flour flavors. Positive
correlations were also present between cereal and flour flavors. The presence of cereal
flavor was also strongly related to the presence of roasted, flour, and pasta, and an inverse
relationship existed between cereal and both brothy and metallic flavors.
Correlation analysis of the whey sensory results alone (Table 12) revealed several
correlations. Some of these relationships were not evident with the combined data.
Opacity, sweet aromatic, color intensity, astringency, and viscosity were all correlated to
each other. Therefore, samples that were higher in viscosity were more opaque and
exhibited higher color intensities as well as higher intensities of sweet aromatic and
astringency. Astringency was correlated to sweet aromatic and cardboard flavors.
Soapy flavor was positively correlated to salty taste. Correlation analysis of the soy
sensory results (Table 13) similarly revealed correlations, some of which were not
present in the combined data set. Sweet aromatic and viscosity were correlated to pasta
flavor. A positive relationship existed between animal and fecal, while an even stronger
positive relationship existed between fecal and yeasty. Roasted and cereal flavors were
also positively correlated.
The results from the consumer questionnaire showed that most participants
purchased granola bars (69%) and cereal bars (47%) versus sports/nutritional bars (29%)
(Table 14). Forty-nine percent of participants did not consume protein bars and/or meal
replacement bars. However, 24% of consumers stated that they consumed protein bars at

71
least once per month. Fifty-three percent of the consumers felt they had a moderate level
of knowledge about the use and function of protein in foods. The majority of the
consumers polled (68%) did not purchase food and/or beverages with added protein.
Dairy products (61%) and meat products (69%) were most likely to be consumed and
purchased if choosing a product high in protein. Key health claims that positively
influenced bar purchase were “develops and maintains healthy bones”, “decreases
chances of heart disease”, “decreases cancer risk”, “increases mental alertness”, and
“prevents tooth decay” (Table 15). Weight control, immune system enhancement,
development of lean muscle mass, and appetite reduction were not as important as these
other health claims. Key product features for bars were “contains no animal fat” and
“does not contain genetically modified ingredients” (Table 16).
Of the 147 consumers polled, the results indicated that consumer knowledge of
health benefits and product claims of soy products centered on the high protein value of
soy-based foods and/or beverages (65%). Fifty-eight percent indicated that soy was low
fat/fat-free and forty-five percent indicated it was cholesterol free. In contrast, consumer
perception of health benefits and products claims of dairy products were that they
provide/develop and maintain healthy bones (88%) and contain calcium (80%). Sixty-
three percent of the consumers agreed that dairy products have a great taste. The
majority of the consumers polled indicated that “cow’s milk is a healthy food” (85%
strongly agree and agree) and that “soy milk is a healthy food” (70% strongly agree and
agree). Eighty-four percent (strongly agree and agree) of the consumers polled felt
“cow’s milk tastes good”. However, for the statement “soy milk tastes good”, eighty-two

72
percent of the consumers strongly disagreed, disagreed, or did not know if soy milk tastes
good.
Conclusions
Descriptive analysis revealed differences among and between sensory properties
of whey and soy proteins. Whey proteins (WPC and WPI) were characterized by the
sensory attributes cardboard, brothy, metallic, and soapy. The intensities of these
attributes were directly related to the type of protein such as concentrate versus isolate.
Whey protein isolate sample WPI6 demonstrated a mean soapy intensity of 1.6, while
whey protein concentrate WPC1 demonstrated a mean soapy intensity of 0.15. Soy
proteins (SPC and SPI) were commonly characterized by the sensory attributes cereal,
malty, flour paste, roasted, and these intensities were also related to the type of protein,
concentrate verses isolate. Overall, consumers in this study perceived soy and dairy
products as healthy foods and/or beverages, but different health benefits were associated
with each product. Further, dairy products were generally perceived as better tasting than
soy products.

73
References American Soybean Association (ASA) 2004 “soy protein” www.asasoy.com Carunchia-Whetstine, M., J. Parker, M.A. Drake, and D.K. Larick. 2003. Determining flavor and flavor variability in commercially produced liquid Cheddar whey. Journal of Dairy Science. 86(2): 439 Civille, G.V. and Lyon, B.G. (Eds). 1996. Aroma and flavor lexicon for sensory evaluation: terms, definitions, references, and examples. Madison, WI: American Society for Testing and Materials. p.158. Davisco Foods International, Le Sueur, Minnesota. USA. 2004. Personnal Correspondance. De Wit, J.N. and Moulin, J. 2001. Whey protein isolates: manufacture, properties, and applications. Industrial Proteins. vol 9 p.6-8 Drake, M.A., Karagul-Yuceer, Y. K.R. Cadwallader, C.V. Civille. And P.S. Tong. 2003. Determination of the sensory attributes of dried milk powders and dairy ingredients. Journal of Sensory Studies. 18:199-216. Drake, M.A., X.Q. Chen, S. Tamarapu, and B. Leenanon. 2000. Soy protein fortification affects sensory, chemical, and microbiological properties of dairy yogurts. Journal of Food Science. 65(7):1244-1247. FDA, 2004.”nutrition labeling and education act” www.fda.gov Foegeding, E. A., J.P. Davis, D. Doucet, and M. McGuffey. 2002. Advances in modifying and understanding whey protein functionally. Trends Food Science. 13:151-159 Friedeck, K.G., Karagul-Yuceer, Y., and Drake, M.A. 2003. Soy protein fortication of a low-fat dairy based ice cream. Journal of Food Science. 68(9): 2651-2657. Kinsella, J.E. 1979. Functional Properties of Soy Proteins. Journal of Am Oil Chem Soc 56:242-257. Meilgaard, M. Civille, G.V, and Carr, B.T. 1999. Sensory Evaluation Techniques. 3rd Edition. CRC Press, Inc. Boca Raton, FL. National Dairy Council. 2003. “whey protein” www.nationaldairycouncil.org N’Kouka, K.D., Klein, B.P., and Lee, S.Y. 2004. Developing a Lexicon for Descriptive Analysis of Soymilks. Journal of Food Science. In Press.

74
Schutte, L. and van den Ouweland, G.A.M. 1979. Flavor Problems in the Application of Soy Protein Materials. J Am Oil Chem Soc 56:289-290. The Solae Company, St. Louis, Missouri, USA. 2004. Personnal Correspondance. USB (United Soybean Board), 2001. The 2001 edition of the Soy Stats by the United Soybean Board. www.unitedsoybean.org USB. 2004. Consumer attitudes about nutrition: 2004-2005 National report. July 2004. USDEC, 2003. Reference manual for U.S. whey and lactose products. www.usdec.org

75
Tables and Figures
for
Literature Review

76
Table 1: Composition of liquid whey
Composition of Whey
Fluid Sweet Whey
Fluid Acid Whey
Dried Sweet Whey
Dried Acid Whey
Total Solid 6.35 6.50 96.5 96 Moisture 93.70 93.50 3.5 4 Fat 0.5 0.04 0.8 0.6 Protein 0.80 0.75 13.1 12.5 Lactose 4.85 4.90 75 67.4 Ash 0.50 0.80 7.3 11.8 Lactic Acid 0.05 0.40 0.2 4.2
*www.albalagh.net/halal/col4.shtml

77
Table 2: United States exports of whey product by country
*Adapted from www.USDEC.org

78
Table 3: Types of whey protein
Whey Type Characteristic
Liquid Whey
Produced during cheese making
Whey Powder
Dried Whey
WPC34
34% protein
WPC35
35% protein
WPC50
50% protein
WPC80
80% protein
WPI
90% protein or greater
Reduced Lactose Whey
Less than 60% lactose
Demineralized Whey
Less than 7% ash
Acid Whey
pH of 5.1 or less
Sweet Whey
pH of 5.5 or higher
*Adapted from USDEC, Reference manual for U.S. whey and lactose products 2003,
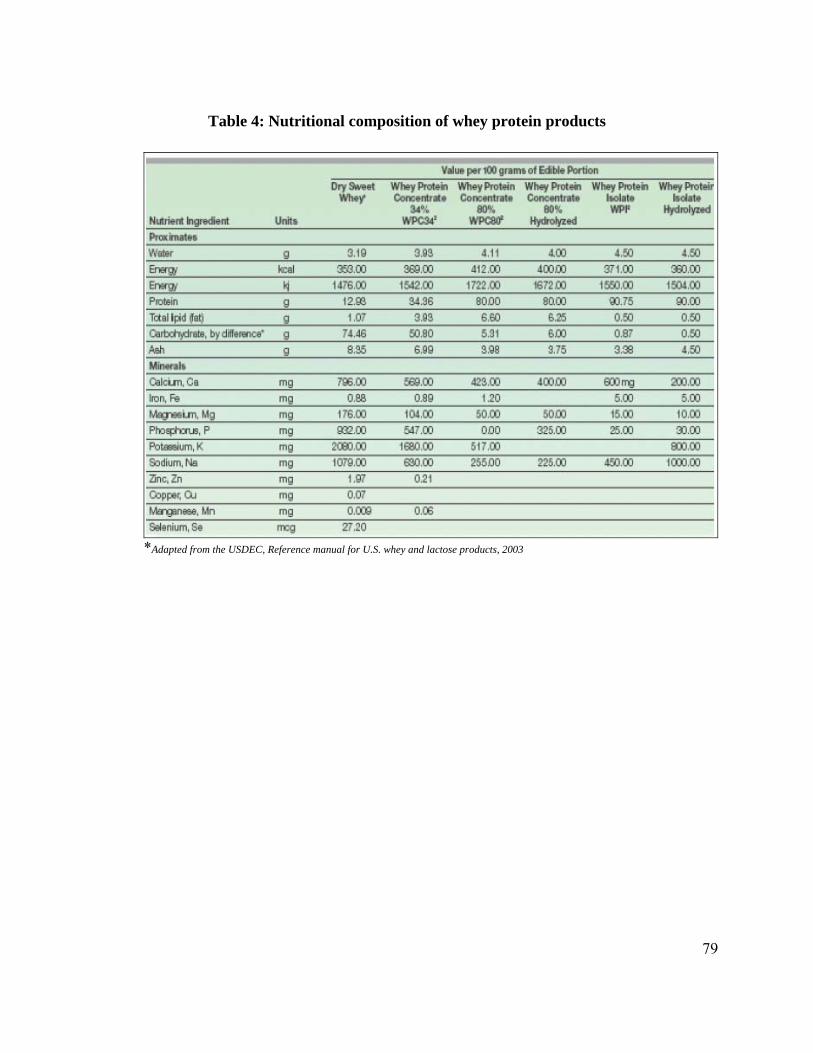
79
Table 4: Nutritional composition of whey protein products
*Adapted from the USDEC, Reference manual for U.S. whey and lactose products, 2003

80
Figure 1: Processing of whey powders
*Varnam & Sutherland, 1994
Unprocessed liquid whey
Heat treatment
Clarification
Concentration
Demineralization
Whey cream
Concentrated whey
Drying Lactose crystallization
Reconcentration
Drying
Whey powderDelactosed whey powder Demineralized whey powder
Drying
Lactose

81
Table 5: Composition of whey protein concentrate 80% (WPC80)
and whey protein isolate (WPI)
Composition of WPC vs. WPIComposition of WPC vs. WPI
WPC 80 WPI
*Adapted from www.USDEC.org , 2003
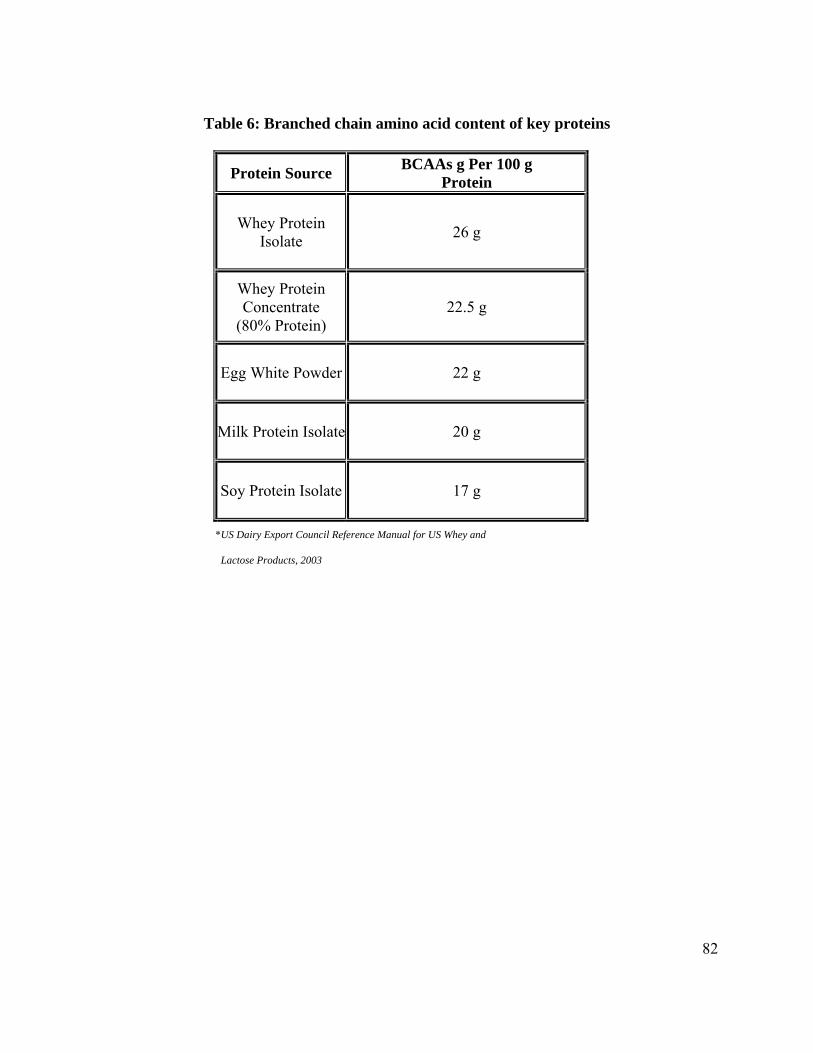
82
Table 6: Branched chain amino acid content of key proteins
Protein Source BCAAs g Per 100 g Protein
Whey Protein
Isolate
26 g
Whey Protein Concentrate
(80% Protein) 22.5 g
Egg White Powder
22 g
Milk Protein Isolate
20 g
Soy Protein Isolate
17 g
*US Dairy Export Council Reference Manual for US Whey and
Lactose Products, 2003

83
Table 7: *PDCAAS values of various proteins
Protein source
PDCAAS
Whey protein
1.14
Soy protein isolate
1.00
Milk protein isolate
1.00
Egg white powder 1.00 Casein
1.00
Ground beef 1.00 Canned lentils 0.52 Peanut meal 0.52 Wheat gluten 0.25
*PDCAAS = measures protein quality based on amino acid requirements of
humans.
Adapted Pasin and Miller 2000; USDEC Reference Manual for US Whey
and Lactose Products, 2003

84
Figure 2: Composition of a soybean
14% Moisture / ash /other
15% Soluble Carbohydrate(sucrose, stachyose,
raffinose, others)
15% InsolubleCarbohydrate
(Dietary Fiber)
38% Protein
18% Oil (0,5% Lecithin)
*Adapted from www.asa-europe.org

85
Table 8: Composition of commercial soy protein products
Composition Toasted Soybeans (grams)
*SPC (per 100 grams)
*SPI (per 100 grams)
Moisture
2 5.5 5
Protein
45 70 90
Fat
20 0.5 0.5
Carbohydrates
26.5 16.5 0
Crude Fiber
3 3.5 0.5
Ash
3.5 4 4
*SPC – soy protein concentrate SPI – soy protein isolate Adapted Gremli et al. 1974 and Kinsella J. 1979

86
Table 9: Functional properties of soy protein concentrate and soy protein isolate in food system
Type of soy protein
Functional Properties
Mode of Action
Food System
SPC, SPI
Soluility
Protein salvation pH dependent
Beverages
SPC
Water absorption and binding
Hydrogen-bonding and entrapment
Meats, sausages, breads, cakes
SPC, SPI
Viscosity
Thickening
Soups, gravy
SPC, SPI
Gelation
Protein matrix formation
Meats, cheese
SPC, SPI
Emulsification
Formation and stabilization of fat emulsions
Sausages, bologna, soup, cakes, icecream
SPC, SPI
Fat absorption
Binding of free fat
Meats, donuts
SPC, SPI
Flavor binding
Adsorption and entrapment
Simulated meats, bakery
*Adapted from Soya and Oilseed Bluebook, 2001

87
Figure 3: Soy processing products
*Adapted from the American Soybean Association, 2003
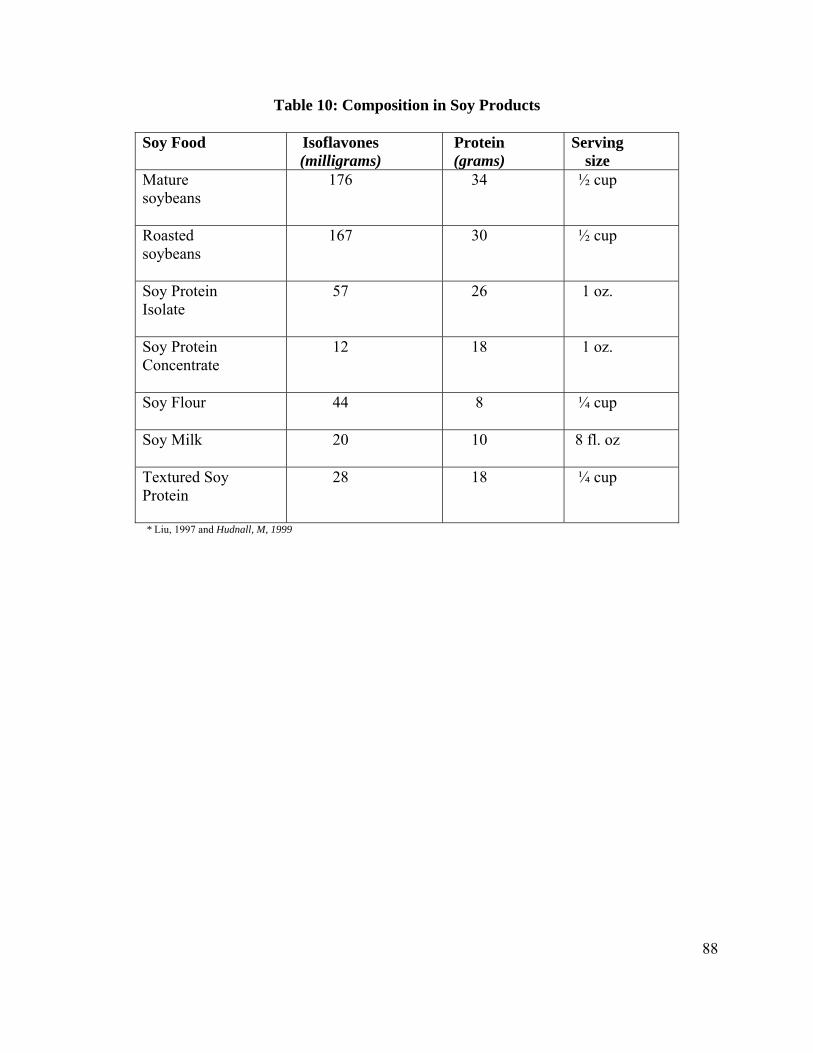
88
Table 10: Composition in Soy Products Soy Food Isoflavones
(milligrams) Protein (grams)
Serving size
Mature soybeans
176 34 ½ cup
Roasted soybeans
167 30 ½ cup
Soy Protein Isolate
57 26 1 oz.
Soy Protein Concentrate
12 18 1 oz.
Soy Flour
44 8 ¼ cup
Soy Milk
20 10 8 fl. oz
Textured Soy Protein
28 18 ¼ cup
* Liu, 1997 and Hudnall, M, 1999

89
Tables and Figures
for
Manuscript

90
Table 1: Soy proteins acquired for initial sensory language development Product Name Product Type Company Manufacturing location Supro EX33 SPI The Solae Company St. Louis, MO
Supro 500E SPI The Solae Company St. Louis, MO
Promine DS SPI The Solae Company St. Louis, MO
Procon 2000 SPI The Solae Company St. Louis, MO
Alpha 5812 SPC The Solae Company St. Louis, MO
Supro 670 SPI The Solae Company St. Louis, MO
Bunge NB SPI The Solae Company Sao Paulo, Brazil
Bunge LH SPI The Solae Company Sao Paulo, Brazil
Prolisse™ 500 SPI Cargill Soy Protein Solutions Wayzata, MN
ProFam 780 SPI Archer Daniels Midland Company Decatur, IL
ProFam930 SPI Archer Daniels Midland Company Decatur, IL
Arcon G SPC Archer Daniels Midland Company Decatur, IL
Arcon F SPI Archer Daniels Midland Company Decatur, IL
Arcon VF SPC Archer Daniels Midland Company Decatur, IL
PFL SPI Archer Daniels Midland Company Decatur, IL
ProFam 781 SPI Archer Daniels Midland Company Decatur, IL
Profam 825 SPI Archer Daniels Midland Company Decatur, IL
ProFam 873 SPI Archer Daniels Midland Company Decatur, IL
ProFam 891 SPI Archer Daniels Midland Company Decatur, IL
ProFam 892 SPI Archer Daniels Midland Company Decatur, IL
Arcon SM SPC Archer Daniels Midland Company Decatur, IL
Arcon SJ SPC Archer Daniels Midland Company Decatur, IL
Arcon S SPC Archer Daniels Midland Company Decatur, IL
ISO 111 S800 SPI Nutriant Cedar Falls, Iowa
S5700 SPC Nutriant Cedar Falls, Iowa
SPI 500A SPC IFI China
Solcon SPC Solbar Plant Extracts Ltd. Ashdod, Israel
SPI 6000 SPI Protient Mountain Lake, MN
SPI 6400 SPI Protient Mountain Lake, MN *SPC = soy protein concentrate, SPI = soy protein isolate

91
Table 2: Whey proteins acquired for initial sensory language development Product Name Product Type Company Manufacturing location PowerPro® WPI Land O’Lakes Dairy Proteins Perham, MN
Mel-O-Skim WP75 WPC75 Kerry Specialty Ingredients Owen, WI
WPI 5849 WPI Kerry Specialty Ingredients Owen, WI
BiPro WPI Davisco Foods International, Inc.® Eden Prairie, MN
WPC 80% WPC80 Davisco Foods International, Inc.® Eden Prairie, MN
Proliant 8000 WPC80 Proliant Inc. Ames, IA
IsoChill 9000 WPI Proliant Inc. Ames, IA
Proliant 9000 WPI Proliant Inc. Ames, IA
Protient 8500 WPC80 Protient Mountain Lake, MN
Protient 9000 WPI Protient Mountain Lake, MN
Protient 8000 WPC80 Protient Mountain Lake, MN
WPI WPI Glanbia Twin Falls, Idaho
WPC 80% WPC80 Sorrento Lactalis, Inc. Nampa, Idaho
WPC 80% WPC80 CP International Tulare, CA
WPC 80% WPC80 Agri-Mark Onalaska, WI
WPC 80% WPC80 CalPro Corona, California
Inpro 80 LF WPC80 (defatted) Vitalis Nutrition, Inc. United Kingdom
Inpro 80 WPC80 Vitalis Nutrition, Inc. Nampa, Idaho
Inpro 90 LF WPI (defatted) Vitalis Nutrition, Inc. United Kingdom
Inpro 90 WPI Vitalis Nutrition, Inc. California
Alacen 392 WPC NZMP Wellington, New Zealand
Alacen 895 WPC NZMP Wellington, New Zealand
Alacen 53997 WPC NZMP Wellington, New Zealand
*WPC 80 = whey protein concentrate 80%, WPC75 = whey protein concentrate 75%, WPI = whey protein isolate 90%

92
Table 3: Initial whey and soy protein lexicon identified from roundtable discussion of 50 whey and soy proteins Aromatics:
Sweet aromatic/oatmeal Brothy/potato Mushroom/metallic Animal/wet dog Pasta water Cereal/grainy Doughy Cooked/milky Cardboard/wet paper Soapy Cucumber Fecal Catty Roasted/Nutty Dirty/Soil
Tastes:
Sweet Sour Salty Bitter
Chemical Feeling Factors:
Astringency Texture/Mouthfeel: Chalkiness Thickness Visual: Color intensity Opacity

93
Table 4: Products selected for descriptive sensory analysis Product Code Product Name Company Manufacturing location WPC1 Inpro 80 Vitalis Nutrition, Inc. Nampa, Idaho
WPC2 Mel-O-Skim WP75 Kerry Specialty Ingredients Owen, WI
WPC3 8000 Proliant Inc. Ames, IA WPC4 WPC80 Agri-Mark Onalaska, WI
WPC5 WPC80 Davisco Food International Inc. Eden Prairie, MN
WPC6 Alacen 392 NZMP Wellington, New Zealand
WPI1 5849 Kerry Specialty Ingredients Owen, WI
WPI2 Inpro 90 Vitalis Nutrition, Inc. California WPI3 9000 Protient Mountain Lake, MN WPI4 WPC80 Glanbia Twin Falls, Idaho
WPI5 Bipro Davisco Food International Inc. Eden Prairie, MN
WPI6 Alacen 59191 NZMP Wellington, New Zealand
WPI7 Alacen 59337 NZMP Wellington, New Zealand
WPI8 Alacen 895 NZMP Wellington, New Zealand
SPC1 Arcon S Archer Daniels Midland Company Decatur, IL
SPC2 Arcon SM Archer Daniels Midland Company Decatur, IL
SPC3 S5700 Nutriant Cedar Falls, Iowa SPC4 Alpha 5812 The Solae Company St. Louis, MO SPI1 ISO 111 Nutriant Cedar Falls, Iowa
SPI2 Prolisse Cargill Soy Protein Solutions Wayzata, MN
SPI3 ProFam 873 Archer Daniels Midland Company Decatur, IL
SPI4 SPI6040 Protient Mountain Lake, MN *WPC 80 = whey protein concentrate 80%, WPC75 = whey protein concentrate 75%, WPI = whey protein isolate 90%, SPC = soy protein concentrate, SPI = soy protein isolate.

94
Table 5: Lexicon for whey and soy proteins (WPC80, WPI, SPC, and SPI)
aUniversal references in Meilgaard et al., 1999 bDrake et al., 2001 cDrake et al., 2003 dN’Kouka et al., 2004
Descriptor Definition Reference and Preparation
Sweet Aromatic Sweet aromatic associated with cooked Quaker oatmeal 50 g soaked in 500 ml water Oatmeal
bCooked Aromatic associated with cooked milk Cooked milk, heat skim milk to 85º*C for 30 minutes
Pasta Aromatic reminiscent of old fryer oil Cooked pasta drained [2,4]-decadienal 20 ppm and/or biscuit dough, and pasta Metallic/ Meat serum Aromatics associated with metal Rare steak juice [1]-octen-[3]-one 20 ppm or with juices of rare steak cCardboard/ Wet brown paper Aroma associated with cardboard 1inch x 1inch cut brown paper bag boiled in water for 30 minutes, drained in water [pentanal] cAnimal/Wet dog Knox unflavored gelatin Dissolve one bag of gelatin (28g) in 16 oz. in water Brothy Aromatics associated with vegetable Drained broth Food Lion® from white potato slices in glass jar stock or boiled potatoes Cereal/Grain Aromatics associated with grain Crushed, blend, filter Cheerios® 50g in 16 oz water Roasted Aromatics associated with roasted Roasted unsalted soynuts Whole Foods® brand unsalted soy nuts cFruity Aromatics associated with different fruits Fresh pineapple [ethyl hexanoate] 20 ppm cCatty Aromatics associated with tom-cat urine [2]-mecapto-[2]-methyl-pentan-[4]-one 20 ppm Soapy Aromatics associated with medium chain Ivory® soap 50 g soaked in 500 ml water
fatty acids and soaps Flour paste Aromatic associated with flour paste Gold Medal® all purpose flour 60g in 500 ml water bFecal/Dirty Aromatic associated with animal Skatole or indole 20 ppm excrement or dirt Yeasty Aromatics associated with fermenting Fleishmanns® yeast packet 7g in 500 ml water Yeast dMalty Sweet slightly fermented or sour grain Ovaltine® regular malt 8 Tbsp in 500 ml water or note Grape nuts® cereal (20g) in water 1000 ml aSalty Basic taste associated with salt 0.4% NaCl (salt) in water
aSweet Basic taste associated with sucrose 5% sucrose in water aSour Basic taste associated with acid 0.08% citric acid in water aBitter Basic taste associated with bitterness 0.08% caffeine in water aAstringency Trigeminal sensation of tongue drying Black tea, soak 6 tea bags in 500 ml water for 10 min Viscosity Force required to move a spoon back Water = 1 Cream = 3
And forth in product

95
Table 6: Proximate analysis results for whey and soy proteins Sample Protein % Moisture % Ash % Fat % WPC1 78.4e 3.6o 2.8def 6.6b 0.38 0.04 0.01 0.15 WPC2 79.4e 4.5i 2.8def 4.6e 0.33 0.03 0.01 0.08 WPC3 79.4e 4.16k 2.89def 5.3d 0.17 0.06 0.01 0.05 WPC4 77.6e 3.6o 2.7efg 4.5e 0.30 0.02 0.04 0.06 WPC5 78.1e 3.6o 3.2de 5.4d 1.1 0.01 0.08 0.06 WPC6 77.5ef 3.9m 2.9def 5.2d 0.20 0.01 0.11 0.01 WPI1 85.7d 4.8g 2.8def 1.4j 0.05 0.02 0.0 0.01 WPI2 87.0d 5.2e 2.7efg 0.1k 0.04 0.01 0.0 0.01 WPI3 87.8cd 6.1a 2.4fg 0.32k 0.29 0.05 0.04 0.11 WPI4 85.7d 2.5q 2.6efg 0.3k 7.25 0.03 0.01 0.07 WPI5 94.4a 3.2p 2.1gh 0.1k 0.09 0.04 0.01 0.01 WPI6 78.5e 4.1l 5.0b 6.0c 0.33 0.01 0.06 0.10 WPI7 90.4bc 3.6n 2.9def 0.2k 0.18 0.03 0.05 0.06 WPI8 92.7ab 4.7h 1.6h 0.22k 0.08 0.01 0.03 0.14 SPC1 74.1g 4.9f 4.2c 1.33j 0.29 0.01 0.01 0.06 SPC2 74.3fg 4.8g 4.2c 2.4h 0.40 0.09 0.04 0.20 SPC3 67.8g 5.2e 2.4d 3.1f 0.07 0.06 1.4 0.16 SPC4 77.6e 5.5d 6.3a 2.7g 0.11 0.02 0.03 0.05 SPI1 79.0e 4.4j 3.2de 14.3a 0.10 0.03 0.03 0.30 SPI2 85.9d 5.8c 6.0a 2.03i 0.13 0.03 0.01 0.03 SPI3 90.6bc 3.9m 4.6bc 2.8g 0.14 0.04 0.01 0.06 SPI4 85.1d 6.0b 5.9a 2.2hi 0.06 0.01 0.01 0.01 Numbers in the top row for each sample represent the mean and numbers in the second row of each sample represent the standard deviation Means within columns with different letters are significantly different (p<0.05)
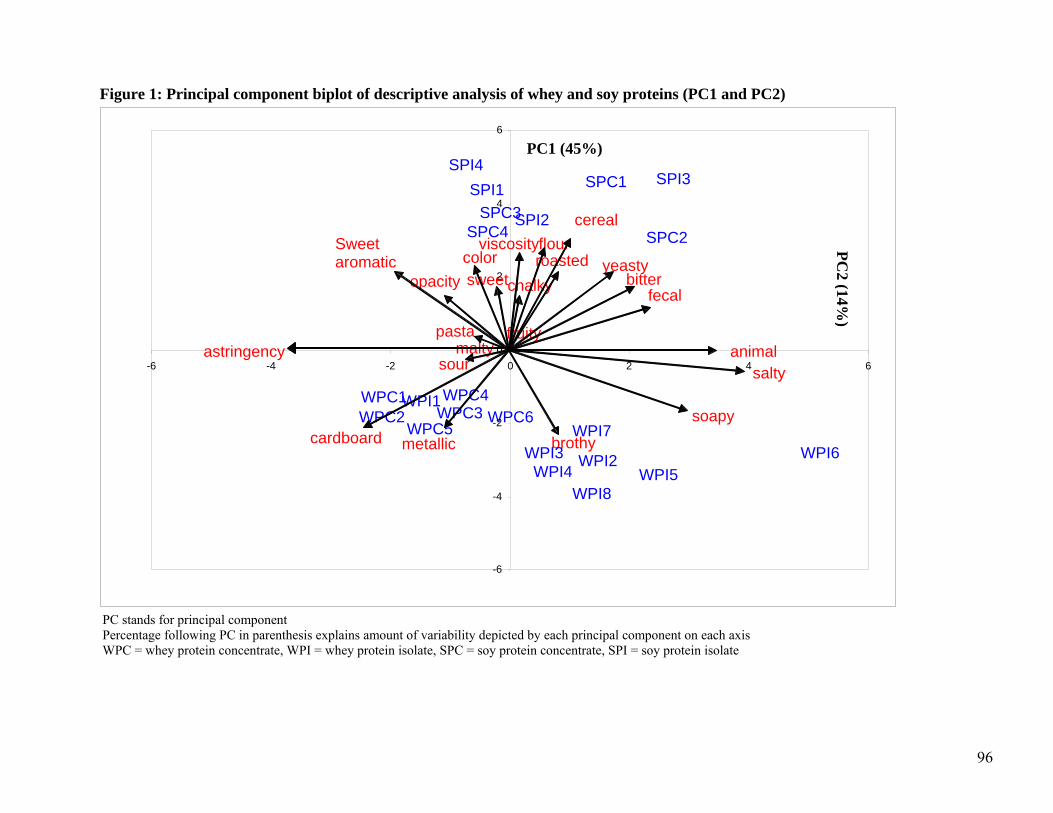
96
Figure 1: Principal component biplot of descriptive analysis of whey and soy proteins (PC1 and PC2)
PC stands for principal component Percentage following PC in parenthesis explains amount of variability depicted by each principal component on each axis WPC = whey protein concentrate, WPI = whey protein isolate, SPC = soy protein concentrate, SPI = soy protein isolate
opacitycolor
Sweet aromatic
brothy
fruityanimal
soapy
fecal
yeasty
astringency
sweet
salty
bitterchalky
cardboard
cereal
roasted
metallic
pasta
flour
sour
viscosity
SPI3SPC1
SPC4
WPI1
WPI2
WPC1 WPC4
WPI4WPI6WPI3
WPC3
WPI5
SPI2
WPC2
WPI8
WPI7
SPI4
WPC6
SPC3
WPC5
-6
-4
-2
0
2
4
6
-6 -4 -2 0 2 4 6
PC1 (45%)
malty
SPI1
SPC2 PC2 (14%
)

97
Figure 2: Principal component biplot of descriptive analysis of whey and soy proteins (PC3 and PC4)
PC stands for principal component Percentage following PC in parenthesis explains amount of variability depicted by each principal component on each axis WPC = whey protein concentrate, WPI = whey protein isolate, SPC = soy protein concentrate, SPI = soy protein isolate
soapy
opacity
colorsweet aromatic
cardboard
cereal
brothy
roasted
metallic
pasta
malty
animal
flour
yeasty
astringent sweet
sour salty
bitter
viscosity
chalky
SPI1
SPI3
SPC1
SPC4WPI1
WPI2
WPC1WPC4
WPI6
WPI3
WPC3WPI5 SPI2
WPC2
WPI8
WPI7
SPI4
WPC6SPC3
SPC2
WPC5
-10
-8
-6
-4
-2
0
2
4
6
8
10
-10 -8 -6 -4 -2 0 2 4 6 8 10
PC4 (6%)
PC3 (7%)
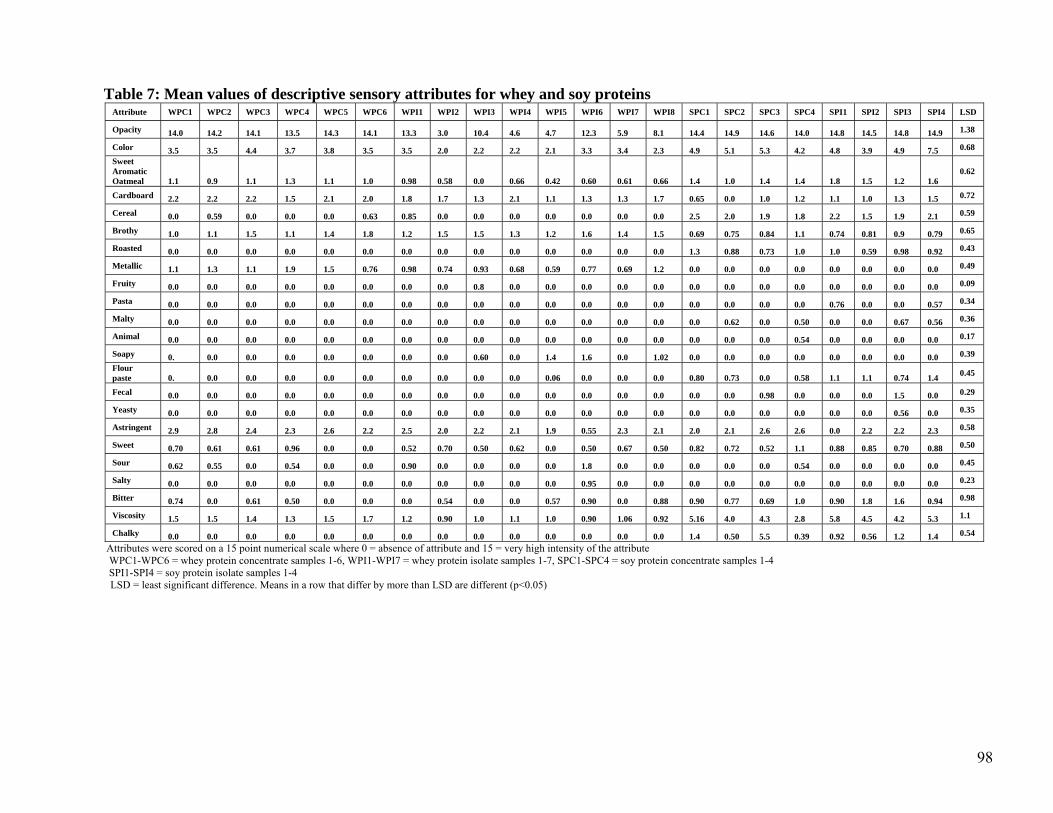
98
Table 7: Mean values of descriptive sensory attributes for whey and soy proteins Attribute WPC1 WPC2 WPC3 WPC4 WPC5 WPC6 WPI1 WPI2 WPI3 WPI4 WPI5 WPI6 WPI7 WPI8 SPC1 SPC2 SPC3 SPC4 SPI1 SPI2 SPI3 SPI4 LSD
Opacity 14.0 14.2 14.1 13.5 14.3 14.1 13.3 3.0 10.4 4.6 4.7 12.3 5.9 8.1 14.4 14.9 14.6 14.0 14.8 14.5 14.8 14.9 1.38
Color 3.5 3.5 4.4 3.7 3.8 3.5 3.5 2.0 2.2 2.2 2.1 3.3 3.4 2.3 4.9 5.1 5.3 4.2 4.8 3.9 4.9 7.5 0.68 Sweet Aromatic Oatmeal 1.1 0.9 1.1 1.3 1.1 1.0 0.98 0.58 0.0 0.66 0.42 0.60 0.61 0.66 1.4 1.0 1.4 1.4 1.8 1.5 1.2 1.6
0.62
Cardboard 2.2 2.2 2.2 1.5 2.1 2.0 1.8 1.7 1.3 2.1 1.1 1.3 1.3 1.7 0.65 0.0 1.0 1.2 1.1 1.0 1.3 1.5 0.72
Cereal 0.0 0.59 0.0 0.0 0.0 0.63 0.85 0.0 0.0 0.0 0.0 0.0 0.0 0.0 2.5 2.0 1.9 1.8 2.2 1.5 1.9 2.1 0.59
Brothy 1.0 1.1 1.5 1.1 1.4 1.8 1.2 1.5 1.5 1.3 1.2 1.6 1.4 1.5 0.69 0.75 0.84 1.1 0.74 0.81 0.9 0.79 0.65
Roasted 0.0 0.0 0.0 0.0 0.0 0.0 0.0 0.0 0.0 0.0 0.0 0.0 0.0 0.0 1.3 0.88 0.73 1.0 1.0 0.59 0.98 0.92 0.43
Metallic 1.1 1.3 1.1 1.9 1.5 0.76 0.98 0.74 0.93 0.68 0.59 0.77 0.69 1.2 0.0 0.0 0.0 0.0 0.0 0.0 0.0 0.0 0.49
Fruity 0.0 0.0 0.0 0.0 0.0 0.0 0.0 0.0 0.8 0.0 0.0 0.0 0.0 0.0 0.0 0.0 0.0 0.0 0.0 0.0 0.0 0.0 0.09
Pasta 0.0 0.0 0.0 0.0 0.0 0.0 0.0 0.0 0.0 0.0 0.0 0.0 0.0 0.0 0.0 0.0 0.0 0.0 0.76 0.0 0.0 0.57 0.34
Malty 0.0 0.0 0.0 0.0 0.0 0.0 0.0 0.0 0.0 0.0 0.0 0.0 0.0 0.0 0.0 0.62 0.0 0.50 0.0 0.0 0.67 0.56 0.36
Animal 0.0 0.0 0.0 0.0 0.0 0.0 0.0 0.0 0.0 0.0 0.0 0.0 0.0 0.0 0.0 0.0 0.0 0.54 0.0 0.0 0.0 0.0 0.17
Soapy 0. 0.0 0.0 0.0 0.0 0.0 0.0 0.0 0.60 0.0 1.4 1.6 0.0 1.02 0.0 0.0 0.0 0.0 0.0 0.0 0.0 0.0 0.39 Flour paste 0. 0.0 0.0 0.0 0.0 0.0 0.0 0.0 0.0 0.0 0.06 0.0 0.0 0.0 0.80 0.73 0.0 0.58 1.1 1.1 0.74 1.4 0.45
Fecal 0.0 0.0 0.0 0.0 0.0 0.0 0.0 0.0 0.0 0.0 0.0 0.0 0.0 0.0 0.0 0.0 0.98 0.0 0.0 0.0 1.5 0.0 0.29
Yeasty 0.0 0.0 0.0 0.0 0.0 0.0 0.0 0.0 0.0 0.0 0.0 0.0 0.0 0.0 0.0 0.0 0.0 0.0 0.0 0.0 0.56 0.0 0.35
Astringent 2.9 2.8 2.4 2.3 2.6 2.2 2.5 2.0 2.2 2.1 1.9 0.55 2.3 2.1 2.0 2.1 2.6 2.6 0.0 2.2 2.2 2.3 0.58
Sweet 0.70 0.61 0.61 0.96 0.0 0.0 0.52 0.70 0.50 0.62 0.0 0.50 0.67 0.50 0.82 0.72 0.52 1.1 0.88 0.85 0.70 0.88 0.50
Sour 0.62 0.55 0.0 0.54 0.0 0.0 0.90 0.0 0.0 0.0 0.0 1.8 0.0 0.0 0.0 0.0 0.0 0.54 0.0 0.0 0.0 0.0 0.45
Salty 0.0 0.0 0.0 0.0 0.0 0.0 0.0 0.0 0.0 0.0 0.0 0.95 0.0 0.0 0.0 0.0 0.0 0.0 0.0 0.0 0.0 0.0 0.23
Bitter 0.74 0.0 0.61 0.50 0.0 0.0 0.0 0.54 0.0 0.0 0.57 0.90 0.0 0.88 0.90 0.77 0.69 1.0 0.90 1.8 1.6 0.94 0.98
Viscosity 1.5 1.5 1.4 1.3 1.5 1.7 1.2 0.90 1.0 1.1 1.0 0.90 1.06 0.92 5.16 4.0 4.3 2.8 5.8 4.5 4.2 5.3 1.1
Chalky 0.0 0.0 0.0 0.0 0.0 0.0 0.0 0.0 0.0 0.0 0.0 0.0 0.0 0.0 1.4 0.50 5.5 0.39 0.92 0.56 1.2 1.4 0.54
Attributes were scored on a 15 point numerical scale where 0 = absence of attribute and 15 = very high intensity of the attribute WPC1-WPC6 = whey protein concentrate samples 1-6, WPI1-WPI7 = whey protein isolate samples 1-7, SPC1-SPC4 = soy protein concentrate samples 1-4 SPI1-SPI4 = soy protein isolate samples 1-4 LSD = least significant difference. Means in a row that differ by more than LSD are different (p<0.05)

99
Table 8: Eigenvector loadings of each attribute for whey and soy protein principle component analysis
Attribute Factor 1 Factor 2 Factor 3 Factor 4 Opacity 0.19 -0.18 0.26 0.19 Color 0.25 -0.10 0.09 0.12 Sweet Aromatic Oatmeal 0.25 -0.24 0.07 0.20 Cardboard -0.19 -0.31 -0.12 0.17 Cereal 0.30 0.02 0.03 -0.07 Brothy -0.25 0.05 -0.13 0.10 Roasted 0.29 0.04 -0.01 -0.14 Metallic -0.23 -0.21 0.10 0.06 Pasta 0.24 -0.05 0.19 0.28 Malty 0.01 -0.04 -0.09 -0.28 Animal wet dog 0.01 0.34 -0.26 0.01 Soapy -0.18 0.29 0.27 0.27 Flour paste 0.29 0.01 0.04 0.13 Fecal 0.15 0.21 -0.28 -0.07 Yeasty 0.23 0.14 -0.18 0.06 Astringent 0.01 -0.44 0.06 0.02
Sweet 0.18 -0.09 0.05 -0.02
Sour -0.02 -0.11 0.35 0.06 Salty -0.06 0.39 0.35 0.30 Bitter 0.19 0.18 -0.07 0.29 Viscosity 0.29 -0.01 0.03 0.03 Chalky 0.18 -0.02 -0.15 0.12 Variance Explaineda 44% 13% 7% 6%
arefers to percent variance explained Numbers in bold are believed to be of primary importance

100
Figure 3: Principal component biplot of descriptive analysis of whey proteins (PC1 and PC2)
PC stands for principal component Percentage following PC in parentheses explains amount of variability depicted by each principal component WPC = whey protein concentrate, WPI = whey protein isolate, SPC = soy protein concentrate, SPI = soy protein isolate
pasta
sour
opacitycolor
Sweet Aromatic
cardboard
cereal
brothy
metallic
fruity
animal
soapyflour
astringency
sweet
salty
bitter
viscositychalk
WPI1
WPI2WPI3
WPC2
WPI8
WPC5WPC1
WPC4
WPI4
WPI6
WPC3
WPI5
WPI7
WPC6
-4
-3
-2
-1
0
1
2
3
4
5
-5 -4 -3 -2 -1 0 1 2 3 4 5
PC1 (36%)
PC2 (15%)

101
Table 9: Eigenvector loadings of each attribute for sensory analysis of whey proteins (WPC and WPI)
Attribute Factor 1 Factor 2 Factor 3 Factor 4 Opacity 0.29 0.26 0.15 0.10 Color 0.29 0.22 -0.15 -0.01 Sweet Aromatic Oatmeal 0.33 0.17 -0.11 0.13 Cardboard 0.26 -0.11 -0.05 -0.09 Cereal 0.25 0.07 0.17 -0.27 Brothy -0.13 0.18 -0.16 -0.29 Metallic 0.22 0.10 -0.03 0.43 Fruity 0.07 -0.22 0.26 0.31 Pasta 0.11 0.47 0.10 0.18 Animal wet dog -0.19 0.32 -0.26 0.10 Soapy -0.23 0.23 0.35 -0.07 Flour paste 0.19 0.27 -0.20 -0.38 Astringent 0.30 -0.12 0.14 0.15 Sweet 0.11 0.14 -0.37 0.25 Sour 0.13 0.05 0.44 -0.08 Salty -0.15 0.42 0.14 -0.05 Bitter -0.16 0.21 0.29 0.34 Viscosity 0.33 -0.01 -0.07 -0.13 Chalky 0.27 -0.03 0.31 -0.30 Variance Explaineda 36% 15% 11% 9%
arefers to percent variance explained Numbers in bold are believed to be of primary importance

102
Figure 4: Principal component biplot of descriptive analysis of whey proteins (PC3 and PC4)
PC stands for principal component Percentage following PC in parentheses explains amount of variability depicted by each principal component WPC = whey protein concentrate, WPI = whey protein isolate, SPC = soy protein concentrate, SPI = soy protein isolate
brothy
pasta
flour
sweet
WPI7
opacity
color
Sweet aromaticcardboard
cereal
metallic
fruity
animal
soapy
astringent
sour
bitter
viscosity
chalky WPI1
WPI2
WPC1
WPC4WPI4
WPI6
WPI3
WPC3
WPI5
WPC2
WPI8
WPC6
-4
-3
-2
0
1
2
3
4
-4 -3 -2 -1 0 1 2 3 4
PC3 (11%)
PC4 (9%)WPC5
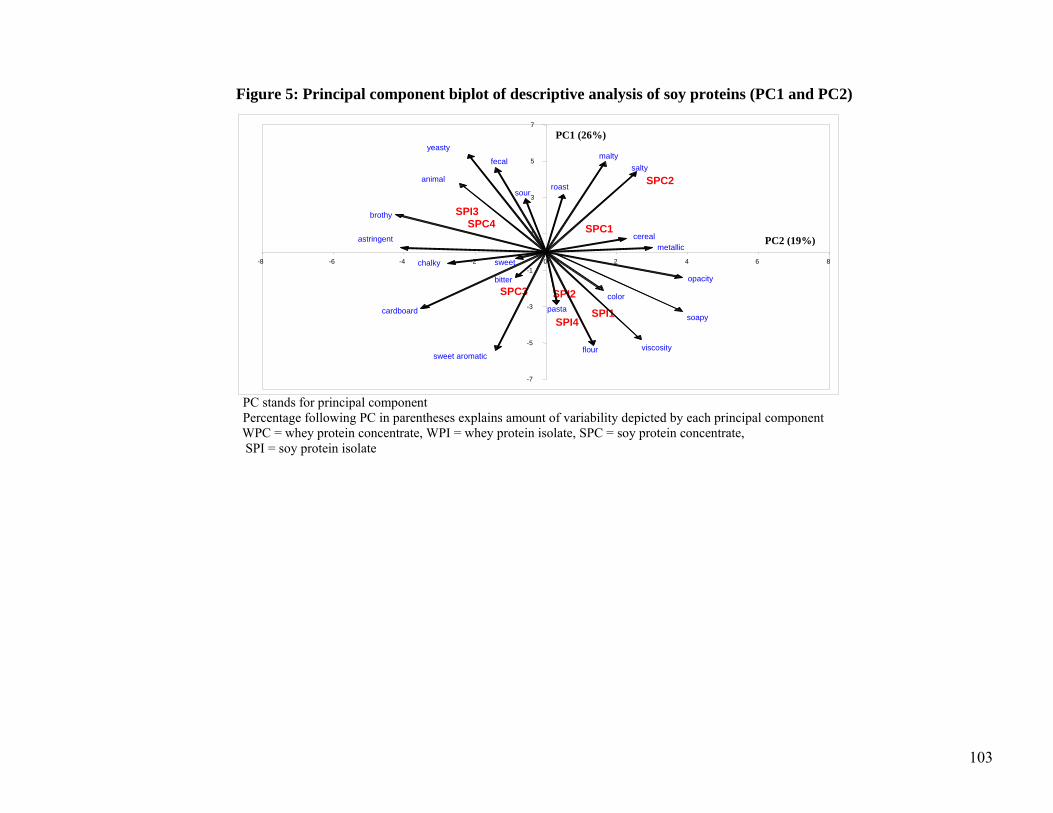
103
Figure 5: Principal component biplot of descriptive analysis of soy proteins (PC1 and PC2)
PC stands for principal component Percentage following PC in parentheses explains amount of variability depicted by each principal component
WPC = whey protein concentrate, WPI = whey protein isolate, SPC = soy protein concentrate, SPI = soy protein isolate
opacity
color
sweet aromatic
cardboard
cereal
brothy
roast
metallic
pasta
malty animal
soapy
flour
fecal
yeasty
astringent
sweet
sour
salty
bitter
viscosity
chalky
SPI1
SPI3SPC1 SPC4
SPI2
SPI4
SPC3
SPC2
-7
-5
-3
-1
1
3
5
7
-8 -6 -4 -2 0 2 4 6 8
PC1 (26%)
PC2 (19%)

104
Table 10: Eigenvector loadings of each attribute for sensory analysis of soy proteins (SPC and SPI)
Attribute Factor 1 Factor 2 Factor 3 Factor 4 Opacity -0.08 0.25 0.11 -0.18 Color -0.12 0.07 0.20 0.07 Sweet
Aromatic Oatmeal -0.36 -0.04 0.01 0.13
Cardboard -0.12 -0.29 0.06 0.20 Cereal 0.03 0.15 0.43 0.16 Brothy 0.12 -0.33 -0.26 0.19 Roasted 0.15 0.03 0.32 0.31 Metallic -0.01 0.19 -0.31 0.18
Pasta -0.30 0.03 0.16 0.25 Malty 0.26 0.09 -0.04 0.13
Animal wet dog 0.21 -0.18 0.20 -0.05
Soapy -0.17 0.20 -0.37 0.09 Flour paste -0.35 0.07 0.06 -0.01
Fecal 0.26 -0.14 0.07 -0.12 Yeasty 0.27 -0.18 0.07 -0.07
Astringent -0.01 -0.32 0.02 0.11 Sweet -0.01 -0.01 -0.18 0.48 Sour 0.16 -0.01 0.14 0.45 Salty 0.30 0.25 -0.03 0.02 Bitter -0.04 -0.09 -0.29 -0.14
Viscosity -0.28 0.18 0.21 -0.05 Chalky -0.07 -0.2 0.22 -0.31
% Variance Explaineda 26% 19% 17% 14%
arefers to percent variance explained Numbers in bold are believed to be of primary importance

105
Figure 6: Principal component biplot of descriptive analysis of soy proteins (PC3 and PC4)
PC stands for principal component Percentage following PC in parenthesis explains amount of variability depicted by each principal component on each axis WPC = whey protein concentrate, WPI = whey protein isolate, SPC = soy protein concentrate, SPI = soy protein isolate
cereal
opacity
color
Sweet Aromatic
cardboard
brothy
roasted
metallic
fruity
pasta
maltycatty
animal
soapy
flourfecal yeasty
astringent
sweet
sour
salty
bitter
viscositychalky
SPI1SPI3
SPC1
SPC4
SPI2
SPI4
SPC3
SPC2
-7
-5
-3
-1
1
3
5
7
-8 -6 -4 -2 0 2 4 6 8
PC3 (17%)
PC4 (14%)

106
Table 11: Correlations between descriptive sensory attributes of whey and soy proteins Opac Col SwA Card Cer Brot Roas Met Fruit Past Anim Soap Flou Ast Swee Sour Salty Bitt Visc Cha
Opac 1.00 0.72 0.78 -0.13 0.57 -0.45 0.49 -0.16 0.19 0.61 -0.13 -0.38 0.52 0.46 0.33 0.17 -0.05 0.38 0.57 0.32
Col 1.00 0.76 -0.32 0.78 -0.65 0.73 -0.49 0.05 0.72 -0.09 -0.51 0.81 0.21 0.45 -0.06 -0.13 0.39 0.81 0.53
SwA 1.00 -0.25 0.76 -0.68 0.69 -0.36 0.02 0.85 -0.20 -0.62 0.78 0.32 0.64 0.01 -0.34 0.47 0.81 0.44
Card 1.00 -0.68 0.59 -0.65 0.68 -0.26 -0.45 -0.26 0.05 -0.59 0.50 -0.32 0.17 -0.17 -0.45 -0.60 -0.38
Cer 1.00 -0.82 0.97 -0.80 0.29 0.77 0.05 -0.54 0.90 -0.03 0.56 -0.01 -0.18 0.56 0.95 0.58
Brot 1.0 -0.78 0.55 -0.26 -0.64 0.10 0.47 -0.78 -0.11 -0.47 -0.12 0.25 -0.49 -0.82 -0.49
Roas 1.00 -0.78 0.29 0.71 0.13 -0.56 0.83 -0.04 0.62 -0.05 -0.19 0.54 0.90 0.49
Met 1.00 -0.09 -0.53 -0.16 0.28 -0.78 0.25 -0.32 0.17 0.01 -0.56 -0.76 -0.53
Fruit 1.00 0.02 -0.11 -0.14 0.05 0.08 0.04 0.12 -0.08 -0.18 0.18 -0.06
Past 1.000 -0.04 -0.30 0.84 0.00 0.54 0.01 0.0 0.46 0.84 0.42
Anim 1.00 0.07 -0.08 -0.41 0.01 -0.15 0.36 0.20 -0.01 0.01
Soap 1.00 -0.43 -0.41 -0.49 0.12 0.73 -0.10 -0.51 -0.35
Flou 1.00 -0.06 0.53 -0.13 -0.14 0.65 0.96 0.59
Ast 1.00 0.03 0.28 -0.40 -0.17 -0.04 0.16
Swee 1.00 0.07 -0.18 0.39 0.50 -0.01
Sour 1.00 0.10 -0.06 -0.13 -0.19
Salty 1.00 0.15 -0.19 -0.12
Bitt 1.000 0.60 0.20
Visc 1.00 0.58
Cha 1.00
Numbers in bold represent significant correlations (p<0.05) Opac = opacity, Col = color, SwA = sweet aromatic, Card = cardboard, Brot = brothy, Met = metallic, Fruit = fruity, Past = pasta, Anim = animal wet/dog, Soap = soapy, Flou = flour paste, Fec = fecal, Yeas = yeasty, Ast = astringency, Swee = sweet, Bitt = bitter, Visc = viscosity, Cha = chalkiness

107
Table 12: Correlations between descriptive sensory attributes of whey proteins Opac Color SwA Card Cereal Brothy Met Soap Ast Sweet Sour Salty Bitter Visc
Opacity 1.00 0.79 0.83 0.50 0.47 -004 0.59 -0.19 0.68 0.13 0.29 0.02 0.09 0.73 Color 1.00 0.80 0.49 0.45 -0.07 0.52 -0.43 0.60 0.28 0.04 -0.03 -0.31 0.70 Sweet Aromatic
1.00 0.55 0.51 -0.24 0.78 -0.53 0.63 0.46 0.23 -0.24 -0.29 0.77
Cardboard 1.00 0.25 0.01 0.26 -0.56 0.67 0.01 0.14 -0.28 -0.32 0.67 Cereal 1.00 -0.24 0.19 -0.33 0.36 0.18 0.63 -0.16 -0.38 0.51 Brothy 1.00 -0.38 0.20 -0.47 -0.20 -0.48 0.32 0.24 -0.10 Metallic 1.00 -0.29 0.42 0.40 0.14 -0.18 -0.15 0.41 Soapy 1.00 -0.53 -0.41 0.07 0.73 0.51 -0.54 Astringency 1.00 0.01 0.32 -0.39 -0.17 0.73 Sweet 1.00 0.06 -0.03 -0.19 0.13 Sour 1.00 0.08 0.07 0.05 Salty 1.00 0.41 -0.43 Bitter 1.00 -0.46 Viscosity 1.00
Numbers in bold represent significant correlations (p<0.05) Opac = opacity, SwA = sweet aromatic, Card = carboard/wet paper, Roas = roasted, Met = metallic, An = animal wet/dog, Soap = soapy, Flour = flour paste, Ast = astringency, Visc = viscosity, Chalky = chalkiness

108
Table 13: Correlations between descriptive sensory attributes of soy proteins Opac Col SwA Card Cer Brot Roas Past Malty Anim Flou Fec Yeas Ast Swee Sour Bitt Visc Cha
Opac 1.00 0.59 0.02 0.08 0.17 -0.66 -0.23 0.15 0.24 -0.25 0.56 0.19 0.11 -0.34 -0.54 -0.19 -0.10 0.55 0.08
Col 1.00 0.08 0.49 0.31 -0.32 0.09 0.30 0.24 -0.24 0.68 -0.02 0.01 0.09 -0.16 0.23 -0.39 0.38 0.23
SwA 1.00 0.38 0.03 -0.39 -0.15 0.89 -0.62 -0.35 0.71 -0.58 -0.62 0.05 0.28 -0.18 0.13 0.66 0.01
Card 1.00 -0.08 -0.57 0.01 0.41 0.09 0.05 0.43 0.24 0.33 0.56 0.19 0.34 -0.01 0.04 0.16
Cer 1.00 -0.57 0.85 0.39 0.08 0.34 0.03 0.01 -0.03 -0.21 -0.06 0.49 -0.59 0.44 0.03
Brot 1.00 -0.13 -0.29 0.13 0.05 -0.44 0.18 0.36 0.65 0.49 0.32 0.17 -0.82 -0.09
Roas 1.00 0.18 0.33 0.55 -0.31 0.17 0.16 -0.09 0.31 0.75 -0.43 0.05 -0.24
Past 1.00 -0.45 -0.33 0.68 -0.53 -0.52 0.09 0.30 0.17 -0.24 0.69 -0.02
Malty 1.00 0.35 -0.30 0.67 0.59 -0.28 0.16 0.50 0.12 -0.30 -0.55
Anim 1.00 -0.48 0.71 0.55 -0.18 -0.14 0.16 0.26 -0.10 -0.01
Flou 1.00 -0.42 -0.48 -0.07 -0.09 -0.27 0.01 0.76 0.17
Fec 1.00 0.93 -0.03 -0.33 0.18 0.23 -0.31 -0.01
Yeas 1.00 0.29 -0.31 0.33 -0.03 -0.51 0.14
Ast 1.00 0.07 0.31 -0.44 -0.49 0.54
Swee 1.00 0.54 0.11 -0.19 -0.71
Sour 1.00 -0.53 -0.29 -0.33
Bitt 1.00 0.04 -0.38
Visc 1.00 0.03
Cha 1.00
Numbers in bold represent significant correlations (p<0.05) Opac = opacity, Col = color, SwA = sweet aromatic, Card = cardboard, Brot = brothy, Met = metallic, Fruit = fruity, Past = pasta, Anim = animal wet/dog, Soap = soapy, Flou = flour paste, Fec = fecal, Yeas = yeasty, Ast = astringency, Swee = sweet, Bitt = bitter, Visc = viscosity, Cha = chalkiness
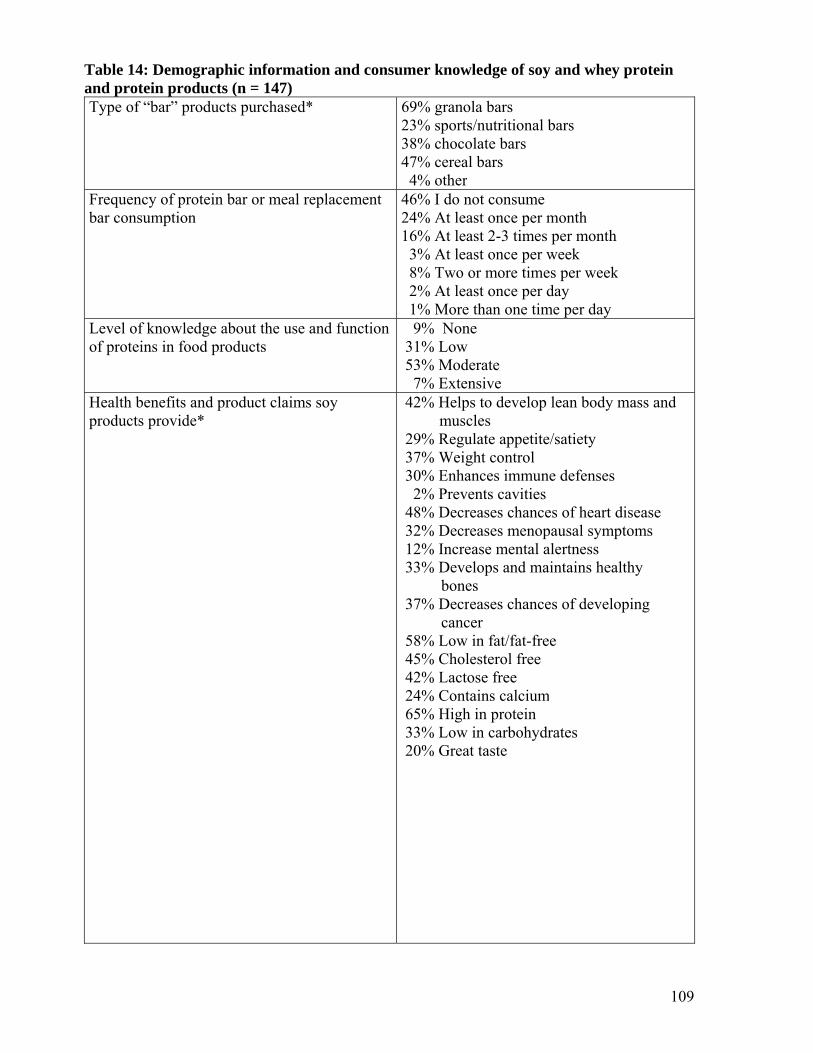
109
Table 14: Demographic information and consumer knowledge of soy and whey protein and protein products (n = 147) Type of “bar” products purchased* 69% granola bars
23% sports/nutritional bars 38% chocolate bars 47% cereal bars 4% other
Frequency of protein bar or meal replacement bar consumption
46% I do not consume 24% At least once per month 16% At least 2-3 times per month 3% At least once per week 8% Two or more times per week 2% At least once per day 1% More than one time per day
Level of knowledge about the use and function of proteins in food products
9% None 31% Low 53% Moderate 7% Extensive
Health benefits and product claims soy products provide*
42% Helps to develop lean body mass and muscles 29% Regulate appetite/satiety 37% Weight control 30% Enhances immune defenses 2% Prevents cavities 48% Decreases chances of heart disease 32% Decreases menopausal symptoms 12% Increase mental alertness 33% Develops and maintains healthy bones 37% Decreases chances of developing cancer 58% Low in fat/fat-free 45% Cholesterol free 42% Lactose free 24% Contains calcium 65% High in protein 33% Low in carbohydrates 20% Great taste

110
Health benefits and product claims dairy products provide*
51% Rich in essential amino acids for lean body mass/muscle 21% Regulate appetite/satiety 24% Weight control 39% Enhances immune defenses 39% Prevents cavities 17% Decrease chances of heart disease 8% Decrease menopausal symptoms 7% Increase mental alertness 88% Develops and maintains healthy bones 18% Decrease chances of developing cancer
32% Low in fat/fat-free 13% Cholesterol free 10% Lactose free 80% Contains calcium 44% High in protein 17% Low in carbohydrates 63% Great taste 20% Does not contain genetically modified ingredients
Purchase of food and/or beverage products that contain added protein
32% Yes 68% No
Type of food and/or beverage products likely to purchase and consume if high protein*
47% Breakfast cereal 48% Protein bars 17% Soy milk 61% Dairy products 14% Baked goods 18% Soy products 23% Snack products 42% Smoothies/shakes 16% Coffee based beverages 15% Soup 48% Cow’s milk 69% Meat products 49% Legumes 18% Frozen entrees 5% Other
Consumer perception on statement “Cow’s l milk is a healthy food”
28% Agree strongly 57% Agree 10% Neither agree or disagree 3% Disagree 3% Disagree strongly
Consumer perception on statement “Soy milk is a healthy food”
20% Agree strongly 50% Agree 30% Neither agree or disagree 0% Disagree 1% Disagree strongly

111
Consumer perception on statement “Cow’s l milk tastes good”
39% Agree strongly 45% Agree 5% Neither agree or disagree 8% Disagree 2% Disagree strongly
Consumer perception on statement “Soy milk tastes good”
8% Agree strongly 12% Agree 46% Neither agree or disagree 25% Disagree 11% Disagree strongly
*Indicates panelists were allowed to choose more than more category so percentages do not add up to 100%

112
Table 15: Rank score of health claims that influence purchase intent of protein bars
Factor Mean ranking
Develops and maintains healthy bones 4.2E
Weight control 5.3BC
Decreases chances of heart disease 4.5DE
Enhances immune defenses 4.9CD
Helps to develop lean body mass and muscle
6.8A
Decreases chances of developing cancer 4.3E
Suppresses/reduces appetite 5.6B
Protects teeth from decay 4.6DE
Increase metal alertness 4.4DE
*Panelists were instructed to rank each choice in order, most important = 1; least important = 10 ranks followed by different letters are different (p<0.05)

113
Table 16: Ranking score of product features that influence purchase intent of protein bars
Factor Mean ranking
Contains no animal fat 3.8E
Free from trans fatty acids 4.5D
Cholesterol free 7.5A
High in protein 4.7CD
Low in fat/fat-free 7.6A
Does not contain genetically modified ingredients 3.4E
Contains no soy products 5.2C
Low in carbohydrates 4.6CD
Contains calcium 6.1B
Lactose free 7.2A
*Panelists were allowed to rank each choice in order, most important = 1; least important = 1 +Ranks followed by different letters are different (p<0

114
Appendix
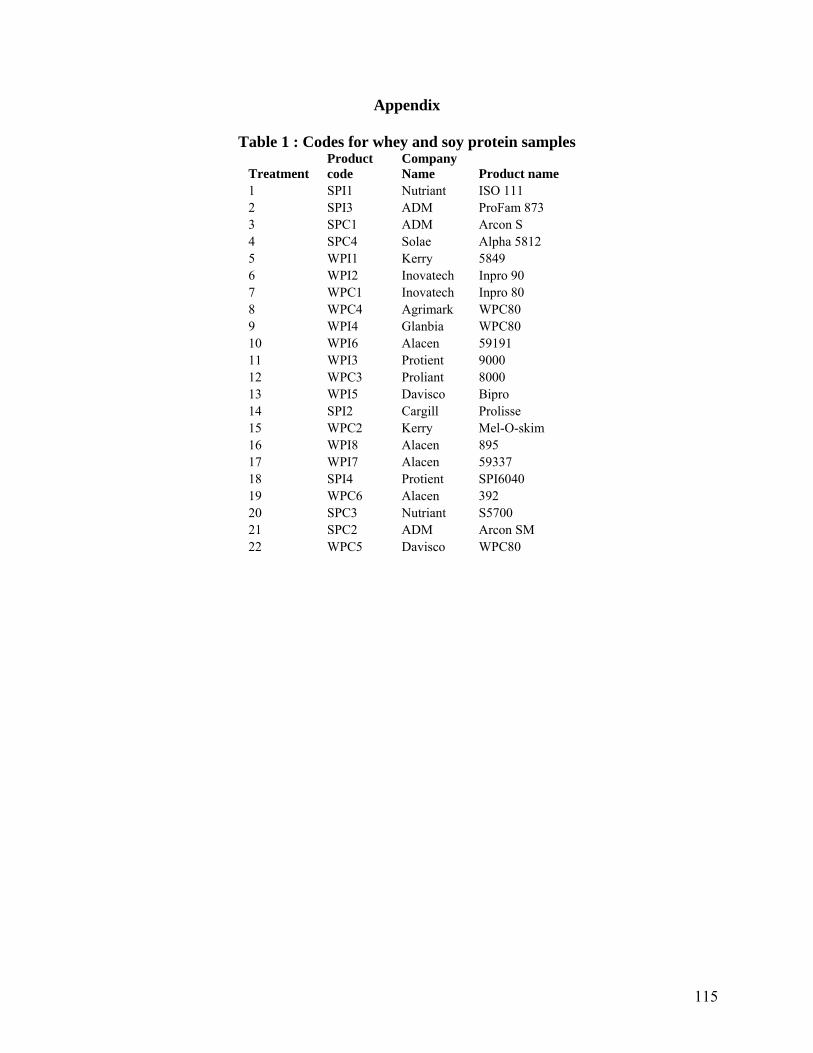
115
Appendix
Table 1 : Codes for whey and soy protein samples
Treatment Product code
Company Name Product name
1 SPI1 Nutriant ISO 111 2 SPI3 ADM ProFam 873 3 SPC1 ADM Arcon S 4 SPC4 Solae Alpha 5812 5 WPI1 Kerry 5849 6 WPI2 Inovatech Inpro 90 7 WPC1 Inovatech Inpro 80 8 WPC4 Agrimark WPC80 9 WPI4 Glanbia WPC80 10 WPI6 Alacen 59191 11 WPI3 Protient 9000 12 WPC3 Proliant 8000 13 WPI5 Davisco Bipro 14 SPI2 Cargill Prolisse 15 WPC2 Kerry Mel-O-skim 16 WPI8 Alacen 895 17 WPI7 Alacen 59337 18 SPI4 Protient SPI6040 19 WPC6 Alacen 392 20 SPC3 Nutriant S5700 21 SPC2 ADM Arcon SM 22 WPC5 Davisco WPC80

116
Table 2: Descriptive scoring ballot and references for evaluation
Basic Taste References (30 ml per 2 oz. sample cup) Salty: 0.2% NaCl (salt) in water = 1 Sweet: 2% sucrose in water = 2, 5% sucrose in water = 5 Sour: 0.05% citric acid in water = 2, 0.08% citric acid in water = 5 Bitter: 0.05% caffeine = 2, 0.08% caffeine = 5
Warm-up: R1 (whey protein concentrate 80%) Attribute Intensity Sweet Aromatic 2 Brothy/Potato/Mushroom 1 Cardboard/Wet brown paper 3 Astringency 3.5
Warm-up: R2 (soy protein concentrate) Attribute Intensity Sweet Aromatic 3 Brothy/Potato/Mushroom 2.5 Fecal/Dirty 3.5 Malty 1 Astringency 4.5 Bitter 5
Terms Opacity - the degree to which the liquid is opaque.
Very opaque (whole milk) = 15 Not opaque(water) =0 Color Intensity - the intensity or strength of the color from light to dark.
No color = 0 (clear) Dark intense color = 15 (black) Aroma - swirl sample cup prior to evaluation; evaluate the intensity of the aroma in the headspace of the sample cup. Flavor - swirl sample cup prior to evaluation and expectorate sample. Viscosity - the force required to slurp the sample off of a spoon.
Water = 1 Heavy Cream = 3 Maple Syrup = 6.8 Condensed milk = 14
Astringency - mouth drying intensity after swallowing or expectorating sample
Chalkiness - presence or absence of particles in mouth

117
Table 3: WPC, WPI, SPC, and SPI Descriptive Ballot
Tasting order_________________________________________________ Name_________________________ Panelist # _____________________
COLOR/APPEARANCE
Opacity |____|____|____|____|____|____|____|____|____|____|____|____|____|____|___| 0 1 2 3 4 5 6 7 8 9 10 11 12 13 14 15 not very opaque opaque
Color intensity |____|____|____|____|____|____|____|____|____|____|____|____|____|____|___| 0 1 2 3 4 5 6 7 8 9 10 11 12 13 14 15 No Color dark intense color
AROMA Sweet Aromatic/Oatmeal |____|____|____|____|____|____|____|____|____|____|____|____|____|____|___| 0 1 2 3 4 5 6 7 8 9 10 11 12 13 14 15 none high
FLAVOR Cardboard/Wet brown paper |____|____|____|____|____|____|____|____|____|____|____|____|____|____|___| 0 1 2 3 4 5 6 7 8 9 10 11 12 13 14 15 none high
Cereal/Grain/Toasted |____|____|____|____|____|____|____|____|____|____|____|____|____|____|___| 0 1 2 3 4 5 6 7 8 9 10 11 12 13 14 15 none high
Brothy/Potato/Mushroom |____|____|____|____|____|____|____|____|____|____|____|____|____|____|___| 0 1 2 3 4 5 6 7 8 9 10 11 12 13 14 15 none high Roasted/Nutty/Burnt |____|____|____|____|____|____|____|____|____|____|____|____|____|____|___| 0 1 2 3 4 5 6 7 8 9 10 11 12 13 14 15 none high

118
Metallic/ Meat Serum |____|____|____|____|____|____|____|____|____|____|____|____|____|____|___| 0 1 2 3 4 5 6 7 8 9 10 11 12 13 14 15 none high Fruity |____|____|____|____|____|____|____|____|____|____|____|____|____|____|___| 0 1 2 3 4 5 6 7 8 9 10 11 12 13 14 15 none high
Pasta/Dough/Fatty |____|____|____|____|____|____|____|____|____|____|____|____|____|____|___| 0 1 2 3 4 5 6 7 8 9 10 11 12 13 14 15 none high
Malty |____|____|____|____|____|____|____|____|____|____|____|____|____|____|___| 0 1 2 3 4 5 6 7 8 9 10 11 12 13 14 15 none high Catty |____|____|____|____|____|____|____|____|____|____|____|____|____|____|___| 0 1 2 3 4 5 6 7 8 9 10 11 12 13 14 15 none high Animal/Wet dog |____|____|____|____|____|____|____|____|____|____|____|____|____|____|___| 0 1 2 3 4 5 6 7 8 9 10 11 12 13 14 15 none high
Soapy |____|____|____|____|____|____|____|____|____|____|____|____|____|____|___| 0 1 2 3 4 5 6 7 8 9 10 11 12 13 14 15 none high
Fecal/Dirty |____|____|____|____|____|____|____|____|____|____|____|____|____|____|___| 0 1 2 3 4 5 6 7 8 9 10 11 12 13 14 15 none high
Yeasty |____|____|____|____|____|____|____|____|____|____|____|____|____|____|___| 0 1 2 3 4 5 6 7 8 9 10 11 12 13 14 15 none high

119
Flour paste |____|____|____|____|____|____|____|____|____|____|____|____|____|____|___| 0 1 2 3 4 5 6 7 8 9 10 11 12 13 14 15 none high
FEELING FACTORS
Astringency |____|____|____|____|____|____|____|____|____|____|____|____|____|____|___| 0 1 2 3 4 5 6 7 8 9 10 11 12 13 14 15 none high
BASIC TASTES
Sweet taste |____|____|____|____|____|____|____|____|____|____|____|____|____|____|___| 0 1 2 3 4 5 6 7 8 9 10 11 12 13 14 15 none high
Sour taste |____|____|____|____|____|____|____|____|____|____|____|____|____|____|___| 0 1 2 3 4 5 6 7 8 9 10 11 12 13 14 15 none high
Salty taste |____|____|____|____|____|____|____|____|____|____|____|____|____|____|___| 0 1 2 3 4 5 6 7 8 9 10 11 12 13 14 15 none high
Bitter taste |____|____|____|____|____|____|____|____|____|____|____|____|____|____|___| 0 1 2 3 4 5 6 7 8 9 10 11 12 13 14 15 none high
TEXTURE/MOUTHFEEL
Viscosity |____|____|____|____|____|____|____|____|____|____|____|____|____|____|___| 0 1 2 3 4 5 6 7 8 9 10 11 12 13 14 15 none high
Chalkiness |____|____|____|____|____|____|____|____|____|____|____|____|____|____|___| 0 1 2 3 4 5 6 7 8 9 10 11 12 13 14 15 none high

120
Table 4: U&A questionnaire
1. What type of “bar” product do you normally purchase? You may select (√) more than one response.
Granola bars Sports/Nutritional bars Chocolate bars Cereal bars Other ___________________ 2. How often do you consume protein bars or meal replacement bars? Please select (√) one response. I do not consume At least once per month At least 2-3 times per month At least once per week Two or more times per week At least once per day More than one time per day 3. If you were to purchase a protein bar how important would the following HEALTH claims be to you? Please rank the features from MOST IMPORTANT to LEAST IMPORTANT (MOST IMPORTANT = 1; LEAST IMPORTANT = 9). RANKING Helps to develop lean body mass and muscles Suppress/reduces appetite Weight control Enhances immune defences Protects teeth from decay Decreases chances of heart disease Increases mental alertness Decreases chances of developing cancer Develops and maintains healthy bones 4. If you were to purchase a protein bar how important would the following PRODUCT FEATURES be to you? Please rank the features from MOST IMPORTANT to LEAST IMPORTANT (MOST IMPORTANT = 1; LEAST IMPORTANT = 10). RANKING Low in fat/fat-free Cholesterol free Lactose free Contains calcium Contains no soy products High in protein Low in carbohydrates Free from trans fatty acids Contains no animal fat Does not contain genetically modified ingredients

121
5. What is your level of knowledge about the use and function of proteins in food products? Please select (√) one response.
None Low Moderate Extensive 6. Please select the health benefits and product claims that you believe SOY PRODUCTS can provide. You may
select more than one choice.
Please tick (√) all that
apply
Health Benefits Please tick (√) all that
apply
Product Claims
Helps to develop lean body mass and muscles
Low in fat/fat-free
Regulate appetite/satiety Cholesterol free Weight control Lactose free Enhances immune defences Contains calcium Prevents cavities High in protein Decreases chances of heart disease Low in carbohydrates Decreases menopausal symptoms Great taste Increases mental alertness Does not contain genetically
modified ingredients Develops and maintains healthy bones Decreases chances of developing
cancer
7. Please select the health benefits and product claims that you believe DAIRY PRODUCTS can provide. You may select more than one choice.
Please tick (√) all that
apply
Health Benefits Please tick (√) all that
apply
Product Claims
Rich in essential amino acids for lean body mass/muscle
Low in fat/fat-free
Regulate appetite/satiety Cholesterol free Weight control Lactose free Enhances immune defences Contains calcium Prevents cavities High in protein Decreases chances of heart disease Low in carbs Decreases menopausal symptoms Great taste Increases mental alertness Does not contain genetically
modified ingredients Develops and maintains healthy bones Decreases chances of developing
cancer
8a. Do you specifically choose food and beverage products that contain added protein (e.g. protein bars, shakes, etc)?
Yes No
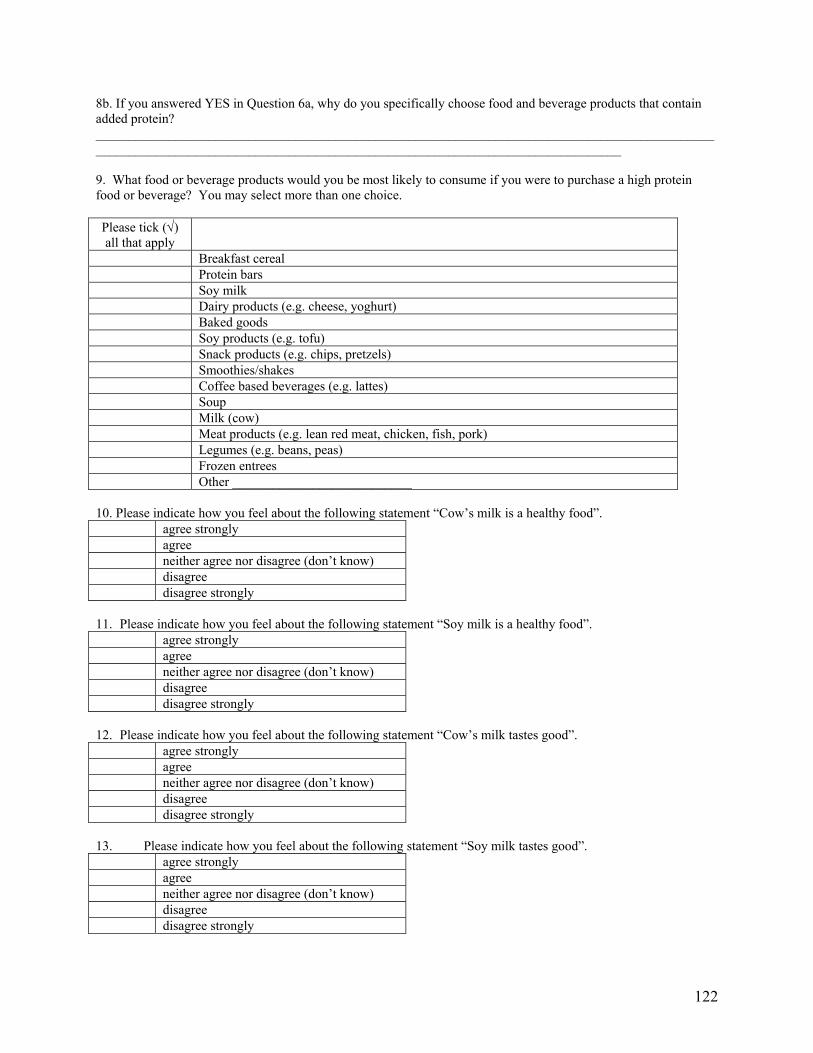
122
8b. If you answered YES in Question 6a, why do you specifically choose food and beverage products that contain added protein? ____________________________________________________________________________________________________________________________________________________________________________ 9. What food or beverage products would you be most likely to consume if you were to purchase a high protein food or beverage? You may select more than one choice.
Please tick (√) all that apply
Breakfast cereal Protein bars Soy milk Dairy products (e.g. cheese, yoghurt) Baked goods Soy products (e.g. tofu) Snack products (e.g. chips, pretzels) Smoothies/shakes Coffee based beverages (e.g. lattes) Soup Milk (cow) Meat products (e.g. lean red meat, chicken, fish, pork) Legumes (e.g. beans, peas) Frozen entrees Other ___________________________ 10. Please indicate how you feel about the following statement “Cow’s milk is a healthy food”. agree strongly agree neither agree nor disagree (don’t know) disagree disagree strongly 11. Please indicate how you feel about the following statement “Soy milk is a healthy food”. agree strongly agree neither agree nor disagree (don’t know) disagree disagree strongly 12. Please indicate how you feel about the following statement “Cow’s milk tastes good”. agree strongly agree neither agree nor disagree (don’t know) disagree disagree strongly 13. Please indicate how you feel about the following statement “Soy milk tastes good”. agree strongly agree neither agree nor disagree (don’t know) disagree disagree strongly

123
Table 5: NC State University IRB form
SUBJECT CONSENT TO PARTICIPATE IN CONSUMER SURVEY
I agree to participate in a consumer survey for the Department of Food Science at North Carolina State University. I understand that participation is voluntary and that I may withdrawal my participation at any time. I also understand that information I provide is confidential and that results with not be associated with my name. I understand that I will not be required to consume any food or beverage for this survey. ________________________________ PRINT YOUR NAME ________________________________ ___________________________ SIGN YOUR NAME DATE