COMPARISON OF SEA-ICE TYPE IDENTIFICATION … · la practique de I'interpretation des resultats des...
15
Journal ofG/aci%gy, V o l. 15, No. 73 ,1975 COMPARISON OF SEA-ICE TYPE IDENTIFICATIO N DUAL-FREQUENCY PASSIVE RADIOMETRY AND ST A NDARD BETWEE N AIRBORNE MICROWAVE LASER / INFRARED TECHNIQU ES By S. G. T OOMA, (U .S. Na val Oceanographi c Offi ce, Was hing ton , D .C. 203 73, U .S.A.) R. A. M ENNE LLA , J. P. HOLLI NGE R, (U .S. Nava l R ese ar ch Laborator y, 'I\Tas hin gton, D. e. 203 75 , U .S .A.) and R. D . K E T C H UM, JR . (U.S. Naval Oceanographic Offi ce , Was hington, D .e. 203 73, U .S. A. ) A BS TR ACT. Durin g Dece mb er 1973, the Nava l O cea nogr aphic Offi ce (NA VOCEANO ) a nd the Nava l Research Laboratory (NRL ) co ndu cted a jo int remote-sensi ng expe rim e nt ove r the sea-i ce fi elds off Scoresby Sound on th e east coast of G reenla nd using N A YO C EANO' s RP3-A Birdseye aircraft, lase r profil er, a nd infrared sca nn er, and NRL 's 19.34 a nd 3 1. 0 G H z n ad ir-looking ra di ometers. Th e obj ec ti ves of this mi ss ion wer e: (I) to develop skills for int e rpr eting sea -i ce p assive microwa ve dat a, (2) to exp a nd , if p oss ibl e, th e two-cat e gor y ca pability (multi- yea r ice a nd firs t-year ice) of passive mi crowave sensors ove r sea ice, (3) to co mp are two frequ encies (19 a nd 31 GH z) to dete rmin e which may be more u se ful in a sca nning radiometer now und er d evel op ment at N RL , a nd (4) to determ in e the value of multi-frequ ency as comp ared to single- fr equ en cy s tud y of sea ice. Sin ce , b eca use of darkness a nd remoteness, no ph oteg raphy or in sit u gr o und tr uth were possible for thi s mi ss ion, it w as necessary to rely on th e interpr eta tions of the laser and infrared (IR) data to evaluate th e perf o rm an ce of the mi crowave ra di ometers. Fo rtun a tely, exce ll e nt l ase r and IR data were co ll ected, a nd a confide nt desc ripti on of th e ice overflown was poss ibl e. Fi ve ice co nditi ons: (I) open water /new ice, (2) sm oo th first- yea r ice , (3) ridged first- yea r ice, (4) multi- year ice, a nd (5) a higher brightn ess tempera tur e fe rm of multi-yea r ice interpreted as seco nd-yea r ice were identifiabl e, r ega rdl ess of wea th er conditions, by comp aring the ave rage of the two micr owave brightn ess te mpera tur es at the two fre qu encies with the ir diff erence. RES UM E. Compa raison entre les techniques d' identification des types de glace de mer par radiometrie aerie nne passive doublefrequence ondes courtes et par laser standard et infrarouge. En d ece mbr e 1973, le Natio nal O cea nogra phi c Office (N AYOCEANO) et le Naval Research La boratory (NRL ) ont mene un e expe ri en ce commun e d e teledetec tion sur les domaines de glace de mer de Sco resby Sound sur la cote Est du Groenla nd ; il s ont utilise un avion NAV OCEANO, RP3-A Birdseye, un profil eur laser et un scann er infraro uge et des radiome tr es NRL diriges vers le na dir 19,34 et 3 1,0 GHz. Les obj ec tif s d e la mi ss ion e ta ie n t : (I) devel op pe r la pra c tiqu e de I'interpr etati on des result a ts d es ca pteurs pass if s it o nd es courtes sur gl ace de mer, (2) d' et endr e si possible les capacit es des deux ca te gori es de ca pt eurs pass if s ond e co urt e sur gl ace de mer, (3) de c omparer deux fre qu en ces (19 et 31 GHz ) po ur determin er la plus effi cace dans un radi omet re d' obse rvati on en cours de mi se au point au NRL et (4) determin er la vale ur d' un e e tud e multi- frequ ences sur la gl ace de mer p ar ra ppo rt it la fr equ ence unique. Co mme il n 'y avait pas d e ph otogra phie di spo nibl e ou de verifi ca tion au sol in situ possible pour ce lt e miss ion , il e tait necessa ire d e se ra tta cher a ux int e rpr eta ti ons des do nn ees laser et infra-r ou ge (IR ) po ur evaluer les pe rf ormances des ra di ometr es o nd es courtes. Heureuseme nt , d 'excell e nt es donn ees laser et IR ont ete recu eillies et une desc ripti on fi able de la gl ace fl ott a nt e eta it possible. En utili sa nt deux fr eque nces, le so nd age pass if it o nd e courte a ppara it ca pable de di s tinguer entr e cinq types ou form es diff erents d'eng lace ment: (I) ea u libre passa nt it la gl ace nouvell e, (2) gla ce lisse de premier e a nn ee, (3) gla ce it cretes de pre mi ere a n nee, (4 ) gl ace vieille de plusie ur s a nn ees, ct (5) un e fo rme it plus ha ut e tempera tur e de brillance d' un e gla ce pluri-a nnu elle inte rpr etee co mme un e glace de de uxi eme annee. En portant s ur un gr a phique la te mpera tur e moye nn e de brillance d ans les deux fr equ ences en fon ct ion de la differen ce des te mpera tur es dans les deux fr eq uences, il sembl e possibl e de donn er un e d esc ripti on generale, d' un do main e marin englace d ' apr es les cinq ca tego ri es e numerees c i-d essus, qu ell es qu e soient les conditions meteorolo giqu es. ZUSAMMEN FASSUNG. Vergleich von. K la ssijizierungen des Al eereis es aus passiver Flugradiometrie mi t D oppe lf requenz - Mikrowellen und lIlit gewohnl iclz en Infrarot -Lase rmethoden. Im Dezember 1973 fuhrt en das Nava l Ocea nogra phi c O ffi ce (NAY OCEANO) und d as Naval Research Labor atory (N RL ) e in g emeinsam es Fe rn e rkundun gs unter- ne hmen ub er den Meereisfelde rn vor dem Scoresby -Sund und an der Os tku ste vo n Gro nl and dur ch, wobei NA VO CEAN O 's RP3-A Birdseye -F lugzeug, ei n L aser -Profil ge ra t und ein Infr arot-A bt as ter, sowi e N RL 's 19,34 und 31,0 GHz-Na dir -Ra di ometer eing esetzt wu rden. Die Zi ele di eses U nt e rn e hme ns waren : (I) Gewinnung inte rpr etatonischer Erf a hrungen mit M ee reis-Daten von passiven Mikrowelle n; (2) Erwei te rung , 225
Transcript of COMPARISON OF SEA-ICE TYPE IDENTIFICATION … · la practique de I'interpretation des resultats des...
Journal ofG/aci%gy, V o l. 15, No. 73 , 1975
COMPARISON OF SEA-ICE TYPE IDENTIFICATIO N DUAL-FREQUENCY PASSIVE
RADIOMETRY AND ST ANDARD BETWEE N AIRBORNE
MICROWAVE LASER / INFRARED TECHNIQU ES
By S. G . T OOMA,
(U .S. Naval Oceanographic Office, Washington, D .C. 203 73, U .S.A.)
R. A. M ENNELLA , J. P. H OLLINGER ,
(U .S. Naval Research Laboratory, 'I\Tashington, D. e. 203 75, U .S.A.)
and R. D . K E T CH UM, JR.
(U .S. Naval Oceanographic Office, Washington, D.e. 203 73, U.S.A. )
ABSTR ACT. During December 1973, the Naval O ceanographic Office (NAVOCEANO) a nd the Naval R esea rch L a bo ra tory (NRL) conducted a joint rem o te-sensing experiment over the sea-ice fi elds off Scoresby Sound on the eas t coast of G reenla nd using N AYO C EANO's RP3-A Birdseye a ircra ft, laser profil er, a nd infra red scanner, and NRL's 19 .34 a nd 3 1.0 G H z nad ir-looking radiom e te rs. The objecti ves of this mission were: ( I ) to d evelop skills for interpreting sea-ice p assive microwave data , (2) to expa nd, if possible, the two-category ca pa bility (multi-year ice and first-yea r ice) of passive mi crowave sensors over sea ice, (3) to compa re two frequencies (19 a nd 3 1 GHz) to de te rmine which may be m ore useful in a scanning radiometer now under d evelopment at N RL, a nd (4) to de te rm ine the va lue of multi-frequency as compa red to singlefrequency study of sea ice.
Since, b ecause of da rkness a nd remoteness, no pho tegraphy or in situ ground truth were possible for this mission, it was necessary to re ly on the interpre ta tions of the laser and infra red (IR) d a ta to eva lua te the performa n ce of the microwave ra diometers. Fortuna tely, excellent lase r and IR data w ere collec ted, and a confident d escription of the ice overflown was p ossible.
Five ice conditions: ( I) op en w a ter/new ice, (2) sm ooth first-yea r ice, (3) ridged first-year ice, (4) multiyea r ice, a nd (5) a higher brightness tempera ture fe rm of multi-year ice interpreted as second-year ice were identifiable, regardless of weather conditions, by comparing the average of the two microwave brightness tempera tures at the two frequen cies with their diffe rence.
RESUM E. Comparaison entre les techniques d 'identification des types de glace de mer par radiometrie aerienne passive doublefrequence ondes courtes et par laser standard et infrarouge. En decembre 1973, le N a tional O ceanographic Office (N AYOCEANO) e t le N a val R esearch L a bora tory (NRL) on t mene une experien ce commune d e telede tectio n sur les doma ines d e glace de mer de Scoresby Sound sur la cote Est du Groenland ; ils ont utilise un a vion NAVOCEANO, RP3-A Birdseye, un profil eur lase r e t un scanner infrarouge et des radiometres NRL diriges vers le nadir 19,34 et 3 1,0 GHz. Les objectifs d e la mission e ta ien t : ( I) developper la practique d e I' interpreta tion d es resulta ts d es capteurs passifs it o ndes courtes sur glace de mer, (2) d 'etendre si possible les capacites des deux categories de capteurs p ass ifs onde courte sur glace de mer , (3) de comparer deux freque nces ( 19 et 31 GHz ) p our determiner la plus effi cace d a ns un radiomet re d 'observation en cours de mise au point au NRL e t (4 ) determiner la va leur d 'une e tude multi-frequences sur la glace d e mer par rapport it la frequence unique.
Comme il n 'y ava it pas d e pho tographie disponible ou de verifica tion au sol in situ p ossible pour celte miss ion, il e tait necessaire d e se ra ttacher a ux interpreta tions des d onnees laser et infra-rouge (IR) pour evaluer les p erformances des ra diometres ondes courtes. H eureusem ent, d 'excellentes donnees laser et IR on t ete recueillies et une description fi able de la glace fl ottante e ta it possible.
En utilisant deux frequences, le sondage p assif it onde courte appa ra it capable de distinguer entre cinq types ou formes differents d ' en glacement: ( I ) eau libre passant it la glace nouvelle, (2) glace lisse de premiere annee, (3 ) glace it cretes de premiere an nee, (4 ) glace vieille de plusieurs a nnees, ct (5) une fo rme it plus haute tempera ture d e brillance d 'une glace pluri-annuelle in terpretee comme une glace de d euxiem e annee. En portant sur un graphique la tempera ture moyenne de brillance dans les deux frequen ces en fonction de la d ifference d es tempera tures d a ns les deux frequences, il semble possible d e donner une d escription genera le, d' un d omaine marin englace d 'apres les cinq ca tego ries enumerees ci-dessus, quelles que so ien t les cond itions meteoro logiques.
ZUSAMM EN FASSUNG. Vergleich von. K lassijizierungen des Aleereises aus passiver Flugradiometrie mit D oppelfrequenz Mikrowellen und lIlit gewohnliclzen Infrarot-Lasermethoden. Im Dezember 1973 fuhrten das Naval Oceanogra phic O ffi ce (NAYOCE ANO ) und d as Naval R esea rch Laboratory (NRL) e in gemeinsames Fernerkundungsun ternehmen uber d en M eereisfe ldern vor dem Scoresb y-Sund und a n d er O stkuste von G ronla nd durch, wobei NA V O CEANO 's RP3-A Birdseye-F lugzeug, ein L aser-Profilgera t und ein Infra rot-Abtas te r , sowie NRL's 19,34 und 3 1,0 G H z-Nadi r-Ra diometer eingesetz t wurden. Die Zie le dieses U nternehmens waren : ( I) Gewinnung interpreta tonisch er Erfa hrungen mit M eereis-Daten von p assiven Mikrowellen; (2) E rweiterung,
225
]OURN AL OF GLACIOLOGY
soweit mi:iglich, del' zweifachen Kategorie-Empfindlichkeit (m ehtjahriges Eis und einjahriges Eis ) von passiven Sensoren fill' Mikrowellen aus Meereis; (3 ) Vergleich zweier Frequenzen (19 und 31 GHz) auf ihre Bra uchbarkeit filr ein Abtast-Radiometer, das derzeit beim NRL entwickelt wird ; (4 ) Analyse des \"'ertes von Untersuchungen d es Meereises mit Mehrfach-Frequenzen im Vergleich zu Einzelfrequenzen.
Das fur das Unternehmen weder Photographien noch F eldvcrgleiche in situ zur Verfugung sta nden, war es notwendig, die Auswertung der Daten der Microwellen-Radiometer auf die Inte rpretationen d er Laserund Infrarot (IR)-Daten zu stu tzen. Glilcklicherweise ergaben sich ausgezeichnete Laser- und IR-Daten, so dass eine zuverlassige Beschreibung des ilberAogenen Eises mi:iglich wurde.
Bei Benutzung von zwei Frequenzen scheint das passive Mikrowellenverfahre n zwischen funf verschied enen Eistypen bzw. -formen un terscheiden zu ki:innen: ( I) offenes Wasserjneues Eis; (2) glattes einjahriges Eis; (3) ruckenreiches einjahriges Eis; (4 ) m ehrjahriges Eis; (5) eine Form mehrjahrigen Eises mit hiiherer Farbtemperatur, die als zweijahriges Eis ged eutet wurde. Aus der graphischen Gegenllberstellung der mittleren Farbtemperatur und der Temperaturdifferenz der be id en Frequenzen scheint eine generelle Beschreibung der Eisfelder nach den oben aufgefuhrten funf Kategorien miiglich zu sein. Die Wetterbedingungen sind dabei ohne EinAuss.
1. INTROD UCTION
Sea-ice remote sensing missions in the Arctic are constantly plagued by problems which reduce the yield of usable data significantly. The most serious of these problems is the generally poor weather found throughout the Arctic compounded by unreliable weather forecasts due to lack of weather stations in this remote region. The effectiveness of laser profile rs, infrared scanners, and photographic cameras is especially reduced by inclem ent weather in study areas. Microwave systems, on the other hand, are not affected significantly by poor weather, and for this reason , appear to have the most potential for Arctic use.
Passive microwave instrumentation is simpler and less expensive than its active microwave counterpart, side-looking radar. The main disadvantage, however, is poorer resolution. In general, passive microwave remote-sensing techniques are especially attractive for Arctic sea-ice surveillance because of the minimization of possible sources of error and the provision of higher-quality quantitative results . The relative transparency of clouds and fog to microwaves and the independence of passive microwaves on solar illumination of the terrain , make passive microwave sensing a nigh t and day, almost all-weather, technique. In the Arctic, the water-vapor constituent in the atmosphere is extremely low (on the order of 1 g cm- 2 of precipitable water compared with 4.5 g cm- 2 for the equatorial regions). Such low values of atmospheric water vapor plus the low value of reflectivity (0.3 to 0.05) of the terrain (excluding water) makes the correction for the undesired reflected sky brightness temperature a minor one. Furthermore, extensive cloud cover with high liquid-water densities is not prevalent in the Arctic, making the corrections for atmospheric liquid water minor as well.
The Arctic terrain is also cooperative for passive microwave observations. The emissivity characteristics (and consequently the microwave brightness temperature) of the sea, ice, and snow as a function of frequency a nd polarization are markedly different at microwave freq uencies compared with the infrared and visible regions. Within the microwave spectrum, the variations of emissivity as a function of frequency and polarization are comparatively large, and this makes a possible basis for unique identifi cation of terrain features and surface description. Also, th e Arctic sea-ice terrain is generall y composed of large, relatively flat , homogeneous sources, which minimize the disadvantage of the poorer resolution and the possibility of immersing the side and main lobes in totally different ground sources of radiation.
During December 1973, the Naval Oceanographic Office (NA VOCEANO) and the aval R esearch Laboratory (NRL) conducted a joint experiment over the sea-ice fields off Scores by Sound on the east coast of Greenland using NA VOCEANO's RP-3A Birdseye aircraft, laser profiler, and infrared scanner, and NRL's 19.34 and 3 1.0 GHz nadir-looking microwave radiometers. The objectives of this mission were: ( I) to develop skills for interpreting sea-ice passive microwave data, (2) to expand, if possible, the two-category capability of passive microwave sensors over sea ice, (3) to compare two frequencies ( 19 and 3 I GHz) to determine which may be the more useful in a scanning radiometer (imager) now under development at

SEA- I CE IDENTIFICATION US I NG PA SS I VE MI C ROWA VES 227
NRL, and (4) to determine the value of multi-frequency as compared to single-frequency study of sea ice.
Earlier work has shown that multi-year ice provides a much lower microwave brightness temperature than does new or first-year ice (Wilheit and others, 1972 ; Gloersen and others, 1973; Kunzi and others, in press) . However , a variety of conditions can exist within the instantaneous field of view of the microwave radiometer which can produce modified brightness temperatures of first-year and multi-year ice. I t is also known that thi s response to ice types is a function of frequen cy. Therefore, the use of two nadir-looking radiometers at different frequencies capitalizes on the expected , measurabl e differences in brightness temperature as a function of frequency and ice types.
n . I NSTR UMENTATION
A. Laser profiling system
The basic component of the laser profiling system is the continuous-wave laser a ltimeter manufactured by Spectra Physics, Inc. , Mountain View, California. Basically, ranges are obtained by ampli tude modulation of a helium- neon laser centered at 6 328 A. The reRected light is detected and amplified by a photomultiplier and is phase compared with the modulation frequency of the transmitted beam. The phase difference is proportional to the transmission time or range. A G enisco Technology Corporation R eproducer Model 10-286 magnetic tape recorder and a Varian Statos I electrostatic strip-chart recorder were used to record the laser data. Jensen and Ruddock (unpublished ) presented a detailed discussion of the laser profiling system.
B. Infrared scanning radiometer
The infrared (IR) system used in this experiment was modified by and obtained from the Naval Air D evelopment Center, Johnsville, P ennsylvania. This instrument has a military designation of AN/AAR-35 and a commercial designation ofReconofax IV, Mark V , Infrared Scanner, manufactured by HRB-Singer Corporation. In this experiment, a mercury-doped germanium detector was used which has a spatial resolution of 17 mrad and a theoretical thermal resolution of 0.01 K at the nadir. Basically, the thermal map output of this instrument is produced by focusing the collected radiation with a rotating mirror (185 scans/s) onto the de tector, which is filtered to accept wavelengths in the 8 to 14 f.lm region. The received radiation is then converted to voltages, which, in turn , are amplified and utilized to modulate the intensity ofa crater lamp. T he varying intensities of the crater lamp are recorded on 70 mm tri-x film, which, when developed , becomes the thermal map output (HRB-Singer , Inc., 1968) .
C. Microwave radiometers
The NRL radiometers used on this experiment were conventional crystal-mixed, superheterodyne, Dicke-switched radiometers that use an ambient (295 K ) reference load in the switching cycle. The center frequencies were 19.34 GHz and 3 1.0 GHz with bandwidths of 10 to 300 MHz and 10 to 500 MHz, respectively. The r.m.s. output noise level is 0.3 K with a one-second integration time. In-Right calibration is achieved by observing a known input (ambient reference load for both halves of the switching cycle) and by injecting a calibrated temperature change generated by an argon noise generator. The reference-matched load temperature is known to within 0.5 K and the argon noise temperature change of 100 K is known to within 2% . The post-flight calibration, which d etermines the response of the receiver and the magnitude of the temperature injected by the argon noise generator, is performcd using liquid nitrogen and ambient dcwar-like loads that encircle the antennae.

JO U RN AL OF GLACIOLOGY
A resolution of 38.0 m is achieved at an altitude of 305 m using antennae with beam widths of 7.2 °. Beam effi cienc ies of the antennae are 87% at 19.3 GHz and 98 % at 3 1.0 GHz.
Passive microwave radiometry provides quantitative results, but the quality of the data d epends to a large extent on the nature of the calibration techniques as well as the quality of the equipment. The Lm.S. statistical error can be controlled fairl y well by the selection of the r .f. components of the radiometer. The error in absolute m easurement for the Dicke radiom eter employed is d ependent, in part, on the degree to which the observed source temperature differs from the temperature of the internal load used for reference. When these are equal , effects of the error inherent in the uncertainty of the injected argon calibration signal a re minimized. In the ca se of Arctic ice, the temperature is displaced from the internal load by about 50 to 70 K. The systematic or bias error due to calibration error, error in load temperatures, and reduc tion errors is on the order of 2 K.
A lthough the data were recorded on both magne tic tape and analog strip charts, noise pick-up on the magne tic tape signal lines produced recordings of poor quality; consequently, only the analog data from the strip charts were used for analysis. The data were analogrecorded using a 0.25 s time constant or less with recorder chart speed s of o. I , 0.5, and 1.0 inches per second (2.5, 1.27, and 25.4 mm S- I) . A Benson Lehner O scar k data reade r was used to digitize the analog data automatically for computer reduction to brightness temperature. These calculations took into a ccount the calibration data, reference-load temperature, beam efficiency as a fun ction of antenna angular extent, expected response from the ground source as a function of angle, and atmospheric corrections a a function of incidence angle. Surface temperature provided by a weather station in Iceland was (- 20 ± 2t C which is consistent with the accuracy of the temperature recorded outside the aircraft over the site of (- 27 ± 2)0 C recorded at 1 525 m and of (- 20 ± 2r C recorded at 150 m . This temperature is a lso consistent with that expected for lat. 70° N. , based on an Al'ctic model atmosphere for winter.
IH . RESULTS
Since there were no in situ ground-truth measurements made during this experiment, the key to m eeting the mission 's objectives was the ability to identify accurately several different ice types using remote sensors other than the passive microwave radiom eters. Since light conditions were insufficient to allow photographic imaging of the sea ice, it was necessary to rely solely on laser and infrared data for this identification. Fortunately, these two system s provided excell ent data allowing the identification of six distinct ice types (based on age) or ice forms (based on surface roughness) with a high d egree of confidence; they are: ( I) open water /new ice, (2) young ice or thin, smooth , first-year ice, (3) thick, smooth, first-year ice, (4) ridged first-year ice, (5) smooth multi-year ice, and (6) rough multi-year ice. In most cases, the young ice and thin , smooth , first-year ice of (2) above could be differentiated on the basis of the amount of reflection of th e laser signal from the ice surface, but, the difference was not as obvious as with the other categories. To illustrate the typical laser/IR signatures of these ice types, Figures 1 through 4 are presented. On these, and in subsequent illustrations where infrared imagery is presented , lighter shades of gray represent warmer surface temperatures with respect to the surrounding ice condi tions. Since water is the main source of heat for the ice at this time of year, thinner ice types are usually wa rmer than thicker ones and thus appear lighter. The laser profil er is an acti ve system m easuring the reflected laser b eam, hence surface refl ectivity is an important key for proper in terpretation. The low refl ectivity of thin ice and open water results in a low signal-to-noise ratio, and a relatively noisy profile is obtained from these surfaces. On the other hand , first-year and older ice usually has a snow cover, and the associated high surface refl ectivity produces a sharp, low-noise profile. The distinction between first-year ice and multi-year ice can easily be made using the charac-
SEA -I CE IDE NT I F I CAT IO N US ING PASSIVE MICROWAVE S
teristi cs of their profiles. First-year ice is typically nat, broken by periodic steep-sided pressure ridges. Multi-year ice, on the other hand , has undergone two or more summers of m elt and the steep-sided pressure ridges have been eroded so that an undulating terrain r esults. K etchum (1971 ) and K etchum and Wittmann (1966) present complete d escriptions of laser and IR interpretation techniques of Arctic sea ice.
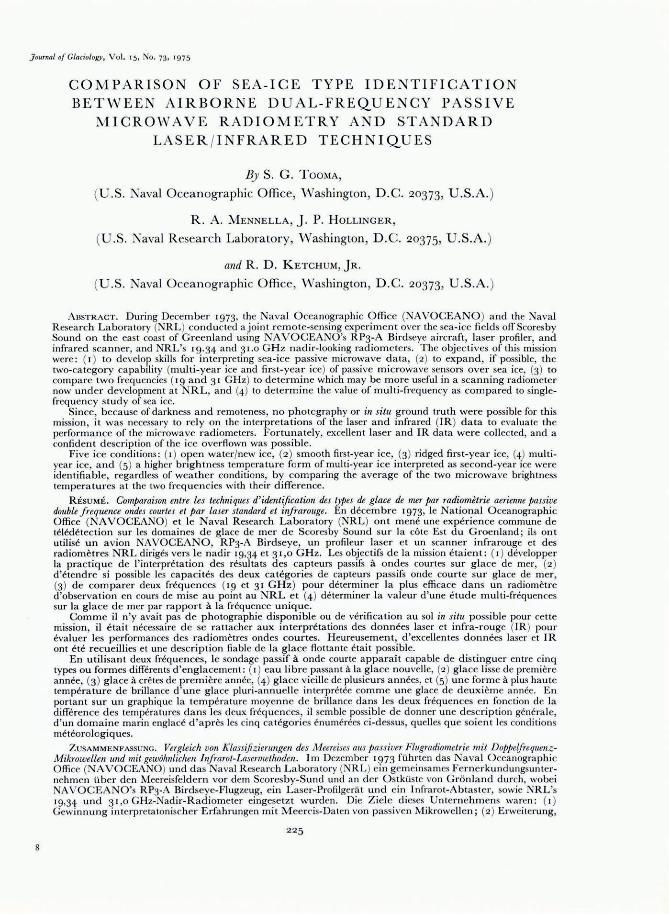
Figure I presents a section of open water/new ice . This ice type is extremely thin and app ears very warm on the IR image . The laser profile is very Rat and noisy. (Aircraft motion has not been r emoved from the laser data presented in this paper. Therefore, som e long-wave curvature may be present in the profiles. )
INFRARED IMAGE '
L ASER PROF ILE ' 1 I (J) I OPEN WATE R /NEW ICE ..
~ .J ---------'-'-'~~--"'-~"1</'v'"~",,,,, •. _._,,,;-.r. .. ,.., ... ~-.r...~~.''''--J. ,~,,\,I,.J''f'_._~-....
I 100 METERS I
F ig. f. Ilifrared image and laser profile for O/JClI water/new ice.
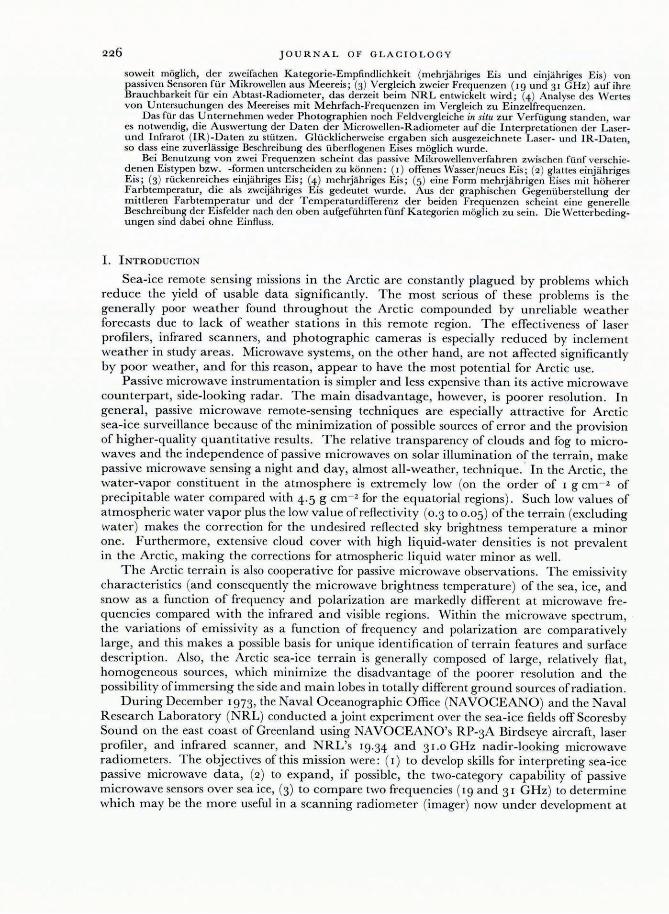
Figure 2 presents the three forms o f first-year ice iden tified on thi s study using laser a nd IR data. On the left is thick, smooth , first-year ice. The IR image of this ice is fairl y dark in tone due to its thickness with some darker lineations due to snow drifts and some infrequent ridges. Since this ice type does have a snow cover, the laser profile is not noisy, and because the ice is smooth, the profile is very Rat. The middle portion of Figure 2 shows thin , smooth , first-year ice or young ice. The IR image shows the ice to be thinner (lighter in tone) than the thick first-year ice to the left , and the laser profile is Rat (undeformed ) and noisy (no snow cover) . The deformed first-year ice on the right of this figure is easily identified on the laser profile by the number of spikey-looking pressure ridges or blocks of broken ice. The IR image is similar to the thick sm ooth ice except that the ridged ice has a more mottled appearance.
JOURNAL OF GLACIOLOGY
INFRARED IMAGE '
Fig. 2. bifrared images a:ld laJer profiles, for thin, smooth jirst-year ice, thick, smooth first~vear ice , and ridged, thick first:year lee.
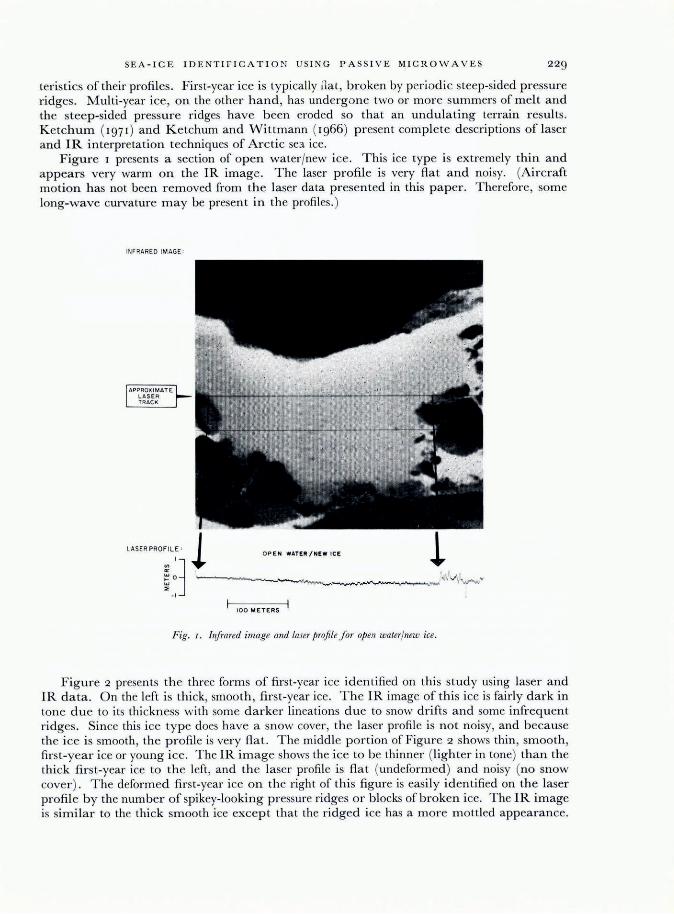
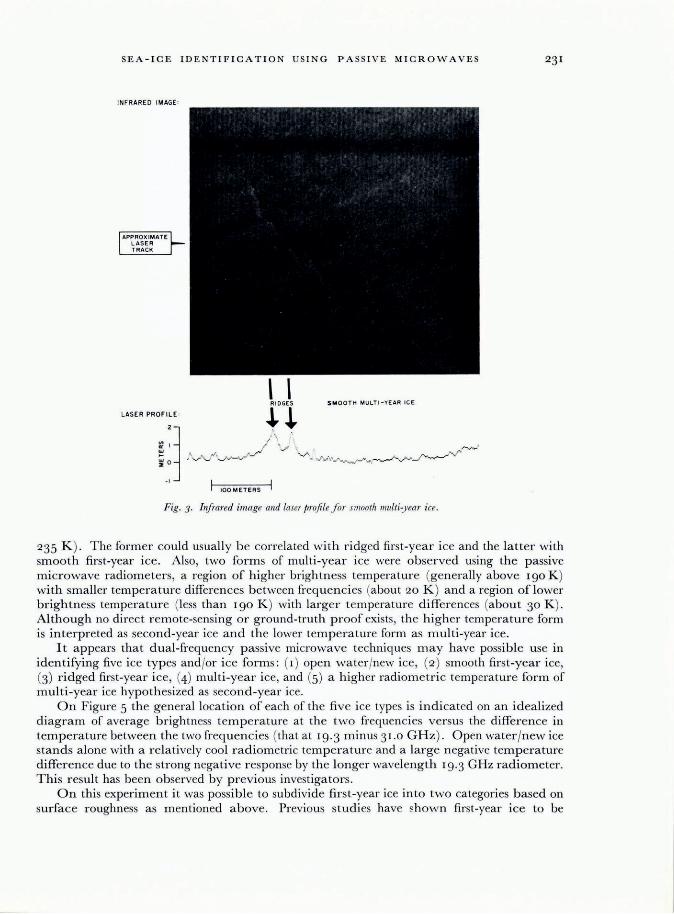
Figure 3 presents a section of relatively smooth multi-year ice. The laser profile is typical for multi-year ice; i.e. high signal-to-noise ratio and undulating terrain with periodic broadbased hummocks and pressure ridges. The IR image is dark in tone and generally nondescript with the exception of some lineations due to pressure ridges and some mottling due to hummocks.
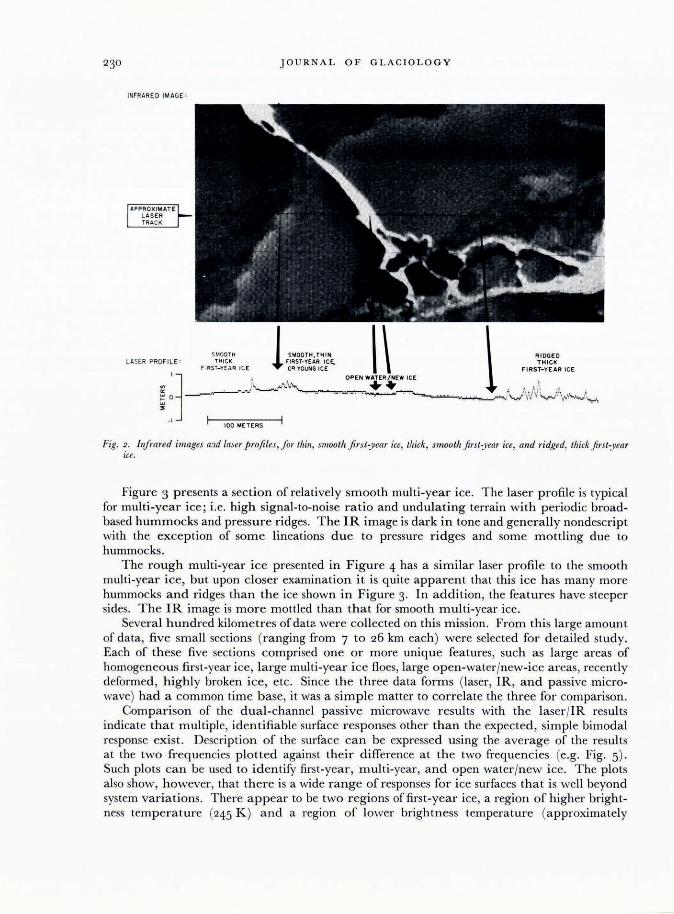
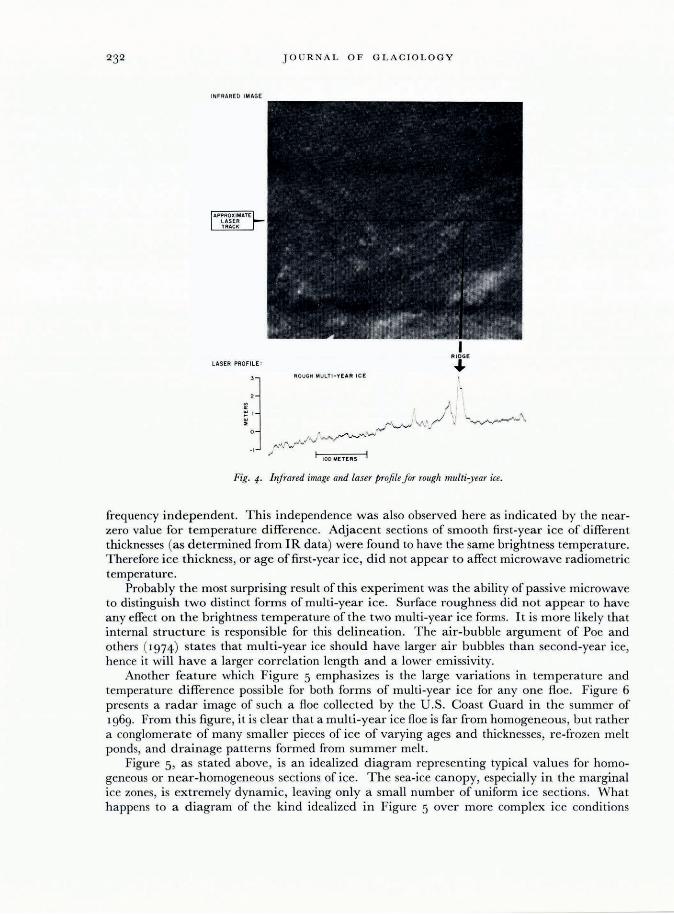
The rough multi-year ice presented in Figure 4 has a similar laser profile to the smooth multi-year ice, but upon closer examination it is quite apparent that this ice has many more hummocks and ridges than the ice shown in Figure 3. In addition, the features have steeper sides. The IR image is more mottled than that for smooth multi-year ice.
Several hundred kilometres of datt'_ were collected on this mission. From this large amount of data, five small sections (ranging from 7 to 26 km each) were selected for detailed study. Each of these five sections comprised one or more unique features, such as large areas of homogeneous first-year ice, large multi -year ice floes , large open-water/new-ice areas, recently deformed , highly broken ice, etc. Since the three data forms (laser, IR, and passive microwave) had a common time base, it was a simple matter to correlate the three for comparison.
Comparison of the dual-channel passive microwave results with the laser jIR results indicate that multiple, identifiable surface responses other than the expected, simple bimodal response exist. Description of the surface can be expressed using the average of the results at the two frequencies plotted against their difference at the two frequencies (e.g. Fig. 5). Such plots can be used to identify first-year, multi-year, and open water /new ice. The plots also show, however, that there is a wide range of responses for ice surfaces that is well beyond system variations. There appear to be two regions of first-year ice, a region of higher brightness temperature (245 K ) and a region of lower brightness temperature (approximately
SEA-ICE IDENTIFICATION US ING PASSIVE MICROWAV ES 23 1
INFRARED IMAGE '
, , RIDGES SMOOTH MULTI-yEAR ICE
LASER PROFILE ' ,I,~ .•• - .. -..... ....
I 100 METERS
Fig. 3. Infrared image and laser /;rojile for smooth multi:year ice.
235 K ) . The former could usually be correlated with ridged first-year ice and the latter with smooth first-year ice. Also, two forms of multi-year ice were observed using the passive microwave radiometers, a region of higher brightness temperature (generally above 190 K ) with smaller temperature differences between frequencies (about 20 K ) and a region of lower brightness temperature (less than 190 K ) with larger temperature differences (about 30 K ). Although no direct remote-sensing or ground-truth proof exists, the higher temperature form is interpreted as second-year ice and the lower temperature form as multi-year ice.
It appears that dual-frequency passive microwave techniques may have possible use in identifying five ice types and /or ice forms: (I) open water/new ice, (2) smooth first-year ice, (3) ridged first-year ice, (4) multi-year ice, and (5) a higher radiometric temperature form of multi-year ice hypothesized as second-year ice.
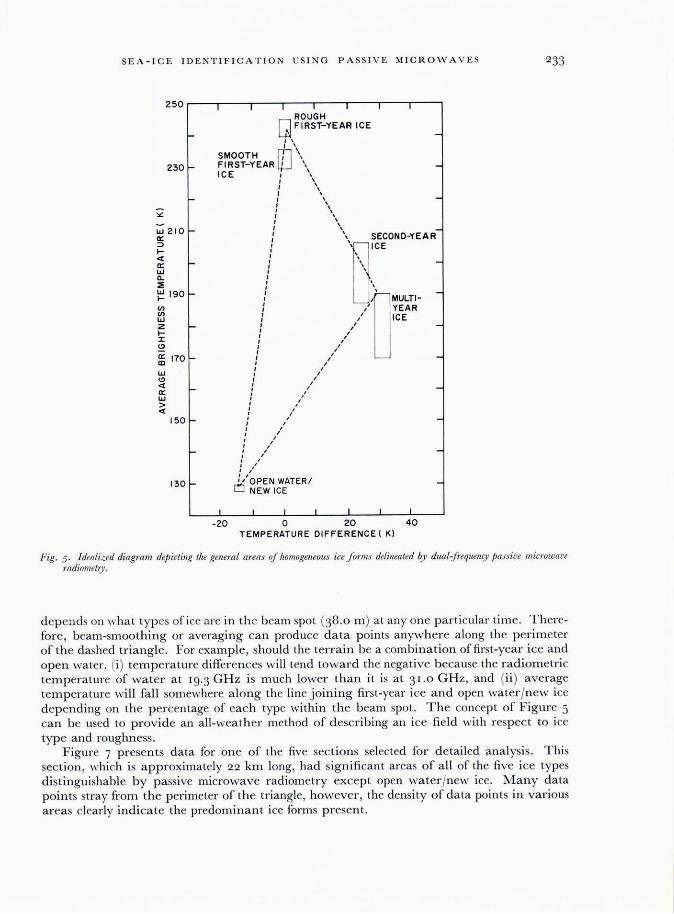
On Figure 5 the general location of each of the five ice types is indicated on an idealized diagram of average brightness temperature at the two frequencies versus the difference in temperature between the two frequencies (that at 19.3 minus 31.0 GHz). Open water/new ice stands alone with a relatively cool radiometric temperature and a large negative temperature difference due to the strong negative response by the longer wavelength 19.3 GHz radiometer. This result has been observed by previous investigators.
On this experiment it was possible to subdivide first-year ice into two categories based on surface roughness as m entioned above. Previous studies have ~hown first-year ice to be
JOURNAL OF GLACIOLOGY
INFRARED IMAGE
I RIDGE
LASER PAOFILE : ... ROUGH MULTI-YEAR ICE
,.· ... .Ji
.• _-'-,,"'" __ ...... _-, ..• .• _ •• -_-.• \ ,..i
I 100 METERS I
Fig. 4. Infrared image alld laser profile jar rough multi-year ice.
frequency independent. This independence was also observed here as indicated by the nearzero value for temperature difference. Adjacent sections of smooth first-year ice of different thicknesses (as determined from IR data) were found to have the same brightness temperature. Therefore ice thickness, or age of first-year ice, did not appear to affect microwave radiometric temperature .
Probably the most surprising result of this experiment was the ability of passive microwave to distinguish two distinct forms of multi-year ice. Surface roughness did not appear to have any effect on the brightness temperature of the two multi-year ice forms. It is more likely that internal structure is responsible for this delineation. The air-bubble argument of Poe and others (1974) states that multi-year ice should have larger air bubbles than second-year ice, hence it will have a larger correlation length and a lower emissivity.
Another feature which Figure 5 emphasizes is the large variations in temperature and temperature difference possible for both forms of multi-year ice for anyone floe . Figure 6 presents a radar image of such a floe collected by the U .S. Coast Guard in the summer of 1969. From this figure, it is clear that a multi-year ice floe is far from homogeneous, but rather a conglomerate of many smaller pieces of ice of varying ages and thicknesses, re-frozen melt ponds, and drainage patterns formed from summer melt.
Figure 5, as stated above, is an idealized diagram representing typical values for homogeneous or near-homogeneous sections of ice. The sea-ice canopy, especially in the marginal ice zones, is extremely dynamic, leaving only a small number of uniform ice sections. What happens to a diagram of the kind idealized in Figure 5 over more complex ice conditions
SEA-ICE I D EN TIF I CATION US I NG PA SS I VE MICROWA VES
250 r---r-1--'1----r-1--r-1--'1----r-1--r-1~
ROUGH Q FIRST-YEAR ICE
230 r-
r-
ILl 210 fa:: ::;)
f-
~ r-ILl Il. :. ~ 190 r-I/) I/) ILl Z -f-I Cl
~ 170 ILl Cl « a:: ILl > «
150
130
, , , , SMOOTH m \ FIRST-YEAR lW \ I CE " , ,
I " I , , , ! \, , , , ,
-
-
-
I ' : \ SECOND-YEAR-, '. ICE
I
: \
: " YEAR : " ICE I I , I
, " , I , I , I
, " , I , I , I , I , I , I , I , I , I
, I , I , I , I , I , I
I , I
, " /,'
~' OPEN WATER / LJ NEW ICE
I I I I I L -20 0 20 40
TEMPERATURE DIFFERENCE ( K)
-
-
-
-
-
-
-
-
Fig. 5. Idealized diagram. depicting the general areas qf homogeneous ice .forllls delineated by dual;{requellcy passive microwave radiometr.y.
depends on what typ es of ice a re in the beam spot (38.0 m ) at anyone particular time. T herefore, beam-smoothing or averaging can produce data points anywhere a long the perimeter of the dashed triangle . For example, should the terrain be a combination of fi rst-year ice and open water, (i) temperature differences wi ll tend toward the negative because the radiometric temperature of water at 19 .3 GHz is much lower than it is at 3 1.0 GHz, and (ii) average temperature will fa ll somewhere a long the line joining first-year ice and open water/new ice depending on the percentage of each type within the beam spot. The concept of F igure 5 can be used to provide an all-weather method of describing an ice field with respect to ice type and roughness .
Figure 7 presents data for one of the five sections selected for d etailed analysis. Th is section, which is approximately 22 km long, had sign ifi cant areas of a ll of the five ice types distinguishable by passive microwave radiometry except open water/new ice. Many data points stray from th e per imeter of the triangle, however , the density of data points in various areas clearly indicate the predominant ice forms present.

234 J OU R NA L OF GLAC I OLOGY
Fig. 6. U.S. Coast Guard side-looking radar image depicting inhomogeneity characteristic if multi-year ice-floe.
250r-------.------,,------,-------,-------,------,
240
;z 2 30
w a:: :J fo<t a:: 220 w Cl. ::;: W fo-Vl
~ 210 z f0-r (!)
a:: m 200 w (!)
<t a:: w > <t 190
180
SMOOTH FIRST
YEAR ICE
+
ROUGH FIRST-YEAR
ICE
0+-+ l. .. ~
+ * +t +++ .r-+-"i-~1;:
SECONDYEAR
ICE
- +
. ,
+
+~t ... ..t + ; - + ~ YEAR ICE ~4 ++ _>--t... ~ -.- +
++ + ~- +
-t. -I -
170.L------.-..JL---__ -.-..JL-____ ---' ______ ---'-______ --L ______ .....
- 20 -10 0 10 20 30 40 TEMPERATURE DIFFERENCE ( K)
Fig. 7· riot ':1,,,,cmge brightness temperature versus temperature difference Ior 22 km section.
SEA -I CE IDENT I FICAT I ON US I NG PA ' S I VE M I CROWAVES 235
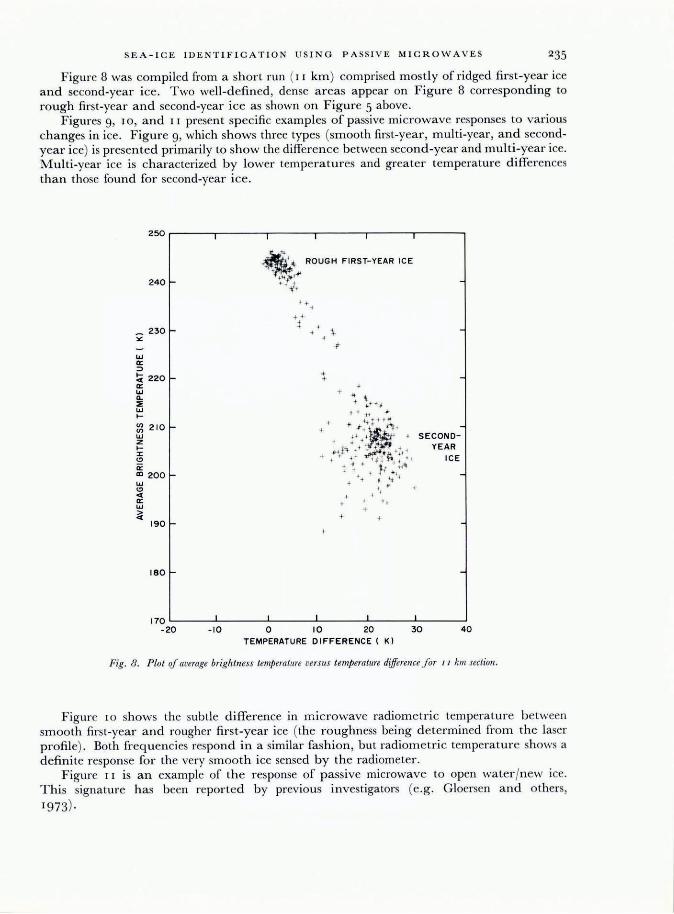
Figure 8 was compiled from a sh ort run ( 1 1 km ) comprised mostly of ridged first-year ice and second-yea r ice. Two well-defi ned, dense areas appear on F ig ure 8 correspond ing to rough first-year and second-year ice as shown on F igure 5 above.
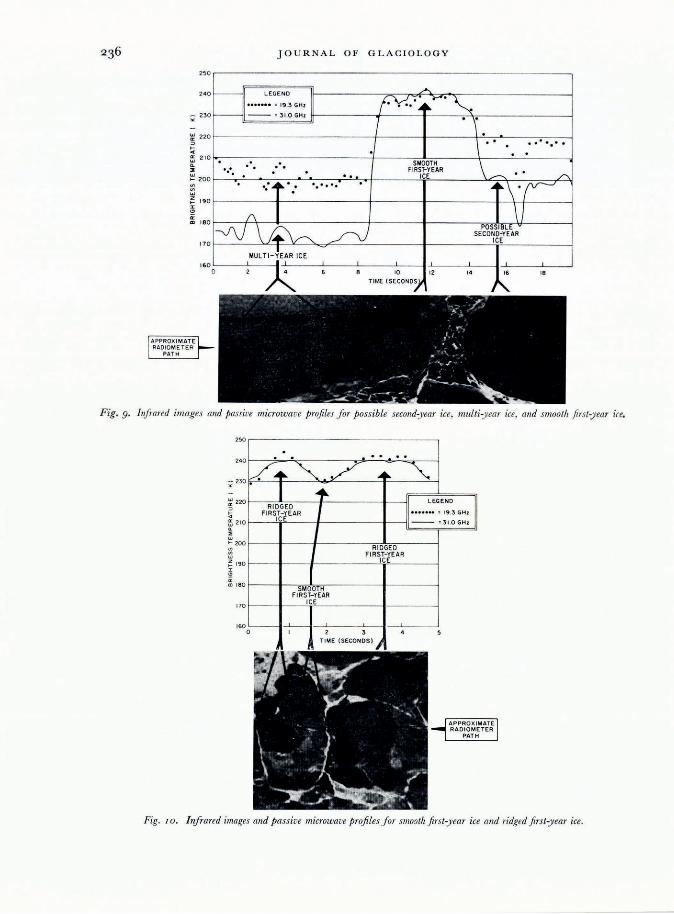
Figures 9, 10 , and II present sp ecific examples of passive microwave responses to various changes in ice. Figure 9, which shows three types (smooth first-year, m ulti-year, and secondyear ice) is presented primarily to show the difference between secon d-year and m ulti-year ice. Multi-year ice is cha racteri zed by lower temperatures and greater tem perature d ifferences than those found for second-year ice.
250r------.------'�-------.------~----~1------~
240
_ 230 f:.:
w a: ::> !;( 220 fa: w Cl. ~ W I-
~ 210 fw Z I-:I:
'" a: ID 200 w
'" « a: w
~ 190
180
~ . ; ~ ROUGH FIRST-Y EAR ICE ~.
+ , "'" <" + ..... ' +'4,
, + +
+ +
+
'+
+
SECONDYEAR
ICE
-
-
170 L-__ ...L.... ___ L-___ -1L-___ -..I....-1 __ -..l... __ ----l
- 20 - 10 0 10 20 30 40 TEMPERATURE DIFFERENCE ( K)
Fig. 8. Plot oJ average brightness temperature versus temperature difference Jor I I kill sectioll .
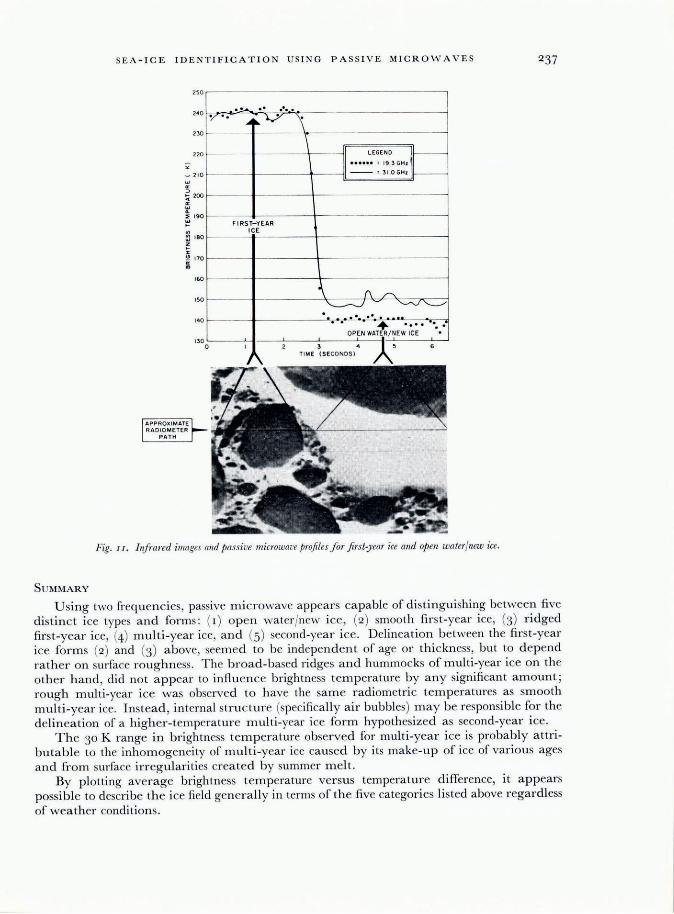
Figure 10 shows the sub tle difference in microwave radiometric temperature be tween smooth first-year and rougher first-year ice (the roughness being d etermined from the laser profile) . Both frequencies respond in a simi lar fashion , but radiometric temperature shows a definite response for the very smooth ice sensed by the radiometer.
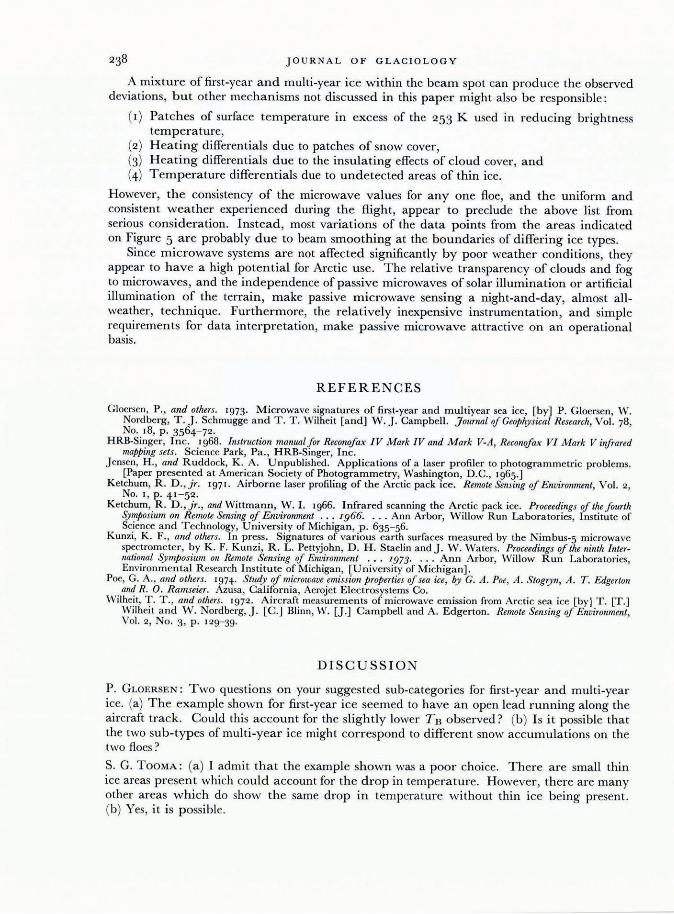
Figure J J is an example of th e response of passive microwave to open water/new ice. This signature has been reported by previous investigators (e.g. G loersen and others, 1973)·
250
2 4 0
;; 230
~ 220
~ <l
~ 2 10
" w I- 20 0
'" '" w
~ 19 0 :r
'" ~ 18 0
170
160
JO U R N AL OF G LACIOL O GY
~
~I LEGENO ••••••• : 19 .3 GHI 11 f-Y--:,..----~
: 3 1.0 GHz
1 . \ -\ -- --..... - - -
-- -- SMOOTH
\~ .... FIRST-yEAR --- ICE "" - ~-: .. .. .. ,;~\r --
/\ \1 1-0\J \~ /\J
POSSIBLE SECOND-YEAR
ICE
MULTI-~ EAR ICE
0 , 4 6 8 10 12 14 16 18
TIME ( SECOND" J
Fig. 9. Infrared images and passive rnicrow ave profiles for possible second-year ice, multi-year ice, alld smooth first-year ire.
2~r------------------------------------'
~220 ~--~~~----1-----------~--~1
~ ~ 2 10 j---~~-----j~----------1I--~::::~~~~~ ~ ~ 200~----~----~----------~~~------~ ~ ~ w
~ 19 0
~ m I BO ~----~-.~~rr-----------~--------~
170 ~----~-----"~------------~--------~
160 o
Fig. 1 0 . b ifrared images and p assive microwave profi!esfor smooth first·y ear ice alld ridged firs t-year ice.
SE A-ICE IDENTIFICATION US I NG PASSIVE MICROWAVES 237
250,---------------------------,
220
-; _ 210 w
~ ~200
::i "-
190
~ FI
'" ~ 180
~ i 170
160
150
Fig. 11. Infrm'ed images alld passive microwave projilesfor jirst-year ice and op en water/new ice.
SUMMARY
U sing two frequen cies, passive microwave appears capable of distinguishing between five distinct ice types and forms: ( I) open water/new ice, (2) smooth first-year ice, (3) ridged first-year ice, (4) multi-year ice, and (5) second-year ice. Delineation between the first-year ice forms (2) and (3) above, seem ed to be independent of age or thickness, but to d epend rather on surface roughness. The broad-based ridges and hummocks of multi-year ice on the other hand, did not appear to influence brightness temperature by any significant amount; rough multi-year ice was observed to have the sam e radiometri c temperatures as smooth multi-year ice. In. tead, internal stru cture (specifically a ir bubbles) may be responsible for the delineation of a higher-temperature multi-year ice form hypothesized as second-year ice.
The 30 K range in brightness temperature observed for multi-year ice is probably attributable to the inhomogeneity of multi-year ice caused by its make-up of ice of various ages and from surface irregularities created by summer m elt.
By plotting average brightness temperature versus temperature difference, it appears possible to describe the ice fi eld generally in terms of the five categori es listed above regardless of weather conditions.
JOURNAL OF GLACIOLOGY
A mixture of first-year and multi-year ice within the beam spot can produce the observed deviations, but other mechanisms not discussed in this paper might also be responsible:
(I) Patches of surface temperature in excess of the 253 K used in reducing brightness temperature,
(2) Heating differentials due to patches of snow cover, (3) Heating differentials due to the insulating effects of cloud cover, and (4) Temperature differentials due to undetected areas of thin ice.
However, the consistency of the microwave values for anyone floe, and the uniform and consistent weather experienced during the flight, appear to preclude the above list from serious consideration. Instead, most variations of the data points from the areas indicated on Figure 5 are probably due to beam smoothing at the boundaries of differing ice types.
Since microwave systems are not affected significantly by poor weather conditions, they appear to have a high potential for Arctic use. The relative transparency of clouds and fog to microwaves, and the independence of passive microwaves of solar illumination or artificial illumination of the terrain, make passive microwave sensing a night-and-day, almost allweather, technique. Furthermore, the relatively inexpensive instrumentation, and simple requirements for data interpretation, make passive microwave attractive on an operational basis.
REFERENCES
Gloersen, P ., and others. '973. Microwave signatures of first-year and multiyear sea ice, [by] P. Gloersen, W. Nordberg, T. j. Schmugge and T. T. Wilheit [and] W. j. Campbell. Journal oJCeophysical Research, Vo!. 78, No. ,8, p. 3564- 72.
HRB-Singer, Inc. '968. Instruction manualJor Reconofax IV Mark IV and Mark V-A , Reconofax VI Mark V illfrared mapping sets. Science Park, Pa., HRB-Singer, Inc.
jensen, H. , and Ruddock, K. A. Unpublished. Applications of a laser profiler to photogrammetric problems. [Paper presented at American Society of Photo gramme try, Washington, D.C., 1965.]
Ketchum, R. D .,jr. 1971. Airborne laser profiling of the Arctic pack ice. Remote Senjing DJ Environment, Vo!. 2, No. I , p. 41 -52.
Ketchum, R. D., jr., and Wittmann, W. I. 1966. Infrared scanning the Arctic pack ice. Proceedings oJ the Jourth Symposium on R emote Sensing oJ E,wironment ... 1966. . .. Ann Arbor, Willow Run Laboratories, Institute of Science and Technology, University of Michigan, p. 635- 56.
Kunzi, K. F. , and others. In press. Signatures of various earth surfaces m easured by the Nimbus-5 microwave spectrometer, by K . F. Kunzi, R . L. Pettyjohn, D . H . Staelin and j . W. Waters. Proceedings oJ the ninth International Symposium on Remote Sensing DJ Environment .•. 1973. . .. Ann Arbor, Willow Run Laboratories, Environmental R esearch Institute of Michigan, [University of Michigan].
Poe, G. A. , and others. 1974. Study oJ microwave emission properties oJ sea ice, by C. A . Poe, A . Stogryn, A. T. Edger/on and R. O. Ramseier. Azusa, California, Aerojet Electrosys tems Co.
Wilheit, T . T. , and others. 1972. Aircraft measurements of microwave emission from Arctic sea ice [by] T . [T] Wilheit and W . Nordberg, j . [C.] Blinn, W. [J.] Campbell and A. Edgerton. Remote Sensing oJ Environment, Vo!. 2, No. 3, p. 129- 39.
DISCUSSION
P. GLOERSEN: Two questions on your suggested sub-categories for first-year and multi-year ice. (a) The example shown for first-year ice seemed to have an open lead running along the aircraft track. Could this account for the slightly lower TB observed? (b) Is it possible that the two sub-types of multi-year ice might correspond to different snow accumulations on the two floes?
S. G. TOOMA: (a ) I admit that the example shown was a poor choice. There are small thin ice areas present which could account for the drop in temperature. However, there are many other areas which do show the same drop in temperature without thin ice being present. (b) Yes, it is possible.

SEA -ICE IDE NTIFI CATION US ING PA SS IVE MI CROWA VES
A. W. ENGLAND: How thick was your "open water/new ice"?
TOOMA: About 5 cm .
239
E NGLAND: Your data are consistent with the results from ollr theoretical modelling. Fo r open water/new ice, the longer wavelength "sees" through the ice and the colder-seeming water results in colder (longer wavelength) brightness temperatures. First-year ice contains brine causing strong frequency-independent absorption. The brightness temperature will be the sam e at both wavelengths. The brine has drained from multi-year ice so that the absorption is lower and there is greater penetration . The empty brine pockets act as scatterers affecting prefe rentially the shorter wavelengths. Therefore, scattering, older ice wi ll appear darker at shorter wavelengths.
W . F. WEEKS AND J. F. NYE : H ow h opeful are you of using this type of system to distinguish diffe rent classes of thin ice? The reason for the question is that in current models of the m echanical behaviour of pack ice it is the thickness distribution o f thin ice that is the importa nt parameter that we must measure.
TOOMA: I realize the importance of the thickness distribution, but I am not hopeful at this time that we wi ll be able to distinguish many different classes of thin ice.