Comparison of Saturated Absorption Spectra of Acetylene ... · Comparison of Saturated Absorption...
4
Comparison of Saturated Absorption Spectra of Acetylene Gas Inside Photonic Bandgap Fibers K. Knabe, R. Thapa, O. L. Weaver, B. R. Washburn, and K. L. Corwin Kansas State University, Dept. of Physics, 116 Cardwell Hall, Manhattan, KS 66506 email: [email protected] , phone: 785-532-2263, fax: 785-532-6606 Abstract: Saturated absorption spectroscopy is performed inside hollow photonic bandgap fibers, with both 10 µm and 20 µm core diameters. Line width and signal quality depend on the fiber core diameter, as well as pressure and optical power. These parameters are optimized toward the creation of an optical reference. The effect of splicing the fiber to a single-mode fiber is also investigated. The development of optical frequency standards in the near-infrared spectral region has been motivated in part by the optical telecommunications industry. Acetylene gas offers a series of well-spaced spectral features in the 1.5 µm region, spanning the C band. By pressure-broadening these features to about 1 GHz in width, the National Institute of Standards and Technology (NIST) has created portable standards of moderate uncertainties, between 13 MHz and 130 MHz, that can be built into commercial devices [1, 2]. Meanwhile, sub-Doppler spectroscopy of molecular gases provides high-accuracy infrared optical frequency references. Typically the weak molecular overtone transitions employed at these wavelengths require high powers for saturation, and therefore to date all high-accuracy references have been based on power build-up cavities [3, 4] , which provide power amplification and long effective interaction lengths but are not readily portable. A series of measurements of lines in the ν 1 +ν 3 band [4-6] led the Comitté International des Poids et Mesures (CIPM) to adopt a value of the P(16) line in 13 C 2 H 2 with an uncertainty of 100 kHz [7]. With the advent of frequency comb technology, groups at the National Institute of Advanced Industrial Science and Technology (AIST) in Japan [8, 9], National Physical Laboratory (NPL) in the UK [10], and the National Research Council (NRC) in Canada [11, 12] have measured these lines with greatly increased precision. The CIPM recently reduced the uncertainty of the P(16) transition to 10 kHz, and most recently, 61 lines in the band have been realized with a width of 600 kHz and measured to an uncertainty of 1.4 kHz [13]. However, there are many advantages to performing saturation spectroscopy independent of a power build-up cavity, as described in Ref. [14], where signals with widths ~1 MHz have been observed inside a 1 m long glass cell. While the science of frequency metrology has been transformed, optical fiber technology has simultaneously been revolutionized by the advent of hollow, low-loss photonic bandgap (PBG) fibers. These optical waveguides allows light to be confined at high intensities in a hollow air or gas-filled region with very low loss [15]. These fibers are vastly superior to capillary fibers for small core diameters [16], and have therefore been used in many recent demonstrations of nonlinear light-gas interactions. Examples include gas sensors [17], Raman scattering in hydrogen-filled fiber as a tunable light source [18], and electromagnetically induced transparency (EIT) in PBG fibers filled with acetylene and rubidium [19-21]. Lasers have been locked to the side of Doppler-broadened transitions in sealed acetylene-filled fibers, toward the development of portable frequency references [22]. Finally, saturated absorption has been observed inside photonic bandgap fibers. Initial observations indicated large background noise arising from interference and mode beating [23, 24], even in an all-fiber configuration [25]. A more complete discussion of these issues appears in Ref. [26]. For PBG fiber cells to be employed as frequency references, the saturated absorption spectrum must be optimized in magnitude and minimized in width. Also, modulation of the transmitted light due to spurious interference or mode beating must be suppressed. In the effort to develop optical frequency references using acetylene filled PBG fiber cells, we have examined the dependence of signal size and width on gas pressure and fiber diameter, among other factors. Furthermore, when the PBG fiber is sealed by splicing SMF solid-core fiber to either side, etalon effects and changes in mode coupling may give rise to spurious signals that must be minimized. Thus we characterize saturated absorption inside a PBG fiber, as a function of gas and fiber dimensions. We also investigate the effects of splicing the fiber on the signal quality. In Fig. 1a, the experimental setup is shown for measurements of acetylene saturated absorption spectra in an isolated photonic bandgap fiber. Modifications to the experiment made to accommodate a single splice between a step-index single-mode fiber and a photonic bandgap fiber are shown in Fig. 1b. The details of the splicing technique for splicing hollow PBG fiber to step-index fiber are given in Ref. [27]. A 5 mW beam from an extended cavity diode laser (ECDL) is split, and 10% is amplified by an IPG Photonics ® Erbium-doped fiber amplifier (EDFA) to up to 500 mW. The remaining power is sent to diagnostics, which include an acetylene-filled glass cell
Transcript of Comparison of Saturated Absorption Spectra of Acetylene ... · Comparison of Saturated Absorption...
Comparison of Saturated Absorption Spectra of Acetylene Gas Inside Photonic Bandgap Fibers
K. Knabe, R. Thapa, O. L. Weaver, B. R. Washburn, and K. L. Corwin Kansas State University, Dept. of Physics, 116 Cardwell Hall, Manhattan, KS 66506
email: [email protected], phone: 785-532-2263, fax: 785-532-6606
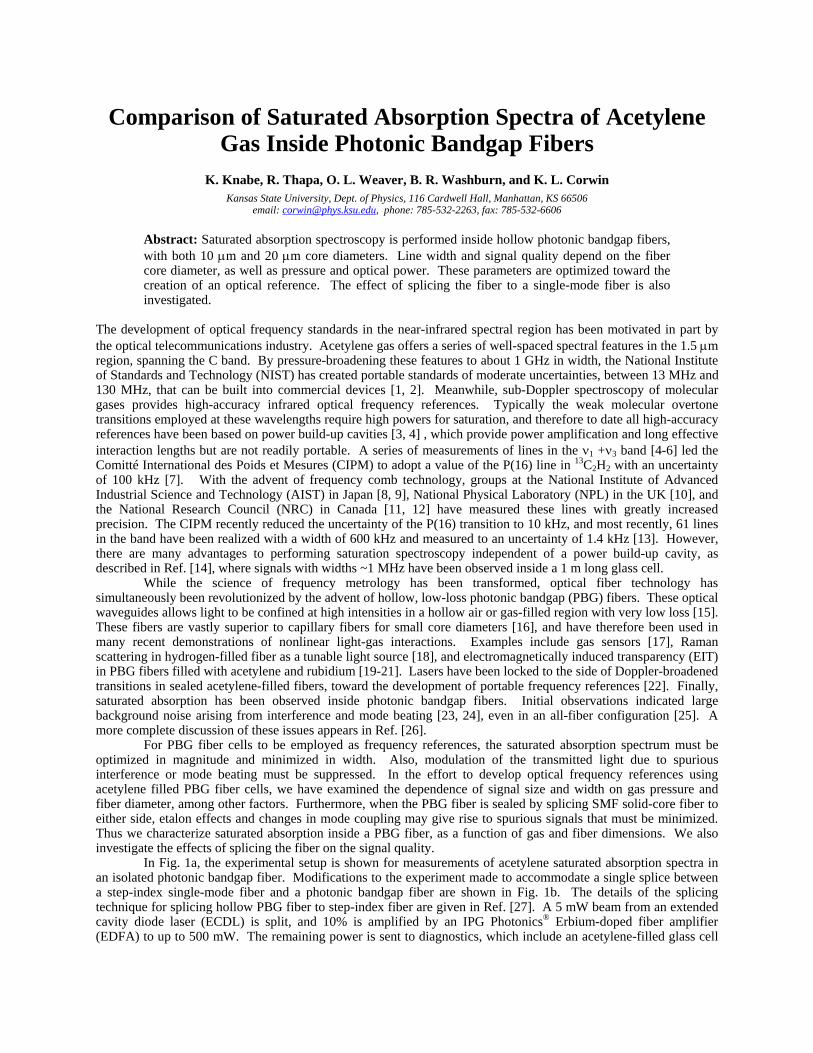
Abstract: Saturated absorption spectroscopy is performed inside hollow photonic bandgap fibers, with both 10 µm and 20 µm core diameters. Line width and signal quality depend on the fiber core diameter, as well as pressure and optical power. These parameters are optimized toward the creation of an optical reference. The effect of splicing the fiber to a single-mode fiber is also investigated.
The development of optical frequency standards in the near-infrared spectral region has been motivated in part by the optical telecommunications industry. Acetylene gas offers a series of well-spaced spectral features in the 1.5 µm region, spanning the C band. By pressure-broadening these features to about 1 GHz in width, the National Institute of Standards and Technology (NIST) has created portable standards of moderate uncertainties, between 13 MHz and 130 MHz, that can be built into commercial devices [1, 2]. Meanwhile, sub-Doppler spectroscopy of molecular gases provides high-accuracy infrared optical frequency references. Typically the weak molecular overtone transitions employed at these wavelengths require high powers for saturation, and therefore to date all high-accuracy references have been based on power build-up cavities [3, 4] , which provide power amplification and long effective interaction lengths but are not readily portable. A series of measurements of lines in the ν1 +ν3 band [4-6] led the Comitté International des Poids et Mesures (CIPM) to adopt a value of the P(16) line in 13C2H2 with an uncertainty of 100 kHz [7]. With the advent of frequency comb technology, groups at the National Institute of Advanced Industrial Science and Technology (AIST) in Japan [8, 9], National Physical Laboratory (NPL) in the UK [10], and the National Research Council (NRC) in Canada [11, 12] have measured these lines with greatly increased precision. The CIPM recently reduced the uncertainty of the P(16) transition to 10 kHz, and most recently, 61 lines in the band have been realized with a width of 600 kHz and measured to an uncertainty of 1.4 kHz [13]. However, there are many advantages to performing saturation spectroscopy independent of a power build-up cavity, as described in Ref. [14], where signals with widths ~1 MHz have been observed inside a 1 m long glass cell. While the science of frequency metrology has been transformed, optical fiber technology has simultaneously been revolutionized by the advent of hollow, low-loss photonic bandgap (PBG) fibers. These optical waveguides allows light to be confined at high intensities in a hollow air or gas-filled region with very low loss [15]. These fibers are vastly superior to capillary fibers for small core diameters [16], and have therefore been used in many recent demonstrations of nonlinear light-gas interactions. Examples include gas sensors [17], Raman scattering in hydrogen-filled fiber as a tunable light source [18], and electromagnetically induced transparency (EIT) in PBG fibers filled with acetylene and rubidium [19-21]. Lasers have been locked to the side of Doppler-broadened transitions in sealed acetylene-filled fibers, toward the development of portable frequency references [22]. Finally, saturated absorption has been observed inside photonic bandgap fibers. Initial observations indicated large background noise arising from interference and mode beating [23, 24], even in an all-fiber configuration [25]. A more complete discussion of these issues appears in Ref. [26]. For PBG fiber cells to be employed as frequency references, the saturated absorption spectrum must be optimized in magnitude and minimized in width. Also, modulation of the transmitted light due to spurious interference or mode beating must be suppressed. In the effort to develop optical frequency references using acetylene filled PBG fiber cells, we have examined the dependence of signal size and width on gas pressure and fiber diameter, among other factors. Furthermore, when the PBG fiber is sealed by splicing SMF solid-core fiber to either side, etalon effects and changes in mode coupling may give rise to spurious signals that must be minimized. Thus we characterize saturated absorption inside a PBG fiber, as a function of gas and fiber dimensions. We also investigate the effects of splicing the fiber on the signal quality. In Fig. 1a, the experimental setup is shown for measurements of acetylene saturated absorption spectra in an isolated photonic bandgap fiber. Modifications to the experiment made to accommodate a single splice between a step-index single-mode fiber and a photonic bandgap fiber are shown in Fig. 1b. The details of the splicing technique for splicing hollow PBG fiber to step-index fiber are given in Ref. [27]. A 5 mW beam from an extended cavity diode laser (ECDL) is split, and 10% is amplified by an IPG Photonics® Erbium-doped fiber amplifier (EDFA) to up to 500 mW. The remaining power is sent to diagnostics, which include an acetylene-filled glass cell
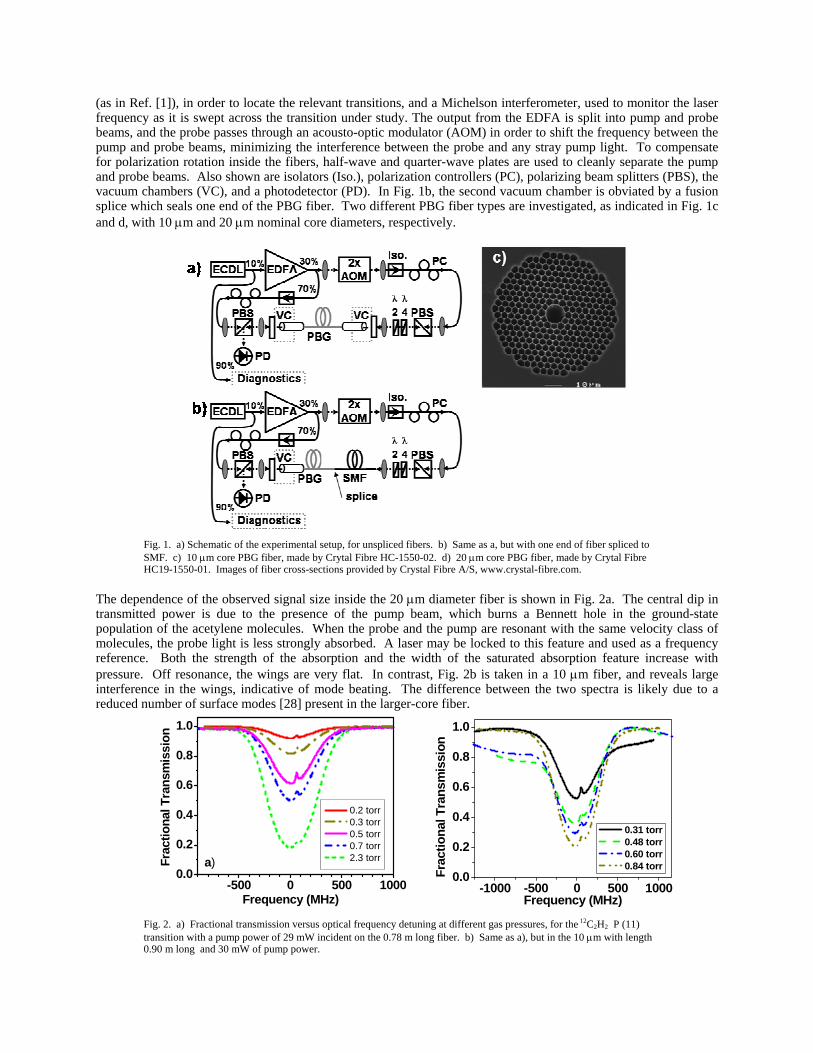
(as in Ref. [1]), in order to locate the relevant transitions, and a Michelson interferometer, used to monitor the laser frequency as it is swept across the transition under study. The output from the EDFA is split into pump and probe beams, and the probe passes through an acousto-optic modulator (AOM) in order to shift the frequency between the pump and probe beams, minimizing the interference between the probe and any stray pump light. To compensate for polarization rotation inside the fibers, half-wave and quarter-wave plates are used to cleanly separate the pump and probe beams. Also shown are isolators (Iso.), polarization controllers (PC), polarizing beam splitters (PBS), the vacuum chambers (VC), and a photodetector (PD). In Fig. 1b, the second vacuum chamber is obviated by a fusion splice which seals one end of the PBG fiber. Two different PBG fiber types are investigated, as indicated in Fig. 1c and d, with 10 µm and 20 µm nominal core diameters, respectively.
Fig. 1. a) Schematic of the experimental setup, for unspliced fibers. b) Same as a, but with one end of fiber spliced to SMF. c) 10 µm core PBG fiber, made by Crytal Fibre HC-1550-02. d) 20 µm core PBG fiber, made by Crytal Fibre HC19-1550-01. Images of fiber cross-sections provided by Crystal Fibre A/S, www.crystal-fibre.com.
The dependence of the observed signal size inside the 20 µm diameter fiber is shown in Fig. 2a. The central dip in transmitted power is due to the presence of the pump beam, which burns a Bennett hole in the ground-state population of the acetylene molecules. When the probe and the pump are resonant with the same velocity class of molecules, the probe light is less strongly absorbed. A laser may be locked to this feature and used as a frequency reference. Both the strength of the absorption and the width of the saturated absorption feature increase with pressure. Off resonance, the wings are very flat. In contrast, Fig. 2b is taken in a 10 µm fiber, and reveals large interference in the wings, indicative of mode beating. The difference between the two spectra is likely due to a reduced number of surface modes [28] present in the larger-core fiber.
-500 0 500 10000.0
0.2
0.4
0.6
0.8
1.0
a)
0.2 torr 0.3 torr 0.5 torr 0.7 torr 2.3 torr
Frac
tiona
l Tra
nsm
issi
on
Frequency (MHz)-1000 -500 0 500 1000
0.0
0.2
0.4
0.6
0.8
1.0
Frac
tiona
l Tra
nsm
issi
on
Frequency (MHz)
0.31 torr 0.48 torr 0.60 torr 0.84 torr
Fig. 2. a) Fractional transmission versus optical frequency detuning at different gas pressures, for the 12C2H2 P (11) transition with a pump power of 29 mW incident on the 0.78 m long fiber. b) Same as a), but in the 10 µm with length 0.90 m long and 30 mW of pump power.
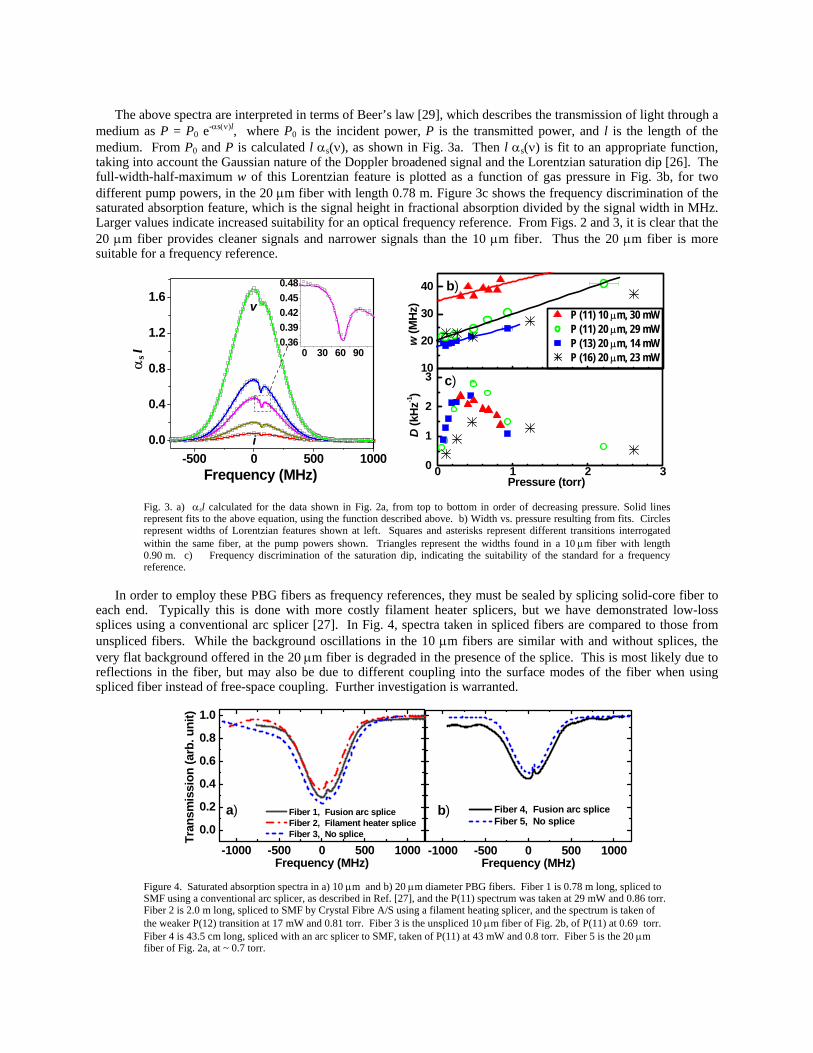
The above spectra are interpreted in terms of Beer’s law [29], which describes the transmission of light through a
medium as P = P0 e-αs(ν)l, where P0 is the incident power, P is the transmitted power, and l is the length of the medium. From P0 and P is calculated l αs(ν), as shown in Fig. 3a. Then l αs(ν) is fit to an appropriate function, taking into account the Gaussian nature of the Doppler broadened signal and the Lorentzian saturation dip [26]. The full-width-half-maximum w of this Lorentzian feature is plotted as a function of gas pressure in Fig. 3b, for two different pump powers, in the 20 µm fiber with length 0.78 m. Figure 3c shows the frequency discrimination of the saturated absorption feature, which is the signal height in fractional absorption divided by the signal width in MHz. Larger values indicate increased suitability for an optical frequency reference. From Figs. 2 and 3, it is clear that the 20 µm fiber provides cleaner signals and narrower signals than the 10 µm fiber. Thus the 20 µm fiber is more suitable for a frequency reference.
-500 0 500 10000.0
0.4
0.8
1.2
1.6
0 30 60 900.360.390.420.450.48
i
v
Frequency (MHz)
αs l
0 1 2 30
1
2
310
20
30
40
D (k
Hz-1
)
Pressure (torr)
c)
b)
P (11) 10 µm, 30 mW P (11) 20 µm, 29 mW P (13) 20 µm, 14 mW P (16) 20 µm, 23 mW
w (M
Hz)
Fig. 3. a) αsl calculated for the data shown in Fig. 2a, from top to bottom in order of decreasing pressure. Solid lines represent fits to the above equation, using the function described above. b) Width vs. pressure resulting from fits. Circles represent widths of Lorentzian features shown at left. Squares and asterisks represent different transitions interrogated within the same fiber, at the pump powers shown. Triangles represent the widths found in a 10 µm fiber with length 0.90 m. c) Frequency discrimination of the saturation dip, indicating the suitability of the standard for a frequency reference.
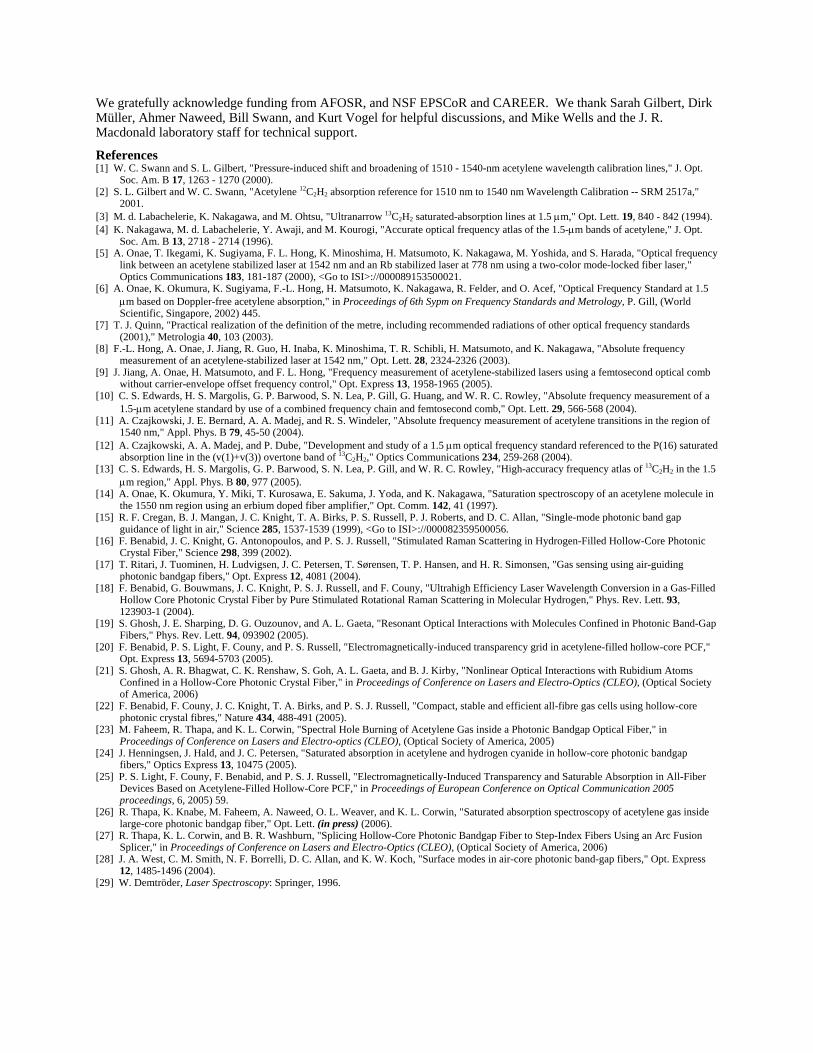
In order to employ these PBG fibers as frequency references, they must be sealed by splicing solid-core fiber to
each end. Typically this is done with more costly filament heater splicers, but we have demonstrated low-loss splices using a conventional arc splicer [27]. In Fig. 4, spectra taken in spliced fibers are compared to those from unspliced fibers. While the background oscillations in the 10 µm fibers are similar with and without splices, the very flat background offered in the 20 µm fiber is degraded in the presence of the splice. This is most likely due to reflections in the fiber, but may also be due to different coupling into the surface modes of the fiber when using spliced fiber instead of free-space coupling. Further investigation is warranted.
-1000 -500 0 500 1000
0.0
0.2
0.4
0.6
0.8
1.0
-1000 -500 0 500 1000
b)a) Fiber 1, Fusion arc splice Fiber 2, Filament heater splice Fiber 3, No splice
Tran
smis
sion
(arb
. uni
t)
Frequency (MHz)
Fiber 4, Fusion arc splice Fiber 5, No splice
Frequency (MHz) Figure 4. Saturated absorption spectra in a) 10 µm and b) 20 µm diameter PBG fibers. Fiber 1 is 0.78 m long, spliced to SMF using a conventional arc splicer, as described in Ref. [27], and the P(11) spectrum was taken at 29 mW and 0.86 torr. Fiber 2 is 2.0 m long, spliced to SMF by Crystal Fibre A/S using a filament heating splicer, and the spectrum is taken of the weaker P(12) transition at 17 mW and 0.81 torr. Fiber 3 is the unspliced 10 µm fiber of Fig. 2b, of P(11) at 0.69 torr. Fiber 4 is 43.5 cm long, spliced with an arc splicer to SMF, taken of P(11) at 43 mW and 0.8 torr. Fiber 5 is the 20 µm fiber of Fig. 2a, at ~ 0.7 torr.
We gratefully acknowledge funding from AFOSR, and NSF EPSCoR and CAREER. We thank Sarah Gilbert, Dirk Müller, Ahmer Naweed, Bill Swann, and Kurt Vogel for helpful discussions, and Mike Wells and the J. R. Macdonald laboratory staff for technical support.
References [1] W. C. Swann and S. L. Gilbert, "Pressure-induced shift and broadening of 1510 - 1540-nm acetylene wavelength calibration lines," J. Opt.
Soc. Am. B 17, 1263 - 1270 (2000). [2] S. L. Gilbert and W. C. Swann, "Acetylene 12C2H2 absorption reference for 1510 nm to 1540 nm Wavelength Calibration -- SRM 2517a,"
2001. [3] M. d. Labachelerie, K. Nakagawa, and M. Ohtsu, "Ultranarrow 13C2H2 saturated-absorption lines at 1.5 µm," Opt. Lett. 19, 840 - 842 (1994). [4] K. Nakagawa, M. d. Labachelerie, Y. Awaji, and M. Kourogi, "Accurate optical frequency atlas of the 1.5-µm bands of acetylene," J. Opt.
Soc. Am. B 13, 2718 - 2714 (1996). [5] A. Onae, T. Ikegami, K. Sugiyama, F. L. Hong, K. Minoshima, H. Matsumoto, K. Nakagawa, M. Yoshida, and S. Harada, "Optical frequency
link between an acetylene stabilized laser at 1542 nm and an Rb stabilized laser at 778 nm using a two-color mode-locked fiber laser," Optics Communications 183, 181-187 (2000), <Go to ISI>://000089153500021.
[6] A. Onae, K. Okumura, K. Sugiyama, F.-L. Hong, H. Matsumoto, K. Nakagawa, R. Felder, and O. Acef, "Optical Frequency Standard at 1.5 µm based on Doppler-free acetylene absorption," in Proceedings of 6th Sypm on Frequency Standards and Metrology, P. Gill, (World Scientific, Singapore, 2002) 445.
[7] T. J. Quinn, "Practical realization of the definition of the metre, including recommended radiations of other optical frequency standards (2001)," Metrologia 40, 103 (2003).
[8] F.-L. Hong, A. Onae, J. Jiang, R. Guo, H. Inaba, K. Minoshima, T. R. Schibli, H. Matsumoto, and K. Nakagawa, "Absolute frequency measurement of an acetylene-stabilized laser at 1542 nm," Opt. Lett. 28, 2324-2326 (2003).
[9] J. Jiang, A. Onae, H. Matsumoto, and F. L. Hong, "Frequency measurement of acetylene-stabilized lasers using a femtosecond optical comb without carrier-envelope offset frequency control," Opt. Express 13, 1958-1965 (2005).
[10] C. S. Edwards, H. S. Margolis, G. P. Barwood, S. N. Lea, P. Gill, G. Huang, and W. R. C. Rowley, "Absolute frequency measurement of a 1.5-µm acetylene standard by use of a combined frequency chain and femtosecond comb," Opt. Lett. 29, 566-568 (2004).
[11] A. Czajkowski, J. E. Bernard, A. A. Madej, and R. S. Windeler, "Absolute frequency measurement of acetylene transitions in the region of 1540 nm," Appl. Phys. B 79, 45-50 (2004).
[12] A. Czajkowski, A. A. Madej, and P. Dube, "Development and study of a 1.5 µm optical frequency standard referenced to the P(16) saturated absorption line in the (v(1)+v(3)) overtone band of 13C2H2," Optics Communications 234, 259-268 (2004).
[13] C. S. Edwards, H. S. Margolis, G. P. Barwood, S. N. Lea, P. Gill, and W. R. C. Rowley, "High-accuracy frequency atlas of 13C2H2 in the 1.5 µm region," Appl. Phys. B 80, 977 (2005).
[14] A. Onae, K. Okumura, Y. Miki, T. Kurosawa, E. Sakuma, J. Yoda, and K. Nakagawa, "Saturation spectroscopy of an acetylene molecule in the 1550 nm region using an erbium doped fiber amplifier," Opt. Comm. 142, 41 (1997).
[15] R. F. Cregan, B. J. Mangan, J. C. Knight, T. A. Birks, P. S. Russell, P. J. Roberts, and D. C. Allan, "Single-mode photonic band gap guidance of light in air," Science 285, 1537-1539 (1999), <Go to ISI>://000082359500056.
[16] F. Benabid, J. C. Knight, G. Antonopoulos, and P. S. J. Russell, "Stimulated Raman Scattering in Hydrogen-Filled Hollow-Core Photonic Crystal Fiber," Science 298, 399 (2002).
[17] T. Ritari, J. Tuominen, H. Ludvigsen, J. C. Petersen, T. Sørensen, T. P. Hansen, and H. R. Simonsen, "Gas sensing using air-guiding photonic bandgap fibers," Opt. Express 12, 4081 (2004).
[18] F. Benabid, G. Bouwmans, J. C. Knight, P. S. J. Russell, and F. Couny, "Ultrahigh Efficiency Laser Wavelength Conversion in a Gas-Filled Hollow Core Photonic Crystal Fiber by Pure Stimulated Rotational Raman Scattering in Molecular Hydrogen," Phys. Rev. Lett. 93, 123903-1 (2004).
[19] S. Ghosh, J. E. Sharping, D. G. Ouzounov, and A. L. Gaeta, "Resonant Optical Interactions with Molecules Confined in Photonic Band-Gap Fibers," Phys. Rev. Lett. 94, 093902 (2005).
[20] F. Benabid, P. S. Light, F. Couny, and P. S. Russell, "Electromagnetically-induced transparency grid in acetylene-filled hollow-core PCF," Opt. Express 13, 5694-5703 (2005).
[21] S. Ghosh, A. R. Bhagwat, C. K. Renshaw, S. Goh, A. L. Gaeta, and B. J. Kirby, "Nonlinear Optical Interactions with Rubidium Atoms Confined in a Hollow-Core Photonic Crystal Fiber," in Proceedings of Conference on Lasers and Electro-Optics (CLEO), (Optical Society of America, 2006)
[22] F. Benabid, F. Couny, J. C. Knight, T. A. Birks, and P. S. J. Russell, "Compact, stable and efficient all-fibre gas cells using hollow-core photonic crystal fibres," Nature 434, 488-491 (2005).
[23] M. Faheem, R. Thapa, and K. L. Corwin, "Spectral Hole Burning of Acetylene Gas inside a Photonic Bandgap Optical Fiber," in Proceedings of Conference on Lasers and Electro-optics (CLEO), (Optical Society of America, 2005)
[24] J. Henningsen, J. Hald, and J. C. Petersen, "Saturated absorption in acetylene and hydrogen cyanide in hollow-core photonic bandgap fibers," Optics Express 13, 10475 (2005).
[25] P. S. Light, F. Couny, F. Benabid, and P. S. J. Russell, "Electromagnetically-Induced Transparency and Saturable Absorption in All-Fiber Devices Based on Acetylene-Filled Hollow-Core PCF," in Proceedings of European Conference on Optical Communication 2005 proceedings, 6, 2005) 59.
[26] R. Thapa, K. Knabe, M. Faheem, A. Naweed, O. L. Weaver, and K. L. Corwin, "Saturated absorption spectroscopy of acetylene gas inside large-core photonic bandgap fiber," Opt. Lett. (in press) (2006).
[27] R. Thapa, K. L. Corwin, and B. R. Washburn, "Splicing Hollow-Core Photonic Bandgap Fiber to Step-Index Fibers Using an Arc Fusion Splicer," in Proceedings of Conference on Lasers and Electro-Optics (CLEO), (Optical Society of America, 2006)
[28] J. A. West, C. M. Smith, N. F. Borrelli, D. C. Allan, and K. W. Koch, "Surface modes in air-core photonic band-gap fibers," Opt. Express 12, 1485-1496 (2004).
[29] W. Demtröder, Laser Spectroscopy: Springer, 1996.