
A comparison of strength properties of heat treated AISI ...

COMPARISON OF RESPIRATORY FUNCTION OF TREATED
TUBERCULOSIS PATIENTS AMONG SMOKERS AND NON
SMOKERS
DISSERTATION SUBMITTED TO THE TAMILNADU
DR.M.G.R. MEDICAL UNIVERSITY, CHENNAI
In partial fulfilment of the requirements for the degree of
M.D. BRANCH – XVII
(TUBERCULOSIS AND RESPIRATORY MEDICINE)
DEPARTMENT OF THORACIC MEDICINE
TIRUNELVELI MEDICAL COLLEGE HOSPITAL
TIRUNELVELI – 627011
MAY-2019

CERTIFICATE BY THE DEAN
I hereby certify that this dissertation entitled “COMPARISON OF
RESPIRATORY FUNCTION OF TREATED TUBERCULOSIS
PATIENTS AMONG SMOKERS AND NON SMOKERS” is a record of
work done by Dr.P.S.KAVIYARASI, in the Department of TUBERCULOSIS
AND RESPIRATORY MEDICINE , Tirunelveli Medical College, Tirunelveli,
during her postgraduate degree course period from 2016- 2018. This work has
not formed the basis for previous award of any degree.
Date :Place : TIRUNELVELI
The DEAN
Tirunelveli Medical College,
Tirunelveli - 627011.

CERTIFICATE BY THE GUIDE
This is to certify that the dissertation entitled “COMPARISON OF
RESPIRATORY FUNCTION OF TREATED TUBERCULOSIS
PATIENTS AMONG SMOKERS AND NON SMOKERS” , is a record of
work done by Dr.P.S.KAVIYARASI, in partial fulfilment for the award of the
degree of Doctor of Medicine in TUBERCULOSIS AND RESPIRATORY
MEDICINE for the May 2019 examination by the Tamilnadu Dr.M.G.R.
Medical University, Chennai , this is a bonafide original research work done by
her in the department of TUBERCULOSIS AND RESPIRATORY MEDICINE,
Tirunelveli Medical College, under my guidance and supervision.
Date :Place: TIRUNELVELI
Prof. Dr.K.KRISHNAMOORTHY, M.D.PROFESSOR,
DEPARTMENT OF THORACIC MEDICINE,TIRUNELVELI MEDICAL COLLEGE,
TIRUNELVELI.
DECLARATION BY THE CANDIDATE
I solemnly declare that this dissertation titled “COMPARISON OF
RESPIRATORY FUNCTION OF TREATED TUBERCULOSIS PATIENTS
AMONG SMOKERS AND NON SMOKERS” submitted by me for the degree
of M.D., is the record work carried out by me during the period of 2016-2018
under the guidance of Prof. Dr.K.KRISHNAMOORTHY, M.D, Professor and
Head of the Department, Department of Thoracic Medicine, Tirunelveli Medical
College, Tirunelveli. The dissertation is submitted to The Tamilnadu Dr. M.G.R.
Medical University, Chennai, towards the partial fulfilment of requirements for
the award of M.D.(Branch XVII) Tuberculosis and Respiratory Medicine
examination to be held in May 2019.
Place: Tirunelveli Dr.P.S.KAVIYARASI,
Date: Department of Thoracic medicine,
Tirunelveli Medical College,
Tirunelveli

ACKNOWLEDGEMENT
To begin with, I thank GOD and my parents P.SHANMUGAM and
S.SUSEELA , and I am grateful for their will and blessings.
I thank the DEAN Dr.S.M.Kannan,M.S., MCh., for permitting me to conduct
this study and to use the resources of the hospital.
I sincerely thank my Professor and Head of the Department of Thoracic
Medicine, DR.KRISHNAMOORTHY. K M.D, who has always provided me the
necessary help, guidance and support. His valuable suggestions and concern bring the
successful completion of this dissertation work.
I am extremely thankful to the respected Assistant Professors of my Department,
Dr. MATHAN.E, Dr. SENTHIL ARASU.P, and Dr. RAHMAN SHAHUL
HAMEED.O.M. , for their concern, contributions, suggestions, support and co-
operation during the study.
I also thank all my senior and junior postgraduate colleagues for their
cooperation and support for this study.
I acknowledge the contributions of my patients who were involved in this study.
I express my sincere gratitude to my sister VANITHA and my husband
R.RAVIMANI for their encouragement and support in each and every moment,
especially during the tougher times in the fulfillment of this dissertation work.


CERTIFICATE – II
This is to certify that this dissertation work title “COMPARISON OF
RESPIRATORY FUNCTION OF TREATED TUBERCULOSIS PATIENTS
AMONG SMOKERS AND NON SMOKERS” of the candidate
Dr.P.S.KAVIYARASI, with registration Number 201627201 for the award of
M.D. Degree in the branch of TUBERCULOSIS AND RESPIRATORY
MEDICINE (XVII). I personally verified the urkund.com website for the
purpose of plagiarism check. I found that the uploaded thesis file contains from
introduction to conclusion page and result shows 4 percentage of plagiarism in
the dissertation.
Guide & Supervisor sign with Seal.


S.NO TITLE PAGE.NO
1. INTRODUCTION 1
2. AIM AND OBJECTIVES 3
3. REVIEW OF LITERATURE 4
4. MATERIALS AND METHODS 33
5. OBSERVATION AND RESULTS 43
6. DISCUSSION 67
7. SUMMARY 76
8. CONCLUSION 77
9. LIMITATION 78
10. BIBILIOGRAPHY
11. MASTER CHART

ABBREVIATIONS
1. ATT ANTITUBERCULOUS DRUG
2. BMI BODY MASS INDEX
3. CAT I CATEGORY I
4. CAT II CATEGORY II
5. FEV1 FORCED EXPIRATORY VOLUME IN 1SECOND
6. FVC FORCED VITAL CAPACITY
7. HIV HUMAN IMMUNODEFICIENCY VIRUS
8. PEF PEAK EXPIRATORY FLOW
9. 6MWD SIX MINUTE WALK DISTANCE
10. 6MWT SIX MINUTE WALK TEST
11. TB TUBERCULOSIS
12. RNTCP REVISED NATIONAL TUBERCULOSISCONTROL PROGRAMME
1
INTRODUCTION
Tuberculosis (TB) is an overall major public health problem in the
world. Around one fourth of the global burden is contributed by India. The
incidence of tuberculosis in India is 28 lakhs and the mortality is 4.8 lakhs
in 2015 [1].
Tuberculosis is a highly contagious disease that is caused by
Mycobacterium tuberculosis bacteria. Mycobacterium tuberculosis spreads
easily from one person to another through the airborne spread of the
droplet nuclei.
Even with adequate treatment with anti tuberculosis drugs the
process of healing results in a variety of sequelae like fibrosis, cavitations,
bronchiectasis, bulla and calcification [2-4]. This can lead to various
symptoms and altered pulmonary function. These patients usually present
with symptoms like dyspnea, cough with production of sputum, wheeze,
fever and hemoptysis.
At present the functional impairment due to the various tuberculous
sequelae is studied with tests like the six minute walk test or the shuttle
walk test. The pulmonary functional status is measured with the
spirometry. These tests help to determine the severity of the impairment
and to assess the quality of life in these patients. These tests also help in

2
planning the pulmonary rehabilitation for these patients which could
increase the quality of life.
TB leads to poor ventilation and impaired gas exchange and an
overall decrease in functional status.
The six-minute walk test more or less reflects the ability of the
patients to perform their daily life activities than the laboratory tests, and it
is also well tolerated by majority of the patients. Smoking has been proved
to cause a decrease in lung function by many numbers of mechanisms.
Smoking is a predominant risk factor that affects particularly the
respiratory and cardiovascular systems leading to many respiratory
disorders or it may aggravate the respiratory symptoms. This study is done
to find if there is any significant relationship between the decreased lung
function or exercise capacity due to smoking in addition to the effects
caused by the tuberculosis sequelae. This information may be used to
explain the harm of smoking and to encourage the people to quit
smoking.

3
AIMS AND OBJECTIVES
AIM:
To compare the respiratory function among the treated pulmonary
tuberculosis patients with sequelae among smokers and non smokers.
OBJECTIVES:
1. To compare the spirometric values in treated pulmonary
tuberculosis patients among smokers and non-smokers.
2. To compare the six-minute walk distance in treated pulmonary
tuberculosis patients among smokers and non-smokers.
3. To assess the overall functional status in treated pulmonary
tuberculosis patients presenting with sequelae among smokers and
non-smokers.

4
REVIEW OF LITERATURE
EPIDEMIOLOGY:
Tuberculosis remains as the most important infectious disease that
produces a very high morbidity and mortality rates in our country.
TB BURDEN IN INDIA:
Tuberculosis was found to be the third leading cause of years of
life lost (YLLs) in India. The estimated incidence of TB (which is defined
as the number of new TB cases per year) is 2.8 million cases per 100000
population .The estimated death rate that is due to TB is 480,000. Around
5% of the TB cases are associated with co infection with Human
immunodeficiency virus.
This study is aimed to determine the lung function and the exercise
capacity of the patients who had been treated with anti tuberculosis drugs
and presenting with sequelae that were demonstrated by chest radiography
and now presenting with respiratory symptoms.
PATHOGENESIS AND PATHOPHYSIOLOGY OF
TUBERCULOSIS:
Mycobacterium tuberculosis is an airborne infection that is caused
by the inhalation of the acid fast tuberculosis bacilli. Airborne droplets of
size 5- 10 microns reach the alveoli and the alveolar macrophages try to
contain the infection. These cells produce a number of cytokines and
chemokines that leads to control of the infection. If the host defense is

5
impaired there may be a progression to active disease which is called
primary progressive tuberculosis. The pathogenesis of the disease depends
on the number and the virulence of the bacilli, immunity of the host.
Host defense factors:
1. The activated macrophage
2. The capacity to stop the replication of bacilli intracellularly and
creating an encouraging intracellular environment, into the
unfavorable environment of caseous tissue.
Factors favoring the bacillary growth:
1. The potential of the bacilli to multiply logarithmically inside the non
activated macrophages
2. The ability to multiply extracellularly within cavities.
The balance between the host defense factors and the virulence of the
bacilli leads to the fate of the lesion.

6
NATURAL COURSE OF TUBERCULOSIS:

7
POST TUBERCULOSIS SEQUELAE:
Post tuberculosis sequelae include various types of radiological
manifestations and involve the pulmonary parenchyma, airways,
pulmonary vasculature, pleura, and the mediastinum. According to KIM
et al the common findings in treated tuberculosis patients were
thin‑walled cavity, fibrosis, lung destruction or collapse, aspergillum,
bronchiectasis and bulla [3-6].
A mixed pattern is also commonly seen. So the functional
impairment that occurs due to post tuberculosis sequelae is due to the
sequence of these combined morphologic changes.
EFFECT OF SMOKING ON THE PATHOGENESIS OF
TUBERCULOSIS:
Tobacco smoke possesses a number of harmful substances which
may produce harmful effects on body. Tobacco smoke consists of about
more than 4000 identifiable compounds. The smoke is made of a fine
aerosol which contains particulate matters in the size range that gets
deposited in the airways and the alveoli.
The particles of smoke dust affect the function of respiratory
airways by different mechanisms. Tar in the smoke produces an irritant
effect on bronchial epithelium and destroys the cilia. Beedi smoke may be
more harmful since beedi is an unrefined form of tobacco when compared
to cigarettes.

8
Prolonged use of tobacco and other environmental pollutants affects
the clearance of the tracheo‑bronchial secretion, so the tuberculosis
bacilli escapes the normal host defense and reach the alveoli [7]. Smoking
alters the action of pulmonary alveolar surfactants[8]. Nicotine acts directly
on nicotine acetylcholine receptors that are present in the macrophages and
leads to decreased intracellular tumor necrosis factor and thereby
ineffective killing of M. tuberculosis [9]. A lot of studies have showed the
association between smoking and tuberculosis infection, and increased
mortality [10-14].
Deepti Rathee et al studied a total of 101 patients. Among them
about 53 patients were smokers and 48 were non smokers. 93.30% of
nonsmokers showed complete clearance of the infiltrates in chest X ray
and only 80% of smokers had complete clearance at the end of treatment.
At the end of treatment, complete radiological clearance of cavity
was observed in 91.1% nonsmokers and incomplete clearance of cavity
was seen in 80% of the smokers and 70% of the former smokers. This data
implies that smokers and the former smokers have persistence of cavitation
as sequelae in X‑ray after completion of treatment as compared to
nonsmokers [15].

9
The common radiological pattern includes
1. Fibrosis
2. Cavitation
3. Bronchiectasis
4. Calcification
5. Bulla
6. Collapse /destroyed lung
7. Combined lesions
Fig -1
Chest x ray showing left destroyed lung
Heterogenous opacity of the left hemithorax with tracheal and mediastinal
shift .The right lung shows compensatory overinflation.

10
Fig -2
Chest x ray showing fibrocavity
Fig -3
Chest x ray showing aspergilloma
Chest x ray shows monad sign in the right upper zone characteristic of
fungal ball.

11
Fig -4
Chest x ray showing cavity
Fig -5
Chest x ray showing bronchiectasis

12
Fig -7
Chest x ray showing bulla
Fig -8
Chest x ray showing fibrosis

13
Collapsed or destroyed lung may be visualized as loss of lung
volume of the affected side, higher location of the hemi diaphragm,
retraction of the hilum and displacement of the trachea and mediastinal
structures.
Cavity is usually thin walled. It may contain internal opacity with air
crescent sign that is a common sign seen in aspergilloma. Aspergillus
fumigatus is the most common fungus to colonize the remnant tuberculous
cavities in the lung. It also produces hemoptysis.
Pulmonary cavitation may cause alteration in the structure of the
airways, and leads to airflow obstruction.
Bronchiectasis is the permanent dilatation and destruction of the
airways. It presents clinically as persistent cough with the production of
copious amount of sputum, it may also present as repeated episodes of
hemoptysis. Bronchiectasis also serves as a risk factor of pneumonia.
Bronchiectasis most commonly appears as small cystic lesions or
ring shadows. Destruction of elastic and muscular components of the
bronchial wall results in bronchiectasis, which is associated with airflow
obstruction [16]. Bronchiectasis usually produce obstructive pattern in
spirometry.

14
IMMUNOLOGY IN TUBERCULOSIS:
This may also be due to the altered regulation of macrophages.
Macrophages are involved in killing the tuberculous bacilli and leads to
containment of infection in a site. It also plays a role in the wound healing
and resolution and also plays a major role in the remodeling that produces
chronic airflow obstruction. Uninhibited Matrix metalloproteinase’s
expression and activity may leads to the destruction of lung tissue.
The immune system of the host is activated and it helps in
granuloma formation [17. A granuloma in tuberculosis contains a caseous
necrotic central core that is surrounded by a collection of cells like
macrophages, neutrophils, natural killer cells and T- and B-cells [17-19]. A
granuloma is a collection of a various types of inflammatory cells. It also
acts as active site of many enzymes like the proteases. The structure of the
granuloma consists of a central core that is made of macrophages that is
surrounded by lymphocytes. The macrophages on activation enlarge and
the margins become irregular to form a continuous sheet. These cells are
called epithelioid cells and the granuloma is now described as an
epithelioid cell granuloma. Epithelioid cells join to form the
multinucleated giant cells. In these giant cells the nuclei are arranged
predominantly along the periphery, which forms a rosette around the
central cytoplasm. These cells are called as the Langhans’ type of

15
giant cells. During the progression of the disease, the granuloma undergoes
caseation to form a caseation necrosis . It indicates permanent destruction
of the tissue. Inside the caseum the low oxygen tension,acidic status and
accumulation of the fatty acids inhibit multiplication of the bacilli. The fate
of the caseous foci differs in the hosts. It may organize completely and
turns into a fibrous scar or it may become calcified or ossified. It can
liquefy and leads to cavitation. Liquefaction occurs due to release of
proteolytic enzymes from neutrophils and macrophages.
STAGES OF PULMONARY TUBERCULOSIS:
There are Five Stages of Pulmonary Tuberculosis [20, 21].
Stage 1- Stage of no bacillary growth
The pathogenic TB bacilli are normally destroyed or inhibited by the
alveolar macrophages by phagocytosis.
Stage 2- Symbiotic stage
The bacilli multiply logarithmically inside the immature non
activated macrophages. The lesion, is now termed as tubercle.
Stage 3 - Stage of caseous necrosis
The growth of the bacilli is kept in check by the host immune
response to the antigens released by the bacilli.
Stage 4 – Stage of Cell-Mediated Immunity
If the cell mediated immunity is poor the bacilli escapes from the
periphery of the caseous necrosis and multiplies. The cytotoxic delayed

16
hypersensitivity immune response kills the macrophages, and leads to the
progression of the disease. If the cell mediated immunity is good the
activated macrophages engulf and destroy the escaping bacilli and arrest
the lesions development at a subclinical stage.
Stage 5- Stage of liquefaction
The bacilli destroy the tissues and causes necrosis of the bronchial
wall which ruptures, and forms a cavity.
The most common symptoms that were encountered by the patients are
1. Cough
2. Breathlessness
3. Sputum production
4. Chest pain
5. Hemoptysis
6. Wheeze
Structural changes in the lung that occurs due to abnormal lung tissue
repair like fibrotic bands, distortion of the bronchovascular structures and
pleural thickening [16, 24] may result in airflow restriction in TB patients.
The infection with the tubercular bacilli results in the release of various
inflammatory mediators like the cytokines and chemokines that result in a
variety of structural alteration of the airways and the parenchyma.

17
The inflammatory mediators and their consequent sequence are
explained in the following figure.
The major inflammatory mediators include
Tumour necrosis factor – alpha
Interleukin-1 beta
Interleukin-6
Interleukin-12
Interleukin-18
Interferon-gamma
Matrix metalloproteinase

18
ROLE OF INFLAMMATORY MEDIATORS IN TUBERCULOSIS:
19
Risk factors for development of sequelae:
1. Extensive involvement of the lungs
2. Delayed diagnosis
3. Inadequate treatment
4. Immuno compromised states like HIV infection and chronic renal
failure
5. Smoking
6. Diabetes mellitus

20
SPIROMETRY
Types of spirometers
1. Flow-measurement devices
2. Volume-measurement devices
Flow-measurement devices:
This type of spirometer is used to measure the flow of the gas.They
produce signals in propotions to the gas flow, which is then converted into
volume .The flow is then divided into small time intervals usually in
seconds by the electronic software.
Subtypes:
1. Turbines
2. Pressure differential flow sensing
3. Pilot tube flow sensors spirometers
4. Hotwire anemometers
5. Ultrasonic sensors spirometers
Volume-measurement devices
Subtypes:
1. Water seal spirometer
2. Dry rolling seal spirometer
3. Bellows spirometer
Devices that were most frequently used in pulmonary function labs
are the pneumotachograph spirometer.

21
Spirometry is used to assess the functional status of the lung by
measuring the physiologic parameters like the forced vital capacity (FVC)
which is defined as the maximal volume of air that is forcefully exhaled
after a maximal inspiration, and forced expiratory volume in 1 second
(FEV1) which is the amount of air that is exhaled during the first second of
an FVC maneuver.
Both FVC and FEV1 are usually recorded in liters. Measuring these
values helps in identifying the airway obstruction. Small airway
obstruction can be identified earlier even before the development
significant clinical symptoms.

22
NORMAL FLOW VOLUME LOOP:
The flow volume loop is obtained by plotting the volume in x axis and
inspiratory and expiratory flows in the y axis.
The flow volume loop has two limbs inspiratory and expiratory limbs.

23
SPIROMERTY IN VARIOUS DISORDERS:

24
Parameters FEV1 FVC FEV1/FVC
Obstructive disorders Decreased Normal Decreased
Restrictive disorders Decreased Decreased Normal
Mixed disorders Decreased Decreased Decreased
EFFECT OF SMOKING ON SPIROMETRY:
These patients often have decreased quality of life due to functional
impairment[22].
Sunita Nighute and Abhijit Awari et al in their study among 100
healthy male subjects included 50 smokers and 50 non-smokers and
showed in smokers, 36.0 % had obstructive changes followed by restrictive
changes in 8.0 % and the mixed changes in 4 %. In the non-smokers group
98 % had normal spirometric results. All the pulmonary function
parameters such as FVC, FEV1, FEV/FVC, and PEF were notably reduced
in smokers.
They concluded that smokers had 18 times increased risk of having
impaired pulmonary functions when compared to non-smokers [25].
According to Bano et al smokers had 17.3 times increased risk of
having impaired pulmonary function when compared to non-smokers and
obstructive pulmonary impairment was the commonest in smoker [28 ,29].

25
Study of Boskabady et al in Iran also supports that smokers have increased
frequency of respiratory symptom like cough, wheezing and breathlessness
and reduced values in spirometry [31].
SPIROMETRY IN POST TUBERCULOSIS PATIENTS:
Several earlier studies had suggested a notable correlation between
tuberculosis sequelae and airflow limitation.
All type of defects like obstructive, restrictive, and mixed pattern
may be established in post tubercular patients.
The various mechanisms that cause the spirometry defects are
illustrated in the following figure.
MECHANISM OF SPIROMETIC ABNORMALITIES IN
TUBERCULOSIS SEQUELAE:

26
This diagram clearly explains the various mechanisms that lead to
obstruction and restriction.
Study by Ananya Panda et al was done among 101 patients who had
previous history of TB and chest X ray with sequelae. Among the total 101
patients, nonsmokers were 77/101 (76.2%) and 24/101 (23.7%) patients
were smokers. Among them twenty three patients were found to have
normal spirometric values without any defect. The most common
abnormality observed was restrictive defect, that was present in 40/101
(39.6%) patients, followed next by a mixed restrictive and obstructive
defect (34.7%). Purely obstructive defect was found only in 3 patients [31].
Study by Mohamed Manji et al study showed abnormal lung function in
371 (74 %) patients. Out of them 210 (42 %) patients had obstructive
pattern, restrictive pattern was seen in 65 (13 %) patients and 96 (19 %)
patients had mixed pattern. Recurrent TB was associated with abnormal
lung function [33].
Sivaranjini S et al, in her study reported lower average of 6 minute walk
distance in post TB sequelae subjects than the normal population [33]. She
compared the 6 minute walk distance in sixty patients with tuberculosis
sequelae and 60 people from the normal population. The result showed that
the TB sequelae study group had a lower average six minute walk distance.
Exercise hypoxia may have lead to the decreased 6MWD noted in the TB
sequelae group [34].

27
Rajasekaran S et al., described the occurrence of post-TB asthma in
50.9% of patients within one year of completing the anti tubercular drugs
[41]. Krishna K et al., mentioned that obstruction was the most common
impairment in his of follow up study [42].
Meyyappan D, et al reported that mixed (39%) pattern was the most
common abnormality in spirometry followed by obstruction (24%) and
restriction (18%). In his study conducted in the Institute of Thoracic
Medicine, Chennai, 98% of the patients had impaired exercise capacity.
About 41.5% had mild impairment; moderate impairment was seen in
39.5% and severe impairment in 17%. The pulmonary function
abnormalities correlated positively with the radiological severity [48].
Singh B, et al studied the spirometric values in 48 patients and pointed out
that all the three forms of pulmonary function impairment were observed
in the study group, but obstructive pattern was the dominant type than
other types[49].
Agarwala A et al had done a cross-sectional study in Medinipore Medical
College among 72 patients who had post tubercular fibrosis. In his study,
thirtyeight patients (52.7%) had an obstructive ventilatory defect, ten
patients (13.8%) had a restrictive pattern and 12 patients (16.6%) revealed
a mixed obstructive and restrictive pattern. 16.6%). Lung function was
normal only in 12 patients (16.6%) [50].

28
AvradipSantra et al studied a total of 138 patients. Dyspnea was the
predominant symptom which was observed in 95.65% cases followed by
cough in 89.85% cases and expectoration in 75.36% of patients. A positive
correlation was found between the extent of the radiologic lesion and the
severity of airflow obstruction. Obstructive pattern was seen in 27.54%
patients and 72.46% patients showed mixed pattern [46].
Thus many studies done earlier in post tuberculosis patients show
the association of airflow limitation to the radiological lesions.
Tuberculosis is considered as the major risk factor for the development of
obstructive lung disease.

29
FACTORS AFFECTING THE OUTCOME OF LUNG FUNCTION
IN TREATED PTB PATIENTS:

30
Gender:
The impairment of lung function is found to be greater among the
males when compared to females. This may be due to the increased
smoking habit and occupational exposure to various substances that
typically affects the respiratory system.
Number of TB episodes:
The extent of radiological lesions was more in previously treated
patients. The severity of obstruction or restriction pattern was greater and
is directly related to the number of TB episodes.
Extent of disease in radiology:
Ananya Panda et al studied the correlation between the findings in
radiography and pulmonary function tests in pulmonary tuberculosis
sequelae patients and showed a significant correlation between the grades
of dyspnea and lesions like fibrosis , bronchiectasis etc . Restrictive defect
was the more prevalent finding that was found in 39.6% followed the by
mixed defect in 34.7%.
Dhipu Mathew et al in her study among a total of 75 treated
pulmonary tuberculosis patients observed that the most common symptom
was breathlessness. Chest x ray with involvement of 1 or 2 zones were
seen in 40 (53.3%) and 3 and more zones involvement were in 35
(46.7%). About 51 (68%) showed a restrictive pattern, 10 (13.3%) showed
an obstructive pattern and 14 (18.7%) revealed a mixed pattern in

31
spirometry [51].Thus many studies have demonstrated the inverse
relationships between the the lung function and the extent of the lung
involved.
SIX MINUTE WALK TEST:
The 6MWT is an easy, feasible test that can be conducted without
any special equipment even in the peripheral centers. There is no need for
specific training for the technicians.
Walking is a day to day simple activity and difficulty or decreased
walking capacity implies the degree of impaired functional status of the
patient. 6MWT is a better index of the patient’s ability to carry out the
daily activities [54].
Indications:
The major indication for six minute walk test is to evaluate the
effectiveness of medical interventions in patients with lung disease. It is
also used in measuring the one- time extent of the functional status of
patients, and also serves as the predictor of morbidity and mortality.
This test measures the distance that can be walked quickly by a
patient on a level, hard surface in 6 minutes duration. It assesses the
simultaneous responses of all the various system that were involved during
the period of exercise like the pulmonary and cardiovascular systems,
systemic circulation and muscle metabolism [54].

32
Six minute walk test is the commonly conducted test for the
evaluation of preoperative and postoperative functional status. It can also
be used for the assessment of the response to the therapeutic
interventions for pulmonary and cardiac diseases [54].

33
MATERIALS AND METHODS
The present study was carried out in the Department of Thoracic
Medicine, Tirunelveli Medical College Hospital, Tirunelveli after the
approval from the Ethical Committee of the Tirunelveli medical college.
STUDY DESIGN:
Prospective cross sectional study
STUDY DURATION:
Eighteen months
STUDY POPULATION:
The patients included in the study were selected from our
department outpatient population. These patients were selected by the
following inclusion and exclusion criteria
INCLUSION CRITERIA:
1. Patients who were previously treated as sputum positive tuberculosis
and completed treatment according to the guidelines of RNTCP
2. Sputum smears for AFB negative at present
3. Chest x ray showing tuberculosis sequelae
EXCLUSION CRITERIA:
1. Patients with BP more than 180/120 mm Hg
2. Resting heart rate more than 120/min
3. Patients with chest pain

34
4. Patients with vascular/musculoskeletal abnormalities in lower
extremities.
5. Patients with respiratory failure
6. History of cardiac or abdominal surgery within six months
CONSENT:
A detailed written informed consent from all the participants was
obtained after clearly explaining the purpose of the study.
HARM AND BENEFIT:
The study causes no harm to the participants. Some may have
dizziness or breathlessness during the spirometry procedure, but it is rare.
The indirect benefit includes awareness about their current status and to
plan for the rehabilitation to improve the quality of their life.
RESEARCH VARIABLES STUDIED:
A. Independent variables
1. Age
2. Sex
B. Dependent variables
1. Smoking
2. Spirometry
3. Distance walked in 6 minutes
4. Body mass index

35
MATERIALS USED IN THE STUDY
Consent form
Computerized spirometer
Disposable mouth pieces
Stop watch
Sphygmomanometer
Measure tape
Chalk
Pulse oximeter
METHODOLOGY:
Informed written consent is obtained from all the patients included
in the study. Detailed history of the patients was obtained regarding the
symptoms, previous anti tubercular treatment history, smoking history.
Spirometry and six minute walk test were conducted in the same day.
Patients were grouped into two groups as smokers and non smokers.
Severity of smoking was assessed using ‘Smoking Index’ (SI). It is
defined the number of beedi or cigarettes smoked per day that is multiplied
by duration of smoking in years. Smokers were categorized as
Mild smokers (SI<100)
Moderate smokers (SI=100-300)
Heavy smokers (SI>300) [53].

36
BMI:
The height of all the participants was measured in centimeters and
weight was recorded in kilograms. BMI is calculated based on the NICE
guidelines.
BMI(kg/m2) CATEGORIES
< 18.5 Underweight
18.5-24.9 Good
25.0-29.9 Overweight
>30 Obese
ATT HISTORY:
Detailed history about the previous anti tubercular drugs which
includes the treatment duration , category of drug , sputum AFB status at
the starting of the treatment , private or government regimen were
obtained.
RADIOLOGICAL FINDINGS:
Chest X ray was taken for all the patients. The lung field is divided
into 6 zones. Space up to the lower border of second rib was considered as
the upper zone , Space up to the lower border fourth rib were considered

37
as the middle zone and the space below is considered as the lower zone
on both the sides .
SPIROMETRY:
Lung functions were measured with the Minispiro II winspiro PRO
5.7 spirometer. Disposable mouthpiece was used for each patient and was
discarded after every use. Spirometry was performed in the sitting posture.
The forced expiratory maneuvers were demonstrated to the participants in
local language. Pre and post bronchodilator spirometric maneuvers were
done for all the patients. The results were recorded as absolute volumes in
liters. The measurements included in the study were forced vital capacity
(FVC), forced expiratory volume in 1 second (FEV1), ratio of FEV1 and
FVC and peak expiratory flow rate.
The classification of the spirometric values as normal, obstructive,
restrictive and mixed was done based on the ratio of FEV1/FVCas
recommended by the American Thoracic Society [14] .The severity of
obstruction and restriction was classified based on the FEV1‑based criteria
recommended by the European Respiratory Society and the American
Thoracic Society [6].
1. Normal - FEV1/FVC ratio of >70% and an FVC of >80% predicted
2. Obstruction - airway obstruction was defined as an FEV1/FVC ratio
of <70% and an FVC of >80% predicted

38
3. Mixed combined defects- FVC of <80% predicted and an
FEV1/FVC ratio of <70%
4. Restriction -restrictive defects as an FEV1/FVC ratio of >70% with
an FVC of <80% predicted.
SEVERITY OF OBSTRUCTION:
Impression Predicted FEV1 %
Normal >80
Mild obstruction 70-79
Moderate obstruction 60-69
Moderately severe obstruction 50-59
Severe obstruction 35-49
Very severe obstruction <35

39
SEVERITY OF RESTRICTION:
Impression Predicted FVC %
Mild restriction 70-80
Moderate restriction 60-69
Moderately severe restriction 50-59
Severe restriction <50

40
6-MINUTE WALK TEST:
The test was carried out as cited by the American Thoracic Society
guideline.
o 30 meter long hospital corridor was selected and every meter
is marked by a line.
o Participants were explained about the use of the test and
were instructed to walk in their normal pace from one end to
the other end and to cover as much distance as possible during
the six minute time. Encouragement through words was not
done while the patient was walking and only the left over
duration was pointed out every minute.
o Participants were permitted to stop in case they developed any
symptoms like chest pain, giddiness or leg cramps.
o They were allowed to continue the walk if it was possible for
them. The distance covered was recorded at 2, 4, and 6
minutes.
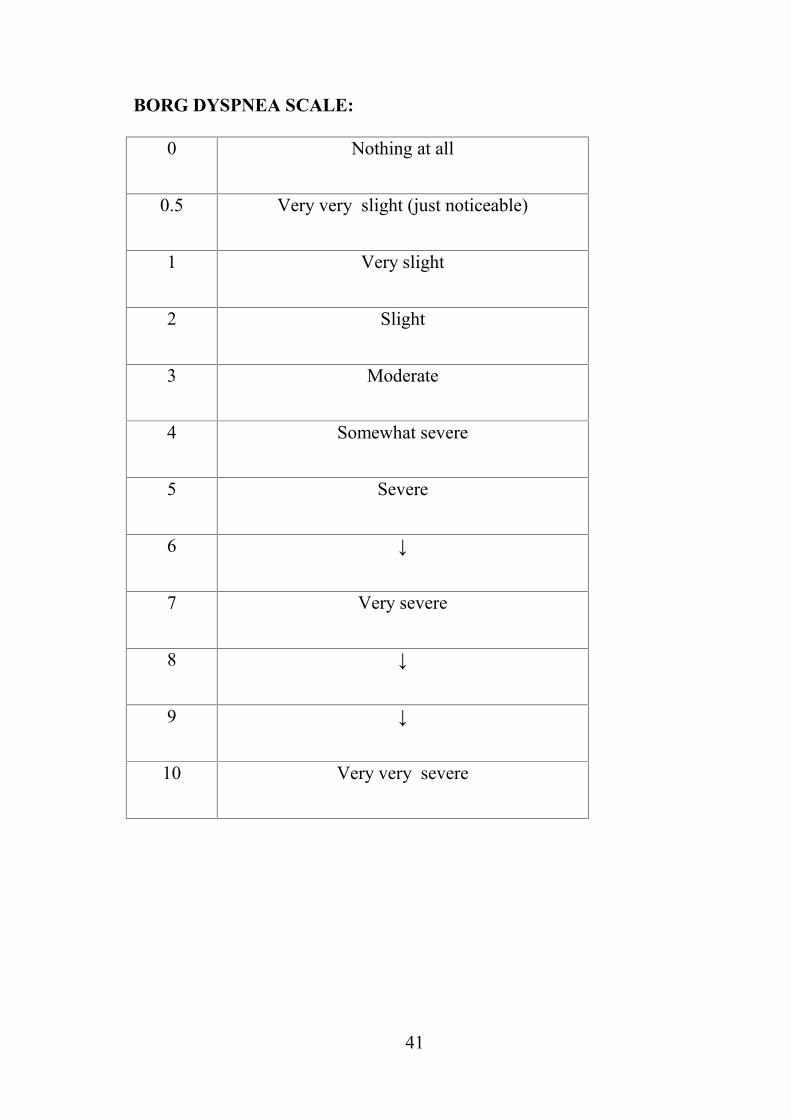
o Heart rate, blood pressure, oxygen saturation and Borg
dyspnea scale were recorded both before and after completion
of the test.
41
BORG DYSPNEA SCALE:
0 Nothing at all
0.5 Very very slight (just noticeable)
1 Very slight
2 Slight
3 Moderate
4 Somewhat severe
5 Severe
6 ↓
7 Very severe
8 ↓
9 ↓
10 Very very severe

42
DATA ANALYSIS:
The data’s were collected and statistical analysis was done using
SPSS software version12.0.

43
OBSERVATION AND RESULTS
AGE AND SEX DISTRIBUTION OF PATIENTS:
Among 100 patients included in the study, 45 were smokers and 55
were non smokers. Of them 79% of the patients (n= 79) were male and
21% of the patients (n= 21) were female.
They were classified into two group’s base on the smoking history.
Group I were smokers and group II were non smokers.
CHART -1: DISTRIBUTION OF PATIENTS:
45%
55%
DISTRIBUTION OF PATIENTS
Smokers Non Smokers

44
GROUP I:
Among patients in group I, all were males (n=45) and none of them
were female.
The mean age group of the patients was 57 years. About 7% (n= 3)
of the patients were in the age group of 31-40 years of age ,9%(n=4) of the
patients were in the age group of 41-50 years ,44 % (n= 20) of the
patients were in the age group of 51 – 60 years, 31 % (n=14) of the patients
were in the age group of 61 – 70 years of age and 9%(n=4) ) of the patients
were >70 years of age.
Group II:
Among patients in group II, thirty four patients (62%) were male
and twenty one patients (38 %) were female.
The mean age group of the patients was 51. About 5%(n=3) of the
patients were in the age group of 21-30 years of age, 15% (n= 8) of the
patients were in the age group of 31-40 years of age, 22% (n=12) of the
patients were in the age group of 41-50 years about 29% (n= 16) of the
patients were in the age group of 51 – 60 years. 25% (n=14) of the patients
were in the age group 61 – 70 years of age and 4% (n=2) of the patients
were >70 years of age.

45
CHART -2: AGE DISTRIBUTION OF THE PATIENTS
0
34
20
14
43
8
12
16
14
2
0
5
10
15
20
25
21-30 31-40 41-50 51-60 61-70 > 70
NO
.OF
PATI
ENTS
AGE DISTRIBUTION OF THE PATIENTS
Smokers Non smokers

46
SYMPTOMS OF PATIENTS:
The common symptoms that were observed among the post tuberculosis
sequelae patients include cough (86%), breathlessness (66%), sputum
production (66%) and hemoptysis in 6 % of patients. Breathlessness was
observed in more number of patients (91%) in group I.
CHART- 3: SYMPTOM PATTERNS AMONG THE TWO GROUPS
Cough Sputum Dyspnea Wheeze
43
3641
9
43
3025
5No
of P
atie
nts
Symptoms
SYMPTOM PATTERNS AMONG THE TWO GROUPSSmokers Non smokers

47
TABLE-1: DISTRIBUTION OF PATIENTS BY SMOKING INDEX:
SMOKING INDEX NUMBER OFPATIENTS
PERCENTAGE
<100 1 2
100 – 300 10 22
300 34 76
CHART-4: BMI STATUS OF THE PATIENTS AMONG THE TWO
GROUP
In non smokers group, 41 % (n=23) of the patients were in
underweight category, 41 % (n=23) of the patients were in normal and 18
% (n=9) were in overweight category.
In smokers group, 24% (n=11) patients were in underweight
category, 66% (n=30) in normal and 10% (n=4) were in overweight
category.
23 23
911
30
4
0
5
10
15
20
25
30
35
UNDER WT NORMAL OVERWEIGHT
Num
ber o
f Pat
ient
s
BODY MASS INDEX
NON SMOKERS
SMOKERS

48
Chart-5: DISTRIBUTION OF PATIENTS AMONG CAT I ANDCAT II ATT
Chart-6: SMOKING AND ATT CATEGORY AMONG THE TWOGROUPS
The chart explains that smoking leads to impaired healing process
and may increase the risk of failure or relapse thereby increasing the need
for number of treatment.
63
37%
NO.OF PATIENTS & CATEGORY OF ATT
CAT I CAT II
17
46
28
9
0
5
10
15
20
25
30
35
40
45
50
Smokers Non Smokers
No
of P
atie
nts
ATT CATEGORY
CAT I CAT II

49
TABLE-2: SMOKING AND ATT CATEGORY
CROSSTABULATION
SMOKING
ATT category
P valueCAT I CAT II
NON SMOKERS 46 9
<0.0001SMOKERS 17 28
About 28 patients among smokers group had category II ATT but only 9
patients among non smokers group had category II ATT. The difference is
statistically significant (P value l < 0.0001).

50
TABLE-3: COMPARISON OF CATEGORY OF ATT &
SPIROMETRY:
Parameter ATT N Mean
Std.
Deviation P value
FVC CAT I 63 2.20 0.54
<0.0001CAT II 37 1.78 0.53
FEV1 CAT I 63 1.63 0.46
<0.0001CAT II 37 1.04 0.44
FEV1_FVC CAT I 63 75.32 13.97
<0.0001CAT II 37 60.50 11.41
PEF CAT I 63 3.3694 1.27693
<0.0001CAT II 37 2.1122 1.14051
6 MWT
DISTANCE
CAT I 63 363.76 34.87
<0.0001CAT II 37 309.46 37.79
All the parameters of spirometry FVC, FEV1, FEV1/ FVC & PEF
were reduced in patients who had multiple treatments. The differences for
all the values were statistically significant (P < 0.0001).

51
COMPARISON OF CATEGORY OF ATT & DISTANCE WALKED:
The mean distance walked by patients with history of CAT I was 363.7 m
and the mean distance walked by patients with history of CAT II was
309.46 m (P < 0.0001).
CHART-7: COMPARISON OF CATEGORY OF ATT & DISTANCE
WALKED
0.00
50.00
100.00
150.00
200.00
250.00
300.00
350.00
400.00
CAT I
CAT II
363.76
309.46
Dist
ance
wal
ked
(m)

52
RADIOLOGICAL LESIONS AMONG GROUP I & II:
In our study smokers had a more number of bilateral lesions in
chest x ray 42 %( n=19) than non smokers group 9 % (n =5).
TABLE-4: COMPARISON OF SIDE INVOLMENT IN CHEST X
RAY IN BOTH GROUPS
UNILATERAL % BILATERAL %
SMOKERS 26 58 19 42
NON SMOKERS 50 91 5 9
CHART-8: DISRTIBUTION OF LESIONS IN SMOKERS GROUP
38%
62%
SMOKERS
UNILATERAL
BILATERAL

53
CHART-9: DISRTIBUTION OF LESIONS IN NON SMOKERS
GROUP
NON SMOKERS
UNILATERAL
BILATERAL

54
TABLE-5: COMPARISON OF RADIOLOGICAL LESIONS &
SPIROMETRY:
ParametersSide of
lesion
No.of
patients Mean
Std.
Deviation P value
FVC U/L 76 2.18 0.53
<0.0001B/L 24 1.62 0.49
FEV1 U/L 76 1.55 0.50
<0.0001
B/L
240.98 0.41
FEV1_FVC U/L 76 72.75 14.19
<0.0001B/L 24 60.63 13.39
PEF U/L 76 3.2228 1.31960
<0.0001B/L 24 1.8954 .97866
Distance
walked
U/L 76 358.47 33.51
<0.0001B/L 24 296.79 42.70
All the parameters of spirometry such as FVC, FEV1, FEV1/ FVC & PEF
were reduced in patients who had bilateral lung involvement in chest X ray
.The difference for all the values were statistically significant (P < 0.0001).

55
CHART-10: COMPARISON OF RADIOLOGICAL LEISONS & 6
MWT DISTANCE:
The mean distance walked by patients with unilateral lung
involvement was 358.47 meters and the mean distance walked by patients
with bilateral lung involvement was 296.79 meters. The difference is
statistically significant (P < 0.0001).
358.47
296.79
0.00
50.00
100.00
150.00
200.00
250.00
300.00
350.00
400.00
U/L B/L
DIST
ANCE
WAL
KED
(m)
SIDE OF THE LESION

56
CHART-11: CHEST X RAY PATTERNS AMONG SMOKERS AND
NON SMOKERS:
SMOKERS & ZONES INVOLVED:
In smokers group the number of patients with 1 zone involvement is
thirtynine (71 %), 2 zones involvement is fifteen (27%), 3 zones
involvement is one (1 %), none of the patients had involvement of 4 or
more zones.
In non smokers group the number of patients with 1 zone
involvement is eleven (24 %), 2 zones involvement is seventeen (37%), 3
zones involvement is ten (1 %) and seven (15 %) patients had involvement
of 4 or more zones.
34
0
9
24
15
32
6
14
48
28
0
10
20
30
40
50
60
FIBROSIS COLLAPSE CAVITATION BRONCHIECTASIS COMBINED
NONSMOKERS
SMOKERS

57
TABLE-6: DISTRIBUTION OF ZONAL INVOLVEMENT IN
RADIOLOGY AMONG SMOKERS AND NON SMOKERS:
NO.OF
ZONES
Group 1 Group 2
P value
Number Percentage Number Percentage
1 11 24 39 71 <0.0001
2 17 38 15 27 <0.0001
3 10 22 1 1 <0.0001
4 7 16 0 0 <0.0001

58
CHART-12: COMPARISON OF NUMBER OF ZONES INVOLVED
AMONG THE TWO GROUPS
The above diagram explains that the radiological extent of disease in
term of number of zones involved is greater among smokers than non
smokers (P < 0.0001).
0
5
10
15
20
25
30
35
40
1 2 3 4
11
17
107
39
15
1 0
SMOKERS
NON SMOKERS

59
TABLE-7: COMPARISON OF NUMBER OF ZONES
INVOLVED AMONG THE TWO GROUPS
Spirometryvalues
Number ofZones N Mean Std.
Deviation P value
FVC
1 50 2.23 0.54
<0.00012 32 2.09 0.463 11 1.58 0.514 7 1.28 0.32
FEV1
1 50 1.68 0.51
<0.00012 32 1.35 0.333 11 0.89 0.284 7 0.63 0.13
FEV1_FVC
1 50 78.17 13.34
<0.00012 32 64.95 10.743 11 57.75 11.434 7 51.66 5.07
PEF
1 50 3.5968 1.27311
<0.00012 32 2.6078 1.005863 11 1.6600 1.006494 7 1.2671 .45948
Distancewalked
1 50 370.84 29.29
<0.00012 32 338.34 24.513 11 287.82 32.184 7 261.71 29.93

60
CHART-13: COMPARISON OF NUMBER OF ZONES & 6 MWT
DISTANCE:
The mean distance walked by patients with four zones involvement
is 261. 71 m and the mean distance walked by patients with one zone
involvement were 370.84 meters. The difference is statistically significant
(P < 0.0001).
370.84338.34
287.82261.71
0.00
50.00
100.00
150.00
200.00
250.00
300.00
350.00
400.00
1.00 2.00 3.00 4.00

61
CHART-14: COMPARISON OF SPIROMETRY AMONG
SMOKERS & NON SMOKERS:
19 18
11
7
2
13
4
26
0
5
10
15
20
25
30
NORMAL OBSTRUCTION RESTRICTION MIXED
Num
ber o
f Pat
ient
s
NON SMOKERS
SMOKERS

62
CHART-15: PATTERN OF SPIROMETRY IN SMOKERS
In our study, the commonest spirometric pattern in smokers group was
mixed pattern.
Mixed pattern - 58% of patients (n= 26)
Obstructive pattern - 29 % of patients (n= 13)
Restrictive pattern - 9 % of patients (n= 4)
Normal - 4 % of patients (n=2)
PATTERN OF SPIROMETRY IN SMOKERS
Mixed
Obstruction
Restriction
Normal

63
CHART-16: PATTERN OF SPIROMETRY IN NON SMOKERS
Among non smokers group the distribution of the spirometric pattern was
as follows.
Normal pattern - 34% of patients (n= 19)
Obstructive pattern - 33% of patients (n= 18)
Restrictive pattern - 20% of patients (n= 11)
Mixed pattern -1 3% of patients (n= 7).
PATTERN OF SPIROMETRY IN NON SMOKERS
Mixed
Obstruction
Restriction
Normal

64
CHART-17:MEAN 6 MWT DISTANCE AMONG SMOKERS &
NON SMOKERS:
The mean distance walked by non smokers was 368.16 + 30.19
meters and the mean distance walked by smokers was 313.73+40.73
meters. The difference between the two groups is 54.43 meters (P <
0.0001).
0.0050.00
100.00150.00200.00
250.00
300.00
350.00
400.00
NON SMOKERSSMOKERS
368.16
313.73
DIST
ANCE
(M)

65
CHART-18: COMPARISON OF 6 MWT DISTANCE AMONG
SMOKERS & NON SMOKERS
In smokers group, 13% of patients walked in the range of 201-300
meters, 69 % of patients walked in the range of 301-400 meters and 8
patients discontinued the test due to breathlessness.
In non smokers group 3 % of patients walked in the range of 201-
300 meters, 85% % of patients walked in the range of 301-400 meters and
12 % of patients walked more than 500 meters.
05
101520253035404550
201-300 301-400 401-500
6
31
02
47
6
NO
.OF
PATI
ENTS
6 MINUTE WALK TEST DISTANCE(METERS)
SMOKERS
NON SMOKERS
66
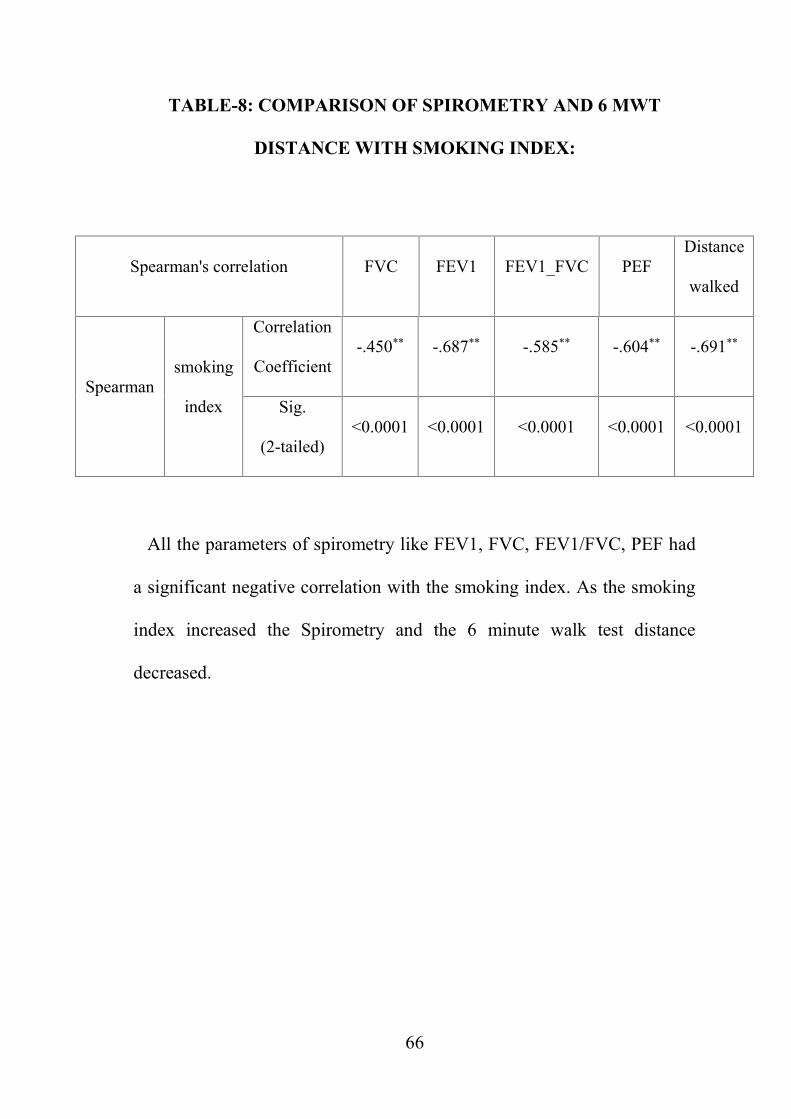
TABLE-8: COMPARISON OF SPIROMETRY AND 6 MWT
DISTANCE WITH SMOKING INDEX:
Spearman's correlation FVC FEV1 FEV1_FVC PEFDistance
walked
Spearmansmoking
index
Correlation
Coefficient-.450** -.687** -.585** -.604** -.691**
Sig.
(2-tailed)<0.0001 <0.0001 <0.0001 <0.0001 <0.0001
All the parameters of spirometry like FEV1, FVC, FEV1/FVC, PEF had
a significant negative correlation with the smoking index. As the smoking
index increased the Spirometry and the 6 minute walk test distance
decreased.

67
DISCUSSION
Pulmonary TB leads to various long term lung complications like
pulmonary fibrosis, bronchiectasis, aspergilloma, airway stenosis and
chronic airflow obstruction [70] and it has been also demonstrated as a risk
factor for lung cancer [71] . These sequelae often lead to complications like
recurrent respiratory infections , hemoptysis , pulmonary hypertension and
corpulmonale . They also affect the normal daily activities and results in
poor quality of life, increased financial burden and negative psychological
effects in these patients.
In our study a total of 100 patients were included and they were
categorized into two groups, group I – smokers (45%) and group II – non
smokers (55%). In smokers group none were female and in group II, 34
were male and 21 were females.
The most common age group observed was between 51 -60 years.
The mean age group of the patients was 51. About 29% (n= 16) of the
patients were in the age group of 51 – 60 years. 25% (n=14) of the patients
were in the age group of 61 – 70 years.
Among smokers group 1 patient was mild smokers, 10 were
moderate smokers and 34 were severe smokers.
Many studies that have been done earlier had demonstrated the link
between the pulmonary sequelae and the impaired lung function.

68
Based on literatures, the common symptoms of patients presenting with
sequelae include cough (90%) ,breathlessness (80%) and sputum
production (86%) , In our study most common symptoms that were
observed among the post tuberculosis sequelae patients includes cough
(86%) ,breathlessness (66%), sputum production (86%) .
In a similar prospective study conducted by Long R in 25 patients
with post TB sequelae, emphysematous change (36%), bronchiectasis
(40%), distortion of bronchi (56%), and fibrosis (64%) were present as
common type of radiological lesions. Structural changes and impairment
of lung function were more common in patients who had cavitary lesion
than in patients with the non-cavitary lesion [16]. In our study we observed
bronchiectasis (27%), fibrosis (25%) and combined lesions were observed
in 43% of patients.
Racilet al in his study showed that the residual radiological severity
score was more among smokers than non smokers. This is similar to our
study which shows a more number of lobe involvements in smokers group
[78].
In non smokers group the number of patients with 1 zone
involvement is thirty nine (71 %), 2 zones involvement is fifteen (27%), 3
zones involvement is one(1 %) and none of the patients had involvement
of 4 or more zones. In smokers group the number of patients with 1 zone

69
involvement is eleven (24 %), 2 zones involvement is seventeen (38%), 3
zones involvement is ten (22 %) and seven (16 %) patients had
involvement of 4 or more zones.
In our study 28 patients among smokers had category II ATT but
only 9 patients among non smokers had category II ATT. The difference is
statistically significant (P value less than 0.0001).
F.C. Di Naso et al in his study of functional evaluation in patients
with tuberculosis sequelae , concluded that the pulmonary function of the
patients in the group with multiple treatments (CAT II ATT ) showed
significant reductions in FVC and FEV1, when compared to the group with
only one treatment ( CAT I ATT). In patients with CAT II ATT, 75% of
patients had severe respiratory distress, compared to 13.3% of patients who
had CAT I ATT. Patients with CAT I ATT showed radiological
abnormalities with minimal involvement in 46.7% of cases and patients
with CAT II ATT had severe impairment in 83.7% of cases as evaluated
by radiography. Mixed ventilatory defects were more prevalent in the
group with multiple treatments [35].
This is similar to our study where patients with history of cat II ATT
had more number of lobes involved in the chest x ray and decreased
spirometric values.
70
Laxmankumar soni et al in his study of Impact of pulmonary
tuberculosis sequelae on functional status observed that patients with CAT
II ATT had lower values of FEV1 %, FVC% and FEV1/FVC. Patients
with CAT II ATT also showed greater functional impairment, as the
average distance walked in six minute walk test was 78.21 meter lesser
than patients with CAT I ATT. This suggests that multiple times treated
and cured TB patients suffer significantly more clinical, radiological and
functional abnormality when compared to single time treated patients [57].
SPIROMETRY:
In our study most common spirometric pattern was mixed pattern
(58%), followed by obstruction (29%). In smokers group the commonest
spirometric pattern was mixed pattern .It was observed in 58% of patients
( n= 26) followed by obstruction in 29 % of patients (n= 13) and
restriction in 9 % of patients (n= 4 ) and normal in 4 % of patients (n=2)
.Among non smokers group normal pattern was observed in 34% of
patients (n= 19 ) followed by obstruction in 33% of patients (n= 18)
restriction in 20% of patients (n= 11) and mixed pattern in 13% of
patients (n= 7) .
The difference is statistically significant (P value < 0.0001). According to
the spearman correlation smoking index has significant negative

71
correlation between spirometry and the distance walked (P value <
0.0001).
The findings were similar to the study conducted by Avradip
Santra et al in which obstructive pattern was established in 27.54% cases
and mixed pattern in72.46% [73].
Nimit V Khara et al in his study showedmixed ventilatory defects
in 47% , restrictive ventilatory defect in 37% , obstructive in 9 % [74]
Neeta Singh et al in their study among 51 multidrug resistant TB patients
who had completed the treatment showed that about 78% had persistent
respiratory symptoms, around 98% had residual lesions in radiology, and
96% demonstrated ventilatory defects. Among them 66% had mixed type
of ventilatory abnormality while 19% showed pure restriction and 11%
showed pure obstruction after completion of treatment [72].
The result was in contrast to the studies done by Bhola Singh et al,
verma et al and Abinash Agarwala et al .
Verma et al in their study among 92post PTB individuals found
restrictive pathology in 37 and mixed patterns in 21 patients [38].
Bhola Singh et al showed that obstructive defect (56.25%), was more
common than the other types and restrictive impairment was seen only in
10.42% of cases [49].

72
Manji et al demonstrated in their study, the presence of individual
patterns of impairment were 42%, 13%, and 19% for obstructive,
restrictive, and mixed patterns respectively [33].
Santhosh Kumar et al in his study of Evaluation of Pulmonary
Impairment by spirometry in post pulmonary tuberculosis patients showed
that obstructive pattern was seen in 37 patients (45.1%), restrictive pattern
in 21 patients (25.6%) and mixed pattern in 24 patients (29.3%).
Patil et al in his study of spirometry assessment of symptomatic
post TB cases observed that obstructive pattern was the predominant type
and was documented in 42% cases, mixed pattern in 14%, and normal
spirometry in 46% cases [81].
Many previous studies have showed a notable association of airflow
obstruction in post tubercular patients. In fact many studies have proved
that tuberculosis serves as an independent risks factor for the development
of obstructive pattern in spirometry.
The increased occurrence of mixed or obstructive pattern of
ventilator defect may be due to the dual effect on ventilation and perfusion
by the tubercular bacilli. In previously treated TB patients, the airways
were structurally abnormal which leads to reflex vasoconstriction and
hypoxemia. Also, the bacilli directly cause arteritis and thrombosis that
modifies perfusion. These patients also have other abnormalities like
pleural thickening, fibrosis of the parenchyma, and atelectasis which serves

73
as an additional factor for the predominant mixed pattern rather than the
pattern of pure airflow obstruction[4,16]
EFFECTS OF SMOKING IN PTB:
Nicotine turns off the Tumour Necrosis Factor-alpha (TNF-α) that
was usually produced by the lung macrophages, which leads to increased
lung structural abnormalities [77] .The mycobacterial antigens act as a co-
factor along with smoking and other environmental factors such as
biomass fuel or pollution, which leads to chronic airway inflammation that
results in bronchial narrowing with or without destruction of the
parenchyma. Smoking alters the normal host response and the chronic
inflammation may produce parenchymal tissue destruction and it also
impairs the normal repair and defense mechanisms leading to radiological
sequelae.
Due to the up regulation of different proteases like matrix
metalloproteinase and defective protease control mechanism there is
increased destruction of lung parenchyma that leads to airflow obstruction.
Matrix metalloproteinase also leads to cicatrisationof lung tissue and
fibrotic changes that were responsible for associated restrictive disorder.(76)
Anup Banur et al in his study on Effects of Smoking on Spirometry
concluded that the values of forced expiratory volumes like FVC, FEV1,
FEV1/FVC were lower in beedi smokers. The values of forced expiratory

74
volumes like PEFR and MEF75 were also lower in beedi smokers
compared to non smokers [82].
Similar observations were obtained in the studies by Padmavathy
KM and Bano R et al which showed that the obstructive lung changes
were most common in smokers than non smokers [28 ,83].
SIX MINUTE WALK TEST:
In our study out of 45 smokers, 8 patients stopped the six minute
walk test due to breathlessness and palpitation whereas none of the patients
stopped walking during the six minutes in non smokers group. The mean
distance walked by non smokers group were 368.16 + 30.19 meters and the
mean distance walked by the smokers group were 313.73+40.73 meters.
The difference between the 2 groups is 54.43 meters (P < 0.0001). The
mean distance walked by patients with unilateral lung involvement was
358.47 meters and the mean distance walked by patients with bilateral lung
involvement was 296.79 meters. The difference is 61.7 meters (P <
0.0001).
This is similar to the study done by S. Sivaranjini et al who showed
that 6 min walk test distance was significantly low among smokers [34].
Lakshmansoni et al in their study showed that there was a significant
functional impairment in post tuberculous sequelae patients and the
distance walked by them were significantly lower [79]. This finding
corresponds to our study.

75
Mikhail chushkin et al in their study proved that there was a
significant correlation between the 6MWT and the spirometry and the
symptoms [64] .This is agreed in our study.
Marcos DP et al in their study of functional assessment of patients
in drug resistant TB showed that the distance completed in six minute walk
test is lower in treated patients [85].
During the six minute walk test the myocardial oxygen demand of
the patient increases. In smokers there could be functional anemia due to
the increased levels of carbon monoxide that leads to decreased
cardiovascular response to exercise. Smoking is also believed to produce
harmful effects on peripheral muscles. All these effects result in decreased
exercise tolerance in smokers. Smoking itself is associated with lower
cardiovascular capacity and impaired cardiac response to exercise.

76
SUMMARY
Present study is conducted to compare the respiratory function of
treated tuberculosis patients among smokers and non smokers .
In our study most common spirometric pattern among the treated
patients was mixed pattern 58%, followed by obstruction (29%).
Among smokers the most common spirometric pattern was mixed
pattern in 58% followed by obstruction in 28 % and restriction in 8 % and
normal in 4 % (n=2).
Among non smokers normal pattern was observed in 34.5%
followed by obstruction in 33% restriction in 20% and mixed pattern in
13%.
The mean FEV1 among smokers is 1.09 and among non smokers is 1.68.
The difference between the 2 groups is statistically significant.
The mean distance walked by non smokers was 368.16 + 30.19
meters and the mean distance walked by smokers was 313.73+40.73
meters. The difference between the 2 groups is 54.43 meters (P < 0.0001).

77
CONCLUSION
1. Among post tuberculosis patients with sequelae, both the
spirometric values and the six minute walk distance were
significantly reduced in smokers when compared to non smokers.
2. In post tuberculosis patients presenting with sequelae both
spirometry and six minute walk test were helpful in assessing the
functional status and quality of life of the patients.
3. These tests may aid in planning for rehabilitation to decrease the
symptoms and improve the functional status in these patients.
4. Hence the importance of smoking cessation should be
emphasized in all the patients diagnosed with tuberculosis.

78
LIMITATIONS
Mixed disorders are difficult to diagnose based on spirometry alone.
Spirometry along with a lung volume study is needed for this. For
diagnosing a mixed pattern there should be a clear obstructive disorder in
spirometry, with low FEV 1 /FVC ratio. If the airflow obstruction is seen
along with a reduced TLC, then the reduced TLC will suggest an
additional restrictive disorder. In our study we used only spirometry to find
the restrictive disorder.

1
BIBILOGRAPHY
1. World Health Organisation. Global Tuberculosis Report 2017
Geneva: WHO; 2017.
2. Vecino M, Pasipanodya JG, Slocum P, Bae S, Munguia G, Miller T,
et al. Evidence for chronic lung impairment in patients treated for
pulmonarym tuberculosis. J Infect Public Health 2011;4:244‑52.
3. Kim HY, Song KS, Goo JM, Lee JS, Lee KS, Lim TH. Thoracic
sequelae and complications of tuberculosis. Radiographics
2001;21:839‑58.
4. Im JG, Itoh H, Shim YS, Lee JH, Ahn J, Han MC, et al.
Pulmonarytuberculosis: CT findings – Early active disease and
sequential change with antituberculous therapy. Radiology
1993;186:653‑60
5. Winer‑Muram HT, Rubin SA. Thoracic complications of
tuberculosis. J Thorac Imaging 1990;5:46‑63.
6. ATS Committee on Proficiency Standards for Clinical Pulmonary
Function Laboratories. ATS statement: Guidelines for the six‑minute
walk test. Am J Respir Crit Care Med 2002;166:111
7. Pierson T, Learmonth‑Pierson S, Pinto D, van Hoek ML. Cigarette
smoke extract induces differential expression levels of beta‑defensin
peptides in human alveolar epithelial cells. Tob Induc Dis 2013;11:10.

2
8. Domagala‑Kulawik J. Effects of cigarette smoke on the lung and
systemic immunity. J Physiol Pharmacol 2008;59 Suppl 6:19‑34.
9. Wang H, Yu M, Ochani M, Amella CA, Tanovic M, Susarla S, et al.
Nicotinic acetylcholine receptor alpha7 subunit is an essential
regulator of inflammation. Nature 2003;421:384‑8.
10.Lin HH, Ezzati M, Chang HY, Murray M. Association between
tobacco smoking and active tuberculosis in Taiwan: Prospective
cohort study Am J Respir Crit Care Med 2009;180:475‑80.
11.Jee SH, Golub JE, Jo J, Park IS, Ohrr H, Samet JM. Smoking and risk
of tuberculosis incidence, mortality and recurrence in South Korean
men and women. Am J Epidemiol 2009;170:1478‑85.
12.Agarwal A, Agrawal VK. Impact of tobacco smoke on tuberculosis:
A case control study. NJIRM 2011;2:38‑42
13.Leung CC, Yew WW, Chan CK, Chang KC, Law WS, Lee SN, et al.
Smoking adversely affects treatment response, outcome and relapse
in tuberculosis. Eur Respir J 2015;45:738
14.Prasad R, Suryakant, Garg R, Singhal S, Dawar R, Agarwal GG. A
case‑control study of tobacco smoking and tuberculosis in India. Ann
Thorac Med 2009;4:208
15.Rathee D, Arora P, Meena M, Sarin R, Chakraborty P, Jaiswal A, et
al. Comparative study of clinico-bacterioradiological profile and

3
treatment outcome of smokers and nonsmokers suffering from
pulmonary tuberculosis. Lung India 2016;33:507
16.Long R, Maycher B, Dhar A, et al. Pulmonary tuberculosis treated
with directly observed therapy: serial changes in lung structure and
function. Chest 1998; 113: 933–943.
17.Hunter RL. Pathology of post primary tuberculosis of the lung: an
illustrated critical review. Tuberculosis (Edinb) 2011; 91: 497–509.
18.Dorhoi A, Kaufmann SH. Pathology and immune reactivity:
understanding multidimensionality in pulmonary tuberculosis. Semin
Immunopathol 2016; 38: 153–166
19.Ramakrishnan L. Revisiting the role of the granuloma in tuberculosis.
Nat Rev Immunol 2012; 12: 352–366.
20.Lurie MB. Resistance to Tuberculosis: Experimental Studies in
Native and Acquired Defense Mechanisms. Cambridge, MA: Harvard
University Press; 1964.
21.Dannenberg AM Jr. Delayed-type hypersensitivity and cell-mediated
immunity in the pathogenesis of tuberculosis. Immunol.Today.
1991;12: 228–233.
22.Pasipanodya JG, McNabb SJ, Hilsenrath P, et al. Pulmonary
impairment after tuberculosis and its contribution to TB burden. BMC
Public Health 2010; 10: 259

4
23.Menezes AM, Hallal PC, Perez-Padilla R, et al. Tuberculosis and
airflow obstruction: evidence from the PLATINO study in Latin
America. Eur Respir J 2007; 30: 1180–1185.
24.Amaral AF, Coton S, Kato B, et al. Tuberculosis associates with both
airflow obstruction and low lung function: BOLD results. Eur Respir
J 2015; 46: 1104–1112.
25.Nighute s , Abhijit Awari, A Study of the Pulmonary Function Test
among Smokers and Non-smokers. Journal of Clinical and Diagnostic
Research. 2011 ; 1151-1153
26.Ravimohan S, Tamuhla N, Kung SJ, et al. Matrix metalloproteinases
in tuberculosis-immune reconstitution inflammatory syndrome and
impaired lung function among advanced HIV/TB co-infected patients
initiating antiretroviral therapy. EBioMedicine 2016; 3: 100–107.
27.Owen CA. Roles for proteinases in the pathogenesis of chronic
obstructive pulmonary disease. Int J Chron Obstruct Pulmon Dis
2008; 3: 253–268
28.Bano R, Mahagaonkar AM, Kulkarni NB, Ahmad N, Nighute S.
Study of pulmonary function tests among smokers and non smokers
in a rural area. Pravara Med Rev 2009; 1(1):11-6.
29.R. Bano, N. Ahmad, and A. M. Mahagaonkar, Walawalkar
International Medical Journal 2014; no 1, pp. 33–38.

5
30. M. H. Boskabady, M. Mahmoodinia, M. Boskabady, and G. R.
Heydari, Revista Portuguesa de Pneumologia 2011; 17, no. 5, pp.
199– 204.
31.Panda A, Bhalla AS, Sharma R, Mohan A, Sreenivas V, Kalaimannan
U, et al. Correlation of chest computed tomography findings with
dyspnea and lung functions in post tubercular sequelae. Lung India
2016; 33:592-9.
32. G. P. Maguire, N. M. Anstey et al .Pulmonary tuberculosis, impaired
lung function, disability and quality of life in a high-burden setting.
Int J Tuberc Lung Dis 2006; 10: 172–177.
33.Manji et al. Lung functions among patients with pulmonary
tuberculosis in Dar es Salaam – a cross-sectional study. BMC
Pulmonary Medicine 2016 : 16:58.
34.Sivaranjini S, Vanamail P, Eason J. Six minute walk test in people
with tuberculosis sequelae. Cardiopulm Phys Ther J. 2010; 21(3):5-
10.
35.Di Naso FC, Pereira JS, Schuh SJ, Unis G. Functional evaluation in
patients with [26]pulmonary tuberculosis sequelae. Rev Port
Pneumol. 2011; 17(5):216-21.
36.Hnizdo E, Singh T, Churchyard G. Chronic pulmonary function
impairment caused by initial and recurrent pulmonary tuberculosis
following treatment. Thorax. 2000; 55:32.

6
37.Lee JH, Chang JH. Lung function in patients with chronic airflow
obstruction due to tuberculous destroyed lung. Respir Med. 2003;
97:1237.
38.Verma SK, Narayan KV, Kumar S. A study on prevalence of
obstructive airway disease among post pulmonary tuberculosis
patients. Pulmon. 2009; 11:4-7.
39.Willcox PA, Ferguson AD. Chronic obstructive airways disease
following treated pulmonary tuberculosis. Respir Med. 1989; 83:195-
98.
40.Dheda K, Booth H, Huggett JF, Johnson MA, Zumla A, Rook GA.
Lung remodeling in pulmonary tuberculosis. J Infect Dis. 2005;
192:1201–09.
41.Rajasekaran S, Savithri S, Jeyaganesh D. Post-tuberculosis bronchial
asthma. Ind J Tub. 2001; 48:139-42.
42.Krishna K, Bond S, Artvinli M, Reid KDG, McHardy GJR, Crofton
JW. Pulmonary function in treated tuberculosis; a long term follow-
up. Am Rev Respir Dis. 1977; 115:402-04.
43.Baig IM, Saeed W, Khalil KF. Post-tuberculous chronic obstructive
pulmonary disease. J Coll Physicians Surg Pak. 2010; 20:542-44.
44.Ramos LM, Sulmonett N, Ferreira CS, Henriques JF, de Miranda SS.
Functional profile of patients with tuberculosis sequelae in a
university hospital. J Bras Pneumol. 2006; 32:43-7.

7
45.Visca D, DeLauretis A, Wells A, Montgomery A, Maher T, Veronica,
et al. Six-[11]minute-walk test parameters in the prognostic
evaluation of fibrotic lung diseases. Eur Respir J. 2014;44:P3742.
46.Avradip Santra1, PravatiDutta2, RekhaManjhi3, Sudarsan
Pothal.Clinico-radiologicac and spirometric profile of an Indian
population with post tuberculous obstructive airway diseases.J Clin
Diagn Res.2017 Mar:11(3):OC35-OC38.
47.Lam KB, Jiang CQ, Jordan RE, Miller MR, Zhang WS, Cheng KK,
et al. Prior TB, smoking, and airflow obstruction: a cross-sectional
analysis of the Guangzhou Biobank cohort study. Chest.
2010;137:593–600 .
48.Meyyappan D, Chockalingam P. Evaluation of respiratory
impairment and health related quality of life in pulmonary
tuberculosis sequelae patients. Int J Adv Med 2018;5:276-80.
49.Singh B, Chaudhry O.Trends of Pulmonary Impairment in persons
with treated pulmonary tuberculosis. Int J Med Res Prof; 2015, 1(1);
8-11.
50.Agarwala A, Maikap MK, Panchadhyayee P, Mandal P, Roy PP.
Chronic airway obstruction in post tubercular fibrosis cases: a serious
lung function changes. Int J Res Med Sci 2016;4:5294-6.

8
51.Dhipu Mathew, Kirthana G, Krishnapriya R, Srinivasan R. To assess
the pulmonary impairment in treated pulmonary tuberculosis patients
using spirometry. IAIM, 2016; 3(10): 94-99.
52.Davies PD, Yew WW, Ganguly D, Davidow AL, Reichman LB,
Dheda K, et al. Smoking and tuberculosis: the epidemiological
association and immunopathogenesis. Trans R Soc Trop MedHyg.
2006; 100:291-98.
53.Jindal SK, Malik SK. Smoking index - a measure to quantify
cumulative smoking exposure. Lung India. 1988; 6:195-96.
54.American Thoracic Society; American College of Chest Physicians.
ATS/ACCP Statement on cardiopulmonary exercise testing. Am J
Respir Crit Care Med. 2003 Jan 15; 167(2):211-77.
55.Seiscento M, Vargas FS, Antonangelo L, et al. Transforming growth
factor β-1 as a predictor of fibrosis in tuberculous pleurisy.
Respirology 2007; 12: 660–663.
56.Greenlee KJ, Werb Z, Kheradmand F. Matrix metalloproteinases in
lung: multiple, multifarious, and multifaceted. Physiol Rev 2007; 87:
69–98.
57.Lakshmankumar Soni, Hemant Borana, Gopal Purohit, C.R. Cho
udhary, Isha Garg, Srikant Agarwal, Lalit
Kumar Sharma, U. Narendra
57.European Respiratory Journal Sep 2016, 48 (suppl 60) PA2103.

9
58. Byrne AL, Marais BJ, Mitnick CD, Lecca L, Marks GB.
Tuberculosis and chronic respiratory disease: A systematic review. Int
J Infect Dis 2015; 32:138 - 46 .
59.Camarri B, Eastwood P, Cecins N, Thompson PJ, Jenkins S. Six
minute walk distance in healthy subjects aged 55–75 years. Respir
Med. 2006; 100:658-665.
60.Machida K, Maekura R. State of the art: sequelae of tuberculosis.
Kekkaku. 2005; 80(10):655-74.
61.K.Sailaja, H. Nagasreedhar Rao. Study of Pulmonary Function
Impairment By Spirometry in Post Pulmonary Tuberculosis. Journal
of Evolution of Medical and Dental science; 4, 7365- 7370
62. Kawashiro T. Evaluation of respiratory failure due to sequelae of
tuberculosis. Kekkaku. 2005; 80(6):491- 497
63.Rekha BVV , Ramachandran R , Rao KVK , Rahman F , Adhilakshmi
AR , Kalai- selvi D , et al. Assessment of long term status of sputum
positive pulmonary tb patients successfully treated with short course
chemotherapy. Indian J Tuberculosis; 2009; 56:132–40.
64.Mikhail chushkin,Oleg Nikolayevich ots .Impaired pulmonary
function after treatment for tuberculosis:the end of the disease?.J Bras
Pneumol.2017; 43(1):38-43.

10
65.Jordan Toni S, Spencer Elspeth M , Davies Peter . Tuberculosis,
bronchiectasis and chronic airflow obstruction. Respirology 2010;
15:623–8 .
66.Pellegrino R, Viegi G, Brusasco V, et al. Interpretative strategies for
lung function tests. Eur Respir J 2005; 26: 948–968.
67.Enfield K, Gammon S, Floyd J, Falt C, Patrie J, Platts-Mills TA, et al.
Six-minute walk distance in patients with severe end-stage COPD:
association with survival after inpatient pulmonary rehabilitation. J
Cardiopul Rehabil Prev. 2010; 30: 195–202.
68.Aydin O, Dursun AB, Kurt B, Aloglu V, Alpar S, Nazire Ucar N,
Sertkaya D. Correlation of functional and radiological findings of
lung in asymptomatic smokers. Turkish Respiratory Journal. 2008;
9(1): 15-9.
69.Hassan IS, Al‑Jandali HH. Obstructive airway disease in patients
with significant post TB lung scarring. Saudi Med J 2005; 26:1155‑
7.
70.Shah M , Reed C . Complications of tuberculosis. Curr Opin Infect
Dis 2014;27(5):403–10 .
71..Liang Hui–Ying , Li Xue–Lian , Yu Xiao–Song , Guan Peng , Yin
Zhi-Hua , He Qin–Cheng , et al. Facts and Fiction of the relationship

11
between preexisting tuberculosis and lung cancer risk: a systematic
review. Int J Cancer 2009; 125:2936–44.
72. Singla Neeta , Singla Rupak , Fernandes Sheron , Behera Digamber
. Post treat- ment sequelae of multidrug resistant tuberculosis patients.
Indian J Tuberc 2009;56(4):206–12 .
73. Nimit V khara, Bhavesh M Patel, Ravish M Kshatriya, Satish N
Patel, rajiv p paliwal. Post tb pulmonary disability: an ongoing
Challenge for india. National journal of medical research
njmr│volume 6│issue 3│july –sep 2016; 247 – 249.
74.Guilani A, Bhalotra B, Parakh U, Jain N. Even asymptomatic patients
may have serious lung impairment after successful TB treatment. Am
J Respir Crit Care Med 2014; 189:A3203.
75.MP Swathi Karanth and Nilkanth Tukaram Awad, Six Minute Walk
Test: A Tool for Predicting Mortality in Chronic Pulmonary Diseases
Pulmonary functions : journal of clinical and diagnostic research.
2017 : OC34-OC38 .
76.Dheda K, Booth H, Huggett JF, Johnson MA, Zumla A, Rook GA.
Lung remodeling in pulmonary tuberculosis. J Infect Dis. 2005;
192:1201–09.
77.Heni Retnowulan , Deddy Nur Wachid Achadiono , Anggraeni Ayu
Rengganis et al The Relationship between Six Minutes Walking
Distance and Quality of Life in Pulmonary Tuberculosis Sequelae

12
Patients: Acta Interna The Journal of Internal Medicine Vol. 6 No. 2
December 2016.
78.Racil H, Amar JB, Cheikrouhou S, Hassine E, Zarrouk M, Chaouch
N, et al. Pulmonary tuberculosis in smokers. Presse Med 2010;39:e25
‑8
79.Patil S, Patil R, Jadhav A. Pulmonary functions’ assessment in post-
tuberculosis cases by spirometry: Obstructive pattern is predominant
and needs cautious evaluation in all treated cases irrespective of
symptoms. Int J Mycobacterial 2018;7:128-33.
80.Anup Banur1, Antonio Lamartine Dacosta1, Maria Pinto Joao
Wiseman1, Sudhir Chaudhri. IOSR Journal of Dental and Medical
Sciences (IOSR-JDMS) e-ISSN: 2279-0853, p-ISSN: 2279-
0861.Volume 15, Issue 12 Ver. XI (December. 2016), PP 48-54.
81.Padmavathy KM. Comparative study of pulmonary function variables
in relation to type of smoking. Indian J Physiol Pharmacol; 2008;
52(2): 193-6
82.Guo, N, Marra, F & Marra, CA 2009. ‘Measuring health related
quality oflife in tuberculosis: a systematic review’, Health and Quality
of Life Outcomes, 7(14): 11.
83.Marcos DP Godoy, Fernanda CQ Mello,Agnaldo J Lopes ,The
functional assessment of patients with pulmonary multidrug resistant
tuberculosis.Respiratory care 2012 Vol 57 No 11.

13
PROFOMA
Name : Age/sex
Address :
Occupation :
Contact number :
Height : cm Weight : kg BMI:
PRESENTING SYMPTOMS:
1. Cough 4. Chest pain2. Sputum production 5. Hemoptysis3. Breathlessness 6. Wheeze
COMORBIDITIES :
1. Diabetes 2.Hypertension
SMOKING HISTORY :
Beedi / Cigerrete :
Smoking index :
PRIOR ATT HISTORY :
CAT I / CAT II
ECG :
Chest X RAY :
Number of zones involved :
Unilateral / Bilateral :
PATTERNS IN CHEST X RAY :
1. Fibrosis2. Fibrocavity

14
3. Bronchiectasis4. Calcification5. Bulla6. Aspergilloma7. Combined
SPIROMETRY
PARAMETERS PREDICTED PRESENT %PREDICTED
FEV1
FVC
FEV1/FVC
PEFR
IMPRESSION :
SIX MINUTE WALK TEST:
REASON FOR DISCONTINUATION:
PARAMETERS PRE TEST POST TEST
SPO2
HEART RATE
BLOOD PRESSURE
BORG SCALE OF DYSPNEA

xg;Gjy; gbtk;
நா காசேநா ம எ ணமா ேட . த ேபா
அத ெதாட யாக என ைர ர பா உ ள எ பைத அதைன
க பத காக ைர ர ெசய ற ப ேசாதைன 6 ட நைடப
ேசாதைன ெச ெகா ள ச மத எ பைத ெத ெகா ேற .
இதனா எ த ப க ைள க இ ைல எ பைத ம வ ல
அ ேத .
இ ப

PROFOMA
Name : Age/sex
Address :
Occupation :
Contact number :
Height : cm Weight : kg BMI:
PRESENTING SYMPTOMS:
1. Cough 4. Chest pain2. Sputum production 5. Hemoptysis3. Breathlessness 6. Wheeze
COMORBIDITIES :
1. Diabetes 2.Hypertension
SMOKING HISTORY :
Beedi / Cigerrete :
Smoking index :
PRIOR ATT HISTORY :
CAT I / CAT II
ECG :
Chest X RAY :
Number of zones involved :
Unilateral / Bilateral :
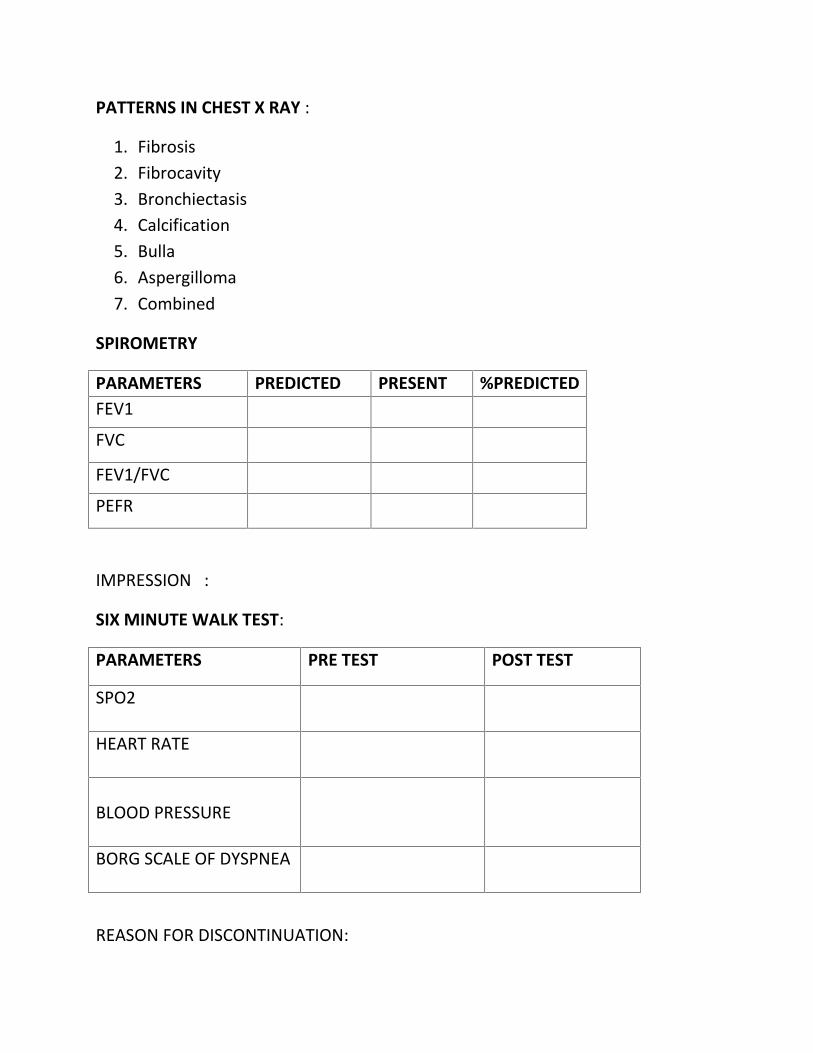
PATTERNS IN CHEST X RAY :
1. Fibrosis2. Fibrocavity3. Bronchiectasis4. Calcification5. Bulla6. Aspergilloma7. Combined
SPIROMETRY
PARAMETERS PREDICTED PRESENT %PREDICTEDFEV1
FVC
FEV1/FVC
PEFR
IMPRESSION :
SIX MINUTE WALK TEST:
REASON FOR DISCONTINUATION:
PARAMETERS PRE TEST POST TEST
SPO2
HEART RATE
BLOOD PRESSURE
BORG SCALE OF DYSPNEA

ATT
Ganesan 63 M 159 73 28.8 Y 30 BEEDI 10 300 N N N Y N N N Y 1 2.28 1.42 62.3 2.25Sankaran 64 M 165 65 23.8 Y 20 BEEDI 20 200 N N N Y N N Y N 1 2.72 2.26 83.1 3.53 NORMALMurugan 56 M 168 46 16.3 Y 25 BEEDI 30 750 Y N N Y Y N N N 2 0.96 0.48 50 1.52 MIXED
Madasamy 40 M 145 38 18.07 Y 15 BEEDI 20 300 Y Y N N N N N N 2 1.06 0.66 62.3 1.01 MIXEDChidambaram 53 M 159 46 18.2 Y 20 BEEDI 6 120 Y Y N Y Y N N N 1 1.81 1.3 71.8 2.78 RESTRICTIONArunachalam 40 M 159 65 25.7 Y 30 BEEDI 12 420 Y Y N Y N N N N 1 2.12 1.35 63.7 2.42 MIXED
Mayandi 66 M 159 68 26.9 Y 46 BEEDI 30 1380 Y Y N Y N N Y N 2 1.53 0.86 56.2 1.36 MIXEDSamuthiram 60 M 168 46 14.8 Y 40 BEEDI 20 800 Y Y N Y N N N N 2 1.36 0.73 53.7 1.84 MIXEDShanmugavel 53 M 160 56 21.8 Y 48 BOTH 22 1056 Y Y N Y N N N N 2 1.48 0.85 57.4 1.76 MIXED
Ramachandran 77 M 164 58 21.5 Y 50 BOTH 20 1000 Y Y N Y N N Y N 1 1.78 1.26 68.8 1.76 MIXEDVelayutham 67 M 160 54 21.09 Y 37 BEEDI 20 740 Y Y N Y N N N N 2 1.45 0.91 62.8 1.25 MIXEDChellappandi 67 M 145 45 21.4 Y 55 BEEDI 10 550 Y Y N Y Y N N N 2 1.01 0.69 68.3 0.93 MIXED
Anbalagan 53 M 160 80 31.2 Y 30 BEEDI 14 420 Y N N Y N N N N 2 1.96 1.60. 81.6 3.67 RESTRICTIONparamasivam 64 M 164 65 21.1 Y 30 BEEDI 10 300 Y N N N Y N N N 1 2.33 1.54 66.1 3.28 OBSTRUCTION
Anburaj 39 M 164 50 18.6 Y 7 BEEDI 14 98 Y Y N Y N N N N 2 2.68 2.18 81.3 5.59 RESTRICTIONKaruppasamy 57 M 158 47 18.8 Y 37 BEEDI 10 370 Y Y N Y N N N N 2 1.68 1.28 76.2 2.84 MIXED
Arasappan 77 M 164 59 21.9 Y 35 BEEDI 14 490 Y N N Y N N N N 2 2.03 1.01 49.8 1.47 OBSTRUCTIONAntony 57 M 155 43 17.9 Y 20 BEEDI 25 500 Y Y N Y Y N N N 1 1.44 0.89 61.8 1.11 MIXEDChelliah 57 M 155 45 18.7 Y 37 BEEDI 10 370 Y Y N Y N Y N N 1 1.82 1.16 63.7 1.94 OBSTRUCTION
Anthony samy 55 M 168 70 24.8 Y 20 CIGERRETE 28 560 Y Y N Y N N Y N 1 2.45 1.25 51 1.69 MIXEDThangappan 61 M 165 48 17.6 Y 30 BEEDI 20 600 Y Y N Y N N N N 2 1.7 1.22 71.8 2.89 MIXEDNarayanan 60 M 150 54 24 Y 40 BEEDI 12 480 Y Y N Y Y N N N 1 1.67 1.02 61.1 2.54 OBSTRUCTION
Paramasivam 35 M 166 48 17.4 Y 10 BOTH 14 140 Y Y N Y N N N N 2 2.81 1.87 66.5 1.35 OBSTRUCTIONAavudaiappan 50 M 159 47 18.5 Y 30 BEEDI 24 720 Y Y N Y N Y N N 2 1.86 0.7 37.6 0.95 MIXEDThangappan 53 M 154 51 21.5 Y 23 BEEDI 10 230 Y N N N N N N N 2 2.48 1.14 46 1.78 OBSTRUCTIONRajamoorthy 60 M 168 50 17.7 Y 40 BEEDI 6 240 Y N N N N N N N 1 2.97 2.34 81.2 5.04 NORMALBalakrishnan 47 M 162 53 20.2 Y 20 CIGERRETE 12 240 Y N N Y N N N N 2 1.67 1.43 85.6 4.74 RESTRICTIONIrudhayaraj 77 M 166 52 18.8 Y 30 BEEDI 20 600 Y Y N Y N Y Y Y 2 1.73 0.77 44.5 1.29 MIXED
Balasubramanian 65 M 160 56 21.8 Y 40 BEEDI 24 960 Y Y N Y N N N N 2 1.03 0.57 55.3 1.36 MIXEDDuraipandi 55 M 162 46 17.5 Y 25 BEEDI 15 375 Y Y N Y N N N N 2 2.21 1.59 71.9 3.92 MIXED
Krishnasamy 70 M 174 58 19.1 Y 40 BOTH 15 600 Y Y N Y Y Y N N 2 2.64 1.07 40.8 1.54 OBSTRUCTIONMani 52 M 160 53 20.7 Y 30 BEEDI 15 450 Y Y N Y N N N Y 2 2.41 1.27 52.7 2.3 OBSTRUCTION
Iyappan 45 M 164 50 18.5 Y 20 BEEDI 20 400 Y Y N Y N N N N 1 2.3 1.43 62.2 3.92 MIXEDKrishnan 60 M 160 56 21.8 Y 40 BEEDI 14 560 Y Y N Y N N N N 2 1.43 0.73 51 0.97 MIXED
Chelladurai 51 M 151 52 22.8 Y 20 BEEDI 20 400 Y Y N Y N N N N 1 1.84 1.12 60.9 1.48 OBSTRUCTIONAnandakumar 68 M 160 53 20.7 Y 45 BOTH 20 900 Y Y N Y Y N Y N 1 1.03 0.62 60.2 0.8 MIXED
Abdulkadar 62 M 164 49 18.2 Y 40 BEEDI 20 800 Y Y N Y Y N N N 2 1.47 0.97 65.9 3.31 MIXEDAhamad shahil 58 M 165 52 19.1 Y 28 BEEDI 28 784 Y Y N Y N N Y N 2 1.35 0.74 54.8 1.71 MIXED
Anandan 60 M 157 55 22.3 Y 35 BEEDI 10 350 Y Y N Y N N N N 2 1.37 0.95 69.3 1.32 MIXEDVELU 65 M 153 49 20.9 Y 30 BEEDI 20 600 Y Y N Y N N N N 2 1.63 0.96 58.9 1.93 OBSTRUCTION
Chokalingam 70 M 164 51 18.9 Y 40 BEEDI 14 560 Y Y N Y N N Y N 1 2.37 1.16 48.9 2.58 OBSTRUCTIONSankar 60 M 145 51 24.2 Y 40 BEEDI 14 560 Y Y N Y N N Y N 2 0.91 0.44 48.4 0.61 MIXED
ANTHONY MUTHU 65 M 164 46 17.1 Y 30 BEEDI 10 300 Y Y N Y N N N N 1 2.01 1.2 59 3.09 OBSTRUCTIONSANKARASUBBU 72 M 170 54 18.6 Y 35 BEEDI 20 700 Y Y N Y N N N N 1 1.62 0.81 50 1.1 MIXED
MURUGAN 58 M 155 45 18.7 Y 30 BEEDI 28 840 Y Y N Y N N N N 2 1.76 0.93 52.8 1.28 MIXED
SMOKER
BMI
Typ
e of
smok
e
CA
TE
GO
RY
Smok
ing
No.
of Y
ears
No.
of s
omke
/Day
Smok
ing
inde
x
PEF
Symptoms Co- MorbitditiesSmoking History
Cou
gh
FVC
Name Age Sex Ht. Wt.
DM
HT
N
FEV
1
sput
um
Che
stpa
i0
D1s
p0ea
whe
eze
hem
opt1
sis
RE
SUL
TS
PFT
FEV
1/FV
C

ATT
BMI
Typ
e of
smok
e
CA
TE
GO
RY
Smok
ing
No.
of Y
ears
No.
of s
omke
/Day
Smok
ing
inde
x
PEF
Symptoms Co- MorbitditiesSmoking History
Cou
gh
FVC
Name Age Sex Ht. Wt.
DM
HT
N
FEV
1
sput
um
Che
stpa
i0
D1s
p0ea
whe
eze
hem
opt1
sis
RE
SUL
TS
PFT
FEV
1/FV
C
Malaiappan 72 M 152 42 18.1 N N N N N Y N N Y N N N N 1 2.12 1.75 82.5 2.17 NORMALRamar 46 M 165 66 24.2 N N N N N Y N N N N N N N 1 2.6 2.47 95 3.85 NORMAL
Parvathy 56 F 138 40 21 N N N N N Y N N Y N N N N 1 1.22 1.65 97.6 3.18 RESTRICTIONMuthukumaran 36 M 165 68 24.9 N N N N N Y Y N N N N N N 1 1.93 1.88 97.4 3.6 RESTRICTIONAavudaiammal 55 F 153 57 24.3 N N N N N Y Y N N N N N N 2 2.01 1.2 59.7 3.09 OBSTRUCTION
Mookammal 45 F 154 48 20.2 N N N N N Y Y N N Y N N N 2 1.64 1.13 68.9 2.01 MIXEDJayakumari 62 F 148 36 16.4 N N N N N N Y N N N N N N 1 2 1.64 82 3.4 NORMAL
Malathy 67 F 146 38 17.8 N N N N N Y Y N Y N N N N 1 1.87 1.27 67.9 2.78 OBSTRUCTIONChitra 43 F 147 60 28.9 N N N N N Y N N N N N N N 1 2.13 1.3 64.8 3.07 OBSTRUCTION
Essakiammal 57 F 148 58 26.4 N N N N N Y Y N Y N N Y N 2 1.41 0.89 63.1 1.61 MIXEDMariappan 39 M 165 61 22.4 N N N N N N N N N N N N N 1 2.68 2.18 81.3 6.63 RESTRICTIONThangaraj 57 M 170 74 25.6 N N N N N N N N N N N N N 1 2.79 2.09 74.9 4.81 OBSTRUCTION
Balasubramaniyan 34 M 167 64 22.9 N N N N N N N N N N N N N 1 2.54 2.4 94.5 4.45 RESTRICTIONPandaram 67 M 157 36 20.6 N N N N N N N N N N N Y N 1 1.95 1.6 82.05 3.34 NORMALMadakani 67 F 132 37 21.2 N N N N N N N N N N N N N 1 1.08 0.96 88.8 1.85 NORMALJabakani 57 F 143 33 16.14 N N N N N Y N N N N N N N 1 1.52 1.44 94.7 3.35 NORMAL
Raveendran 57 M 175 44 14.3 N N N N N Y Y N Y N N N N 1 2.75 2.53 92 6.61 RESTRICTIONRaheem 48 M 160 49 19.1 N N N N N Y N N N N N N N 1 2.25 1.95 86.7 4.55 NORMAL
Rajalakshmi 57 F 145 44 20.9 N N N N N N N N Y N N N N 1 1.74 1.42 81.6 3.65 NORMALThangam 48 F 157 42 17.04 N N N N N Y Y N Y Y N N N 1 2.11 1.54 73 2.65 OBSTRUCTION
Muthusamy 67 M 160 41 16 N N N N N N N N Y N N N N 1 2.3 1.83 80 3.42 NORMALBaskaran 58 M 165 51 18 N N N N N Y Y N N N N N N 1 2.75 1.81 65.8 3.22 OBSTRUCTION
Lakshmanan 39 M 165 72 26.4 N N N N N Y Y N Y Y N N N 2 2.78 1.96 70.5 2.72 MIXEDIyyappan 27 M 162 50 19 N N N N N Y Y N N N N N N 1 2.87 2.3 80.1 5.31 NORMAL
Veerammal 38 F 140 30 15.3 N N N N N N N N Y N N N N 1 1.66 1.46 88 2.95 NORMALArumugam 67 M 156 66 27.1 N N N N N Y Y N Y Y N N N 1 2.09 1.29 61.7 2 OBSTRUCTION
Shahul ahamed 68 M 165 60 20.4 N N N N N Y Y N N N N Y N 1 1.78 1.47 82.6 2.93 RESTRICTIONAanandaraj 66 M 156 58 23.8 N N N N N N N N Y N N N N Y 1.68 1.41 83.9 3.94 NORMALAnbalagan 60 M 161 58 22.3 N N N N N Y N N N N N Y N 1 2.46 1.94 80.1 2.95 NORMAL
Perumal 57 M 164 45 16.7 N N N N N Y Y N Y N N N N 1 3.03 1.61 53.1 3.02 RESTRICTIONThangammal 46 F 165 47 17.3 N N N N N Y Y N Y Y N Y N 2 1.53 0.91 60.1 1.67 MIXEDArumugam 67 M 159 37 14.6 N N N N N Y Y N Y N N N N 1 2.32 1.42 62.9 2.93 OBSTRUCTION
Duraipandian 55 M 162 46 17.5 N N N N N Y N N Y N N N N 2 2.21 1.59 71.9 3.92 MIXEDIndira 27 F 149 45 20.2 N N N N N N N N Y N N N N 1 1.86 1.78 95.7 4.57 RESTRICTION
Madasamy 39 M 175 69 22.5 N N N N N Y N N N N N N N 1 3.71 2.96 81.4 6.2 NORMALSudalaipandi 45 M 155 53 22 N N N N N Y Y N Y N N N N 1 2.84 1.93 98 3.62 OBSTRUCTION
Murugan 56 M 146 54 25.3 N N N N N Y N N N N N N N 1 1.7 1.64 96.5 2.24 RESTRICTIONAbdul Kabir 45 M 156 40 16.4 N N N N N Y Y N N N N N N 1 2.01 1.2 59.7 3.09 OBSTRUCTIONRajendran 64 M 158 41 16.4 N N N N N Y Y N N N N N N 2 1.88 1.03 54.8 1.45 OBSTRUCTIONArumugam 53 M 157 40 16.3 N N N N N Y N N N N N N N 1 2.35 1.88 80.1 4.03 NORMAL
Madar Mohideen 80 M 170 50 17.3 N N N N N N N N Y N N N Y 1 1.92 1.82 97.8 4.06 RESTRICTIONParimala 38 F 150 52 23.1 N N N N N Y Y N N N N N N 1 2.1 1.76 83.8 3.33 NORMAL
Sundar singh 67 M 170 50 17.3 N N N N N Y Y N Y N N N N 1 3.16 1.95 61.7 387 OBSTRUCTIONAmmaponnu 59 F 147 49 22.7 N N N N N Y Y N N N N N N 1 2.61 1.58 60.5 3.21 OBSTRUCTION
Kaarman 28 M 160 65 25.3 N N N N N Y Y N N N N N N 1 3.75 2.23 59.5 4.48 OBSTRUCTIONSubbiah 65 M 160 45 17.5 N N N N N Y Y N Y N N N N 2 2.43 1.47 60.5 2.61 OBSTRUCTION
Sudalaimuthu 56 M 160 44 17.2 N N N N N Y N N N N N N N 1 2.26 1.82 96.4 3.75 NORMALEsakkiammal 43 F 157 36 14.6 N N N N N Y Y N N N N N N 1 2.18 1.79 82.1 4.13 NORMAL
Krishnamoorthy 45 M 153 44 18.8 N N N N N Y Y N Y N N N N 1 2.39 1.4 58.6 2.43 OBSTRUCTIONPetchiammal 58 F 145 36 17.1 N N N N N Y N N N N N N N 1 1.77 1.51 80.2 3.45 NORMALMariappan 39 M 165 61 22.4 N N N N N Y N N Y N N N N 1 2.68 2.18 81.3 6.63 RESTRICTION
Esakkiammal 48 F 163 40 15.1 N N N N N Y Y N Y N Y N N 1 2.2 1.71 77.7 3.62 MIXEDNisha 67 F 150 66 29.3 N N N N N Y Y N N N N N N 2 2.23 1.24 55.6 2.58 OBSTRUCTION
Ramasubbu 67 M 170 68 23.5 N N N N N Y Y N Y N N Y N 1 2.39 1.88 78.7 40.93 MIXEDSathya 46 F 147 60 27.7 N N N N N Y Y N N N Y N N 1 2.13 1.38 64.8 2.71 OBSTRUCTION
NON SMOKERS

6 MWT TYPE OF LESIONSPR
E
POST
PRE
POST
PRE
SY
STO
LE
PRE
DIA
STO
LE
MA
P
POST
SY
STO
LE
POST
DIA
STO
LE
MA
P
PRE
POST
96 93 92 102 126 82 97 128 80 96 2 5 320 BOTH U/L 1 N N N Y N N N97 96 74 79 130 80 97 136 82 100 2 4 365 LEFT U/L 1 N N Y N N N N94 90 92 116 110 68 82 124 76 92 3 7 270 BOTH B/L 4 Y N N Y Y N Y96 92 86 112 110 80 90 122 88 99 3 8 244/STOP BOTH B/L 3 Y N Y N Y N Y96 92 87 92 122 80 91 136 84 100 2 5 325 LEFT U/L 1 Y N N N N N N97 93 76 88 116 80 92 126 88 101 3 6 335 LEFT U/L 1 Y N N N N N N95 90 85 104 130 82 98 140 90 107 3 7 310 RIGHT U/L 2 Y N N Y N N Y94 90 96 118 110 70 83 126 82 97 3 7 250/STOP BOTH B/L 4 Y N N Y Y N Y94 89 90 102 106 76 86 118 80 93 3 8 280 RIGHT U/L 2 Y N Y N N N Y97 94 98 110 130 90 103 138 94 109 3 6 310 RIGHT U/L 2 Y N N Y Y N Y96 93 86 98 132 74 93 138 78 98 2 6 310 RIGHT U/L 2 Y N Y N N N Y96 93 96 118 108 64 78 116 76 89 2 5 310 RIGHT B/L 3 Y N N Y N N Y97 95 78 86 122 82 95 130 90 103 2 4 350 LEFT U/L 1 Y N N N N N N97 95 68 78 112 70 84 120 74 89 2 4 360 LEFT U/L 2 N N Y N N N N98 97 80 88 110 80 90 114 80 91 2 4 356 RIGHT U/L 1 Y N N N N N N98 96 88 96 120 82 94 126 86 99 2 5 320 RIGHT U/L 1 Y N Y N N N Y97 93 74 88 130 80 96 136 88 104 2 4 320 RIGHT U/L 1 Y N Y N N N Y98 95 88 98 122 84 96 132 90 104 3 7 310 BOTH B/L 2 Y N Y Y N N Y98 97 78 88 118 74 90 112 74 87 2 4 360 RIGHT U/L 2 N N N Y N N N95 90 96 122 122 74 90 132 82 99 3 7 296 BOTH B/L 2 Y N Y Y N N Y96 92 94 105 110 80 90 114 76 89 2 5 336 BOTH B/L 2 N N N Y N N N97 94 80 92 130 80 96 136 82 100 2 4 325 RIGHT U/L 1 N N N Y N N N97 95 84 96 110 80 90 116 82 93 2 4 360 RIGHT U/L 2 N N N Y N N N95 91 90 112 126 74 91 132 80 97 3 5 235/STOP BOTH B/L 3 Y Y N Y Y N Y98 96 82 94 120 76 90 124 76 92 2 4 325 BOTH B/L 2 N N N Y N N N97 96 80 88 128 80 96 130 82 98 Y 3 360 LEFT U/L 1 Y N N N N N N97 92 82 102 100 70 80 108 74 85 2 4 338 RIGHT U/L 2 Y Y N N N N Y96 91 92 103 110 80 95 116 82 93 3 7 315 BOTH B/L 4 Y N Y Y N N Y94 88 90 128 130 90 103 140 94 109 3 8 285 BOTH B/L 3 Y N Y N N Y Y97 95 92 118 110 72 85 114 74 87 2 5 345 BOTH B/L 3 N N N Y N Y Y95 90 94 120 130 76 94 138 84 102 3 8 280 RIGHT U/L 3 Y N Y N N N Y97 94 86 102 120 70 87 128 74 92 2 5 325 LEFT U/L 2 N N N Y N N N98 96 80 88 120 80 93 126 78 94 2 6 360 RIGHT U/L 2 Y N N N N Y Y95 92 88 102 110 76 87 120 84 96 3 7 310 LEFT U/L 3 Y N N N N Y Y96 94 80 88 112 78 89 120 78 92 2 4 380 LEFT U/L 2 Y N N Y N N Y96 93 90 116 110 70 83 122 78 93 3 8 272/STOP LEFT U/L 4 Y N N N N Y Y96 92 92 114 120 76 91 132 82 99 3 8 265/STOP BOTH B/L 3 Y Y N N N Y Y96 93 90 108 116 76 89 126 84 98 3 8 265/STOP BOTH B/L 4 Y Y N Y N N Y97 94 86 100 110 68 82 122 72 89 2 6 316 BOTH B/L 3 Y N Y N N N Y97 95 82 93 116 78 91 120 82 95 2 5 340 BOTH B/L 2 N N N Y N N N98 95 74 82 126 78 94 132 84 100 3 6 390 RIGHT U/L 1 N N N Y N N N94 89 98 126 108 64 79 120 72 88 3 7 220/STOP BOTH B/L 4 Y N Y Y N N Y97 95 84 96 120 78 92 132 82 99 2 5 340 RIGHT U/L 2 N N N Y N N N95 90 88 120 130 80 97 142 92 109 3 9 240/STOP BOTH B/L 4 Y Y N Y N N Y96 93 94 118 110 74 86 122 80 94 3 8 290 BOTH B/L 3 Y Y N N N N Y
SMOKER
No.
of Z
ON
ES
CO
MB
I0E
D
Col
laps
e
FIB
RO
SIS
Cav
itatio
0
BRO
0CH
IEC
TASI
S
SPO2 Dyspnea Scale
LE
SIO
NS
SID
E
CA
LC
IFIC
AT
IO0
BU
LL
A
Heart rate Blood Pressure[mm Hg]
DIS
TA
NC
E W
AL
KE
D
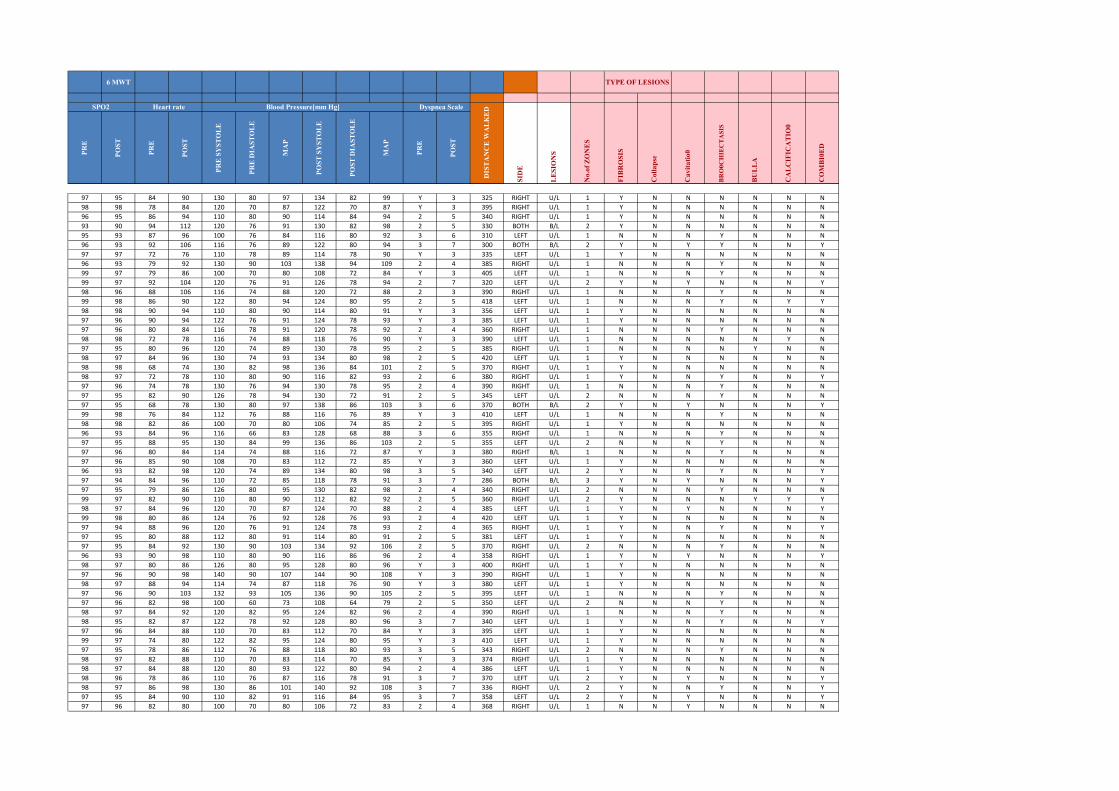
6 MWT TYPE OF LESIONSPR
E
POST
PRE
POST
PRE
SY
STO
LE
PRE
DIA
STO
LE
MA
P
POST
SY
STO
LE
POST
DIA
STO
LE
MA
P
PRE
POST
No.
of Z
ON
ES
CO
MB
I0E
D
Col
laps
e
FIB
RO
SIS
Cav
itatio
0
BRO
0CH
IEC
TASI
S
SPO2 Dyspnea Scale
LE
SIO
NS
SID
E
CA
LC
IFIC
AT
IO0
BU
LL
A
Heart rate Blood Pressure[mm Hg]
DIS
TA
NC
E W
AL
KE
D
97 95 84 90 130 80 97 134 82 99 Y 3 325 RIGHT U/L 1 Y N N N N N N98 98 78 84 120 70 87 122 70 87 Y 3 395 RIGHT U/L 1 Y N N N N N N96 95 86 94 110 80 90 114 84 94 2 5 340 RIGHT U/L 1 Y N N N N N N93 90 94 112 120 76 91 130 82 98 2 5 330 BOTH B/L 2 Y N N N N N N95 93 87 96 100 76 84 116 80 92 3 6 310 LEFT U/L 1 N N N Y N N N96 93 92 106 116 76 89 122 80 94 3 7 300 BOTH B/L 2 Y N Y Y N N Y97 97 72 76 110 78 89 114 78 90 Y 3 335 LEFT U/L 1 Y N N N N N N96 93 79 92 130 90 103 138 94 109 2 4 385 RIGHT U/L 1 N N N Y N N N99 97 79 86 100 70 80 108 72 84 Y 3 405 LEFT U/L 1 N N N Y N N N99 97 92 104 120 76 91 126 78 94 2 7 320 LEFT U/L 2 Y N Y N N N Y98 96 88 106 116 74 88 120 72 88 2 3 390 RIGHT U/L 1 N N N Y N N N99 98 86 90 122 80 94 124 80 95 2 5 418 LEFT U/L 1 N N N Y N Y Y98 98 90 94 110 80 90 114 80 91 Y 3 356 LEFT U/L 1 Y N N N N N N97 96 90 94 122 76 91 124 78 93 Y 3 385 LEFT U/L 1 Y N N N N N N97 96 80 84 116 78 91 120 78 92 2 4 360 RIGHT U/L 1 N N N Y N N N98 98 72 78 116 74 88 118 76 90 Y 3 390 LEFT U/L 1 N N N N N Y N97 95 80 96 120 74 89 130 78 95 2 5 385 RIGHT U/L 1 N N N N Y N N98 97 84 96 130 74 93 134 80 98 2 5 420 LEFT U/L 1 Y N N N N N N98 98 68 74 130 82 98 136 84 101 2 5 370 RIGHT U/L 1 Y N N N N N N98 97 72 78 110 80 90 116 82 93 2 6 380 RIGHT U/L 1 Y N N Y N N Y97 96 74 78 130 76 94 130 78 95 2 4 390 RIGHT U/L 1 N N N Y N N N97 95 82 90 126 78 94 130 72 91 2 5 345 LEFT U/L 2 N N N Y N N N97 95 68 78 130 80 97 138 86 103 3 6 370 BOTH B/L 2 Y N Y N N N Y99 98 76 84 112 76 88 116 76 89 Y 3 410 LEFT U/L 1 N N N Y N N N98 98 82 86 100 70 80 106 74 85 2 5 395 RIGHT U/L 1 Y N N N N N N96 93 84 96 116 66 83 128 68 88 3 6 355 RIGHT U/L 1 N N N Y N N N97 95 88 95 130 84 99 136 86 103 2 5 355 LEFT U/L 2 N N N Y N N N97 96 80 84 114 74 88 116 72 87 Y 3 380 RIGHT B/L 1 N N N Y N N N97 96 85 90 108 70 83 112 72 85 Y 3 360 LEFT U/L 1 Y N N N N N N96 93 82 98 120 74 89 134 80 98 3 5 340 LEFT U/L 2 Y N N Y N N Y97 94 84 96 110 72 85 118 78 91 3 7 286 BOTH B/L 3 Y N Y N N N Y97 95 79 86 126 80 95 130 82 98 2 4 340 RIGHT U/L 2 N N N Y N N N99 97 82 90 110 80 90 112 82 92 2 5 360 RIGHT U/L 2 Y N N N Y Y Y98 97 84 96 120 70 87 124 70 88 2 4 385 LEFT U/L 1 Y N Y N N N Y99 98 80 86 124 76 92 128 76 93 2 4 420 LEFT U/L 1 Y N N N N N N97 94 88 96 120 76 91 124 78 93 2 4 365 RIGHT U/L 1 Y N N Y N N Y97 95 80 88 112 80 91 114 80 91 2 5 381 LEFT U/L 1 Y N N N N N N97 95 84 92 130 90 103 134 92 106 2 5 370 RIGHT U/L 2 N N N Y N N N96 93 90 98 110 80 90 116 86 96 2 4 358 RIGHT U/L 1 Y N Y N N N Y98 97 80 86 126 80 95 128 80 96 Y 3 400 RIGHT U/L 1 Y N N N N N N97 96 90 98 140 90 107 144 90 108 Y 3 390 RIGHT U/L 1 Y N N N N N N98 97 88 94 114 74 87 118 76 90 Y 3 380 LEFT U/L 1 Y N N N N N N97 96 90 103 132 93 105 136 90 105 2 5 395 LEFT U/L 1 N N N Y N N N97 96 82 98 100 60 73 108 64 79 2 5 350 LEFT U/L 2 N N N Y N N N98 97 84 92 120 82 95 124 82 96 2 4 390 RIGHT U/L 1 N N N Y N N N98 95 82 87 122 78 92 128 80 96 3 7 340 LEFT U/L 1 Y N N Y N N Y97 96 84 88 110 70 83 112 70 84 Y 3 395 LEFT U/L 1 Y N N N N N N99 97 74 80 122 82 95 124 80 95 Y 3 410 LEFT U/L 1 Y N N N N N N97 95 78 86 112 76 88 118 80 93 3 5 343 RIGHT U/L 2 N N N Y N N N98 97 82 88 110 70 83 114 70 85 Y 3 374 RIGHT U/L 1 Y N N N N N N98 97 84 88 120 80 93 122 80 94 2 4 386 LEFT U/L 1 Y N N N N N N98 96 78 86 110 76 87 116 78 91 3 7 370 LEFT U/L 2 Y N Y N N N Y98 97 86 98 130 86 101 140 92 108 3 7 336 RIGHT U/L 2 Y N N Y N N Y97 95 84 90 110 82 91 116 84 95 3 7 358 LEFT U/L 2 Y N Y N N N Y97 96 82 80 100 70 80 106 72 83 2 4 368 RIGHT U/L 1 N N Y N N N N
NON SMOKERS

Pulmonary Function Test Results
DEPT OF PULMONARY MEDICINE
TIRUNELVELI MEDICAL COLLEGE
TIRUNELVELI-11
Visit date 11/19/2016
Patient code 9799
Surname
Name
Date of birth
Ethnic group
Smoke
Patient group
sankarasubbu
s
11/19/1944
South indian
Age 72Gender MaleHeight, cm 170Weight, kg 54BMI 18.69Pack-Year
Interpretation
Very Severe Obstruction
Best values from all loops
PRE
Predicted
Parameters Pred PRE %Pred POST %Chg
FEV1
FEV1%
PEF
FVC
L
%
L/s
L
2.34
79.4
7.47
2.98
0.81
50.00
1.10
1.62
35
63
15
54
PRE Trial date 11/19/2016 12:18:04 PM
FVC FEV1 FEV1%
PRE PRE PRE
Flow / Volume Loop and Volume / Time Curve
%Pred %ChgPOST#1PRE # 3PRE # 2%PredPRE # 1PredParameters
FEV1 L 2.34 0.81 35 0.73 0.76
FEV1/FVC % 79.4 50.0 63 46.8 52.1
PEF L/s 7.47 1.10 15 1.07 1.10
ELA Years 72 132 183 135 134
FEF2575 L/s 2.71 0.56 21 0.49 0.47
FVC L 2.98 1.62 54 1.56 1.46
FET s 6.00 4.65 78 4.17 5.14
FEV1/VC % 79.4
FEF25 L/s 6.82 0.83 12 0.75 0.81
FEF50 L/s 3.45 0.52 15 0.42 0.53
FEF75 L/s 1.13 0.29 26 0.26 0.25
MVV(cal) L/min 106.0 28.4 27 25.6 26.6
FIF50 L/s
R50 %
Conclusion / Medical report
Signature Instrument used
Minispir II S/N C02278
BTPS 1.063 31 °C 87.8 °F
printed by winspiroPRO 5.7.4 - 10/4/2018 3:24:43 PM - Mod.C11 1 1/

Pulmonary Function Test Results
DEPT OF PULMONARY MEDICINE
TIRUNELVELI MEDICAL COLLEGE
TIRUNELVELI-11
Visit date 11/14/2016
Patient code 9578
Surname
Name
Date of birth
Ethnic group
Smoke
Patient group
arunachalam
s
5/14/1976
South indian
Age 40Gender MaleHeight, cm 159Weight, kg 65BMI 25.71Pack-Year
Interpretation
Obstruction with Possible Restriction
Significant Bronchodil. (FEV1 < 80%Pred. )
WARNING: FEF2575 POST = 47%Pred.
Best values from all loops
PRE
POST
Predicted - Knudson
Parameters Pred PRE %Pred POST %Chg
FEV1
FEV1%
PEF
FVC
L
%
L/s
L
2.51
84.7
7.55
3.00
1.35
63.70
2.42
2.12
54
75
32
71
1.76
75.20
3.85
2.34
30
18
59
10
PRE Trial date 11/14/2016 9:06:32 AM
FVC FEV1 FEV1%
PRE PRE PRE
POST POST POST
Flow / Volume Loop and Volume / Time Curve
%Pred %ChgPOST#1PRE # 3PRE # 2%PredPRE # 1PredParameters
FEV1 L 2.51 1.34 53 1.35 1.76 70 31
FEV1/FVC % 84.7 63.2 75 67.8 75.2 89 19
PEF L/s 7.55 2.42 32 1.91 3.85 51 59
ELA Years 40 86 215 86 70 175 -19
FEF2575 L/s 3.24 0.99 31 1.06 1.51 47 53
FVC L 3.00 2.12 71 1.99 2.34 78 10
FET s 6.00 3.61 60 3.30 3.67 61 2
FEV1/VC % 84.7
FEF25 L/s 6.97 1.83 26 1.91 2.73 39 49
FEF50 L/s 3.87 0.94 24 1.05 1.63 42 73
FEF75 L/s 1.53 0.44 29 0.51 0.71 47 61
MVV(cal) L/min 119.0 46.9 39 47.3 61.6 52 31
FIF50 L/s
R50 %
Conclusion / Medical report
Signature Instrument used
Minispir II S/N C02278
BTPS 1.068 30 °C 86 °F
printed by winspiroPRO 5.7.4 - 10/4/2018 3:21:48 PM - Mod.C11 1 1/


![A Comparison of Corona-Treated and Flame-Treated ...uigelz.eecs.umich.edu/pub/articles/pap_8_61_2003.pdfP1: GCR Plasmas and Polymers [papo] pp778-papo-461817 March 4, 2003 10:55 Style](https://static.fdocuments.net/doc/165x107/5b0983f47f8b9a3d018dce58/a-comparison-of-corona-treated-and-flame-treated-gcr-plasmas-and-polymers-papo.jpg)

