Comparison of Permeability and Clogging Characteristics of ...docs.trb.org/prp/15-1221.pdf ·...
17
1 Comparison of Permeability and Clogging Characteristics of Porous Asphalt and Pervious Concrete Pavement Materials by T. F. Fwa 1 , Emiko Lim 2 and K. H. Tan 1 1 Professor and 2 Research Engineer Department of Civil and Environmental Engineering National University of Singapore 10 Kent Ridge Crescent SINGAPORE 119260 Total Number of Words Number of words in text: = 4902 words Number of tables: 4 (4 x 250) = 1000 words equivalent Number of figures: 6 (6 x 250) = 1500 words equivalent ------------------------------ Total number of words = 7402 words equivalent Corresponding author: Professor T. F. Fwa Department of Civil and Environmental Engineering National University of Singapore 10 Kent Ridge Crescent SINGAPORE 119260 Email: [email protected] Revised October 2014
Transcript of Comparison of Permeability and Clogging Characteristics of ...docs.trb.org/prp/15-1221.pdf ·...

1
Comparison of Permeability and Clogging Characteristics of
Porous Asphalt and Pervious Concrete Pavement Materials
by
T. F. Fwa1, Emiko Lim2 and K. H. Tan1
1 Professor and 2Research Engineer
Department of Civil and Environmental Engineering
National University of Singapore
10 Kent Ridge Crescent
SINGAPORE 119260
Total Number of Words
Number of words in text: = 4902 words
Number of tables: 4 (4 x 250) = 1000 words equivalent
Number of figures: 6 (6 x 250) = 1500 words equivalent
------------------------------
Total number of words = 7402 words equivalent
Corresponding author: Professor T. F. Fwa
Department of Civil and Environmental Engineering
National University of Singapore
10 Kent Ridge Crescent
SINGAPORE 119260
Email: [email protected]
Revised
October 2014
2
1
2
Comparison of Permeability and Clogging Characteristics of 3
Porous Asphalt and Pervious Concrete Pavement Materials 4
5
Fwa T. F., Emiko Lim and K. H. Tan 6
7
ABSTRACT 8
9
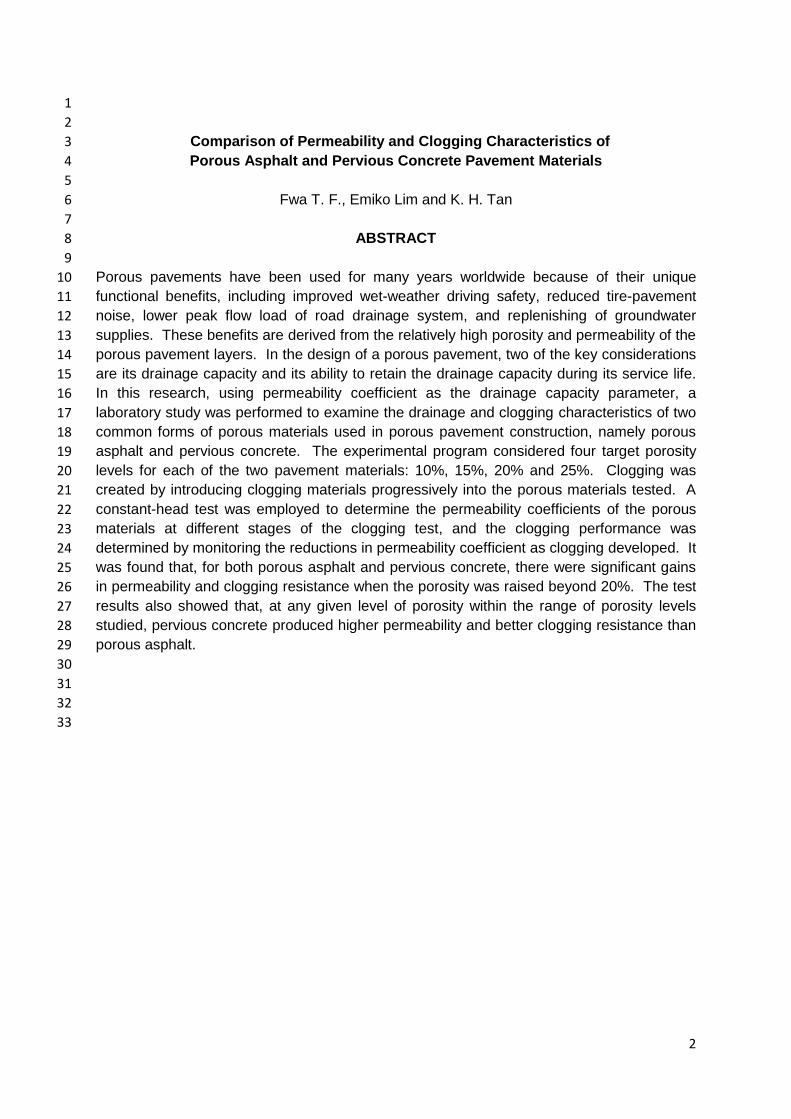
Porous pavements have been used for many years worldwide because of their unique 10
functional benefits, including improved wet-weather driving safety, reduced tire-pavement 11
noise, lower peak flow load of road drainage system, and replenishing of groundwater 12
supplies. These benefits are derived from the relatively high porosity and permeability of the 13
porous pavement layers. In the design of a porous pavement, two of the key considerations 14
are its drainage capacity and its ability to retain the drainage capacity during its service life. 15
In this research, using permeability coefficient as the drainage capacity parameter, a 16
laboratory study was performed to examine the drainage and clogging characteristics of two 17
common forms of porous materials used in porous pavement construction, namely porous 18
asphalt and pervious concrete. The experimental program considered four target porosity 19
levels for each of the two pavement materials: 10%, 15%, 20% and 25%. Clogging was 20
created by introducing clogging materials progressively into the porous materials tested. A 21
constant-head test was employed to determine the permeability coefficients of the porous 22
materials at different stages of the clogging test, and the clogging performance was 23
determined by monitoring the reductions in permeability coefficient as clogging developed. It 24
was found that, for both porous asphalt and pervious concrete, there were significant gains 25
in permeability and clogging resistance when the porosity was raised beyond 20%. The test 26
results also showed that, at any given level of porosity within the range of porosity levels 27
studied, pervious concrete produced higher permeability and better clogging resistance than 28
porous asphalt. 29
30
31
32
33

3
INTRODUCTION 34
35
Porous pavements have been used for many years worldwide because of their unique 36
functional benefits compared with conventional asphalt and concrete pavements (1-7). The 37
benefits of using porous concrete pavement are manifold. By allowing surface runoff to 38
drain into the pavement structure, porous pavements are able to maintain high skid 39
resistance and reduce hydroplaning risk, thus improving wet-weather driving safety. In 40
addition, there is a marked decrease in splash and spray, reduction in headlight reflection 41
and better visibility of pavement markings, especially at night. Porous pavements are also 42
found beneficial in controlling storm water runoff, replenishing groundwater supplies and 43
reducing water and soil pollution (8-10). 44
45
The above-mentioned benefits of porous pavements are derived from the relatively high 46
porosity and permeability of the pavement materials. While it is important to design a porous 47
pavement with a high level of porosity and permeability to start with, it is equally important to 48
ensure that the pores are not easily clogged up during its service so that a sufficiently high 49
level of permeability can be maintained throughout the service life of the pavement. Thus, in 50
the evaluation of a porous pavement material, it is relevant to determine its initial 51
permeability as well as the ability of the material to resist the loss of permeability caused by 52
clogging. 53
54
In practice, the following two common forms of pavement materials have been used to 55
construct porous pavements: porous asphalt and pervious concrete. Since the type of 56
binder as well as the mix design principle and concept used in producing the two forms of 57
mixture are not the same, it is likely that their permeability characteristics and clogging 58
behaviors would also be different. A porous material that is easily clogged up by dust and 59
debris is not suitable for porous pavement construction. Therefore it is of interest to study 60
the permeability and clogging characteristics of the two forms of porous pavement mixtures. 61
62
This paper reports a laboratory study conducted to examine the permeability and clogging 63
characteristics of a porous asphalt mixture and a pervious concrete mixture as a function of 64
mixture porosity. The experimental program considered four target porosity levels for each 65
of the two pavement mixture types: 10%, 15%, 20% and 25%. This would cover the likely 66
range of porosity, and hence the range of permeability coefficient (i.e. hydraulic conductivity), 67
that a porous pavement material goes through in its entire useful service life. The 68
permeability coefficient was determined by means of constant-head test, and the clogging 69
performance was determined by monitoring the reductions in permeability coefficient as 70
clogging developed. The aim of this research is to study how the two types of porous 71
pavement materials differ in their permeability and clogging characteristics. 72
73
METHODOLOGY OF STUDY 74
75
The focus of the study was to compare the permeability and clogging characteristics of the 76
two porous pavement materials. The two porous pavement materials studied were asphalt 77
mixture and Portland cement concrete. Permeability coefficient (i.e. hydraulic conductivity) 78
was selected as the drainage parameter to characterize the drainage capacity of the porous 79
materials. The clogging behavior of each of the porous materials tested was studied by 80
4
introducing clogging materials into the porous materials to create clogging, and measuring 81
the decrease in permeability coefficient of the test materials at different stages of clogging. 82
83
Measurement of Permeability Coefficient 84
The test program involved measuring the coefficient of permeability repeatedly at different 85
stages of clogging test as more and more clogging materials were introduced during the test. 86
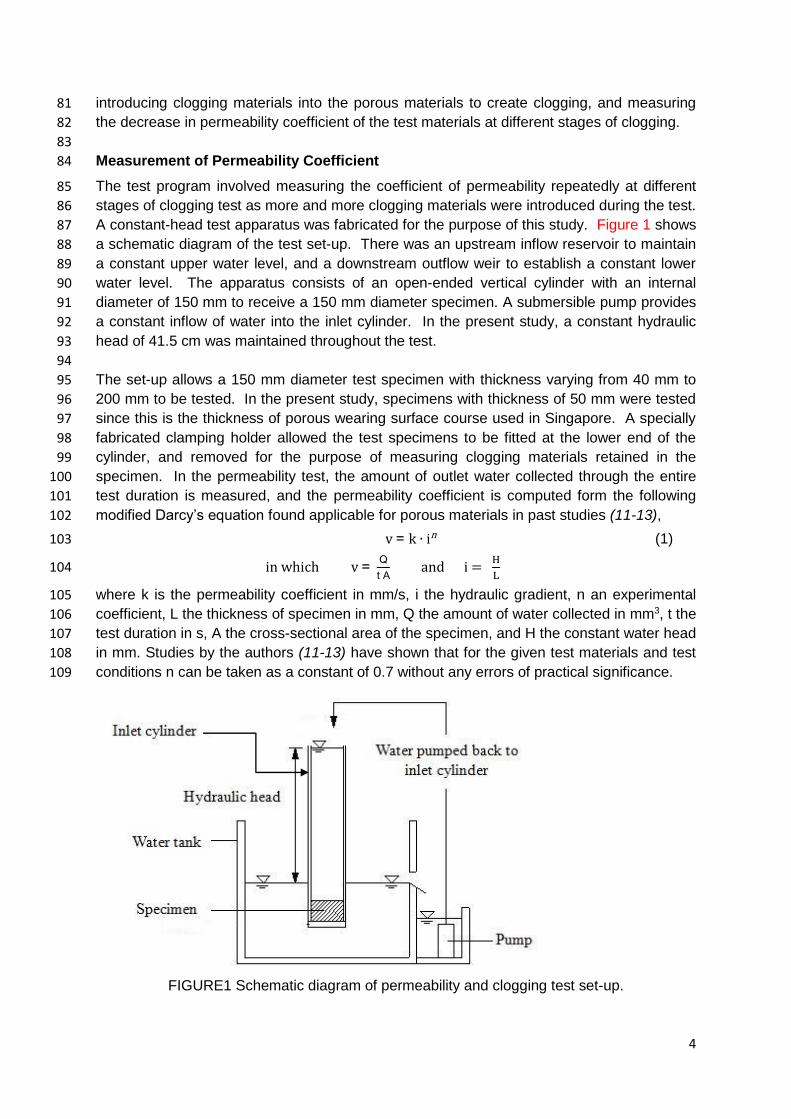
A constant-head test apparatus was fabricated for the purpose of this study. Figure 1 shows 87
a schematic diagram of the test set-up. There was an upstream inflow reservoir to maintain 88
a constant upper water level, and a downstream outflow weir to establish a constant lower 89
water level. The apparatus consists of an open-ended vertical cylinder with an internal 90
diameter of 150 mm to receive a 150 mm diameter specimen. A submersible pump provides 91
a constant inflow of water into the inlet cylinder. In the present study, a constant hydraulic 92
head of 41.5 cm was maintained throughout the test. 93
94
The set-up allows a 150 mm diameter test specimen with thickness varying from 40 mm to 95
200 mm to be tested. In the present study, specimens with thickness of 50 mm were tested 96
since this is the thickness of porous wearing surface course used in Singapore. A specially 97
fabricated clamping holder allowed the test specimens to be fitted at the lower end of the 98
cylinder, and removed for the purpose of measuring clogging materials retained in the 99
specimen. In the permeability test, the amount of outlet water collected through the entire 100
test duration is measured, and the permeability coefficient is computed form the following 101
modified Darcy’s equation found applicable for porous materials in past studies (11-13), 102
v = k ∙ in (1) 103
in which v = Q
t A and i =
H
L 104
where k is the permeability coefficient in mm/s, i the hydraulic gradient, n an experimental 105
coefficient, L the thickness of specimen in mm, Q the amount of water collected in mm3, t the 106
test duration in s, A the cross-sectional area of the specimen, and H the constant water head 107
in mm. Studies by the authors (11-13) have shown that for the given test materials and test 108
conditions n can be taken as a constant of 0.7 without any errors of practical significance. 109
FIGURE1 Schematic diagram of permeability and clogging test set-up.

5
Measurement of Clogging Behavior 110
In the study of the clogging behavior of test specimens, a known quantity of clogging 111
material in the form of fine-grained soil was brought into each specimen by means of water 112
that was repeatedly fed through the 150 mm diameter cylinder. A procedure was 113
established to effectively bring the clogging material into the specimen. In the meantime, to 114
establish the trend of deterioration in permeability as clogging developed, the permeability of 115
the specimen was measured at regular stages of the clogging process. This section 116
describes the selection of the clogging materials and the procedure involved in the clogging 117
process. 118
119
Clogging Materials 120
In Singapore, the soils deposited from dirty wheels of vehicles, or vehicles carrying earth or 121
construction materials have been the major sources of clogging materials on porous 122
pavements. Figure 2 shows the gradations of typical residual soils and construction sands 123
commonly found on Singapore roads. Earlier studies by the authors (11-13) found that of 124
the various sizes of these clogging materials, the fines smaller than 75 µm had insignificant 125
effect in inducing clogging as compared with the larger size materials, and that the 126
component with sizes between 600 µm and 1.18 mm was the most effective in creating 127
clogging in porous materials. Hence, this component of the residual soil was employed in 128
the clogging procedure of the present study. 129
FIGURE 2 Gradations of common clogging materials on Singapore roads
Clogging Procedure 130
As a main aim of the study was to monitor the deterioration of permeability as clogging 131
developed, a clogging procedure was adopted to create clogging in stages such that the 132
permeability coefficient could be measured at the intermediate stages. In order to establish 133
the deterioration trend of permeability in the process of clogging, clogging materials were 134
introduced in 10 stages so that a sufficient number of data points (i.e. number of permeability 135
0
10
20
30
40
50
60
70
80
90
100
0.01 0.1 1 10
Pe
rce
nt
Pas
sin
g (%
)
Particle Size (mm)
Medium-coarse sand
Fine-medium sand
Fine to coarse sand
Residual Soil

6
coefficient measurements) was obtained before the test specimen was clogged. A series of 136
trial clogging tests were conducted to determine an appropriate amount of clogging material 137
to apply at each stage, and it was found that applying 5.3 g (i.e. an application amount of 138
2000 g per square m) each stage would achieve the aim of the clogging test. The clogging 139
procedure adopted consists of the following steps: 140
1. Apply 5.3 g of the clogging material uniformly on the upper face of the cylindrical test 141
specimen. 142
2. Secure the test specimen in the holder at the lower end of the constant-head test 143
cylinder, and fill up the test cylinder with water. 144
3. Open the valve at the lower end of the constant-head test cylinder to allow water to 145
flow through the test specimen under the constant head to bring the clogging 146
material into the specimen. 147
4. Perform permeability coefficient measurements repeatedly at an interval of three 148
minutes until the change in the measured permeability value is negligible. 149
5. Repeat Steps 1 to 4 nine more times. 150
151
The entire test procedure, including the clogging process and permeability coefficient 152
measurements, took 2 to 2.5 hours per specimen. 153
154
PAVEMENT MIXTURES STUDIED 155
156
As mentioned earlier, the aim of this research was to study how porous asphalt mixtures and 157
pervious concrete differ in their permeability and clogging characteristics. For each of the 158
two mixture types, four sets of mixtures were prepared aiming to achieve approximately the 159
following target levels of porosity: 10%, 15%, 20% and 25%. This section presents the 160
properties of the two mixture types considered in the study. 161
162
Porous Asphalt Mixtures 163
The asphalt mixtures considered were the porous asphalt mixtures used in Singapore road 164
construction. Table 1 shows the aggregate gradations and mix proportions of three open-165
graded/porous asphalt paving mix designs for pavement wearing course in Singapore: mix 166
PA-13 with porosity (i.e. air void content) ranging from 8 to 12% approximately, mix PA-16 167
having porosity from 15% to 20% approximately, and PA-20 with porosity from around 20% 168
to more than 25%. Crushed granite stone aggregate, which was the common type of road 169
making aggregate in Singapore, was used for the mixes. The asphalt binder used was a 170
polymer modified binder of grade PG76-22. The porosity of each mix could be varied by 171
adjusting the binder content within the allowable range of each mix design. 172
173
Pervious Concrete Mixtures 174
Pervious concrete is by definition a near zero-slump, open graded material consisting of 175
Portland cement, coarse aggregates, little or no fine aggregate, admixtures and water (14). 176
In the present study, the coarse aggregate gradation of the ASTM designation size number 177
89 (15) was adopted to produce the pervious concrete mix. This gradation is indicated in 178
Table 2. To produce specimens of the target porosity (i.e. void ratio) levels for the present 179
study, specimens were prepared using different mix proportions as shown in Table 2. As in 180
the case of asphalt mixtures, granite aggregate was used for the production of the pervious 181
concrete. The cementitious material used was ASTM Type I ordinary Portland cement with 182

7
chemical composition and physical properties complying with ASTM C150-07 requirements 183
(16). 184
TABLE 1. Aggregate gradation and mix composition of porous asphalt
mix designs studied
Mix Design Porous Asphalt
PA-20
Porous Asphalt
PA-16
Porous Asphalt
PA-13
Sieve Size (% passing) (% passing) (% passing)
20mm 100 - -
16mm 95 100 -
13.2mm 85 70 100
9.5mm 72 59 85
4.75mm 22 33 45
2.36mm 18 22 30
1.18mm - 16 25
600um 13 10 20
300um 9 6 13
150um 7 4 10
75um 6 3 4
Asphalt Binder
Content
% by Weight of
Total Mix
% by Weight of
Total Mix
% by Weight of
Total Mix
Min: 4.5
Max: 5.5
Min: 4.5
Max: 5.5
Min: 4.5
Max: 5.5
TABLE 2 Mix designs of pervious concrete studied
(a) Mix proportions
Mix
Target
Porosity
Level
Water/
Cement
Ratio
Cement
[kg/m3]
Water
[kg/m3]
Coarse
Aggregate
[kg/m3]
PC-10 10% 0.3 495 148.5 1560
PC-15 15% 0.3 400 120.0 1560
PC-20 20% 0.3 367 110.1 1560
PC-25 25% 0.3 300 90.0 1560
(b) Aggregate gradation
Sieve Size (% passing)
12.5mm 100
9.5mm 95
4.75mm 78
2.36mm 18
1.18mm 5
300um 3

8
ANALYSIS OF TEST RESULTS 185
For the two types of porous materials tested, namely porous asphalt and pervious concrete 186
mixtures, three specimens each were prepared for the following four target porosity levels: 187
10%, 15%, 20% and 25%. Each specimen was subject to the following tests: 188
(i) Permeability test to determine the initial permeability coefficient of the specimen 189
before the clogging process; and 190
(ii) Clogging test with intermediate permeability coefficient measurements to determine 191
the deterioration trend of specimen permeability as clogging developed. 192
This section presents the results of the tests, and compares the permeability and clogging 193
characteristics of the porous asphalt and pervious concrete materials studied. 194
195
Comparison of Permeability 196
Table 3 presents the porosity and initial permeability coefficient values of the test specimens 197
for the porous asphalt mixtures, as well as the corresponding values for the pervious 198
concrete specimens. These test results are plotted in Figures 3 and 4 for the porous asphalt 199
and pervious concrete mixtures respectively. These two plots show that, for both the porous 200
asphalt and pervious concrete mixtures, the permeability coefficient value increases 201
exponentially with the porosity level, as represented by the following two regression 202
equations: 203
For porous asphalt k = 0.300e0.131P R2 = 0.865 (2) 204
For pervious concrete k = 0.501e0.133P R2 = 0.922 (3) 205
where k = permeability coefficient in mm/s, and P = porosity in percent. 206
TABLE 3 Porosity and permeability coefficient values of test specimens
Target Porosity
Level
Porous Asphalt Pervious Concrete
Actual Specimen
Porosity (%)
Permeability Coefficient
(mm/s)
Actual Specimen
Porosity (%)
Permeability Coefficient
(mm/s)
10%
8.82 1.42 9.95 2.49
11.37 1.32 7.30 1.03
10.78 1.20 7.24 0.84
15%
14.03 1.69 16.23 4.66
16.23 1.91 16.20 6.05
16.42 1.83 15.46 5.20
20%
18.54 5.15 21.61 7.75
18.55 4.66 20.65 8.03
21.64 4.58 19.30 7.74
25%
24.63 7.16 24.06 13.9
23.82 6.10 26.28 12.4
26.64 11.2 26.66 13.4

9
FIGURE 3 Relationship between porosity and permeability coefficient of porous asphalt
studied.
FIGURE 4 Relationship between porosity and permeability coefficient of pervious concrete
studied.
From the test results on permeability coefficient and porosity obtained for the porous asphalt 207
and pervious concrete mixtures respectively, a detailed analysis of the relationships between 208
permeability and porosity of the two mixtures can be carried out. Computed in Table 4 are 209
some parameters that help to identify the different permeability-porosity characteristics of the 210
two types of porous materials. It is interesting to note from Table 4 the following 211
observations for the two materials tested: 212
Pervious concrete had higher hydraulic conductivity (i.e. permeability coefficient) 213
than porous asphalt at any given porosity level within the range of porosity tested – 214
At the four porosity levels tested, pervious concrete was found to have higher 215
k = 0.3001e0.1305P
R² = 0.8648
0
2
4
6
8
10
12
0 5 10 15 20 25 30
Per
mea
bil
ity c
oef
fici
ent,
k (m
m/s
)
Porosity, P (%)
Porous Asphalt
k = 0.5024e0.1324P
R² = 0.9219
0
2
4
6
8
10
12
14
16
18
20
0 5 10 15 20 25 30
Per
mea
bil
ity C
oef
fici
ent,
k
(mm
/s)
Porosity, P (%)
Pervious Concrete

10
permeability coefficient values than porous asphalt, and the difference became 216
larger as the porosity level increased. As seen from Table 4, the difference 217
increased from 0.781 mm/s at the porosity of 10% to 5.978 mm/s at the porosity of 218
25%. 219
The rate of increase of hydraulic conductivity (i.e. permeability coefficient) with 220
porosity was higher for pervious concrete than for porous asphalt – Table 4 indicates 221
that for the range of porosity values studied, the rate of increase of permeability 222
coefficient with porosity varied from 0.204 to 0.751 mm/s per percent rise in porosity 223
for porous asphalt, and the corresponding rates of increase for pervious concrete 224
were 0.355 and 1.340. That is, pervious concrete achieved higher gains in 225
permeability coefficient from increasing mix porosity than porous asphalt. 226
Conversely, it can be said that for every percent drop in porosity, pervious concrete 227
would suffer a higher loss in permeability coefficient than porous asphalt. 228
For both porous asphalt and pervious concrete, since their hydraulic conductivity (i.e. 229
permeability coefficient) increases exponentially with porosity, it is beneficial to raise 230
the initial design target porosity as much as practicable. For practical application of 231
porous pavements, it makes sense to raise the design target porosity to higher than 232
20% as the gain in permeability is substantial. 233
234
From the observations made above, it is of interest to examine statistically the 235
characteristics of the difference between the permeability properties of the two porous 236
materials. The two regression equations in the form of k = a●ebP are characterized by two 237
regression coefficients a and b. By means of statistical hypothesis testing, it is found that 238
there are no difference in the values of the coefficient b of the two regression equations at 95% 239
confidence level. However, the values of the coefficient a of the two equations are 240
statistically different at the same confidence level. These conclusions provide the 241
explanation to the differences in the magnitude of permeability coefficient and variations of 242
permeability with respect to porosity observed and highlighted in the preceding paragraphs. 243
TABLE 4 Rates of increase of permeability coefficient with porosity for porous asphalt and
pervious concrete mixtures
Porosity
Level
P%
(1)
Porous Asphalt Pervious Concrete
Difference between k
of Porous Asphalt and
Pervious Concrete
(6) = (4) - (2)
Permeability
Coefficient
k (mm/s)
(2)
Rate of
Increase
of k per %
Rise in P
(3)
Permeability
Coefficient
k (mm/s)
(4)
Rate of
Increase
of k per %
Rise in P
(5)
10% 1.107 0.204 1.888 0.355 0.781
15% 2.125 0.391 3.665 0.690 1.540
20% 4.081 0.751 7.115 1.340 3.034
25% 7.837 -- 13.815 -- 5.978

11
Comparison of Clogging Behaviors 244
As explained earlier in the description of the clogging process, in the clogging test of each 245
specimen, clogging material was added in ten equal amounts of 5.3g each so that the 246
changes in permeability could be measured and monitored as clogging developed. 247
Therefore, including the initial permeability value before the clogging procedure began, there 248
were 11 data points of permeability measurements that defined the permeability 249
deterioration trend caused by clogging. This section presents the clogging test results and 250
discusses the findings. 251
252
Plotted in Figure 5a are the clogging test results of the porous asphalt mixes studied. For 253
clarity in presentation and comparison, only the deterioration curve of the mean permeability 254
for each porosity level is plotted. For each of the four permeability deterioration curves (one 255
curve for each of the four target porosity levels studied), the range of measured permeability 256
values at each of the 10 stages of the clogging process is also indicated for each stage. The 257
corresponding clogging test results of the pervious concrete specimens are plotted in Figure 258
5b. To provide a direct comparison of the clogging behaviors of the porous asphalt and 259
pervious concrete studied, the two sets of permeability deterioration curves are plotted in 260
pairs in Figure 6 for each of the four porosity levels studied. 261
262
The permeability deterioration trends of both porous materials can be described by an 263
exponential relationship as shown by the following regression equations: 264
For porous asphalt (Porosity 10%) k = 1.177e-0.290N R2 = 0.992 (4) 265
(Porosity 15%) k = 2.478e-0.411N R2 = 0.974 (5) 266
(Porosity 20%) k = 4.375e-0.293N R2 = 0.991 (6) 267
(Porosity25%) k = 8.999e-0.213N R2 = 0.989 (7) 268
For pervious concrete (Porosity 10%) k = 1.369e-0.338N R2 = 0.996 (8) 269
(Porosity 15%) k = 7.065e-0.270N R2 = 0.949 (9) 270
(Porosity 20%) k = 9.801e-0.311N R2 = 0.981 (10) 271
(Porosity 25%) k = 12.287e-0.084N R2 = 0.967 (11) 272
where k = permeability coefficient in mm/s, and N = number of clogging cycle. 273
274
The following observations and findings can be made from the test results: 275
For porous asphalt mixtures, Figure 5a shows that the relative magnitude ranking of 276
the permeability of specimens of the four target porosity levels remained unchanged 277
throughout the clogging process. However, the magnitudes of the differences in 278
permeability coefficients of different target porosity levels decreased as the clogging 279
process progressed. This is also the case for the test results of pervious concrete 280
specimens shown in Figure 5b. These results suggest that, for both types of 281
mixtures, it is always advantageous to begin with a mixture with a higher initial 282
porosity (hence higher initial permeability) to achieve a higher level of permeability 283
throughout the entire service life of a porous pavement. 284
The permeability deterioration curves in Figures 5a and 5b suggest that, for both 285
porous asphalt and pervious concrete, there was a significant improvement in 286
permeability performance in the clogging test when the mixture porosity was 287
increased from 20% to 25%. This finding appears to provide a strong experimental 288

12
evidence to the common practice of specifying a porosity of more than 20% for 289
porous pavement materials. 290
Based on the permeability coefficient values at different stages of clogging 291
development, Figure 6 shows that at any given initial porosity level, pervious 292
concrete always performed better than porous asphalt by maintaining higher 293
permeability values throughout the entire clogging development period. The 294
difference between the performance of the two material types was smallest at the 295
porosity level of 10% (in the order of about 2 mm/s), and largest at the porosity level 296
of 25% (approximately of the order of 5 mm/s). 297
The variation of the measured permeability coefficient values obtained from three 298
replicate test specimens is represented by the range bars indicated in Figures 5a and 299
5b. Excluding the only exception of pervious concrete with 20% porosity, it can said 300
in general that for both porous asphalt and pervious concrete specimens, the higher 301
the porosity level, the higher was the variation among the measured permeability 302
coefficient data at a given stage of clogging test. This could be explained by the fact 303
that a mixture with a higher porosity would have more flows channels within it, and 304
there would be more possible patterns of clogging development than a mixture with a 305
lower porosity, thus leading to larger variations in the resulting permeability 306
coefficient values in the clogging tests of replicate specimens. 307
If we define that clogging is reached when the permeability deterioration curve begins 308
to level off and there are negligible changes in the permeability coefficient values 309
between successive clogging stages, then the terminal stage of each of the clogging 310
tests can be estimated from the test results of Figure 6. It can be seen that except 311
for the porous asphalt and pervious concrete specimens with the initial porosity of 312
25%, all the test specimens with lower initial porosity levels reached the terminal 313
clogging state before the 10th stage of clogging. This finding provides another 314
supporting experimental evidence for the practice by many highway agencies to 315
require design porosity of more than 20% for porous pavement mixes. 316
317
The clogging test results suggest that the pervious concrete mix was superior to the porous 318
asphalt mix for the test conditions studied. It is not possible to determine from the test 319
results the reasons or the factors contributing to their differences in clogging resistance 320
performance. Based on past studies (3, 4, 11-13), the factors that affect the clogging 321
behaviors of a porous material include (i) type of clogging materials, (ii) gradation of 322
aggregates in the mixture, and (iii) the type of binder. Factor (i) is ruled out because the 323
same type of clogging material was used for the clogging tests in this study. As for factor (ii), 324
the use of large size aggregates is known to improve permeability and clogging resistance, 325
but is unlikely to be a main reason in the present study since the coarse aggregate gradation 326
of pervious concrete used was finer than those of the porous asphalt mixtures, although no 327
fines were used in the pervious concrete mix. The most likely reason is probably the 328
properties of the binders used. Serving as the walls for flow channels in the porous mixture, 329
asphalt and concrete would exhibit different flow resistance. Their clogging resistance would 330
be affected by their adhesion properties with clogging materials. For instance, their Manning 331
roughness coefficients would be different, thereby contributing to different resistance to flows. 332
Further research is needed to study in detail the effects of these factors on the different 333
clogging resistance characteristics of the two porous materials. 334

13
335
(a) Test results on porous asphalt specimens
(b) Test results on pervious concrete specimens
FIGURE 5 Results of clogging tests
0.0
1.0
2.0
3.0
4.0
5.0
6.0
7.0
8.0
9.0
10.0
11.0
12.0
0 1 2 3 4 5 6 7 8 9 10
Pe
rme
abili
ty C
oe
ffic
ien
t, k
(m
m/s
)
Clogging Cycle
Porous Asphalt with Target Porosity P%
P = 10% P = 15%
P = 20% P = 25%
0
1
2
3
4
5
6
7
8
9
10
11
12
13
14
15
0 1 2 3 4 5 6 7 8 9 10
Pe
rme
abili
ty C
oe
ffic
ien
t, k
(m
m/s
)
Clogging Cycle
Pervious Concrete with Target Porosity P%
P = 10% P = 15%
P = 20% P = 25%

14
FIGURE 6 Comparison of permeability deterioration curves of porous asphalt and pervious
concrete mixtures studied.
SUMMARY AND CONCLUSIONS 336
337
The results of a laboratory clogging study have been reported and analyzed in this paper. 338
The study compared the permeability and clogging characteristics of two types of porous 339
pavement materials at four levels of porosity values: 10%, 15%, 20% and 25%. The two 340
porous materials studied were porous asphalt and pervious concrete. Three replicate 341
specimens were prepared at each target porosity level for each of the two test materials. In 342
the clogging test of each test specimen, a laboratory clogging procedure was adopted to 343
introduce a fixed amount of clogging material in 10 stages by means of a constant-head 344
apparatus. This procedure allowed permeability coefficient to be measured each stage and 345
enabled the permeability deterioration trend to be determined as clogging progressed. 346
347
The main findings of the laboratory test program can be summarized as follows: 348
For both the pervious concrete and the porous asphalt mixtures, the increase of 349
permeability coefficient k with porosity P can be described by an exponential 350
relationship of the form k = a●ebP where a and b are positive regression coefficients. 351
For both the pervious concrete and porous asphalt mixtures studied, their 352
permeability and clogging resistance increased substantially when the mixture 353
porosity was increased beyond 20%. These findings provide supporting 354
experimental evidence to the common practice of specifying a porosity of more than 355
20% for porous pavement materials. 356
PA 10%
PA 15%
PA 20%
PA 25%
PC 10%
PC 15%
PC 20%
PC 25%
0
1
2
3
4
5
6
7
8
9
10
11
12
13
14
0 1 2 3 4 5 6 7 8 9 10
Per
mea
bil
ity
Co
effi
cien
t, k
(m
m/s
)
Clogging Cycle
PA 10% PA 15% PA 20% PA 25%
PC 10% PC 15% PC 20% PC 25%
Legend:PA = Porous AsphaltPC = Pervious ConcreteNumerical values indicate porosity %

15
At all four porosity levels studied, the pervious concrete specimens gave higher initial 357
permeability than the porous asphalt specimens. The difference became larger as 358
the porosity level increased. 359
For both the pervious concrete and the porous asphalt mixtures, the deterioration 360
trends of permeability coefficient k as a function of clogging cycles N can be 361
described by an exponential relationship of the form k = a●e-bN where a and b are 362
positive regression coefficients. 363
Comparing the permeability deterioration of pervious concrete and porous asphalt 364
specimens of the same target porosity level, it was found that pervious concrete 365
always performed better than porous asphalt by maintaining higher permeability 366
coefficient values throughout the entire clogging development period. The difference 367
between the performance of the two material types increased with porosity. 368
369
370
REFERENCES 371
1. Made, A. M. and Rogge, S. Development of High Quality Pervious Concrete 372
Specifications for Maryland Conditions, Maryland Department of Transportation, Project 373
number SP009B4F, Final report, 2013, pp 1- 110. 374
2. Agostinacchio, M. and Cuomo, G. Noise Emission Comparison between Porous 375
Concrete and Porous Asphalt Road Pavements. Proceedings 10th International 376
Symposium on Concrete Roads, Brussels, Belgium, 8-22 September 2006, pp 1-10. 377
3. Florida Concrete and Products Association (FCPA). Pervious Pavement Manual, FCPA, 378
Orlando, FL, 1990, 57pp. 379
4. Shimeno, S., Oi, A. and Tanaka, T. Evaluation and Further Development of Porous 380
Asphalt Pavement with 10 Years Experience in Japanese Expressways. Proceedings 381
11th Int Conf on Asphalt Pavements, 1-6 August, Nagoya, Japan, 2010, Vol. 1, pp43-52. 382
5. Bendtsen, H. Porous Asphalt Pavement and Noise Reduction over a Long Period. 383
EURO-NOISE, Munich, Germany, 1998. 384
6. British Standards Institute (BSI). Bituminous Mixtures: Material Specifications: Porous 385
Asphalt. British Standards Institute, London, UK, 2006. 386
7. Camomilla, G., Malgarini, M., and Gervasio, S. Sound Absorption and Winter 387
Performance of Porous Asphalt Pavement. Transportation Research Record, No. 1265, 388
1990, pp. 1-8. 389
8. Youngs, A. Pervious Concrete It’s for Real. Presented at Workshop on Pervious 390
Concrete and Parking Area Design, Omaha, 2005. 391
9. Tennis, P.D, Leming M.L, Akers D.J. Pervious Concrete Pavements. Report EB302, 392
Portland Cement Association Skokie Illinois and National Ready Mixed Concrete 393
Association, Maryland: Silver Spring, pp. 1 – 32. 394
10. Kajio, S., Tanaka, S., Tomita, R., Noda, E., and Hashimoto, S. Properties of Porous 395
Concrete with High Strength. Proceedings 8th international Symposium on Concrete 396
Roads, Lisbon, 1998, pp. 171– 177. 397
11. Fwa T. F., Tan, S. A. and Chuai C. T., Permeability Measurement of Base Materials 398
using Falling-Head Test Apparatus. Transportation Research Record, No. 1615, 1998, 399
pp. 94-99. 400

16
12. Fwa, T. F., Tan S. A. and Guwe Y. K., Laboratory Evaluation of Clogging Potential of 401
Porous Asphalt Mixtures. Transportation Research Record, No. 1681, 2002, pp. 43-49. 402
13. Tan, S. A., Fwa T. F. and Guwe Y. K., Laboratory Measurements and Analysis of 403
Clogging Mechanism of Porous Asphalt Mixes. Journal of Testing and Evaluation, Vol. 404
28, No. 3, 2000, pp. 207-216. 405
14. ACI committee 522. Report on Previous Concrete. Report ACI 522R-10, American 406
Concrete Institute, Farmington Hills, Michigan, USA, 2010, pp 1-37. 407
15. ASTM International Standard C33/C33M–08, Standard Specification for Concrete 408
Aggregates, ASTM International, 2008, 100 Barr Harbor Drive, PO Box C700, West 409
Conshohocken, PA, 19428-2959 USA. 410
16. ASTM International Standard C150/C150M–07, Standard Specification for Portland 411
Cement, ASTM International, 2007, 100 Barr Harbor Drive, PO Box C700, West 412
Conshohocken, PA, 19428-2959 USA. 413
414
415

17
LIST OF TABLES AND FIGURE:
Table 1 Aggregate gradation and mix composition of porous asphalt mix designs studied.
Table 2 Mix designs of pervious concrete studied.
(a) Mix proportions (b) Aggregate gradation
Table 3 Porosity and permeability values of test specimens.
Table 4 Rates of increase of permeability with porosity for porous asphalt and pervious
concrete mixtures.
Figure 1 Schematic diagram of permeability and clogging test set-up.
Figure 2 Gradation of residual soil.
Figure 3 Relationship between porosity and permeability of porous asphalt studied.
Figure 4 Relationship between porosity and permeability of pervious concrete studied.
Figure 5 Results of clogging tests
(a) Test results on porous asphalt specimens
(b) Test results on pervious concrete specimens
Figure 6 Comparison of permeability deterioration curves of porous asphalt and pervious
concrete mixtures studied.