Foods or Bioactive Constituents of Foods as Chemopreventives in Cell Lines After Simulated

molecules
Article
Comparison of Multiple Bioactive Constituents in the Corollaand Other Parts of Abelmoschus manihot
Shengxin Yin 1, Yuqi Mei 1, Lifang Wei 1, Lisi Zou 1, Zhichen Cai 1 , Nan Wu 1, Jiahuan Yuan 1, Xunhong Liu 1,*,Haitao Ge 2, Dianguang Wang 2 and Dandan Wang 2
�����������������
Citation: Yin, S.; Mei, Y.; Wei, L.; Zou,
L.; Cai, Z.; Wu, N.; Yuan, J.; Liu, X.;
Ge, H.; Wang, D.; et al. Comparison
of Multiple Bioactive Constituents in
the Corolla and Other Parts of
Abelmoschus manihot. Molecules 2021,
26, 1864. https://doi.org/10.3390/
molecules26071864
Academic Editors:
Ana Estévez-Braun and Zipora Tietel
Received: 26 January 2021
Accepted: 18 March 2021
Published: 25 March 2021
Publisher’s Note: MDPI stays neutral
with regard to jurisdictional claims in
published maps and institutional affil-
iations.
Copyright: © 2021 by the authors.
Licensee MDPI, Basel, Switzerland.
This article is an open access article
distributed under the terms and
conditions of the Creative Commons
Attribution (CC BY) license (https://
creativecommons.org/licenses/by/
4.0/).
1 College of Pharmacy, Nanjing University of Chinese Medicine, Nanjing 210023, China;[email protected] (S.Y.); [email protected] (Y.M.); [email protected] (L.W.);[email protected] (L.Z.); [email protected] (Z.C.); [email protected] (N.W.);[email protected] (J.Y.)
2 SZYY Group Pharmaceutical Limited, Taizhou 225500, China; [email protected] (H.G.);[email protected] (D.W.); [email protected] (D.W.)
* Correspondence: [email protected]; Tel./Fax: +86-25-8581-1524
Abstract: Abelmoschus manihot (L.) Medic (AM), called Huangshukui in Chinese, is a widely usedmedicinal plant. Each part of AM has medicinal value, including Abelmoschi Radix (AR), Abel-moschi Herba (AH), Abelmoschi Folium (AF), Abelmoschi Corolla (AC), and Abelmoschi Semen(AS). However, only AC is documented in the Chinese Pharmacopoeia. In order to investigatewhether there is any difference between AC and the other parts of AM, an analytical method basedon ultra-fast performance liquid chromatography coupled with triple quadrupole-linear ion trapmass spectrometry (UFLC-QTRAP-MS/MS) was established for the simultaneous determination of35 constituents in different parts of AM. Moreover, principal components analysis (PCA) and partialleast squares discriminant analysis (PLS-DA) were applied to classify and evaluate the different partsof AM based on the content of the 35 constituents. The total contents of the 35 constituents in ACwere significantly higher than in the other parts of AM and the results revealed significant differencesbetween AC and the other parts of AM. Eight constituents were remarkably related to the sampleclassifications. This research does not just provide the basic information for revealing the distributionpatterns in different parts of AM from the same origin, but also complements some of the scientificdata for the comprehensive quality evaluation of AC.
Keywords: Abelmoschus manihot; root; stem; leaf; corolla; seed; bioactive constituents; distribution pat-terns
1. Introduction
Abelmoschi Corolla (AC), which is the dried corolla of Abelmoschus manihot (AM) inthe Chinese Pharmacopoeia (2020 version) [1], has widespread use in the Chinese medicineindustry. It is widely applied in the treatment of inflammation, primary glomerular diseaseand type 2 diabetic nephropathy [2–4] in China, Papua New Guinea, Vanuatu, Fiji and NewCaledonia [5]. In addition, other parts of AM, including Abelmoschi Radix (AR), Abel-moschi Herba (AH), Abelmoschi Folium (AF), and Abelmoschi Semen (AS) have also beenrecorded in previous works for medicinal purposes [6]. Chemical composition is the basisof the pharmacological action of traditional Chinese medicine. Phytochemical analysishas revealed that AC contains multiple chemical constituents, such as flavonoids [7], or-ganic acids [8], nucleosides, and amino acids [9,10]. Among these constituents, flavonoidsand organic acids possess various pharmacological activities including anti-inflammatory,antioxidant, anti-tumor [11–13], and neuroprotective effects [14,15]; nucleosides are biolog-ically active ingredients that enhance immunity and antiviral effects [16]; amino acids arethe essential nutrients conducive to the human body, which also exhibit excellent pharma-cological activity, including antioxidant and anti-hypertensive activity [17,18]. The effects
Molecules 2021, 26, 1864. https://doi.org/10.3390/molecules26071864 https://www.mdpi.com/journal/molecules
Molecules 2021, 26, 1864 2 of 14
of these constituents are consistent with the pharmacological effects of AC. Meanwhile,other parts of AM have similar chemicals to AC and studies have shown that AH and AFhave the effect of promoting wound healing and analgesia, respectively [19,20]. However,except for AC, other parts of AM have not been used frequently while a comparative studyamong different parts of AM is also in a preliminary stage. Therefore, it is necessary todevelop a reliable method to study the distribution patterns of metabolites in differentparts of AM, with the hope of providing basic data for quality evaluation research on AC.
In the present study, a reliable and comprehensive method based on ultra-fast per-formance liquid chromatography coupled with triple quadrupole-linear ion trap massspectrometry (UFLC-QTRAP-MS/MS) was established for the simultaneous determinationof 35 constituents in the different parts of AM, including 14 flavonoids, eight organic acids,three nucleosides, and 10 amino acids. Furthermore, multivariate statistical analysis wasapplied to this study based on the content of the 35 constituents. Principal componentsanalysis (PCA) was utilized to classify the samples [21,22]. Then partial least squaresdiscriminant analysis (PLS-DA) was performed to find out the important metabolites thatcause classification [23]. This research provides the basic information for revealing theaccumulation laws of metabolites in different parts of AM from the same origin, and alsocomplements some of the scientific data for the comprehensive quality evaluation of AC.
2. Results2.1. Optimization of Extraction Conditions
The optimal extraction condition was 70% methanol as the extraction solvent, witha solid–liquid ratio of 1:40 g/mL, and ultrasonic extraction for 30 min using the singlefactor test.
2.2. Optimization of UFLC and Mass Spectrometric Conditions
After experimental verification analysis, chromatographic separation was performedon an XBridge®C18 column (4.6 mm × 100 mm, 3.5 µm) at 30 ◦C with a gradient elution of0.1% (v/v) aqueous formic acid water solution (A)–methanol:acetonitrile (1:1) (B) at a flowrate of 0.5 mL/min. The injection volume was 2 µL and the elution gradient was optimizedas follows: 0–5 min, 2–20% B; 5–13 min, 20–25% B; 13–26 min, 25–30% B; 26–28 min,30–75% B; 28–31 min, 75–95% B.
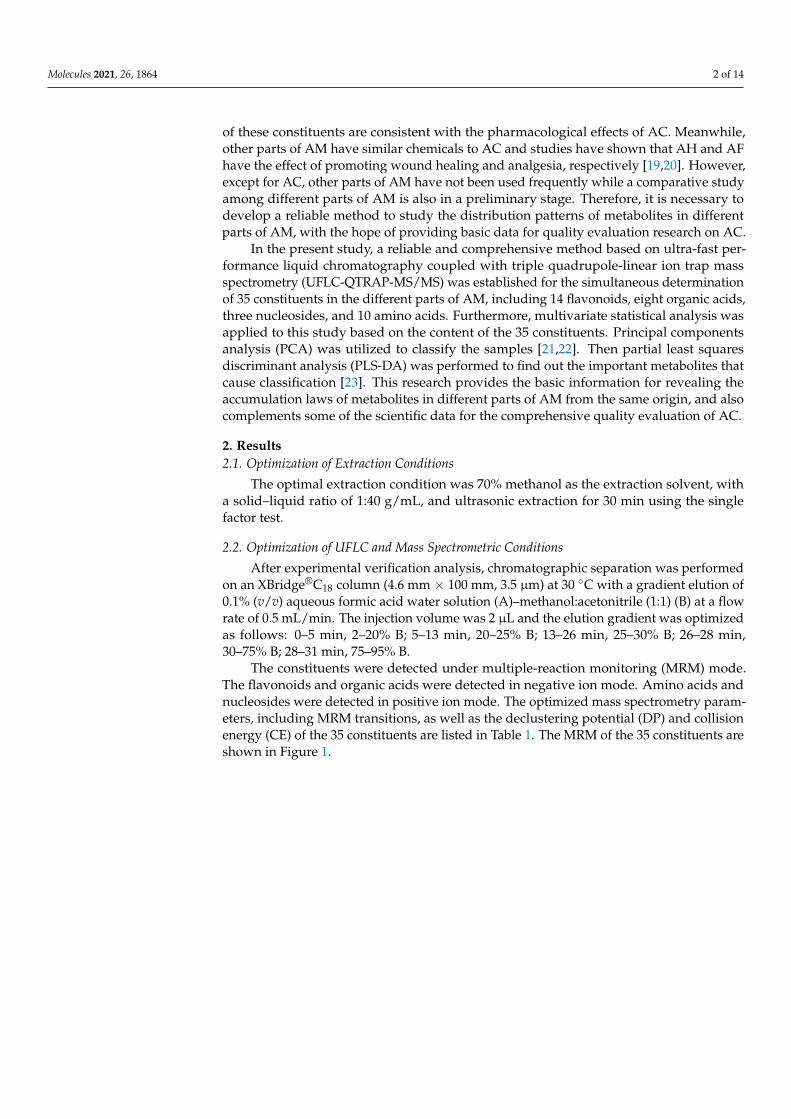
The constituents were detected under multiple-reaction monitoring (MRM) mode.The flavonoids and organic acids were detected in negative ion mode. Amino acids andnucleosides were detected in positive ion mode. The optimized mass spectrometry param-eters, including MRM transitions, as well as the declustering potential (DP) and collisionenergy (CE) of the 35 constituents are listed in Table 1. The MRM of the 35 constituents areshown in Figure 1.

Molecules 2021, 26, 1864 3 of 14
Molecules 2021, 26, x FOR PEER REVIEW 3 of 14
Figure 1. Representative extract ion chromatograms (XIC) of multiple-reaction monitoring (MRM) chromatograms of the 35investigated constituents. (The peak numbers denoted are the same as those in Table 1).
Molecules 2021, 26, 1864 4 of 14
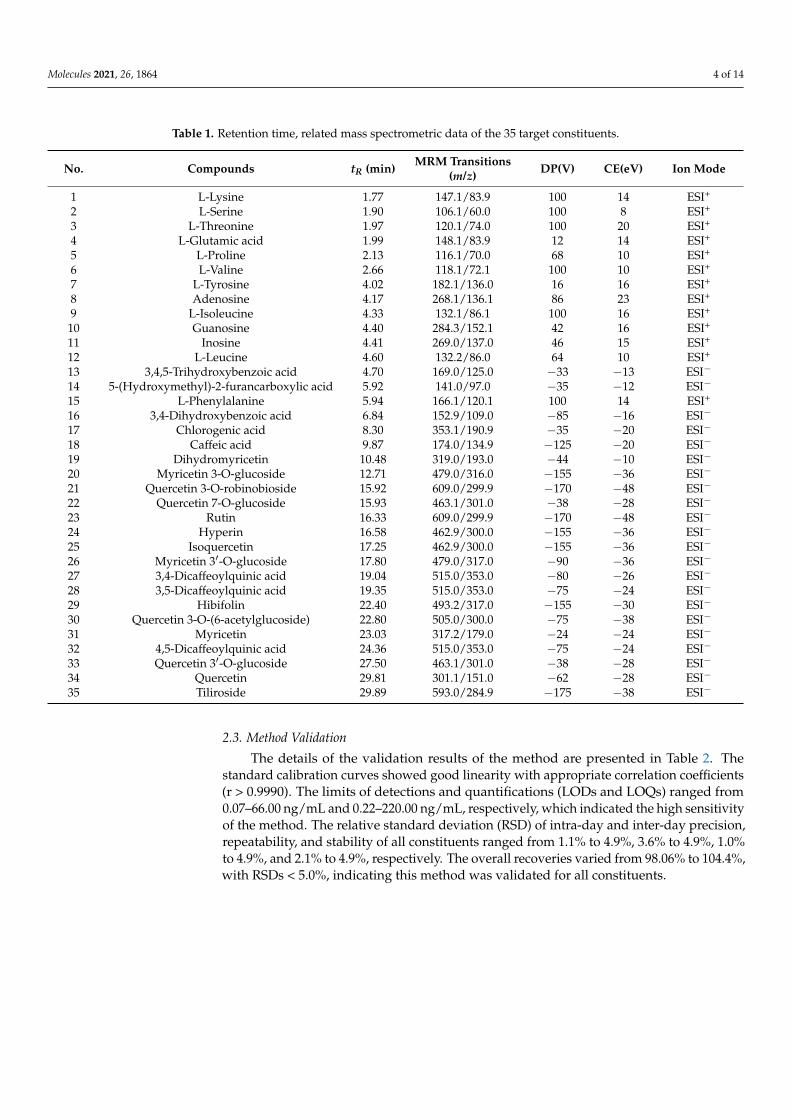
Table 1. Retention time, related mass spectrometric data of the 35 target constituents.
No. Compounds tR (min) MRM Transitions(m/z) DP(V) CE(eV) Ion Mode
1 L-Lysine 1.77 147.1/83.9 100 14 ESI+
2 L-Serine 1.90 106.1/60.0 100 8 ESI+
3 L-Threonine 1.97 120.1/74.0 100 20 ESI+
4 L-Glutamic acid 1.99 148.1/83.9 12 14 ESI+
5 L-Proline 2.13 116.1/70.0 68 10 ESI+
6 L-Valine 2.66 118.1/72.1 100 10 ESI+
7 L-Tyrosine 4.02 182.1/136.0 16 16 ESI+
8 Adenosine 4.17 268.1/136.1 86 23 ESI+
9 L-Isoleucine 4.33 132.1/86.1 100 16 ESI+
10 Guanosine 4.40 284.3/152.1 42 16 ESI+
11 Inosine 4.41 269.0/137.0 46 15 ESI+
12 L-Leucine 4.60 132.2/86.0 64 10 ESI+
13 3,4,5-Trihydroxybenzoic acid 4.70 169.0/125.0 −33 −13 ESI−
14 5-(Hydroxymethyl)-2-furancarboxylic acid 5.92 141.0/97.0 −35 −12 ESI−
15 L-Phenylalanine 5.94 166.1/120.1 100 14 ESI+
16 3,4-Dihydroxybenzoic acid 6.84 152.9/109.0 −85 −16 ESI−
17 Chlorogenic acid 8.30 353.1/190.9 −35 −20 ESI−
18 Caffeic acid 9.87 174.0/134.9 −125 −20 ESI−
19 Dihydromyricetin 10.48 319.0/193.0 −44 −10 ESI−
20 Myricetin 3-O-glucoside 12.71 479.0/316.0 −155 −36 ESI−
21 Quercetin 3-O-robinobioside 15.92 609.0/299.9 −170 −48 ESI−
22 Quercetin 7-O-glucoside 15.93 463.1/301.0 −38 −28 ESI−
23 Rutin 16.33 609.0/299.9 −170 −48 ESI−
24 Hyperin 16.58 462.9/300.0 −155 −36 ESI−
25 Isoquercetin 17.25 462.9/300.0 −155 −36 ESI−
26 Myricetin 3′-O-glucoside 17.80 479.0/317.0 −90 −36 ESI−
27 3,4-Dicaffeoylquinic acid 19.04 515.0/353.0 −80 −26 ESI−
28 3,5-Dicaffeoylquinic acid 19.35 515.0/353.0 −75 −24 ESI−
29 Hibifolin 22.40 493.2/317.0 −155 −30 ESI−
30 Quercetin 3-O-(6-acetylglucoside) 22.80 505.0/300.0 −75 −38 ESI−
31 Myricetin 23.03 317.2/179.0 −24 −24 ESI−
32 4,5-Dicaffeoylquinic acid 24.36 515.0/353.0 −75 −24 ESI−
33 Quercetin 3′-O-glucoside 27.50 463.1/301.0 −38 −28 ESI−
34 Quercetin 29.81 301.1/151.0 −62 −28 ESI−
35 Tiliroside 29.89 593.0/284.9 −175 −38 ESI−
2.3. Method Validation
The details of the validation results of the method are presented in Table 2. Thestandard calibration curves showed good linearity with appropriate correlation coefficients(r > 0.9990). The limits of detections and quantifications (LODs and LOQs) ranged from0.07–66.00 ng/mL and 0.22–220.00 ng/mL, respectively, which indicated the high sensitivityof the method. The relative standard deviation (RSD) of intra-day and inter-day precision,repeatability, and stability of all constituents ranged from 1.1% to 4.9%, 3.6% to 4.9%, 1.0%to 4.9%, and 2.1% to 4.9%, respectively. The overall recoveries varied from 98.06% to 104.4%,with RSDs < 5.0%, indicating this method was validated for all constituents.

Molecules 2021, 26, 1864 5 of 14
Table 2. Regression equation, limits of detections (LODs), limits of quantifications (LOQs), precision, repeatability, stability, and recovery of the 35 investigated constituents.
No. Compounds Regression Equation rLinearRange
(ng/mL)
LOD(ng/mL)
LOQ(ng/mL)
Precision(RSD,%) Repeatability(RSD, %)
(n = 6)
Stability(RSD, %)
(n = 6)
Recovery(%)
Intra-Day (n= 6)
Inter-Day (n= 9) Mean RSD
1 L-Lysine Y = 1310X − 35,500 0.9994 50.30–2515 7.86 26.20 2.7 4.9 4.9 2.8 104.4 4.22 L-Serine Y = 788X − 27,600 0.9991 51.20–10,240 9.85 32.82 2.8 4.1 2.0 2.4 101.1 1.33 L-Threonine Y = 853X − 17,100 0.9992 51.60–5160 12.48 41.61 4.8 4.3 3.3 3.0 100.3 4.04 L-Glutamic acid Y = 2470X − 116,000 0.9998 51.40–5140 10.42 34.73 4.3 4.3 4.8 3.8 101.1 3.75 L-Proline Y = 3720X + 66,700 0.9999 25.20–10,080 2.04 6.81 3.7 4.8 2.9 3.4 100.3 1.16 L-Valine Y = 8050X − 312,000 0.9996 49.90–9980 14.39 47.98 3.8 4.9 2.7 2.1 104.4 2.37 L-Tyrosine Y = 4610X + 22,500 0.9994 12.43–4970 1.55 5.18 2.9 4.1 3.6 4.7 99.04 4.68 Adenosine Y = 18,100X + 212,000 0.9997 1.00–2500 0.22 0.74 3.3 4.9 3.6 3.2 99.64 0.229 L-Isoleucine Y = 14,100X + 199,000 0.9990 25.00–5000 5.07 16.89 2.8 4.9 3.2 3.3 101.7 4.4
10 Guanosine Y = 7050X + 94,000 0.9994 1.03–2560 0.15 0.51 2.6 4.5 4.6 4.5 100.2 0.3811 Inosine Y = 6560X + 99,300 0.9994 4.96–1240 1.24 4.13 2.9 4.0 3.2 3.4 100.0 0.4412 L-Leucine Y = 8810X + 397,000 0.9993 12.63–2520 1.84 6.13 1.1 4.2 2.9 3.8 98.43 4.313 3,4,5-Trihydroxybenzoic acid Y = 4330X + 49,300 0.9997 13.31–532 3.73 12.44 4.7 4.3 4.9 4.9 99.43 2.1
145-(Hydroxymethyl)-2-
furancarboxylicacid
Y = 2400X − 20,200 0.9992 5.07–5070 1.36 4.53 4.6 4.9 4.9 4.3 103.3 2.6
15 L-Phenylalanine Y = 17,900X + 779,000 0.9997 0.50–2480 0.14 0.46 3.9 4.8 1.9 4.9 99.53 3.216 3,4-Dihydroxybenzoic acid Y = 12,400X + 78,100 0.9996 5.21–261 1.09 3.62 3.7 4.3 3.4 2.8 99.46 1.717 Chlorogenic acid Y = 6400X + 97,400 0.9994 2.48–2480 0.41 1.38 4.6 4.3 2.1 4.9 100.4 4.318 Caffeic acid Y = 17,400X + 200,000 0.9990 2.48–1238 0.73 2.43 3.6 4.8 4.6 4.3 99.41 2.019 Dihydromyricetin Y = 5250X + 68,800 0.9991 2.54–1268 0.51 1.71 4.4 4.8 3.4 4.5 100.8 4.920 Myricetin 3-O-glucoside Y = 4650X + 155,000 0.9999 5.03–10,050 0.37 1.23 4.7 4.8 2.5 4.2 100.0 4.921 Quercetin 3-O-robinobioside Y = 2630X − 20,500 0.9999 5.03–10,100 0.70 2.34 2.5 4.2 1.0 4.2 101.5 2.822 Quercetin 7-O-glucoside Y = 7500X + 79,400 0.9992 2.55–1273 0.37 1.24 4.2 4.5 2.9 4.8 103.3 4.223 Rutin Y = 3110X − 33,100 0.9999 2.51–5020 0.22 0.72 3.5 4.9 2.3 4.4 100.9 1.024 Hyperin Y = 5790X + 318,000 0.9997 5.05–20,200 0.20 0.67 4.5 4.9 1.1 4.7 99.84 1.225 Isoquercetin Y = 5230X − 6260 0.9999 5.05–20,200 0.92 3.06 4.6 4.2 1.0 4.5 100.4 1.226 Myricetin 3′-O-glucoside Y = 6460X − 104,000 0.9997 5.25–10.500 1.23 4.10 2.7 4.9 1.8 4.2 100.2 1.427 3,4-Dicaffeoylquinic acid Y = 3300X − 153,000 0.9998 12.63–1263 3.01 10.03 4.9 4.8 3.8 3.9 101.7 1.228 3,5-Dicaffeoylquinic acid Y = 2760X − 19,000 0.9993 5.02–1255 1.47 4.90 2.4 3.6 3.2 4.8 98.06 1.8
29 Hibifolin Y = 1620X − 1320,000 0.9991 253.00–50,600 66.00 220.00 4.2 4.8 4.6 4.4 100.6 1.2
30 Quercetin 3-O-(6-acetylglucoside) Y = 7120X + 122,000 0.9998 2.56–5125 0.17 0.56 4.6 4.8 3.8 4.3 99.41 2.131 Myricetin Y = 4150X − 22,300 0.9990 5.01–5010 1.25 4.18 4.7 4.9 3.4 2.8 101.9 2.632 4,5-Dicaffeoylquinic acid Y = 4410X − 101,000 0.9998 12.43–2490 1.61 5.36 4.5 4.8 4.7 4.3 101.0 2.733 Quercetin 3′-O-glucoside Y = 7930X + 503,000 0.9993 5.00–10,000 0.32 1.07 3.9 4.4 1.8 4.2 99.86 1.334 Quercetin Y = 9450X − 17,300 1.0000 0.51–2-560 0.08 0.27 3.9 4.7 4.9 3.8 102.1 1.635 Tiliroside Y = 9040X + 18,100 0.9999 0.51–256 0.07 0.22 4.1 4.4 3.7 4.0 101.0 3.2

Molecules 2021, 26, 1864 6 of 14
2.4. Quantitative Analysis of Samples
The developed UFLC-QTRAP-MS/MS method was subsequently applied to the simul-taneous determination of multiple constituents in different parts of AM. The quantitativeresults of the 35 constituents are presented in Tables S1 and S2. As shown in Figure 2.The contents of flavonoids and amino acids account for a high proportion in the differentparts of AM, and the contents of nucleosides and organic acids in each part of AM areat a relatively low level. By comparison of the chemical content in the different parts ofAM, we found that AC was quite different from the others. Total contents of flavonoidsin AC ranged from 60,905.55–69,851.44 µg/g, while the contents of other parts rangedfrom 728.30–4600.97 µg/g. Total contents of amino acids in AC ranged from 23,114.76–26,704.54 µg/g, while the contents of other parts ranged from 2223.47–5814.70 µg/g. Theflavonoids and amino acids in AM were mainly distributed in AC. The ranges of nucle-osides were 204.32–277.00 µg/g in AC and 41.07–279.95 µg/g in other parts of AM. Theranges of organic acids were 554.90–624.45 µg/g in AC and 71.00–178.19 µg/g in otherparts of AM, respectively. This result proved that the proportion of nucleosides and organicacids in each part was relatively low.
Molecules 2021, 26, x FOR PEER REVIEW 6 of 14
2.4. Quantitative Analysis of Samples The developed UFLC-QTRAP-MS/MS method was subsequently applied to the sim-
ultaneous determination of multiple constituents in different parts of AM. The quantita-tive results of the 35 constituents are presented in Tables S1–S2. As shown in Figure 2. The contents of flavonoids and amino acids account for a high proportion in the different parts of AM, and the contents of nucleosides and organic acids in each part of AM are at a relatively low level. By comparison of the chemical content in the different parts of AM, we found that AC was quite different from the others. Total contents of flavonoids in AC ranged from 60,905.55–69,851.44 μg/g, while the contents of other parts ranged from 728.30–4600.97 μg/g. Total contents of amino acids in AC ranged from 23,114.76–26,704.54 μg/g, while the contents of other parts ranged from 2223.47–5814.70 μg/g. The flavonoids and amino acids in AM were mainly distributed in AC. The ranges of nucleosides were 204.32–277.00 μg/g in AC and 41.07–279.95 μg/g in other parts of AM. The ranges of or-ganic acids were 554.90–624.45 μg/g in AC and 71.00–178.19 μg/g in other parts of AM, respectively. This result proved that the proportion of nucleosides and organic acids in each part was relatively low.
Figure 2. The content of four types of constituents in different parts of Abelmoschus manihot.
2.5. Distribution of Bioactive Constituents among AC and Other Parts of AM PCA was performed to classify and distinguish different parts of AM according to the
contents of the 35 constituents. The first two principal components accounted for more than 80%, which could be used to represent the overall information of the samples (R2X [1] = 0.748, R2X [2] = 0.0817). As shown in Figure 3. The PCA scores plot indicated that AC and other parts of AM were divided into two clusters. Samples of AC were gathered in the positive axis of t [1], while AR, AH, AF, and AS were distributed in the negative axis of t [1]. It is obvious that there were significant differences between AC and other parts of AM.
Figure 2. The content of four types of constituents in different parts of Abelmoschus manihot.
2.5. Distribution of Bioactive Constituents among AC and Other Parts of AM
PCA was performed to classify and distinguish different parts of AM according tothe contents of the 35 constituents. The first two principal components accounted for morethan 80%, which could be used to represent the overall information of the samples (R2X[1] = 0.748, R2X [2] = 0.0817). As shown in Figure 3. The PCA scores plot indicated that ACand other parts of AM were divided into two clusters. Samples of AC were gathered in thepositive axis of t [1], while AR, AH, AF, and AS were distributed in the negative axis of t [1].It is obvious that there were significant differences between AC and other parts of AM.

Molecules 2021, 26, 1864 7 of 14Molecules 2021, 26, x FOR PEER REVIEW 7 of 14
Figure 3. The principal component analysis (PCA) scores scatter plot of different parts of Abelmoschus manihot.
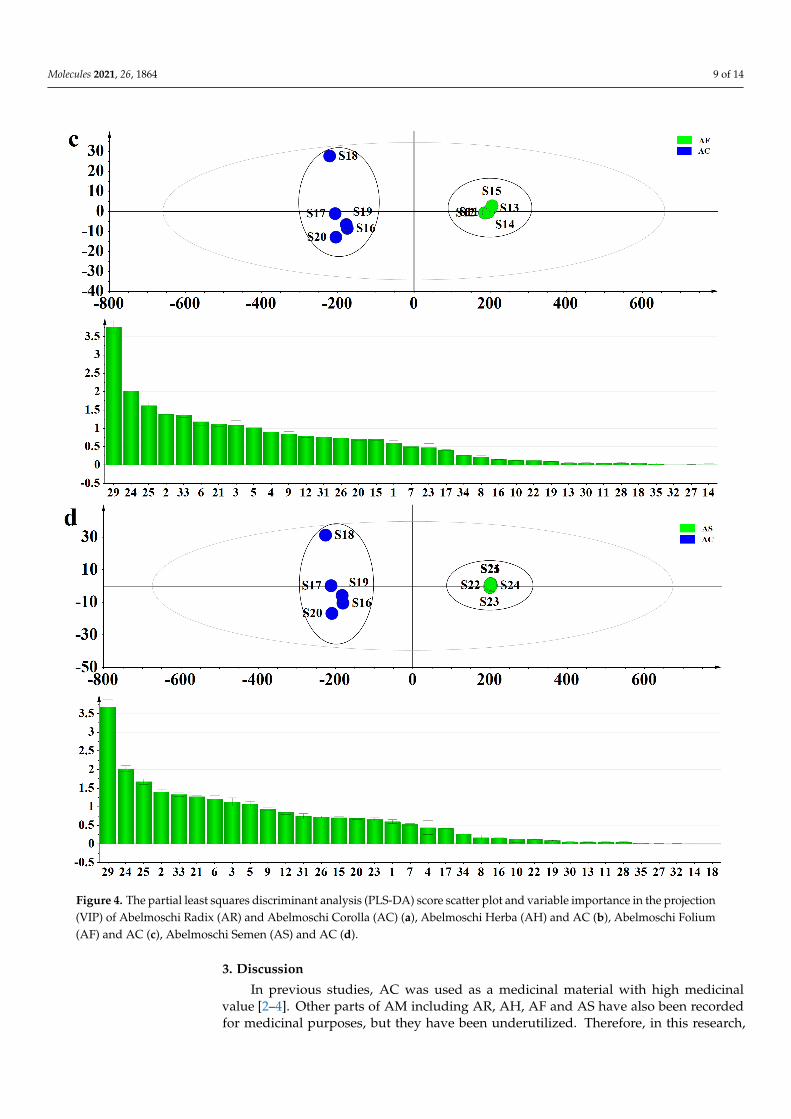
PLS-DA, a supervised pattern recognition method, was performed to differentiate AC and other parts of AM (AR, AH, AF, AS), and to find out the important constituents that cause the differences with variable importance in the projection (VIP) values. The PLS-DA score scatter plot and VIP values are shown in Figure 4a–d. The established PLS-DA model showed good adaptability (R2X = 0.991, 0.906, 0.995 and 0.995, R2Y = 0.998, 0.997, 0.997, and 0.998) and predictability (Q2 = 0.996, 0.992, 0.993, and 0.995). AR and AC, AH and AC, AF and AC, AS and AC were all separated into two clusters along the PC1 axis. The result indicated that the differences of constituents between AC and other parts of AM were remarkable. The VIP value was used to describe the contribution of each var-iable to the model and explore the differential constituents for the classification of AC and other parts of AM. A compound was selected as a potential chemical marker when the VIP value was greater than 1.0. Finally, three amino acids and five flavonoids including L-serine (2), L-threonine (3), L-valine (6), quercetin 3-O-robinobioside (21), hyperin (24), isoquercetin (25), hibifolin (29), quercetin 3′-O-glucoside (33) were screened out to dis-criminate AC and other parts. The VIP values of these constituents were all greater than 1.0 in the four sets of comparisons. Therefore, these constituents could be selected as chemical markers to distinguish AC and other parts of AM.
Figure 3. The principal component analysis (PCA) scores scatter plot of different parts of Abelmoschus manihot.
PLS-DA, a supervised pattern recognition method, was performed to differentiate ACand other parts of AM (AR, AH, AF, AS), and to find out the important constituents thatcause the differences with variable importance in the projection (VIP) values. The PLS-DAscore scatter plot and VIP values are shown in Figure 4a–d. The established PLS-DA modelshowed good adaptability (R2X = 0.991, 0.906, 0.995 and 0.995, R2Y = 0.998, 0.997, 0.997,and 0.998) and predictability (Q2 = 0.996, 0.992, 0.993, and 0.995). AR and AC, AH andAC, AF and AC, AS and AC were all separated into two clusters along the PC1 axis. Theresult indicated that the differences of constituents between AC and other parts of AMwere remarkable. The VIP value was used to describe the contribution of each variable tothe model and explore the differential constituents for the classification of AC and otherparts of AM. A compound was selected as a potential chemical marker when the VIP valuewas greater than 1.0. Finally, three amino acids and five flavonoids including L-serine (2),L-threonine (3), L-valine (6), quercetin 3-O-robinobioside (21), hyperin (24), isoquercetin(25), hibifolin (29), quercetin 3′-O-glucoside (33) were screened out to discriminate AC andother parts. The VIP values of these constituents were all greater than 1.0 in the four setsof comparisons. Therefore, these constituents could be selected as chemical markers todistinguish AC and other parts of AM.

Molecules 2021, 26, 1864 8 of 14Molecules 2021, 26, x FOR PEER REVIEW 8 of 14
Figure 4. Cont.
Molecules 2021, 26, 1864 9 of 14Molecules 2021, 26, x FOR PEER REVIEW 9 of 14
Figure 4. The partial least squares discriminant analysis (PLS-DA) score scatter plot and variable importance in the pro-jection (VIP) of Abelmoschi Radix (AR) and Abelmoschi Corolla (AC) (a), Abelmoschi Herba (AH) and AC (b), Abelmoschi Folium (AF) and AC (c), Abelmoschi Semen (AS) and AC (d).
3. Discussion In previous studies, AC was used as a medicinal material with high medicinal value
[2–4]. Other parts of AM including AR, AH, AF and AS have also been recorded for me-dicinal purposes, but they have been underutilized. Therefore, in this research, we sought to establish a method for simultaneous determination of multiple constituents. Thirty
Figure 4. The partial least squares discriminant analysis (PLS-DA) score scatter plot and variable importance in the projection(VIP) of Abelmoschi Radix (AR) and Abelmoschi Corolla (AC) (a), Abelmoschi Herba (AH) and AC (b), Abelmoschi Folium(AF) and AC (c), Abelmoschi Semen (AS) and AC (d).
3. Discussion
In previous studies, AC was used as a medicinal material with high medicinalvalue [2–4]. Other parts of AM including AR, AH, AF and AS have also been recordedfor medicinal purposes, but they have been underutilized. Therefore, in this research,

Molecules 2021, 26, 1864 10 of 14
we sought to establish a method for simultaneous determination of multiple constituents.Thirty eight ingredients including 2′-deoxyadenosine, thymidine, 2,4-dihydroxybenzoicacid and 35 constituents determined in this article were selected as initial options. However,2′-deoxyadenosine, thymidine, and 2,4-dihydroxybenzoic acid only had weak MS responseand low concentration in samples, so they were eliminated. The selected 35 constituentsbasically summarize all the chemical structural types of the bioactive constituents in AM, sotheir content variation can profile the distribution pattern of bioactive constituents in differ-ent parts of AM. Among the 35 target constituents, some are extremely similar in polarity,such as the isomers of hyperin, isoquercetin, and quercetin 7-O-glucoside while the contentof the different constituents varied greatly. Therefore, UFLC-QTRAP-MS/MS was chosenas the analysis technology because of its remarkable superiority in selectivity, sensitivity,and analysis capability [24]. In summary, a method based on UFLC-QTRAP-MS/MS wasestablished for the simultaneous determination of 35 constituents in the different partsof AM.
After analysis of the content in different parts of AM, we found that flavonoids andamino acids were the major components among the different parts, while flavonoids andamino acids in AM were mainly distributed in AC. The results of PCA showed that therewere significant differences between AC and other parts of AM. The result of PLS-DArevealed that the metabolites between AC and other parts of AM were significantly differentand eight different compounds including L-serine, L-threonine, L-valine, quercetin 3-O-robinobioside, hyperin, isoquercetin, hibifolin, and quercetin 3′-O-glucoside were pickedout as the chemical markers. Therefore, we speculated that the difference in the content offlavonoids and amino acids might be an important reason for the unbalanced applicationin different parts of AM.
4. Materials and Methods4.1. Plant Materials
The AR (S1–S5), AH (S6–S10), AF (S11–S15), AC (S16–S20), and AS (S21–S25) sampleswere collected from Xinghua City, Jiangsu Province (32◦98′17” N, 119◦90′44” E) in thetraditional harvest time and dried in an oven, as shown in Figure 5. All the sampleswere authenticated by Professor Xunhong Liu (Nanjing University of Chinese Medicine,Nanjing, China) and deposited in the laboratory of Chinese medicine identification, NanjingUniversity of Chinese Medicine.
Molecules 2021, 26, x FOR PEER REVIEW 10 of 14
eight ingredients including 2′-deoxyadenosine, thymidine, 2,4-dihydroxybenzoic acid and 35 constituents determined in this article were selected as initial options. However, 2′-deoxyadenosine, thymidine, and 2,4-dihydroxybenzoic acid only had weak MS re-sponse and low concentration in samples, so they were eliminated. The selected 35 con-stituents basically summarize all the chemical structural types of the bioactive constitu-ents in AM, so their content variation can profile the distribution pattern of bioactive con-stituents in different parts of AM. Among the 35 target constituents, some are extremely similar in polarity, such as the isomers of hyperin, isoquercetin, and quercetin 7-O-gluco-side while the content of the different constituents varied greatly. Therefore, UFLC-QTRAP-MS/MS was chosen as the analysis technology because of its remarkable superi-ority in selectivity, sensitivity, and analysis capability [24]. In summary, a method based on UFLC-QTRAP-MS/MS was established for the simultaneous determination of 35 con-stituents in the different parts of AM.
After analysis of the content in different parts of AM, we found that flavonoids and amino acids were the major components among the different parts, while flavonoids and amino acids in AM were mainly distributed in AC. The results of PCA showed that there were significant differences between AC and other parts of AM. The result of PLS-DA revealed that the metabolites between AC and other parts of AM were significantly dif-ferent and eight different compounds including L-serine, L-threonine, L-valine, quercetin 3-O-robinobioside, hyperin, isoquercetin, hibifolin, and quercetin 3′-O-glucoside were picked out as the chemical markers. Therefore, we speculated that the difference in the content of flavonoids and amino acids might be an important reason for the unbalanced application in different parts of AM.
4. Materials and Methods 4.1. Plant Materials
The AR (S1–S5), AH (S6–S10), AF (S11–S15), AC (S16–S20), and AS (S21–S25) samples were collected from Xinghua City, Jiangsu Province (32°98′17′′ N, 119°90′44′′ E) in the tra-ditional harvest time and dried in an oven, as shown in Figure 5. All the samples were authenticated by Professor Xunhong Liu (Nanjing University of Chinese Medicine, Nan-jing, China) and deposited in the laboratory of Chinese medicine identification, Nanjing University of Chinese Medicine.
Figure 5. Five segments (AR, AH, AF, AC, and AS) of AM.
4.2. Chemicals and Reagents The standards of L-lysine (1), L-serine (2), L-threonine (3), L-glutamic acid (4), L-pro-
line (5), L-valine (6), L-tyrosine (7), adenosine (8), L-isoleucine (9), guanosine (10), inosine
Figure 5. Five segments (AR, AH, AF, AC, and AS) of AM.
4.2. Chemicals and Reagents
The standards of L-lysine (1), L-serine (2), L-threonine (3), L-glutamic acid (4), L-proline (5), L-valine (6), L-tyrosine (7), adenosine (8), L-isoleucine (9), guanosine (10),

Molecules 2021, 26, 1864 11 of 14
inosine (11), L-leucine (12), 5-(hydroxymethyl)-2-furancarboxylic acid (14), L-phenylalanine(15), chlorogenic acid (17), caffeic acid (18), myricetin 3′-O-glucoside (26), 3,4-dicaffeoylquinicacid (27), 3,5-dicaffeoylquinic acid (28), and 4,5-dicaffeoylquinic acid (32) were purchasedfrom Shanghai Yuanye Biotechnology Co., Ltd. (Shanghai, China). 3,4,5-Trihydroxybenzoicacid (13), rutin (23), hyperin (24), and quercetin (34) were purchased from the Chinese Na-tional Institute for the Control of Pharmaceutical and Biological Products (Beijing, China).3,4-Dihydroxybenzoic acid (16) was purchased from Shanghai Ronghe PharmaceuticalTechnology Co., Ltd. (Shanghai, China). Dihydromyricetin (19) and myricetin (31) werepurchased from Chengdu Aifa Bio-technology Co., Ltd. (Chengdu, China). Myricetin3-O-glucoside (20) and quercetin 3-O-robinobioside (21) were purchased from LiangweiBio-technology Co., Ltd. (Nanjing, China). Quercetin 7-O-glucoside (22), hibifolin (29), andquercetin 3-O-(6-acetylglucoside) (30) were purchased from Nanjing Casses Pharmaceu-tical Technology Co., Ltd. (Nanjing, China). Isoquercetin (25), quercetin 3′-O-glucoside(33), and tiliroside (35) were purchased from Chengdu Chroma-Biotechnology Co., Ltd.(Chengdu, China). The purities of 14, 26, and 32 were above 97% and other standardswere greater than 98%, tested by HPLC analysis. The structures of the 35 standards areshown in Figure S1. Formic acid, acetonitrile and methanol of HPLC grade were purchasedfrom Merck (Darmstadt, Germany). The deionized water was prepared by a Milli-Q waterpurification system (Millipore, Bedford, MA, USA).
4.3. Preparation of Standard Solutions
Each reference compound was accurately weighed and completely dissolved in 70%(v/v) methanol to produce their respective stock solutions. A standard solution containingthe 35 components was then diluted with 70% (v/v) methanol to obtain a series of standardworking solutions that were used to construct calibration curves. All of the solutions werestored at 4 ◦C and then filtered through 0.22 µm membranes (Jinteng laboratory equipmentCo., Ltd., Tianjin, China) before LC-MS analysis.
4.4. Preparation of Sample Solutions
Extraction variables, including extraction solvent (50% methanol, 60% methanol, 70%methanol, 80% methanol, 90% methanol, and 100% methanol), solid–liquid ratio (1:10, 1:20,1:30, 1:40, and 1:50 g/mL) and ultrasonic extraction time (15, 30, 45, 60, 75, and 90 min) wereoptimized in order to obtain a suitable extraction condition. Then the AM was divided intofive parts as AR, AH, AF, AC, AS. All samples were crushed into powder and screenedthrough a 50-mesh sieve. The sample powder (0.5 g) was accurately weighed and thenultrasonically extracted with 20 mL 70% (v/v) methanol for 30 min, respectively. Aftercooling to room temperature, the same solvent was added to compensate for the weightlost during extraction. Then the extract was filtered, and the filtrate was centrifuged at12,000 r/min for 10 min. Afterwards, the supernatant was diluted 20 times and filteredthrough a 0.22 µm membrane before LC-MS analysis.
4.5. Chromatographic and Mass Spectrometric Conditions
The chromatographic analysis was performed using a SHIMADZU UFLC XR system(Shimadzu Co., Kyoto, Japan), which consisted of an LC-20AD binary pump, a SIL-20A XRauto sampler, and a CTO-20AC column oven.
The key factors affecting chromatographic separation were fully optimized. Threetypes of columns: SynergiTM Hydro-RP 100 Å column (2.0 mm × 100 mm, 2.5 µm),ZORBAX Extend-C18 (2.1 mm × 100 mm, 1.8 µm) and XBridge®C18 column (4.6 mm ×100 mm, 3.5 µm) were investigated for the separation effect of the 35 target constituents. Inaddition, different kinds of mobile phases (water–methanol, water–acetonitrile, 0.1% (v/v)aqueous formic acid water solution–acetonitrile, 0.1% (v/v) aqueous formic acid watersolution–methanol:acetonitrile (1:1)), flow rates (0.5, 0.6, and 0.7 mL/min) and columntemperatures (25, 30, 35 ◦C) were examined.

Molecules 2021, 26, 1864 12 of 14
The mass spectrometric detection was performed on an API5500 triple quadrupole/linear ion trap mass spectrometer (AB Sciex, Framingham, MA, USA), which was equippedwith an electrospray ionization (ESI) source operating under both positive and negativeion modes. The operation parameters of the mass spectrometer were set as follows: the ionsource temperature (TEM), 550 ◦C; the spray voltage (IS), 4500 V (positive mode), –4500 V(negative mode); the flow rate of curtain gas (GUR), 40 L/min.; the flow rate of nebulizationgas (GS1), 55 L/min; the flow rate of auxiliary gas (GS2), 55 L/min.
The standard solution of each target constituent with a mass concentration of 100 ng/mLwas injected into the electrospray ionization (ESI) source, and a full scan was performed inthe positive and negative ion modes.
4.6. Validation of the Method
Validation of the method was carried out on the basis of the International Conferenceon Harmonization (ICH) guidelines Q2 (R1) [25], in terms of linearity and range, limitsof detection (LOD) and limits of quantification (LOQ), precision, repeatability, stability,accuracy.
A series of standard working solutions containing the 35 compounds was analyzedfrom low to high concentrations to establish calibration curves. Plotting the peak area(Y) versus the corresponding concentration (X) constructed the calibration curves. Subse-quently, the regression equation, correlation coefficient, and linear range were calculated;the LOD and LOQ of each analyte were measured at signal-to-noise ratio (S/N) of about 3and 10, respectively.
Intra-day and inter-day precision were determined with the standard solution 6 timeswithin a single day and 3 times within three consecutive days. The relative standarddeviation (RSD) of the peak area was taken as a measure of precision. The same samplewas divided into 6 parts in parallel, and the samples were extracted and analyzed by theabove method. The RSD of the peak area was taken as a measure of repeatability. The samesample was analyzed at 0 h, 2 h, 4 h, 8 h, 12 h, and 24 h to evaluate the inherent stabilitycharacteristics of each compound. The RSD of the peak area was taken as a measureof stability.
A standard addition method for a recovery test was performed to evaluate the ac-curacy of the established method. The test was carried out by adding certain amountsof standard (approximately equivalent to 80%, 100%, 120% levels of each compound) tothe sample which had known content of the 35 ingredients. Each level of addition wasrepeated three times and the spiked samples were extracted and analyzed using the abovementioned method. The extraction recovery rate of each compound was calculated by thefollowing formula: recovery(%) = (measured amount− original amount in sample)/spikedamount × 100%.
4.7. Multivariate Statistical Analysis
In order to get a good overview of the sample classification from the different partsof AM, the data of 35 components were used to carry out PCA, which is an unsupervisedpattern recognition method, with the software of SIMCA-P 13.0 (Umetrics AB, Umea,Sweden). PLS-DA, was applied to disclose which chemical components contributed mostto the clusters of AC and other parts of AM, and VIP maps were obtained in the model.The histograms were charted by GraphPad Prism 8.0 software (Graphpad Software, SanDiego, CA, USA).
5. Conclusions
In this study, a reliable analytical method based on UFLC-QTRAP-MS/MS was es-tablished for the simultaneous determination of 14 flavonoids, eight organic acids, threenucleosides and 10 amino acids in the different parts of AM. Furthermore, the contentsof 35 constituents in the different parts of AM were compared and evaluated combinedwith multivariate statistical analysis. The result proved that the contents of flavonoids and

Molecules 2021, 26, 1864 13 of 14
amino acids account for a high proportion in the different parts of AM, and the contents ofnucleosides and organic acids in each part of AM were at a relatively low level. The resultsof PCA showed a significant difference between AC and other parts of AM. The resultof PLS-DA showed that the metabolites between AC and other parts of AM were signifi-cantly different and eight different compounds (L-serine, L-threonine, L-valine, quercetin3-O-robinobioside, hyperin, isoquercetin, hibifolin, and quercetin 3′-O-glucoside) weresignificantly related to the sample classification. The research does not just provide thebasic information for revealing the distribution patterns in AC and other parts of AM fromthe same origin, but also complements some of the scientific data for quality comprehensiveevaluation of AC.
Supplementary Materials: The following are available online, Figure S1: Chemical structures of35 constituents, Table S1: Contents of 35 constituents in AR, AH, and AF, Table S2: Contents of 35constituents in AC and AS.
Author Contributions: Conceptualization, X.L. and S.Y.; data curation, S.Y., Y.M., L.W., and Z.C.;formal analysis, S.Y., N.W., J.Y., D.W. (Dianguang Wang), and D.W. (Dandan Wang); writing—originaldraft preparation, S.Y.; writing—review and editing, X.L., L.Z., Z.C., and H.G.; funding acquisition,X.L. All authors have read and agreed to the published version of the manuscript.
Funding: This research was supported by the Standardization of Chinese Materia Medica Program(No. ZYBZH-C-JS-32).
Institutional Review Board Statement: The study involve no human or animal studies.
Informed Consent Statement: The study involve no human studies.
Data Availability Statement: The data presented in this study are available in this article or insupplementary material.
Conflicts of Interest: The authors declare no conflict of interest.
References1. The State Pharmacopoeia Commission of P. R. China. Pharmacopoeia of the People’s Repulic of China; Part I; China Medical Science
and Technology Press: Beijing, China, 2020; p. 319.2. Liu, B.Q.; Hu, Y.; Zhang, J.H.; Chen, Z.W. Total flavone of Abelmoschus manihot (L.) medic for prevention and treatment of adjuvant
arthritis in rats. Chin. J. Clin. Rehabil. 2006, 10, 34–37.3. Zhang, L.; Li, P.; Xing, C.Y.; Zhao, J.Y.; He, Y.N.; Wang, J.Q.; Wu, X.F.; Liu, Z.S.; Zhang, A.P.; Lin, H.L.; et al. Efficacy and safety
of Abelmoschus manihot for primary glomerular disease: A prospective, multicenter randomized controlled clinical trial. Am. J.Kidney Dis. 2014, 64, 57–65. [CrossRef]
4. Chen, Y.Z.; Gong, Z.X.; Cai, G.Y.; Gao, Q.; Chen, X.M.; Tang, L.; Wei, R.B.; Zhou, J.H. Efficacy and safety of Flos Abelmoschusmanihot (Malvaceae) on type 2 diabetic nephropathy: A systematic review. Chin. J. Integr. Med. 2015, 21, 464–472. [CrossRef][PubMed]
5. Park, J.H.; Cho, S.E.; Hong, S.H.; Shin, H.D. Choanephora flower rot caused by Choanephora cucurbitarum on Abelmoschus manihot.Trop. Plant Pathol. 2015, 40, 147–149. [CrossRef]
6. State Administration of Traditional Chinese Medicine. Chinese Materia Medica; Part 5; Shanghai Science and Technology Press:Shanghai, China, 1999; pp. 331–333.
7. Pan, X.; Du, L.; Tao, J.; Jiang, S.; Qian, D.; Duan, J. Dynamic changes of flavonoids in Abelmoschus manihot different organs atdifferent growth periods by UPLC-MS/MS. J. Chromatogr. B Anal. Technol. Biomed. Life Sci. 2017, 1059, 21–26. [CrossRef]
8. Xia, K.Y.; Zhang, C.L.; Cao, Z.Y.; Ge, H.T.; Tang, H.T. Chemical constituents from Corolla abelmoschi. Strait Pharm. J. 2019, 31, 58–61.9. Du, L.Y.; Qian, D.W.; Jiang, S.; Shang, E.X.; Guo, J.M.; Liu, P.; Su, S.L.; Duan, J.A.; Zhao, M. Comparative characterization of
nucleotides, nucleosides and nucleobases in Abelmoschus manihot roots, stems, leaves and flowers during different growth periodsby UPLC-TQ-MS/MS. J. Chromatogr. B Anal. Technol. Biomed. Life Sci. 2015, 1006, 130–137. [CrossRef]
10. Du, L.Y.; Qian, D.W.; Jiang, S.; Guo, J.M.; Su, S.L.; Duan, J.A. Comparative characterization of amino acids in Abelmoschus manihotroots, stems and leaves during different growth periods by UPLC-TQ-MS/MS. Anal. Methods 2015, 7, 10280–10290. [CrossRef]
11. Serafini, M.; Peluso, I.; Raguzzini, A. Flavonoids as anti-inflammatory agents. Proc. Nutr. Soc. 2010, 69, 273–278. [CrossRef]12. Parhiz, H.; Roohbakhsh, A.; Soltani, F.; Rezaee, R.; Iranshahi, M. Antioxidant and anti-inflammatory properties of the citrus
flavonoids hesperidin and hesperetin: An updated review of their molecular mechanisms and experimental models. Phytother.Res. 2015, 29, 323–331. [CrossRef]

Molecules 2021, 26, 1864 14 of 14
13. Hosseini, F.; Mahdian-Shakib, A.; Jadidi-Niaragh, F.; Enderami, S.E.; Mohammadi, H.; Hemmatzadeh, M.; Mohammed, H.A.;Anissian, A.; Kokhaei, P.; Mirshafiey, A.; et al. Anti-inflammatory and anti-tumor effects of α-l-guluronic acid (G2013) oncancer-related inflammation in a murine breast cancer model. Biomed. Pharmacother. 2018, 98, 793–800. [CrossRef] [PubMed]
14. Heitman, E.; Ingram, D.K. Cognitive and neuroprotective effects of chlorogenic acid. Nutr. Neurosci. 2017, 20, 32–39. [CrossRef][PubMed]
15. Zhu, J.T.; Choi, R.C.; Xie, H.Q.; Zheng, K.Y.; Guo, A.J.; Bi, C.W.; Lau, D.T.; Li, J.; Dong, T.T.; Lau, B.W. Hibifolin, a flavonolglycoside, prevents beta-amyloid-induced neurotoxicity in cultured cortical neurons. Neurosci. Lett. 2009, 461, 172–176. [CrossRef]
16. Qiu, L.; Patterson, S.E.; Bonnac, L.F.; Geraghty, R.J. Nucleobases and corresponding nucleosides display potent antiviral activitiesagainst dengue virus possibly through viral lethal mutagenesis. PLoS Negl. Trop. Dis. 2018, 12, e0006421. [CrossRef]
17. Tessari, P. Nonessential amino acid usage for protein replenishment in humans: A method of estimation. Am. J. Clin. Nutr. 2019,110, 255–264. [CrossRef]
18. Ferraro, V.; Sousa, S.C.; Marques, C.; Calhau, C.; Pintado, M.E. Antioxidant and anti-hypertensive activity, and cytotoxicity ofamino acids-enriched salt recovered from codfish (Gadus morhua L.) salting wastewater. Waste Biomass Valoriz. 2015, 6, 1115–1124.[CrossRef]
19. Jain, P.S.; Bari, S.B. Evaluation of wound healing effect of petroleum ether and methanolic extract of Abelmoschus manihot (L.)Medik., Malvaceae, and Wrightia tinctoria R. Br., Apocynaceae, in rats. Rev. Bras. Pharmacogn. 2010, 20, 756–761. [CrossRef]
20. Pritam, S.J.; Amol, A.T.; Sanjay, B.B.; Sanjay, J.S. Analgesic activity of Abelmoschus manihot Extracts. Int. J. Pharmacol. 2011, 7,716–720. [CrossRef]
21. Mei, Y.; Wei, L.; Chai, C.; Zou, L.; Liu, X.; Chen, J.; Tan, M.; Wang, C.; Cai, Z.; Zhang, F.; et al. A method to study the distributionpatterns for metabolites in xylem and phloem of Spatholobi Caulis. Molecules 2019, 25, 167. [CrossRef]
22. Wei, L.; Mei, Y.; Zou, L.; Chen, J.; Tan, M.; Wang, C.; Cai, Z.; Lin, L.; Chai, C.; Yin, S.; et al. Distribution patterns for bioactiveconstituents in, pericarp, stalk and seed of Forsythiae Fructus. Molecules 2020, 25, 340. [CrossRef]
23. Cai, Z.; Liao, H.; Wang, C.; Chen, J.; Tan, M.; Mei, Y.; Wei, L.; Chen, H.; Yang, R.; Liu, X. A comprehensive study of the aerial partsof Lonicera japonica Thunb. based on metabolite profiling coupled with PLS-DA. Phytochem. Anal. 2020, 31, 786–800. [CrossRef]
24. Yan, Y.; Zhao, H.; Chen, C.; Zou, L.; Liu, X.; Chai, C.; Wang, C.; Shi, J.; Chen, S. Comparison of multiple bioactive constituents indifferent parts of Eucommia ulmoides based on UFLC-QTRAP-MS/MS combined with PCA. Molecules 2018, 23, 643. [CrossRef]
25. The International Council for Harmonization of Technical Requirements for Pharmaceuticals for Human Use (ICH). Guidelines,Q2 (R1): Validation of Analytical Procedures (Text and Methodology); ICH: Geneva, Switzerland, 2005.