Comparison of MODIS fPAR Products with Landsat-5 TM...
19
360 GIScience & Remote Sensing, 2010, 47, No. 3, p. 360–378. DOI: 10.2747/1548-1603.47.3.360 Copyright © 2010 by Bellwether Publishing, Ltd. All rights reserved. Comparison of MODIS fPAR Products with Landsat-5 TM–Derived fPAR over Semiarid Rangelands of Idaho Fang Chen, 1 Keith T. Weber, Jamey Anderson, and Bhushan Gokhale GIS Training and Research Center, Idaho State University, 921 S. 8th Ave, Stop 8104, Pocatello Idaho 83209-8104 Abstract: While validation of the MODIS fPAR product is well behind that of the LAI product, it is recently receiving more attention. In this study, MODIS fPAR and Landsat-5 TM–derived fPAR (TM fPAR) were calculated and quantitatively compared using imagery from 2005 to 2008 for the semiarid rangelands of Idaho, USA. fPAR change maps were calculated between active growth and late-summer senescence periods. Accuracy of the MODIS fPAR and TM fPAR were determined indirectly by incorporating field-based measurements of above-ground forage bio- mass and percent ground cover from a variety of sites (n = 442). INTRODUCTION Live vegetation responds to radiation, heat, and water balance interactions between the land surface and the atmosphere (Bonan, 1995; Sellers et al., 1997). Currently, most interaction simulation models, including carbon budget models, climate cycle models, and ecosystem productivity models, require quantitative vegetation information as a modeling input (Dickinson et al., 1998; Running et al., 1999; Feng et al., 2007). In each case, the fraction of photosynthetically active radiation absorbed by vegetation (fPAR) is a key biophysical parameter (Asner et al., 1998; Running et al., 2004). Many techniques have been developed to measure fPAR and most can be categorized as either a field-based or satellite-based methodology. For example, field-based measure- ments from flux towers have been widely used to derive fPAR in various ecological environments (Baret et al., 2006; Morisette et al., 2006). Although field-based meth- ods are straightforward and accurate for small-scale studies, they are also difficult to apply for spatial pattern studies at regional scales. When it is important to have global or regional measurements of fPAR (e.g., for effective application of interaction simulation models over large areas and long time periods), satellite remote sensing has the advantage of acquiring land surface imagery at broad spatial scales and frequent temporal periodicity. In addition, satellite-based methods provide a unique way to extend the estimations of fPAR into additional pro- ductivity metrics such as gross primary production (GPP), net primary production (NPP), and net ecosystem exchange (NEE) (Zhao et al., 2005; Turner et al., 2009). 1 Corresponding author; email: [email protected]
Transcript of Comparison of MODIS fPAR Products with Landsat-5 TM...

360
GIScience & Remote Sensing, 2010, 47, No. 3, p. 360–378. DOI: 10.2747/1548-1603.47.3.360Copyright © 2010 by Bellwether Publishing, Ltd. All rights reserved.
Comparison of MODIS fPAR Products with Landsat-5 TM–Derived fPAR over Semiarid Rangelands of Idaho
Fang Chen,1 Keith T. Weber, Jamey Anderson, and Bhushan Gokhale GIS Training and Research Center, Idaho State University, 921 S. 8th Ave, Stop 8104, Pocatello Idaho 83209-8104
Abstract: While validation of the MODIS fPAR product is well behind that of the LAI product, it is recently receiving more attention. In this study, MODIS fPAR and Landsat-5 TM–derived fPAR (TM fPAR) were calculated and quantitatively compared using imagery from 2005 to 2008 for the semiarid rangelands of Idaho, USA. fPAR change maps were calculated between active growth and late-summer senescence periods. Accuracy of the MODIS fPAR and TM fPAR were determined indirectly by incorporating field-based measurements of above-ground forage bio-mass and percent ground cover from a variety of sites (n = 442).
INTRODUCTION
Live vegetation responds to radiation, heat, and water balance interactions between the land surface and the atmosphere (Bonan, 1995; Sellers et al., 1997). Currently, most interaction simulation models, including carbon budget models, climate cycle models, and ecosystem productivity models, require quantitative vegetation information as a modeling input (Dickinson et al., 1998; Running et al., 1999; Feng et al., 2007). In each case, the fraction of photosynthetically active radiation absorbed by vegetation (fPAR) is a key biophysical parameter (Asner et al., 1998; Running et al., 2004). Many techniques have been developed to measure fPAR and most can be categorized as either a field-based or satellite-based methodology. For example, field-based measure-ments from flux towers have been widely used to derive fPAR in various ecological environments (Baret et al., 2006; Morisette et al., 2006). Although field-based meth-ods are straightforward and accurate for small-scale studies, they are also difficult to apply for spatial pattern studies at regional scales.
When it is important to have global or regional measurements of fPAR (e.g., for effective application of interaction simulation models over large areas and long time periods), satellite remote sensing has the advantage of acquiring land surface imagery at broad spatial scales and frequent temporal periodicity. In addition, satellite-based methods provide a unique way to extend the estimations of fPAR into additional pro-ductivity metrics such as gross primary production (GPP), net primary production (NPP), and net ecosystem exchange (NEE) (Zhao et al., 2005; Turner et al., 2009).
1Corresponding author; email: [email protected]

modis and landsat-5–derived fpar products 361
The Moderate Resolution Imaging Spectroradiometer (MODIS) is a key instru-ment aboard the Terra and Aqua satellites. The MODIS Land Discipline Team (MODLAND) has developed leaf area index (LAI) and fPAR products that provide global 1 km spatial resolution LAI/fPAR images at eight-day intervals (Knyazikhin et al., 1998; Cohen et al., 2003; Morisette et al., 2006). Since the launch of the Terra sat-ellite in December 1999, MODIS LAI/fPAR products have been widely used in many global ecosystem interaction studies including forest (Shabanov et al., 2003; Chen et al., 2008), cropland (Chen et al., 2006; Yang et al., 2007), and grassland ecosystems (Fensholt et al., 2004; Hill et al., 2006).
Experience from previous generations of satellite imaging systems suggests that an independent assessment of product quality is a critical step to the success of MODIS product usage (Justice et al., 2002; Morisette et al., 2002; Turner et al., 2003). For this purpose, the MODIS Science Team has developed several validation projects. “BigFoot” is one such project that provides validation of MODLAND science prod-ucts (http://www.fsl.orst.edu/larse/bigfoot/index.html.), including land cover, LAI, fPAR, and NPP (Morisette et al., 2003; Turner et al., 2006). The “Bigfoot” project includes nine carbon flux tower sites (seven in the USA, one in Canada, and one in Brazil) that cover eight major biomes from desert to tundra, and tropical rainfor-est. fPAR surface images are derived by linking in situ measurements to data from Landsat-7 ETM+ and various independent ecosystem process models. Based on vali-dation data from “BigFoot,” the quality of MODIS fPAR products and their source error have been assessed, concluding that while it is not possible for a single MODIS pixel accurately estimate fPAR, multiple pixel estimations within and across sites can be accurately estimated (Gower et al., 1999; Milne and Cohen, 1999). The Validation of Land European Remote sensing Instruments (VALERI) project is another project to evaluate the absolute accuracy of the biophysical products (e.g., LAI, fPAR) derived from satellite observations (Garrigues et al., 2007; Baret et al., 2009). More than 20 counties (e.g., Argentina, Australia, China, England, Finland, France, Germany, Spain) collaborate in the VALERI project and the MODIS fPAR product is inter-compared with other different sensors and algorithms (Gobron et al., 2006; Weiss et al., 2007). In general, these MODIS validation projects participate in existing long-term ecological research programs (Franklin et al., 1990), scientific data networks such as AERONET (Holben et al., 1998) and FLUXNET (Heinsch et al., 2006), and international valida-tion activities (Swap et al., 2000).
The validation of MODLAND science products is also accomplished by compari-son with field measurements or cross-sensor comparison with other satellite sensors. The advantage of field-based validation is that abundant land surface information, such as the exchange of carbon dioxide, water vapor, and energy, across a spectrum of tem-poral and spatial scales can be used to support the validation. Cross-sensor compari-son is another important part of MODLAND science product validation. CYCLOPES LAI/FPAR products (Weiss et al., 2007) and Sea-viewing Wide Field-of-view Sensor (SeaWiFS) fPAR data (Gobron et al., 2006) have been used for the purpose of under-standing the difference between MODLAND science products and analogous bio-physical parameters derived from other sensors (Garrigues et al., 2008).
Validation of the MODIS LAI/fPAR products have mostly focused on LAI (Tian et al., 2002b; Cohen et al., 2003; Shabanov et al., 2003), yet it is important to extend validation to the fPAR product across all biomes. Semiarid rangeland ecosystems

362 chen et al.
(an anthropogenic biome comprising a number of ecological biomes such as semi-arid deserts, dry steppes, grasslands, and savannas) cover approximately 40% of the Earth’s terrestrial surface and play an important role in global ecosystem productiv-ity (Breman and de Wit, 1983; Huntsinger and Hopkinson, 1996). Validation of the MODIS fPAR product in semiarid rangeland ecosystems is important part of the over-all product validation.
In September 2006, MODLAND released a new version of MODIS Land Data Products (Collection 5) providing greater data quality than available from Collection 4. Although there are MODIS fPAR validation studies in other semiarid rangelands, (Fensholt et al., 2004; Weiss et al., 2007), previous validation studies were specific to the earlier MODIS fPAR Collection 4 product. To date there have been no papers pub-lished for studies of fPAR Collection 5 product validation in the semiarid rangelands of North America.
In this study, fPAR was derived using Landsat 5 TM data following the SR-fPAR retrieval algorithm proposed by Sellers et al. (1992). A cross-sensor comparison was made using MODIS fPAR Collection 5 products and Landsat 5 TM-derived fPAR products. The accuracy of these fPAR products was indirectly determined by incorpo-rating field-based measurements of above-ground forage biomass and percent ground cover from a variety of sites in the semiarid sagebrush-steppe rangelands of Idaho.
MATERIALS AND METHODS
Study Area
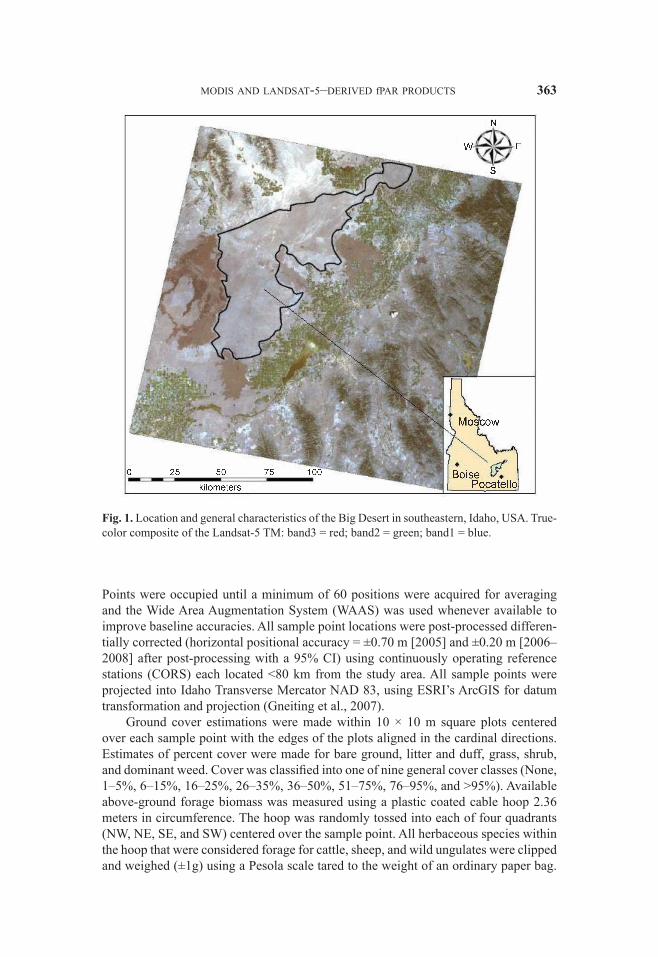
The study area, known as the Big Desert, lies in southeast Idaho, USA, approxi-mately 71 km northwest of Pocatello. The center of the study area is located at 113°4’18.68” W and 43°14’27.88” N (Fig. 1). This area is managed by the Bureau of Land Management (BLM) and exhibits a large variety of native as well as invasive plant species. The Big Desert is a semiarid sagebrush-steppe ecosystem with a high proportion of bare ground (x bare ground > 17%), and is classified as a Wyoming big sagebrush/blue bunch wheatgrass habitat type. Annual precipitation is 23 cm, with 40% of the precipitation falling from April through June (Yanskey et al., 1966). The area is bordered by geologically young lava formations to the south and west and irrigated agricultural lands to the north and east. Sheep grazing is the primary anthro-pogenic disturbance to the study area with semi-extensive continuous/seasonal graz-ing systems used on allotments ranging in size from 1100 to over 125,000 ha. The set stocking rate is low across the study area (>19 ha/animal unit [AU]), with actual utili-zation approximately 40% of the set stocking rate. Wildfire is a common disturbance and nearly 40% of the study area has burned in the past 10 years.
Sample Design and Field Measurements
A total of 442 sample points were randomly generated across the Big Desert study area between 2005 and 2008 (Table 1). Each point met the following criteria: (1) >70 meters from an edge (road, trail, or fence line); and (2) <750 meters from a road. The location of each sample point was recorded using a Trimble Geo XT (2005) or Geo XH (2006-2008) GPS receiver using latitude-longitude (WGS 84) (Serr et al., 2006).
modis and landsat-5–derived fpar products 363
Points were occupied until a minimum of 60 positions were acquired for averaging and the Wide Area Augmentation System (WAAS) was used whenever available to improve baseline accuracies. All sample point locations were post-processed differen-tially corrected (horizontal positional accuracy = ±0.70 m [2005] and ±0.20 m [2006–2008] after post-processing with a 95% CI) using continuously operating reference stations (CORS) each located <80 km from the study area. All sample points were projected into Idaho Transverse Mercator NAD 83, using ESRI’s ArcGIS for datum transformation and projection (Gneiting et al., 2007).
Ground cover estimations were made within 10 × 10 m square plots centered over each sample point with the edges of the plots aligned in the cardinal directions. Estimates of percent cover were made for bare ground, litter and duff, grass, shrub, and dominant weed. Cover was classified into one of nine general cover classes (None, 1–5%, 6–15%, 16–25%, 26–35%, 36–50%, 51–75%, 76–95%, and >95%). Available above-ground forage biomass was measured using a plastic coated cable hoop 2.36 meters in circumference. The hoop was randomly tossed into each of four quadrants (NW, NE, SE, and SW) centered over the sample point. All herbaceous species within the hoop that were considered forage for cattle, sheep, and wild ungulates were clipped and weighed (±1g) using a Pesola scale tared to the weight of an ordinary paper bag.
Fig. 1. Location and general characteristics of the Big Desert in southeastern, Idaho, USA. True-color composite of the Landsat-5 TM: band3 = red; band2 = green; band1 = blue.

364 chen et al.
The measurements were then used to estimate forage amount expressed in kilograms per hectare.
Landsat-5 TM Imagery
Based upon four years of field survey data (2005–2008), it was determined that grasses, shrubs, and dominant weeds tended to be green and most actively growing, resulting in high fPAR values, during the spring and early summer (i.e., June) time periods. Later in the summer, high temperatures hasten the desiccation of plants and in contrast to the active growing period, fPAR values are reduced and substantially different at this time. Therefore, we selected Landsat-5 TM and MODIS imagery from these two time periods (henceforth referred to as the active growth and late-summer senescence periods) to optimally detect fPAR changes and thereby better understand seasonal productivity within semiarid rangelands.
Four Landsat-5 TM scenes, path/row 039/030, were collected on 13 August 2005, 13 June 2006, 03 August 2007, and 18 June 2008. Two scenes were acquired during the active growth period of early June 2006 and 2008, while the other two scenes were acquired during the late-summer period when grasses senesced in August 2005 and 2007. Digital Number (DN) values were transformed into radiance using gain and offset coefficients from the metadata of the imagery. The images were then atmo-spherically corrected based on the dark object subtraction (DOS) method (Chavez, 1996; Song et al., 2001). All imagery was projected into Idaho Transverse Mercator (IDTM), NAD 83 and georectified to < 0.3 pixel root mean square error (RMSE) (Weber, 2006).
Landsat-5 TM fPAR Calculation
Recently, two primary approaches have been used to retrieve fPAR from remotely sensed data. The most common approach has been to establish an empirical relation-ship between NDVI and fPAR through fitting ground-based measures of fPAR to corresponding remotely sensed data (Myneni and Williams, 1994; Chen, 1996). The limitation of relationship-based approaches is that the resulting formulas are influenced by vegetation type and soil background. Another important fPAR retrieval approach is based on bidirectional reflectance distribution function (BRDF) models (Tian, et al., 2002a; Hu et al., 2007). Although the model-based approach may be more accurate from a theoretical basis, it requires lengthy calculation time and it is difficult to obtain sufficient model input parameters.
Table 1. Dates and Numbers of Field Sample Plots Used for Validation
Year Sampling dates Number of sample plots
2005 01 June to 15 July 88 2006 05 June to 10 July 175 2007 29 May to 13 June 97 2008 10 June to 11 July 82

modis and landsat-5–derived fpar products 365
In this study, given limitations on field fPAR measurement data and model input parameters, TM fPAR estimations were developed by applying the SR-fPAR algo-rithm. To specifically assess the ability of the SR-fPAR retrieval approach for fPAR estimation in semiarid rangeland ecosystems, field-based measurements of above-ground forage biomass and percent ground cover were used to better indirectly assess TM fPAR. Recently, empirical relationship–based algorithms have been highly site-specific and always emphasize forest ecosystems; however, the SR-fPAR algorithm described by Sellers et al. (1992) is a straightforward fPAR retrieval approach and is considered applicable within a variety of biome types (e.g., broadleaf evergreen trees, needle-leaved deciduous trees, and grassland) (Paruelo et al., 1997; Los et al., 2000; Hassan et al., 2006).
Assuming a nearly linear relationship between fPAR and a simple ratio (SR) (Eq. 1), fPAR can be calculated when two known points are determined. The value of the 98th percentile from a normalized difference vegetation index (NDVI) distribution was assumed to represent vegetation at full cover and maximum photosynthetic activ-ity with fPAR values close to unity (0.950). The 5th percentile value is assumed to represent no vegetation photosynthetic activity with an fPAR of 0.001. The relation between fPAR and SR is then given by
(1)SR 1 NDVI+1 NDVI–------------------------=
(2)fPAR fPARmin SR SRi min,–fPARmax fPARmin–
SRi max, SRi min,–-------------------------------------------------------+=
where the maximum (fPARmax = 0.950) and minimum (fPARmin = 0.001) values of fPAR are independent of vegetation type. SRi,max and SRi,min correspond, respectively, to the 98th and 5th percentile of the NDVI data population for type i (sagebrush-steppe) vegetation (Sellers et al., 1996).
MODIS fPAR Product
The theoretical basis of the MODIS fPAR algorithm is the three dimensional radiative transfer theory (Myneni et al., 1999). The inversion of the 3D radiative trans-fer is accomplished with Look-Up Table approach (Knyazikhin et al., 1998). A back-up method based on the relationship between NDVI and fPAR, used together with a biome classification map, is applied when the primary algorithm fails. In this study, four Collection 5 MODIS fPAR (MOD15A2) scenes were selected on the basis of temporal coincidence with existing Landsat-5 TM imagery. All MODIS fPAR imagery (1 km spatial resolution) used in this study represents a time interval of eight days. All imagery was projected into ITDM, NAD 83, using ESRI’s ArcGIS 9.3 for datum trans-formation and projection. Using quality control (QC) layers, MODIS fPAR data were screened to reject fPAR data of insufficient quality. Only pixels with the best possible quality (i.e., values on all bit fields are equal to zero) under the QC definition table were retained (Table 2). The QC filter includes pixels with good quality and removes pixels that were not produced due to cloud or other reasons.

366 chen et al.
fPAR Comparison
MODIS fPAR and TM fPAR imagery were first compared to determine general similarity. To enable quantitative assessment of MODIS fPAR distributions, all TM fPAR layers were averaged resampled to 1 km spatial resolution in ESRI’s ArcGIS 9.3. A total of 350 independent randomly distributed test points were generated using Hawth’s analysis tools for ArcGIS. Of these, 302 test points were finally available for analysis after removing all points falling within the “no-retrieve” areas of the imagery. Pixel values were extracted using the ArcGIS “Sample” tool, and correlation coeffi-cients were calculated to evaluate the relative agreement between MODIS fPAR and TM fPAR values.
TM fPAR change layers were calculated using TM fPAR values for 13 August 2005 subtracted from TM fPAR values for 13 June 2006. Similarly, TM fPAR val-ues for 03 August 2007 were subtracted from TM fPAR values for18 June 2008. The resulting change layers were assumed to represent vegetation growth that occurred following the end of the previous growing season and prior to periods of active live-stock grazing in the study area. MODIS fPAR change layers were calculated in the same way. Finally, fPAR distribution layers and change layers were compared with
Table 2. MODIS fPAR General Quality Control Definitions for Collection 5 Data
Bit no. Parameter name Bit comb. Description of bitfield(s)
0 MODLAND_QC_bits 0
1
Good quality (main algorithm with or without saturation).
Other Quality (back-up algorithm or fill values)
1 Sensor 0 1
Terra Aqua
2 DeadDetector 0 1
Detectors apparently fine for up to 50% of channels 1,2.
Dead detectors caused >50% adjacent detector retrieval
3–4 CloudState (inherited from Aggregate_QC bits {0,1} cloud state)
00 01 10 11
0 Significant clouds NOT present (clear) 1 Significant clouds WERE present 2 Mixed cloud present on pixel 3 Cloud state not defined, assumed clear
5–7 SCF_QC (five level confidence score)
000
001
010
011
100
0, Main (RT) method used, best result possible (no saturation)
1, Main (RT) method used with saturation. Good,very usable
2, Main (RT) method failed due to bad geometry, empirical algorithm used
3, Main (RT) method failed due to problems other than geometry, empirical algorithm used
4, Pixel not produced at all, value coudn’t be retrieved (possible reasons: bad L1B data, unusable MODAGAGG data)

modis and landsat-5–derived fpar products 367
field-based measurements of above-ground forage biomass and percent ground cover to further indirectly validate these data.
fPAR Indirect Validation
There were no flux tower sites in or surrounding the Big Desert study area and no ground-measured fPAR data were available for the study area. Because actual fPAR values must be considered unknown, direct validation from field measured fPAR was unavailable in this study. For this reason, we consider the seasonal characteristics of fPAR change over semiarid rangelands. Grasses, shrubs, and dominant weeds tended to be green during active growth periods (June). In contrast, most shrubs maintained greenness throughout much of the year while grasses and weeds became senescent, resulting in substantial fPAR reduction (e.g., fPAR value of grass is close to 0) in late summer (August). fPAR difference between late-summer senescence periods (e.g., primarily resulting from shrubs) and the next active growth periods (e.g., resulting from grasses, weeds, and shrubs) describes the amount of grasses and weeds available during the active growth period. Therefore, fPAR change values can be indirectly vali-dated through a careful assessment of the spatial variability of grasses and weeds.
Based upon the reported data, the authors observed that: (1) in areas where the percent cover of shrubs and above-ground forage biomass were similar, the area with the higher percent cover of grasses and weeds during the active growth period con-sistently resulted in higher fPAR change; and (2) when the percent cover of shrub and grass functional groups were similar, the area with more above-ground forage biomass during the active growth period leads to higher fPAR change. As a result, the relation-ship between percent ground cover and fPAR change (and the relationship between above-ground forage biomass and fPAR change) was established and fPAR values indirectly validated by comparing changes in fPAR with changes in above-ground for-age biomass and percent ground cover.
RESULTS
MODIS fPAR values and TM fPAR values were relatively similar (Fig. 2). The results of quantitative comparisons among aggregated TM fPAR and MODIS fPAR products (1 km spatial resolution in both cases) across the study region from 2005 to 2008 indicate that MODIS fPAR values were relatively close to TM fPAR values; a weak relationship between MODIS fPAR and TM fPAR was also noted (R2 < 0.51) (Fig. 3). In general, MODIS fPAR depicts the same overall trend and offers the advan-tage of acquiring reliable fPAR data at broad scales and frequent periodicity.
TM fPAR change layers were nearly identical to MODIS fPAR change layers (Fig. 4). Using fPAR change results, areas of major negative change (–1 < fPAR change < –0.05), minor change (–0.05 < fPAR change < 0.05), and major positive change (0.05 < fPAR change < 1) were delineated. A major positive change (MPC) area was defined as an area where fPAR values increased. Similarly, a major negative change (MNC) area was an area where fPAR values substantially decreased, while minor change (MINC) areas were areas where fPAR values changed only slightly.
Field-based measurements of above-ground forage biomass and percent ground cover in MPC, MNC, and MINC areas are summarized in Tables 3 and 4. In 2006,

368 chen et al.
Fig. 2. Landsat-5 TM fPAR (30 m per pixel [mpp]) and eight-day composite MODIS fPAR (1000 mpp) layers.

modis and landsat-5–derived fpar products 369
average percent shrub cover in MPC areas was similar to that in MINC areas, while higher percent grass cover was present in MPC areas than in MINC areas over the same time period. Mean and maximum forage biomass was greater in MPC areas (x = 496 kg/ha; maximum = 1668 kg/ha ) than in MINC areas (x = 328 kg/ha; maxi-mum = 1065 kg/ha) in 2006, while mean forage biomass was reduced in both MPC areas (–115 kg/ha) and MINC areas (–223 kg/ha) between 2005 and 2006. The reduc-tion of forage biomass in MINC areas was greater than the reduction of forage biomass in MPC areas; hence a major negative change was detected in the MINC areas.
Analysis of field-based measurements of ground cover and forage biomass between 2005 and 2006 suggests that MPC areas should exhibit greater fPAR change trends relative to MINC areas. Furthermore, comparing the change of mean forage biomass in all MPC areas from 2005 to 2006 (–115 kg/ha) to the change of mean for-age biomass in all MPC areas from 2007 to 2008 (–107 kg/ha) revealed very similar change patterns. The information describing field-based above-ground forage biomass and percent ground cover follow the same distribution and trend as indicated by both the MODIS and TM fPAR change maps. These results support the hypothesis that the seasonal characteristics of fPAR change over semiarid rangelands can be used as an indicator for the relative abundance of grasses and herbaceous weeds.
Fig. 3. Comparison of aggregated Landsat-5 TM fPAR to the MODIS fPAR product at 1 km resolution.

370 chen et al.
DISCUSSION
Many MODIS fPAR validation studies noted that MODIS seems to overestimate fPAR in many regions. Fensholt et al. (2004) demonstrated that in comparison to field-measured fPAR, the overall level of MODIS fPAR is overestimated by approximately 0.06–0.15 in the semiarid grasslands of West Africa and Senegal. Weiss et al. (2007) compared MODIS fPAR and CYCLOPES fPAR products and also concluded that MODIS estimates higher fPAR values than CYCLOPES in grasslands. Similar to grassland, Steinberg et al. (2006) indicated that the MODIS fPAR algorithm overesti-mates fPAR when compared to Landsat-7 ETM–derived fPAR in the boreal forests of Alaska (i.e., MODIS approximately overestimated fPAR by up to 0.2). However, in this study the difference between MODIS fPAR values and TM fPAR values contra-dicted previous findings (x difference < 0.05). The reduction in MODIS fPAR values may be attributed to the improvement in the Collection 5 MODIS fPAR retrieval algo-rithm (Steinberg and Goetz, 2009).2
Field sampling was conducted between June and early July throughout this study (2006–2008). This corresponds with the period of peak biomass production in the study area. Remote sensing imagery was acquired during this same time period to similarly capture the active growth period and allow comparison with known field conditions.
2All previous MODIS fPAR validation studies used the Collection 4 product, but this study used Collection 5.
Fig. 4. The fPAR change maps of Landsat-5 TM and MODIS.
modis and landsat-5–derived fpar products 371
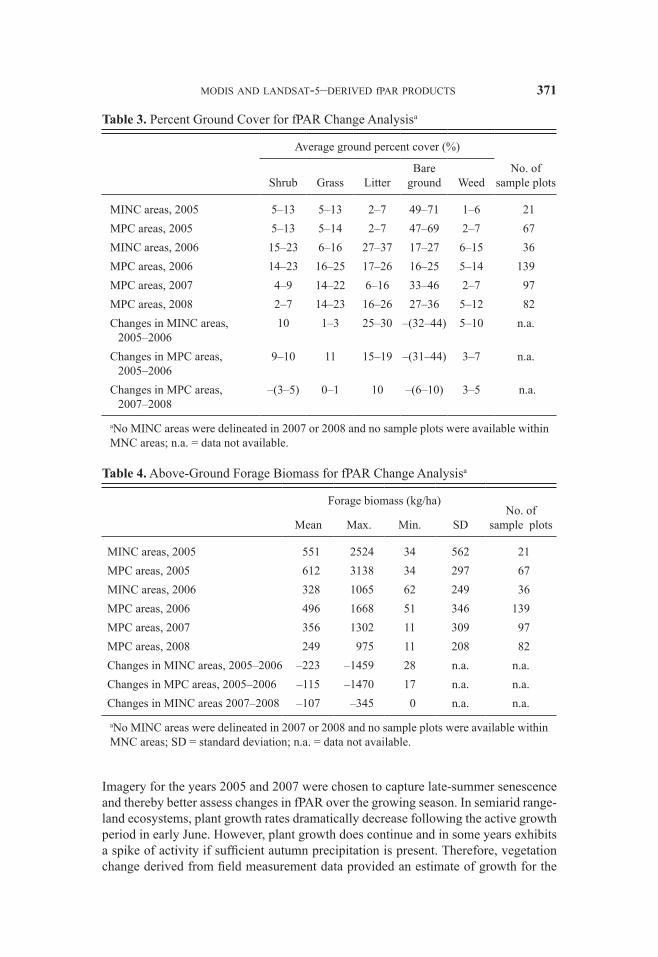
Imagery for the years 2005 and 2007 were chosen to capture late-summer senescence and thereby better assess changes in fPAR over the growing season. In semiarid range-land ecosystems, plant growth rates dramatically decrease following the active growth period in early June. However, plant growth does continue and in some years exhibits a spike of activity if sufficient autumn precipitation is present. Therefore, vegetation change derived from field measurement data provided an estimate of growth for the
Table 3. Percent Ground Cover for fPAR Change Analysisa
Average ground percent cover (%)
No. of sample plots
Shrub Grass Litter
Bare ground Weed
MINC areas, 2005 5–13 5–13 2–7 49–71 1–6 21MPC areas, 2005 5–13 5–14 2–7 47–69 2–7 67MINC areas, 2006 15–23 6–16 27–37 17–27 6–15 36MPC areas, 2006 14–23 16–25 17–26 16–25 5–14 139MPC areas, 2007 4–9 14–22 6–16 33–46 2–7 97MPC areas, 2008 2–7 14–23 16–26 27–36 5–12 82Changes in MINC areas,
2005–200610 1–3 25–30 –(32–44) 5–10 n.a.
Changes in MPC areas, 2005–2006
9–10 11 15–19 –(31–44) 3–7 n.a.
Changes in MPC areas, 2007–2008
–(3–5) 0–1 10 –(6–10) 3–5 n.a.
aNo MINC areas were delineated in 2007 or 2008 and no sample plots were available within MNC areas; n.a. = data not available.
Table 4. Above-Ground Forage Biomass for fPAR Change Analysisa
Forage biomass (kg/ha)No. of
sample plotsMean Max. Min. SD
MINC areas, 2005 551 2524 34 562 21MPC areas, 2005 612 3138 34 297 67 MINC areas, 2006 328 1065 62 249 36MPC areas, 2006 496 1668 51 346 139MPC areas, 2007 356 1302 11 309 97MPC areas, 2008 249 975 11 208 82Changes in MINC areas, 2005–2006 –223 –1459 28 n.a. n.a.Changes in MPC areas, 2005–2006 –115 –1470 17 n.a. n.a.Changes in MINC areas 2007–2008 –107 –345 0 n.a. n.a.
aNo MINC areas were delineated in 2007 or 2008 and no sample plots were available within MNC areas; SD = standard deviation; n.a. = data not available.

372 chen et al.
entire summer and following spring, whereas the fPAR change layers developed in this study did not include vegetation changes that occurred between June and early August. Following this approach, the resultant change layers describe the amount of green biomass available (e.g., actively growing grasses) as the difference between the estimated total above-ground biomass during the active growth period (i.e., actively growing grasses, accumulated litter, and residual plant matter) and the estimated total above-ground biomass at the end of the previous growing season.
In this study, fPAR change values help describe the spatial variability of grasses and weeds based on the seasonal characteristics of fPAR change over semiarid range-lands. For example, a positive fPAR change indicates more grasses and weeds would be found during the growing period (i.e., increased spatial distribution). Similarly, a negative fPAR change indicates fewer patches of grasses and weeds would be found in an area during the growing period. fPAR images were selected to represent the active growth and late-summer senescence periods; therefore, fPAR change layers do not reflect an entire year of vegetation change (e.g., from June 2005 to June 2006). Hence, a positive fPAR change between 2005 and 2006 does not necessarily mean there was an increase in grass and weed biomass production in June 2006 relative to June 2005, but that the spatial distribution of grasses and herbaceous weeds was increased across the area. In addition, while the summary of field sample data and fPAR change levels describe the spatial variability of grasses and weeds, differences between years should not be used to quantify inter-annual variability of grasses and weeds. For example, changes in above-ground forage biomass in MPC and MINC areas for the periods 2005–2006 and 2007–2008 (Table 4) showed a reduction in both cases. However, compared to MINC areas, MPC areas showed less of a reduction in above-ground for-age biomass. This example supports the use of fPAR change as an indicator of changes in the spatial variability of grasses and weeds, and furthermore demonstrates that more grasses were produced in MPC areas relative to the MINC areas.
Because each MODIS pixel can contain many different types of ground features (e.g., shrubs, grasses, and weeds) the field measurements used in this study represent only a portion of a MODIS pixel’s information. It would be inappropriate to directly link a specific MODIS fPAR value to above-ground forage biomass values for an individual sample plot. In addition, because different years’ statistics were based on a different number of sample plots, which consist of different percentages of shrubs, grasses, litter, weeds, and bare ground, we cannot obtain field-measured above-ground forage biomass change and percent cover change at a given sample plot across time. For these reasons, the study area was categorized into areas of different fPAR change levels that were indirectly validated using above-ground forage biomass statistics to represent the spatial variability of grasses and weeds. In future field surveys, we plan to measure above-ground biomass for additional functional groups (e.g., forbs) at the same sample plot each year and use composited above-ground biomass values to pro-vide a better link with MODIS fPAR data.
Measurement of field fPAR is an arduous task and an insufficient number of field sites (e.g., flux tower) make field fPAR data unavailable to many studies. Ideally, field-measured fPAR data would have been available for this study. However, in lieu of these data, we used an accumulation of 10 years of field data (above-ground biomass and percent cover) for this study. In addition, TM fPAR estimations were developed using the SR-fPAR retrieval algorithm to provide a cross-sensor comparison of fPAR.

modis and landsat-5–derived fpar products 373
The seasonal characteristics of fPAR change over semiarid rangelands (e.g., her-baceous plants have a late-summer senescence period and fPAR values of herbaceous plants in this period declined) were considered in this study, and these fPAR change trends exhibited a positive relationship with changes in above-ground forage biomass and percent cover of grasses and weeds. These results were used to indirectly assess the MODIS fPAR product and the SR-fPAR retrieval algorithm used to produce a Landsat 5 TM fPAR product. The methodology presented herein was specifically designed for use within the semiarid sagebrush-steppe rangelands of southeastern Idaho, and should not be directly applied to other ecosystems. This is because there may be little difference in fPAR between the active growth and late-summer senes-cence periods in more humid rangelands or woodland ecosystems where precipitation is more uniformly distributed throughout the year, and distinct growing seasons/dry seasons are not present. However, similar studies should be undertaken to further vali-date the MODIS fPAR product.
CONCLUSION
This study focused on the comparison and assessment of the MODIS fPAR prod-uct for semiarid rangelands using cross-sensor comparisons with TM fPAR values as well as field-based observations and measurements. Landsat-5 TM and MODIS fPAR data were compared between active growth periods (June) and late-summer senescence periods (August) using measurements of above-ground forage biomass and percent ground cover from 2005, 2006, 2007, and 2008. Observed fPAR changes appear to be a function of changes in the composition and percent cover of grasses and weeds within the study area, as grasses and weeds are more ephemeral and dynamic in nature relative to shrubs. In contrast to previous MODIS fPAR validation studies, which noted that MODIS overestimated fPAR in many regions, this study validated Collection 5 MODIS fPAR products and found the difference between MODIS fPAR and TM fPAR values were very small small (x difference < 0.05). This may be the result of improvements in the Collection 5 MODIS fPAR retrieval algorithm.
Rangeland ecosystems are very important in the assessment of global ecosystem productivity, and abundant field-based measurements are crucial to the validation of satellite-based fPAR products. Future work will aim to collect additional field data to improve MODIS and TM fPAR applications for semiarid rangelands.
ACKNOWLEDGMENTS
This study was made possible by a grant from the National Aeronautics and Space Administration Goddard Space Flight Center (NNX08AO90G). Idaho State University would also like to acknowledge the Idaho Delegation for their assistance in obtaining this grant.
REFERENCES
Asner, G. P., Wessman, C. A., and S. Archer, 1998, “Scale Dependence of Absorption of Photosynthetically Active Radiation in Terrestrial Ecosystems,” Ecological Applications, 8(4):1003–1021.

374 chen et al.
Baret, F., Morissette, T. J., Fernandes, R. A., Champeaux, J. L., Myneni, R. B., Chen, J., Plummer, S., Weiss, M., Bacour, C., Garrigues, S., and J. E. Nickeson, 2006, “Evaluation of the Representativeness of Networks of Sites for the Global Val-idation and Intercomparison of Land Biophysical Products: Proposition of the CEOS-BELMANIP,” IEEE Transactions on Geoscience and Remote Sensing, 44(7):1794–1803.
Baret, F., Weiss, M., Allard, D., Garrigues, S., Leroy, M., Jeanjean, H., Fernandes, R., Myneni, R. B., Morissette, J. T., Privette, J., Bohbot, H., Bosseno, R., Dedieu, G., Di Bella, C, Espana, M., Gond, V., Gu, X. F., Guyon, D., Lelong, C., Maisongrande, P., Mougin, E., Nilson, T., Veroustraete, F., and R. Vintilla, 2009, “VALERI: A Network of Sites and a Methodology for the Validation of Medium Spatial Reso-lution Land Satellite Product,” Remote Sensing of Environment, forthcoming.
Bonan, G. B., 1995, “Land–Atmospheric Interactions for Climate System Models: Coupling Biophysical, Biogeochemical and Ecosystem Dynamical Processes,” Remote Sensing of Environment, 51(1):57–73.
Breman, H. and C. T. de Wit, 1983, “Rangeland Productivity and Exploitation in the Sahel,” Science, 221(4618):1341–1347.
Chavez, P. S., Jr., 1996, “Image-Based Atmospheric Corrections—Revisited and Improved,” Photogrammetric Engineering and Remote Sensing, 62(9):1025–1036.
Chen, F., Tang, J. M., and Z. Niu, 2008, “Estimating the Impact of Urbanization on LAI/fPAR in the Baltimore–Washington Corridor Area,” Canadian Journal of Remote Sensing, 34(S2):326–337.
Chen, J. M., 1996, “Canopy Architecture and Remote Sensing of the Fraction of Photosynthetically Active Radiation Absorbed by Boreal Conifer Forests,” IEEE Transactions on Geoscience and Remote Sensing, 34(6):1353–1368.
Chen, J. M., Deng, F., and M. Z. Chen, 2006, “Locally Adjusted Cubic-Spline Capping for Reconstructing Seasonal Trajectories of a Satellite-Derived Surface Param-eter,” IEEE Transactions on Geoscience and Remote Sensing, 44(8):2230–2238.
Cohen, W. B., Maiersperger, T. K., Yang, Z., Gower, S. T., Turner, D. P., Ritts, W. D., Berterretche, M., and S. W. Running, 2003, “Comparisons of Land Cover and LAI Estimates Derived from ETM+ and MODIS for Four Sites in North America: A Auality Assessment of 2000/2001 Provisional MODIS Products,” Remote Sens-ing of Environment, 88(3):233–255.
Dickinson, R. E., Shaikh, M., Graumlich, L., and R. Bryant, 1998, “Interactive Cano-pies for a Climate Model,” Journal of Climate, 11(11):2823–2836.
Feng, X., Liu, G., Chen, J. M., Chen, M., Liu, J., Ju, W. M., Sun, R., and W. Zhou, 2007, “Net Primary Productivity of Terrestrial Ecosystems in China Using a Pro-cess Model Driven by Remote Sensing,” Journal of Environmental Management, 85(3):563–573.
Fensholt, R., Sandholt, I., and M. S. Rasmussen, 2004, “Evaluation of MODIS LAI, fAPAR and the Relation Between fAPAR and NDVI in a Semi-arid Environment Using In-situ Measurements,” Remote Sensing of Environment, 91(3–4):490–507.
Franklin, J. F., Bledsoe, C. S., and J. T. Callahan, 1990, “Contributions of the Long-Term Ecological Research Program—an Expanded Network of Scientists, Sites, and Programs Can Provide Crucial Comparative Analysis,” Bioscience, 40(7):509–523.

modis and landsat-5–derived fpar products 375
Garrigues, S., Allard, D., and F. Baret, 2007, “Using First- and Second-Order Vario-grams for Characterizing Landscape Spatial Structures from Remote Sensing Imagery,” IEEE Transactions on Geoscience and Remote Sensing, 45(6):1823–1834.
Garrigues, S., Lacaze, R., Baret, F., Morisette, J. T., Weiss, M., Nickeson, J., Fernandes, R., Plummer, S., Shabanov, N. V., Myneni, R., and W. Yang, 2008, “Validation and Intercomparison of Global Leaf Area Index Products Derived from Remote Sensing Data,” Journal of Geophysical Research, 113(G2):G02028 [doi:10.1029/2007JG000635].
Gnieting, P., Gregory, J., and K. Weber, 2007, “Datum Transforms Involving WGS84” [http://giscenter.isu.edu/research/techpg/nasa_tlcc/template.htm].
Gobron, N., Pinty, B., Aussedat, O., Chen, J. M., Cohen, W. B., Fensholt, R., Gond, V., Huemmrich, K. F., Lavergne, T., Me’lin, F., Privette, J. L., Sandholt, I., Taberner, M., Turner, D. P., Verstraete, M. M., and J. Widlowski, 2006, “Evaluation of Frac-tion of Absorbed Photosynthetically Active Radiation Products for Different Can-opy Radiation Transfer Regimes: Methodology and Results Using Joint Research Center Products Derived from SeaSiFS Against Ground-Based Estimations,” Jour-nal of Geophysical Research, 111(D13):D13110 [doi:10.1029/2005JD006511].
Gower, S. T., Kucharik, C. J., and J. M. Norman, 1999, “Direct and Indirect Estimation of Leaf Area Index, fAPAR, and Net Primary Production of Terrestrial Ecosys-tems,” Remote Sensing of Environment, 70(1):29–51.
Hassan, Q. K., Bourque, C. P-A., and F. Meng, 2006, “Estimation of Daytime Net Ecosystem CO2 Exchange over Balsam Fir Forests in Eastern Canada: Combin-ing Averaged Tower-Based Flux Measurements with Remotely Sensed MODIS Data,” Canadian Journal of Remote Sensing, 32(6):405–416.
Heinsch, F. A., Zhao, M. S., Running, S. W., Kimball, J. S., Nemani, R. R., Davis, K. J., Bolstad, P. V., Cook, B. D., Desai, A. R., Ricciuto, D. M., Law, B. E., Oechel, W. C., Kwon, H., Luo, H. Y., Wofsy, S. C., Dunn, A. L., Munger, J. W., Baldocchi, D. D., Xu, L. K., Hollinger, D. Y., Richardson, A. D., Stoy, P. C., Siqueira, M. B. S., Monson, R. K., Burns, S. P., and L. B. Flanagan, 2006, “Evaluation of Remote Sensing Based Terrestrial Productivity from MODIS Using Regional Tower Eddy Flux Network Observations,” IEEE Transactions on Geoscience and Remote Sensing, 44(7):1908–1925.
Hill, M. J., Senarath, U., Lee, A., Zeppel, M., Nightingale, J. M., Williams, R. J., and T. R. McVicar, 2006, “Assessment of the MODIS LAI Product for Australian Ecosystems,” Remote Sensing of Environment, 101(4):495–518.
Holben, B. N., Eck, T. F., Slutsker, I., Tanre, D., Buis, J. P., Setzer, A., Vermote, E., Reagan, J. A., Kaufman, Y., Nakajima, T., Lavenu, F., Jankowiak, I., and A. Smirnov, 1998, “AERONET—a Federated Instrument Network and Data Archive for Aerosol Characterization,” Remote Sensing of Environment, 66(1):1–16.
Hu, J., Su, Y., Tan, B., Huang, D., Yang, W., Schull, M., Bull, M. A., Martonchik, J. V., Diner, D. J., Knyazikhin, Y., and R. B. Myneni, 2007, “Analysis of the MISR LAI/FPAR Product for Spatial and Temporal Coverage, Accuracy, and Consis-tency,” Remote Sensing of Environment, 107(1–2):334–347.
Huntsinger, L. and P. Hopkinson, 1996, “Viewpoint: Sustaining Rangeland Land-scapes: A Social and Ecological Process,” Journal of Range Management, 49(2):167–173.

376 chen et al.
Justice, C. O., Townshend, J. R. G., Vermote, E. F., Masuoka, E., Wolfe, R. E., Saleous, N., Roy, D. P., and J. Y. Morisette, 2002, “An Overview of MODIS Land Data Processing and Product Status,” Remote Sensing of Environment, 83(1–2):3–15.
Knyazikhin, Y., Martonchik, J. V., Myneni, R. B., Diner, D. J., and S. W. Running, 1998, “Synergistic Algorithm for Estimating Vegetation Canopy Leaf Area Index and Fraction of Absorbed Photosynthetically Active Radiation from MODIS and MISR Data,” Journal of Geophysical Research, 103(D24):32,257–32,276.
Los, S. O., Collatz, G. J., Sellers, P. J., Malmström, C. M., Pollack, N. H., Defries, R. S., Bounoua, L., Parris, M. T., Tucker, C. J., and D. A. Dazlich, 2000, “A Global 9-year Biophysical Land-surface Data Set from NOAA AVHRR Data,” Journal of Hydrometeorology, 1(2):183–199.
Milne, B. T. and W. B. Cohen, 1999, “Multiscale Assessment of Binary and Continu-ous Landcover Variables for MODIS Validation, Mapping, and Modeling Appli-cations,” Remote Sensing of Environment, 70(1):82–98.
Morisette, J. T., Baret, F., Privette, J. L., Myneni, R. B., Nickeson, J. E., Garrigues, S., Shabanov, N. V., Weiss, M., Fernandes, R. A., Leblanc, S. G., Kalacska, M., Sanchez-Azofeifa, G. A., Chubey, M., Rivard, B., Stenberg, P., Rautiainen, M., Voipio, P., Manninen, T., Pilant, A. N., Lewis, T. E., Iiames, J. S., Colombo, R., Meroni, M., Busetto, L., Cohen, W. B., Turner, D. P., Warner, E. D., Petersen, G. W., Seufert, G., and R. Cook, 2006, “Validation of Global Moderate- Resolution LAI Products: A Framework Proposed within the CEOS Land Product Validation Subgroup,” IEEE Transactions on Geoscience and Remote Sensing, 44(7):1804–1817.
Morisette, J. T., Nickeson, J., Davis, P., Wang, Y., Tian, Y., Woodcock, C., Shabanov, N., Hansen, M., Schaub, D. L., Huete, A. R., Cohen, W. B., Oetter, D. R., and R. E. Kennedy, 2003, “High Spatial Resolution Satellite Observations for Valida-tion of MODIS Land Products: IKONOS Observations Acquired under the NASA Scientific Data Purchase,” Remote Sensing of Environment, 88(1–2):100–110.
Morisette, J. T., Privette, J. L., and C. O. Justice, 2002, “A Framework for the Valida-tion of MODIS Land Products,” Remote Sensing of Environment, 83(1):77–96.
Myneni, R. B., Knyazikhin, Y., Zhang, Y., Tian, Y., Wang, Y., Lotsch, A., Privette, J. L., Morisette, J. T., Running, S. W., Nemani, R., Glassy, J., and P. Votava, 1999, “MODIS Leaf Area Index (LAI) and Fraction of Photosynthetically Active Radia-tion Absorbed by Vegetation (FPAR) Product (MOD15) Algorithm Theoretical Basis Document” [http://modis.gsfc.nasa.gov/data/atbd/land_atbd.php].
Myneni, R. B. and D. L.Williams, 1994, “On the Relationship between FAPAR and NDVI,” Remote Sensing of Environment, 49(3):200–211.
Paruelo, J. M., Epstein, H. E., Lauenroth, W. K., and I. C. Burke, 1997, “ANPP Estimates from NDVI for the Central Grassland Region of the United States,” Ecology, 78(3):953–958.
Running, S. W., Baldocchi, D. D., Turner, D. P., Gower, S. T., Bakwin, P. S., and K. A. Hibbard, 1999, “A Global Terrestrial Monitoring Network Integrating Tower Fluxes, Flask Sampling, Ecosystem Modeling and EOS Satellite Data,” Remote Sensing of Environment, 70(1):108–127.
Running, S. W., Nemani, R. R., Heinsch, F. A., Zhao, M., Reeves, M., and H. Hashimoto, 2004, “A Continuous Satellite-Derived Measure of Global Terrestrial Primary Production,” BioScience, 54(6):547–560.

modis and landsat-5–derived fpar products 377
Sellers, P. J., Berry, J. A., Collatz, G. J., Field, C. B., and F. G. Hal, 1992, “Canopy Reflectance, Photosynthesis, and Transpiration. III. A Reanalysis Using Improved Leaf Models and a New Canopy Integration Scheme,” Remote Sensing of Envi-ronment, 42(3):187–216.
Sellers, P. J., Los, S. O., Tucker, C. J., Justice, C. O., Dazlich, D. A., Collatz, G. J., and D. A. Randall, 1996, “A Revised Land Surface Parameterization (SiB2) for Atmo-spheric GCMs. Part II: The Generation of Global Fields of Terrestrial Biophysical Parameters from Satellite Data,” Journal of Climate, 9(4):706–737.
Sellers, P. J., Randall, D. A., Betts, A. K., Hall, F. G., Berry, J. A., Collatz, G. J., Denning, A. S., Mooney, H. A., Nobre, C. A., Sato, N., Field, C. B., and A. Henderson-Sellers, 1997, “Modeling the Exchanges of Energy, Water, and Carbon Between Continents and the Atmosphere,” Science, 275(5299):502–509.
Serr, K., Windholz, T., and K. Weber, 2006, “Comparing GPS Receivers: A Field Study,” Journal of the Urban and Regional Information Systems Association, 18(2):19–23.
Shabanov, N. V., Wang, Y., Buermann, W., Dong, J., Hoffman, S., Smith, G. R., Tian, Y., Knyazikhin, Y., and R. B. Myneni, 2003, “Effect of Foliage Spatial Heteroge-neity in the MODIS LAI and FPAR Algorithm over Broadleaf Forests,” Remote Sensing of Environment, 85(4):410–423.
Song, C. H., Woodcock, C. E., Seto, K. C., Lenney, M. P., and S. A. Macomber, 2001, “Classification and Change Detection Using Landsat TM Data: When and How to Correct Atmospheric Effects?,” Remote Sensing of Environment, 75(2):230–244.
Steinberg, D. C. and S. J. Goetz, 2009, “Assessment and Extension of the MODIS FPAR Products in Temperate Forests of the Eastern United States,” International Journal of Remote Sensing, 30(1):169–187.
Steinberg, D. C., Goetz, S. J., and E. J. Hyer, 2006, “Validation of MODIS FPAR Prod-ucts in Boreal Forests of Alaska,” IEEE Transactions on Geoscience and Remote Sensing, 44(7):1818–1828.
Swap, B., Suttles, T., Annegarn, H., Scorgie, Y., Closs, J., Privette, J., and B. Cook, 2000, “Report on SAFARI 2000 Outreach Activities, Intensive Field Campaign Planning Meeting, and Data Management Workshop,” Earth Observer, 12(3):21–25.
Tian, Y., Wang, Y., Zhang, Y., Knyazikhin, Y., Bogaert, J., and R. B. Myneni, 2002a, “Radiative Transfer Based Scaling of LAI Retrievals from Reflectance Data of Different Resolutions,” Remote Sensing of Environment, 84(1):143–159.
Tian, Y. H., Woodcock, C. E., Wang, Y. J., Privette, J. L., Shabanov, N. V., Zhou, L. M., Zhang, Y., Buermann, W., Dong, J. R., Veikkanen, B., Häme, T., Andersson, K., Ozdogan, M., Knyazikhin, Y., and R. B. Myneni, 2002b, “Multiscale Analysis and Validation of the MODIS LAI Product II. Sampling Strategy,” Remote Sensing of Environment, 83(3):431–441.
Turner, D. P., Ritts, W. D., Cohen, W. B., Gower, S. T., Zhao, M., Running, S. W., Wofsy, S. C., Urbanski, S. D., Allison, L., and J. W. Munger, 2003, “Scaling Gross Primary Production (GPP) over Boreal and Deciduous Forest Landscapes in Support of MODIS GPP Product Validation,” Remote Sensing of Environment, 88(3):256–270.
Turner, D. P., Ritts, W. D., Wharton, S., Thomas, C., Monson, R., Black, T. A., and M. Falk, 2009, “Assessing FPAR Source and Parameter Optimization Scheme in

378 chen et al.
Application of a Diagnostic Carbon Flux Model,” Remote Sensing of Environ-ment, 113(5):1529–1539.
Turner, D. P., Ritts, W. D., Zhao, M., Kurc, S. A., Dunn, A. L., Wofsy, S. C., Small, E. E., and S. W. Running, 2006, “Assessing Interannual Variation in MODIS-Based Estimates of Gross Primary Production,” IEEE Transactions in Geosci-ences and Remote Sensing, 44(7):1899–1907.
Weber, K. T., 2006, “Challenges of Integrating Geospatial Technologies into Range-land Research and Management,” Rangeland Ecology & Management, 59(1):38–43.
Weiss, M., Baret, F., Garrigues, S., and R. Lacaze, 2007, “LAI and fAPAR CYCLO-PES Global Products Derived from VEGETATION. Part 2: Validation and Com-parison with MODIS Collection 4 Products,” Remote Sensing of Environment, 110(3):317–331.
Yang, P., Shibasaki, R., Wu, W. B., Zhou, Q. B., Chen, Z. X., Zha, Y., Shi, Y., and H. J. Tang, 2007, “Evaluation of MODIS Land Cover and LAI Products in Cropland of North China Plain Using In-situ Measurements and Landsat TM Images,” IEEE Transactions on Geoscience and Remote Sensing, 45(10):3087–3097.
Yanskey, G. R., Markee, E. H., Jr., and A. P. Richter, 1966, “Climatography of the National Reactor Testing Station,” Idaho Falls, ID: United States Department of Commerce, Environmental Science Services Administration, Air Resources Field Research Office, USAEC Report IDO-12048.
Zhao, M. S., Heinsch, F. A., Nemani, R. R., and S. W. Running, 2005, “Improvements of the MODIS Terrestrial Gross and Net Primary Production Global Data Set,” Remote Sensing of Environment, 95(2):164–176.


![Original Research Assessing Spectral Indices for Detecting ... Spectral...Landsat-7, Landsat-8, MERIS/OLCI, MODIS and Sentinel-2 satellites [22]. Satellite data are defined by spatial,](https://static.fdocuments.net/doc/165x107/606bd980c33c710a7661828a/original-research-assessing-spectral-indices-for-detecting-spectral-landsat-7.jpg)