Comparison of Kinematic and Dynamic Behavior of a First...
15
1 2015 Ohio State University Injury Biomechanics Symposium This paper has not been peer- reviewed. Comparison of Kinematic and Dynamic Behavior of a First Generation Obese Dummy and Obese PMHS in Frontal Sled Tests Hamed Joodaki 1 , Jason Forman 1 , Ali Forghani 1 , Brian Overby 1 , Richard Kent 1 , Jeff Crandall 1 , Breanna Beahlen 2 , Mike Beebe 2 , Ola Bostrom 3 1 University of Virginia Center for Applied Biomechanics, 2 Humanetics Innovative Solutions Corporation, 3 Autoliv Research ABSTRACT The purpose of this study is to evaluate a first generation obese anthropometric test device (FGOA), comparing its kinematic and dynamic behavior with two obese post mortem human surrogates (PMHS) in matching frontal impact sled tests. The FGOA was built around an existing fiftieth percentile THOR male crash test dummy’s skeletal structure but with unique flesh and additional mass added to the upper and lower torso and upper legs. It had a mass of approximately 124 kg, stature of 175 cm, and body mass index of 40 kg/m 2 . Two 48 km/h PMHS tests and two 48 km/h dummy tests were performed with a sled buck representing the rear seat occupant component of a 2004 mid-sized sedan. Head, shoulder, pelvis, and knee maximum forward motion of the dummy were within 15%, 9%, 15%, and 30%, respectively, of the mean PMHS values. The mean peak of upper shoulder belt, lower shoulder belt, and lap belt tension were 5.9 kN, 6.8 kN, and 10.7 kN with the FGOA, compared to 6.4 kN, 6.6 kN, and 9.0 kN with the PMHS. This study was the first to evaluate biofidelity of the FGOA. The FGOA and PMHS exhibited similar kinematic characteristics that have been highlighted previously as potentially challenging for restraint systems design. Most notably, both the PMHS and dummy exhibited substantial forward motion of lower body and subsequent backwards rotation of the torso, affected by limited engagement of the lap belt with the pelvis. Although the differences presented suggest that further refinement may be warranted, the similarities suggest that this dummy may prove useful as a research tool to begin investigating the challenges of, and potential strategies for, the safe restraint of obese occupants. INTRODUCTION Body Mass Index (BMI), which equals to individual’s weight divided by square of height (kg/m 2 ), is a commonly used measure of obesity in adult population. According to the World Health Organization (WHO), people with BMI of 30 kg/m 2 or higher are considered as obese (WHO, 1995). Obesity has increased during the past three decades in the United States. Between the periods of 1988-1989 and 2003-2004, the waist circumference and abdominal obesity among US adults have increased continuously (Li et al., 2007). Average BMI increased by 0.37% per year in both male and female US adults from 1988 to 2010 (Ladabaum et al., 2014). In 2009–2010, over 78 million U.S. adults and about 12.5 million U.S. children and adolescents were obese (Ogden et al., 2012) .In 2011-2012, 34.9% of US adults age 20 years or older had BMI of more than 30 kg/m 2 (Ogden et al., 2014).
Transcript of Comparison of Kinematic and Dynamic Behavior of a First...

1
2015 Ohio State University Injury Biomechanics Symposium This paper has not been peer- reviewed.
Comparison of Kinematic and Dynamic Behavior of a First Generation Obese Dummy and Obese PMHS in Frontal Sled Tests
Hamed Joodaki1, Jason Forman1, Ali Forghani1, Brian Overby1, Richard Kent1, Jeff Crandall1, Breanna Beahlen2, Mike Beebe2, Ola Bostrom3
1University of Virginia Center for Applied Biomechanics, 2Humanetics Innovative Solutions Corporation, 3Autoliv Research
ABSTRACT The purpose of this study is to evaluate a first generation obese anthropometric test device (FGOA), comparing its kinematic and dynamic behavior with two obese post mortem human surrogates (PMHS) in matching frontal impact sled tests. The FGOA was built around an existing fiftieth percentile THOR male crash test dummy’s skeletal structure but with unique flesh and additional mass added to the upper and lower torso and upper legs. It had a mass of approximately 124 kg, stature of 175 cm, and body mass index of 40 kg/m2. Two 48 km/h PMHS tests and two 48 km/h dummy tests were performed with a sled buck representing the rear seat occupant component of a 2004 mid-sized sedan. Head, shoulder, pelvis, and knee maximum forward motion of the dummy were within 15%, 9%, 15%, and 30%, respectively, of the mean PMHS values. The mean peak of upper shoulder belt, lower shoulder belt, and lap belt tension were 5.9 kN, 6.8 kN, and 10.7 kN with the FGOA, compared to 6.4 kN, 6.6 kN, and 9.0 kN with the PMHS. This study was the first to evaluate biofidelity of the FGOA. The FGOA and PMHS exhibited similar kinematic characteristics that have been highlighted previously as potentially challenging for restraint systems design. Most notably, both the PMHS and dummy exhibited substantial forward motion of lower body and subsequent backwards rotation of the torso, affected by limited engagement of the lap belt with the pelvis. Although the differences presented suggest that further refinement may be warranted, the similarities suggest that this dummy may prove useful as a research tool to begin investigating the challenges of, and potential strategies for, the safe restraint of obese occupants.
INTRODUCTION
Body Mass Index (BMI), which equals to individual’s weight divided by square of height (kg/m2), is a commonly used measure of obesity in adult population. According to the World Health Organization (WHO), people with BMI of 30 kg/m2 or higher are considered as obese (WHO, 1995).
Obesity has increased during the past three decades in the United States. Between the periods of 1988-1989 and 2003-2004, the waist circumference and abdominal obesity among US adults have increased continuously (Li et al., 2007). Average BMI increased by 0.37% per year in both male and female US adults from 1988 to 2010 (Ladabaum et al., 2014). In 2009–2010, over 78 million U.S. adults and about 12.5 million U.S. children and adolescents were obese (Ogden et al., 2012) .In 2011-2012, 34.9% of US adults age 20 years or older had BMI of more than 30 kg/m2 (Ogden et al., 2014).
2
2015 Ohio State University Injury Biomechanics Symposium This paper has not been peer- reviewed.
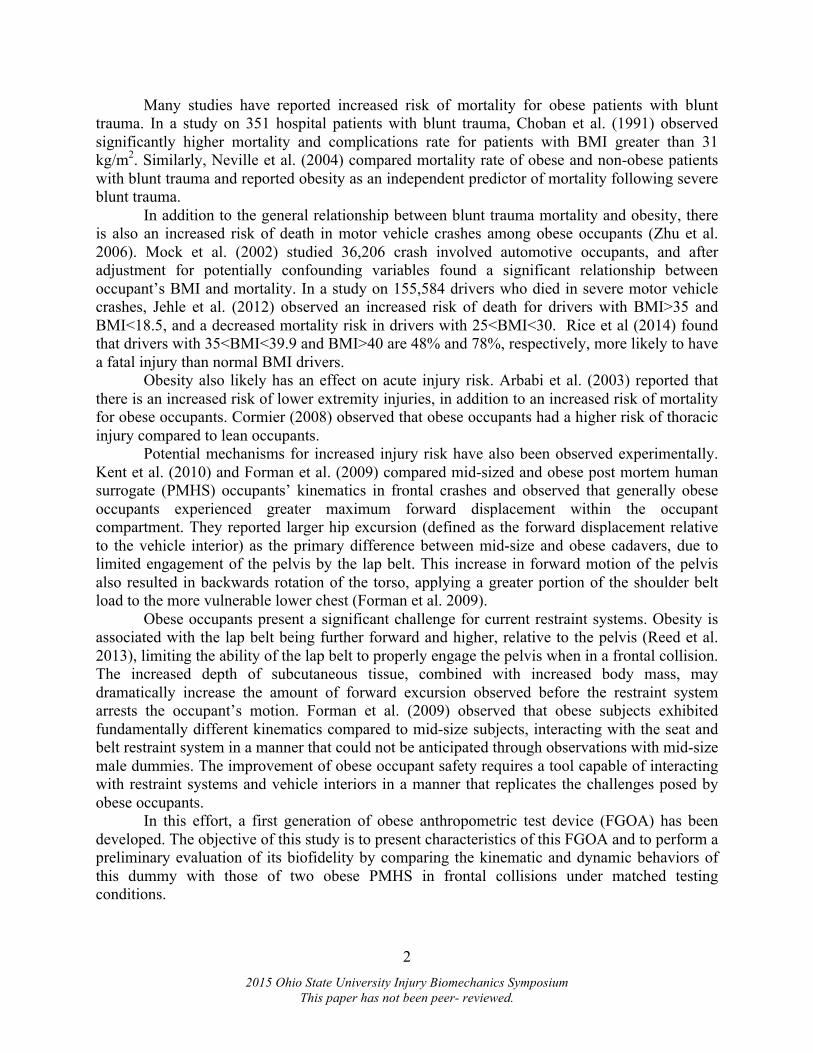
Many studies have reported increased risk of mortality for obese patients with blunt trauma. In a study on 351 hospital patients with blunt trauma, Choban et al. (1991) observed significantly higher mortality and complications rate for patients with BMI greater than 31 kg/m2. Similarly, Neville et al. (2004) compared mortality rate of obese and non-obese patients with blunt trauma and reported obesity as an independent predictor of mortality following severe blunt trauma.
In addition to the general relationship between blunt trauma mortality and obesity, there is also an increased risk of death in motor vehicle crashes among obese occupants (Zhu et al. 2006). Mock et al. (2002) studied 36,206 crash involved automotive occupants, and after adjustment for potentially confounding variables found a significant relationship between occupant’s BMI and mortality. In a study on 155,584 drivers who died in severe motor vehicle crashes, Jehle et al. (2012) observed an increased risk of death for drivers with BMI>35 and BMI<18.5, and a decreased mortality risk in drivers with 25<BMI<30. Rice et al (2014) found that drivers with 35<BMI<39.9 and BMI>40 are 48% and 78%, respectively, more likely to have a fatal injury than normal BMI drivers.
Obesity also likely has an effect on acute injury risk. Arbabi et al. (2003) reported that there is an increased risk of lower extremity injuries, in addition to an increased risk of mortality for obese occupants. Cormier (2008) observed that obese occupants had a higher risk of thoracic injury compared to lean occupants.
Potential mechanisms for increased injury risk have also been observed experimentally. Kent et al. (2010) and Forman et al. (2009) compared mid-sized and obese post mortem human surrogate (PMHS) occupants’ kinematics in frontal crashes and observed that generally obese occupants experienced greater maximum forward displacement within the occupant compartment. They reported larger hip excursion (defined as the forward displacement relative to the vehicle interior) as the primary difference between mid-size and obese cadavers, due to limited engagement of the pelvis by the lap belt. This increase in forward motion of the pelvis also resulted in backwards rotation of the torso, applying a greater portion of the shoulder belt load to the more vulnerable lower chest (Forman et al. 2009).
Obese occupants present a significant challenge for current restraint systems. Obesity is associated with the lap belt being further forward and higher, relative to the pelvis (Reed et al. 2013), limiting the ability of the lap belt to properly engage the pelvis when in a frontal collision. The increased depth of subcutaneous tissue, combined with increased body mass, may dramatically increase the amount of forward excursion observed before the restraint system arrests the occupant’s motion. Forman et al. (2009) observed that obese subjects exhibited fundamentally different kinematics compared to mid-size subjects, interacting with the seat and belt restraint system in a manner that could not be anticipated through observations with mid-size male dummies. The improvement of obese occupant safety requires a tool capable of interacting with restraint systems and vehicle interiors in a manner that replicates the challenges posed by obese occupants.
In this effort, a first generation of obese anthropometric test device (FGOA) has been developed. The objective of this study is to present characteristics of this FGOA and to perform a preliminary evaluation of its biofidelity by comparing the kinematic and dynamic behaviors of this dummy with those of two obese PMHS in frontal collisions under matched testing conditions.

3
2015 Ohio State University Injury Biomechanics Symposium This paper has not been peer- reviewed.
METHODS
ATD development The FGOA is built on an existing platform of the THOR-FT 50th percentile male
anthropometric test device (ATD, Figure 1). The conversion to the obese ATD was accomplished through a flesh jacket representing the superficial tissue of an obese male. The flesh jacket consisted of chest, pelvis, and upper thigh fleshes. The chest jacket was made from silicone and the thigh and pelvis fleshes were made from a polyurethane mixture poured around foam. They were constructed from these molded materials to allow the flesh to be pliable enough so that the dummy buttock and thighs would fit and conform into seat. The legs and arms were ballasted to meet their target weights (Table 1).
To facilitate comparison, the external geometry and overall body mass of the current prototype of the FGOA jacket is based specifically on the anthropometry of one of the PMHS previously tested in frontal impact tests (number 404, Table 2). The internal skeletal dimensions of that subject (e.g., the internal diameter of the ribcage) were similar to those of a 50th percentile male PMHS (Forman et al. 2009). Thus, the majority of the difference in the mass and exterior dimensions between this particular obese subject and a nominal 50th percentile male occurred as a result of increased superficial tissue and abdominal fat. For the altered components, the mass distribution was chosen roughly based on the original mass distribution of the THOR dummy.
Figure 1: Completed obese ATD
prototype Figure 2: Overlay of obese ATD with PMHS #404

4
2015 Ohio State University Injury Biomechanics Symposium This paper has not been peer- reviewed.
TABLE 1: Body Mass Distribution Segment Hybrid III (kg, %) THOR (kg, %) FGOA (kg, %) Head 4.53 (5.8%) 4.62 (6.1%) 4.62(3.7%) Neck 1.54 (1.9%) 1.65 (2.2%) 1.65(1.3%) Upper Torso 17.19 (22.1%) 13.42 (17.9%) 22.22(17.9%) Lower Torso 23.04 (29.7%) 28.25 (37.7%) 50.80(41.0%) Upper Arm (each) 1.99 (2.5%) 1.99 (2.6%) 3.28(2.6%) Lower Arm + Hand (each) 2.26 (2.9%) 2.26 (3.0%) 3.74(3.0%) Upper leg (each) 5.98 (7.6%) 4.45 (5.9%) 7.34(5.9%) Lower leg + feet (each) 5.44 (7.0%) 4.75 (6.3%) 7.89(6.3%) Total Weight 77.70 74.91 123.79
TABLE 2: ATD vs. PMHS External Measurements
ATD PMHS #404 PMHS #400
Mass 123.8 124 151 Stature 175 189 182 BMI 40.4 34.7 45 Chest Breadth - 4th Rib 42 40 39 Chest Breadth - 8th Rib 41 36 40.5 Chest Depth - 4th Rib 29 23.5 28.3 Chest Depth - 8th Rib 30 25.5 31.5 Hip Breadth 44.5 39.1 40 Chest Circumference - 4th Rib 130 110.7 124 Chest Circumference - 8th Rib 119 114.3 131 Waist Circumference - At Umbilicus 123.5 120 140 Waist Circumference - 8cm above Umbilicus 120 119.7 136 Waist Circumference - 8cm below Umbilicus 126 116.9 139.4 Thigh Circumference 65 68.6 74 Shoulder Breadth (Biacromial) 49 43 38.5 Seated Head to Buttock 93.5 98 110 Dimension unit: cm, mass unit: kg , BMI unit: kg/m2
Once the Obese ATD prototype was complete, the external dimensions were measured
and compared to those of the PMHS #404 (Table 2). An overlay picture of the 35 BMI PMHS and Obese ATD is shown in Figure 2. Minor dimensional differences were noticed between the flesh jacket and PMHS. Table 1 indicates the mass distribution weights; these distributions were based on the THOR-M ATD.
PMHS subjects
Two obese PMHS were used whose characteristics can be found in Table 2. Their bloods were drawn and screened for HIV and hepatitis A, B, and C. They were CT scanned for pre-existing injuries and preserved until test time by freezing at 0oC. Freezing occurred approximately one week after death, during which cadavers were stored in refrigerator. Thawing occurred at room temperature and over approximately 48 hours. The subjects’ pulmonary and

5
2015 Ohio State University Injury Biomechanics Symposium This paper has not been peer- reviewed.
cardiovascular systems were pressurized to a nominal in vivo level (approximately 10 kPa for both) via tracheostomy and Hetastarch blood plasma replacement solution immediately prior to testing. All PMHS handling and test protocols were approved by the University of Virginia institutional review board.
Although a portion of results of PMHS tests were published previously (Forman et al. 2009, Kent et al. 2010), all of the data have been re-analyzed to facilitate comparison to the dummy.
Sled and information of tests
The test buck was mounted to a sled system (deceleration sled for the PMH tests, acceleration sled for the dummy tests) which generated deceleration pulses based on frontal barrier tests of mid-sized sedan. Tests were performed with nominal changes in velocity (ΔVs) of 48km/h. Acceleration plots of the tests are shown in Figure 3. Table 3 provides the test matrix.
TABLE 3: Test matrix
Test Number S0278 S0280 1333 1335 Speed (km/h) 48 48 48 48 Subject FGOA FGOA PMHS 404 PMHS 400
Figure 3: Sled acceleration of different tests.
Positioning
The subjects were positioned in the right seating position of a sled buck representing the rear seat occupant component of a 2004 mid-sized sedan. The initial positioning measurements and the descriptions of the used parameters can be found in Tables 4 and 5, and Figures 4 and 5. The front seats of the buck were removed in order to observe the interaction of the subjects with the rear seat and seatbelt without the potentially confounding effects of interaction between the knees and the front seatback. All tests were performed with a 3-point belt restraint that included
0 50 100 150 200-10
0
10
20
3048 km/h
Time(ms)
Sled
Acc
eler
atio
n(g)
1333S02781335S0280

6
2015 Ohio State University Injury Biomechanics Symposium This paper has not been peer- reviewed.
a deck-mounted retractor, a retractor pretensioner, and a progressive force-limiter. The first force level of the restraint system was 2.9 kN and the second force level started from 4.2 kN (see Forman et al. 2008).
Figure 4: Description of positioning parameters of Table 4. FSB: Front Seat back angle (from vertical), HPT: H-point longitudinal distance from seat (+ is forward of rear seat), HPTZ: H-point vertical distance from seat (+ is above seat), C: Chest center line to Front Seat (horizontal distance, to top edge of seat), KL: Lateral distance, right knee centerline to left knee centerline, F: Femur angle (from horizontal), T: Tibia angle (from horizontal), KDL: Left knee to front seat back (closest distance), KDR: Right knee to front seat back (closest distance), N: Nose to front seat back (shortest distance to top edge), TA: Torso angle (angle of line from shoulder to H-point, from horizontal)
TABLE 4: Positioning measurements Parameter 1333 1335 S0278 S0280 FSB 68 68 68 69 HPT 22 28 20 21 HPTZ 19 nm 25 15 C 619 594 615 615 KL 295 350 300 300 F 23 19 19 19 T 53 58 57 59 KDL 199 115 224 199 KDR 192 117 203 198 N 717 625 715 716 TA 69 71 68 70 All dimensions in millimeters, angles in degrees * nm: not measured
+HL
HS
KL
−HL
F
C
KDL, KDR
HPTZ HPT
FSB
H
T
TA

7
2015 Ohio State University Injury Biomechanics Symposium This paper has not been peer- reviewed.
Figure 5: Description of belt positioning parameters of Table 5. A: Lateral neck edge to medial belt edge, B: Lateral belt edge to CL at sternal notch, C: Top of lap plate to lower belt edge on CL, D: Top of lap plate to upper belt edge on CL, E: Angle of belt from horizontal, F: Lateral angle of belt from front edge of retractor to shoulder along tape (straight line).
Video tracking High speed video cameras recorded the tests at a frame rate of 1,000 Hz from offboard
passenger side and driver side views. Target markers were mounted to the subjects’ head, shoulder, hip, and knee. First, target marker positions were tracked with 1ms steps to have their positions in pixel units (Hedrick 2008). Each body part was tracked until its maximum forward motion (maximum displacement in posterior-anterior direction). Interpolation was used for the periods during which targets were covered by vehicle components or other body parts. Using two length reference markers, one for the vehicle target marker plane and another for occupant plane, pixel-to-meter conversion coefficients were defined to convert positions from pixel unit to meter.
TABLE 5: Belt positioning data Label Unit 1333 1335 S0278 S0280 A mm 0 0 67 55 B mm 108 67 88 71 C mm 286 212 298 292 D mm 335 265 377 367 E deg 41 41 48 44 F deg 2 7 3 1
Anterior view of the subject’s thorax
To lap plate
A
B
D C
E
F Neck
Sternal Notch
Thorax Center Line (CL) Lateral view

8
2015 Ohio State University Injury Biomechanics Symposium This paper has not been peer- reviewed.
Tracking a reference point on the vehicle, relative motions of the targets with respect to the buck were determined. Then the processed data were filtered, using the following equation:
41))Y(t1),(X(tY(t))2(X(t),1))-Y(t1),-(X(t(t))Y'(t),(X' ++++
=
Where (X’(t),Y’(t)) and (X(t),Y(t)) are the filtered and unfiltered, respectively, coordinates in time t. The origin of the coordinate system was shifted to the initial position of the hip target marker for each test. Moreover, by having shoulder and hip positions at each moment, torso angle (see Figure 4 for definition) of each test was determined from 0 ms until maximum shoulder excursion time. Since the calculated angles were the angle of line connecting shoulder and hip target marker with –X direction, torso angle results were shifted in order to match the initial torso angles with data of Table 4.
Accelorometers To record PMHS acceleration, accelerometers were mounted on different locations of body
during subject preparation procedure (see Forman et al. 2009). The dummy’s accelerations of different body segments were measured using tri-axial accelerometer cubes placed at the head center of gravity (c.g.), chest c.g., and pelvis. All data were sampled at 10,000 Hz .The following steps were taken to process the data post-test:
• The signals were truncated to include the data between -10 and 200 ms, with 0 ms being the sled acceleration onset.
• The truncated data was then filtered according to the SAE J211 classes. • The truncated and filtered data was debiased by taking the mean signal value between -10
and 0 ms and subtracting it from the rest of the signal.
RESULTS Data peak summary is presented in Table 6. In test S0278 a spike (Figure 6) happened
which may be attributable to looseness in a spine joint which was tightened in subsequent test. This spike was observed in the head, pelvis, and chest acceleration time-histories. In order to have a logical comparison between acceleration histories of the FGOA and PMHS this spike was removed. In FGOA tests, other spikes were observed in head acceleration time-histories which were caused by the hand impact with the head (Figure 6). Other spikes in the subjects’ pelvis acceleration time-histories happened when the subjects traveled off of the front edge of the seat. These sorts of spikes are not coming from the physical phenomenon that are tried to compare. Hence, they are ignored in Table 6 (3ms clip used for pelvis) and choosing Y-limits in Figure 8.
Figure 7 illustrates torso angles for both the FGOA and PMHS groups until maximum shoulder forward motion for all tests. Head, pelvis, chest (for the FGOA), and T8 (for the PMHS) accelerations of all tests are exhibited in Figure 8. The subjects’ head c.g., shoulder, hip, and knee motion trajectories are shown in Figure 9.

9
2015 Ohio State University Injury Biomechanics Symposium This paper has not been peer- reviewed.
Figure 6: Illustration of spike seen in resultant head acceleration of test S0278. This spike was
removed for calculation of the peak and plot of accelerations for test S0278.
Figure 7: Calculated torso angle time-histories.
TABLE 6: Selected peak data
Test Number Unit S0278 S0280 1333 1335 Subject Type FGOA FGOA PMHS PMHS Max. Head acceleration g 45.9 47.7 39.4 38.0 Max. Pelvis Acceleration g 25.7 22.8 31.7 55.5 Max. Chest/T8 Acceleration* g 32.1 37.2 27 30.1 Max. Head Angular Velocity rad/s 67.6 60 31.8 25.5 Max. Lower Shoulder Belt Force kN 6.88 6.80 6.07 7.16 Max. Upper Shoulder Belt Force kN 6.02 5.87 6.33 6.59 Max. Lap Belt Force kN 10.38 11.11 8.82 9.35 Max. Head Forward Motion m 0.63 0.66 0.62 0.49 Max. Shoulder Forward Motion m 0.55 0.58 0.53 0.50 Max. Pelvis Forward Motion m 0.48 0.50 0.39 0.46 Max. Knee Forward Motion m 0.41 0.48 0.33 0.30
0 50 100 150 2000
50
100
150
Time [ms]
Hea
d R
esul
tant
Acc
eler
atio
n [g
]
S0278
0 50 100 15065
70
75
80
85
90
95
Time (ms)
Tors
o A
ngle
(deg
)
S02781333S02801335
Spike
Head-hand impact

10
2015 Ohio State University Injury Biomechanics Symposium This paper has not been peer- reviewed.
Figure 8: Accelerarion-time histories of all tests.
Figure 9: Head c.g., shoulder, hip, and knee trajectories of all tests.
0 50 100 150 2000
10
20
30
40
50
Time [ms]
Hea
d R
esul
tant
Acc
eler
atio
n [g
]
S0278S0280
0 50 100 150 2000
20
40
60
80
Time [ms]
Pelv
is R
esul
tant
Acc
eler
atio
n [g
]
S0278S0280
0 50 100 150 2000
10
20
30
40
Time [ms]
Che
st R
esul
tant
Acc
eler
atio
n [g
]
S0278S0280
0 50 100 150 2000
10
20
30
40
50
Time [ms]
Hea
d R
esul
tant
Acc
eler
atio
n [g
]
13331335
0 50 100 150 2000
20
40
60
80
Time [ms]
Pelv
is R
esul
tant
Acc
eler
atio
n [g
]
13331335
0 50 100 150 2000
10
20
30
40
Time (ms)
T8 R
esul
tant
Acc
eler
atio
n [g
]
13331335PMHS PMHS PMHS
FGOA FGOA FGOA

11
2015 Ohio State University Injury Biomechanics Symposium This paper has not been peer- reviewed.
DISCUSSION
ATD anthropometry
Obesity is categorized into three different classes: class 1: 30<BMI<35, class 2: 35<BMI<40, and class 3: BMI>40 (WHO 1997). Increased risk of mortality in automobile crashes tends to occur in in class 2 and 3 of obesity (Rice et al. 2014). In other words, mortality risk in automobile collisions tends to increase once a person’s BMI exceeds 35. In 2009-2010, 35.5%, 12.5%, and 4.4% of the US adult men older than 20 had BMI of greater than 30, 35, and 40 respectively (Flegal et. al. 2012) This means that the FGOA’s BMI of 40 represents the 96th of all adult males, and the 65th percentile of all level 2 and 3 obese adult males who exhibit increased risk of mortality in automobile collisions due to obesity. The only other currently available large male dummy is the Hybrid III 95th percentile male. At 188 cm in height and 101 kg in weight, the Hybrid III 95th represents a BMI of 28.6. This is less than the 70th percentile U.S. adult male BMI. The Hybrid III 95th does not take into account changes in body mass distribution or increases in superficial soft tissue depth associated with obesity. The FGOA represents a similar proportion of the population (96th percentile by BMI), but in a manner that more accurately replicates the changes in body habitus and soft tissue distribution that occurs with obesity. The FGOA is also just above the median BMI (65th percentile) of those occupants who are at increased fatality risk due to obesity.
Obesity can result in a wide variety of body mass distribution and anthropometry characteristics, complicating efforts to develop and evaluate an “average” obese occupant model. To facilitate a direct biofidelity assessment, the anthropometry of this dummy prototype was developed based on a specific PMHS for which sled testing data was available. Thus, this may be considered as an effort to evaluate the general design methods and materials used for the obese dummy retrofit. If the design of this dummy retrofit can be validated against a specific matching PMHS, then the anthropometry of the retrofit may later be modified to represent a different target obese anthropometry for which sled testing data may not be available. Such a modification could be made based on body mass distribution targets from the more general obese population. Any effort to quantify an “average” obese anthropometry should include a consideration for characteristic anthropometry patterns using methods such as Principal Component Analysis or similar.
Kinematic comparison
The FGOA exhibited similar forward head excursion and shoulder excursion compared to the PMHS #404, whose external geometry was considered as the FGOA’s targets, and somewhat greater forward motion of the pelvis and knee. Forman et al. (2009) and Kent et al. (2010) previously observed that one of the critical kinematic differences observed between obese subjects and mid-sized subjects was the nature of the rotation of the upper body throughout the interaction with the restraints. Due to increased forward excursion of the pelvis, the upper body tended to exhibit very little forward rotation of the torso with the obese PMHS, compared to improved pelvis restraint with greater forward rotation of the torso with the mid-sized PMHS. In other words, with the obese PMHS the entire body tended to move forward into the restraint system with very little torso rotation. This phenomenon was replicated with the FGOA (Figure 7).
12
2015 Ohio State University Injury Biomechanics Symposium This paper has not been peer- reviewed.
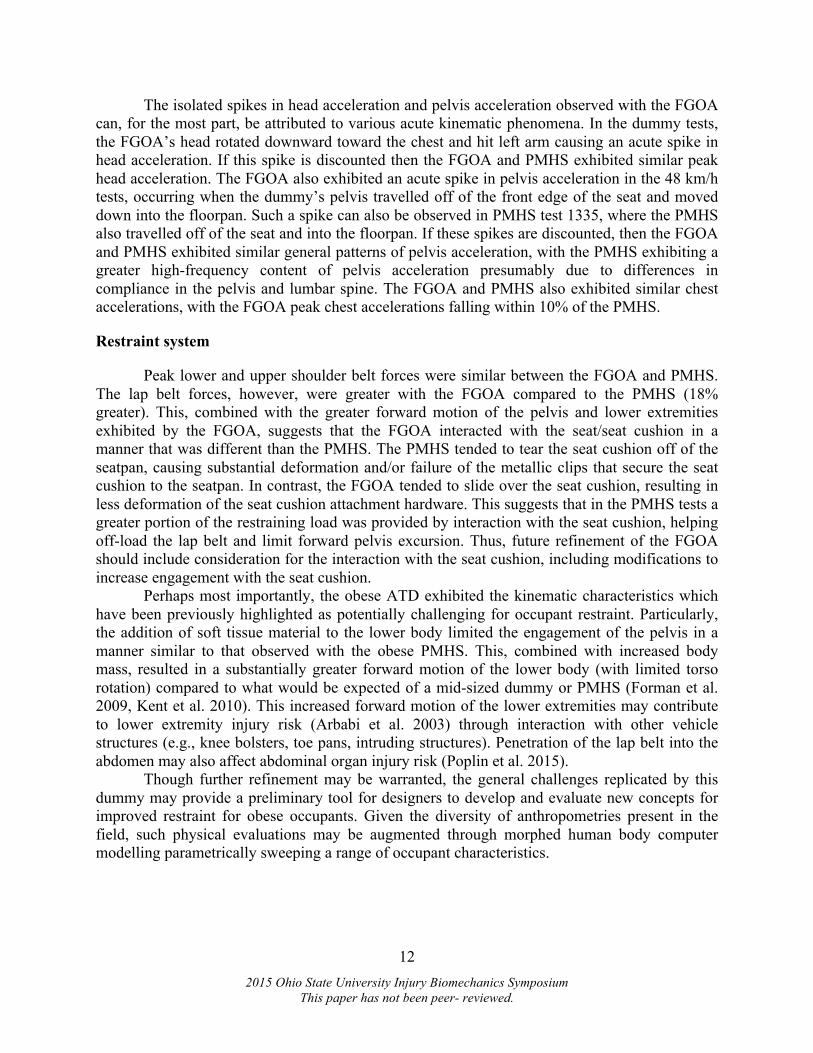
The isolated spikes in head acceleration and pelvis acceleration observed with the FGOA can, for the most part, be attributed to various acute kinematic phenomena. In the dummy tests, the FGOA’s head rotated downward toward the chest and hit left arm causing an acute spike in head acceleration. If this spike is discounted then the FGOA and PMHS exhibited similar peak head acceleration. The FGOA also exhibited an acute spike in pelvis acceleration in the 48 km/h tests, occurring when the dummy’s pelvis travelled off of the front edge of the seat and moved down into the floorpan. Such a spike can also be observed in PMHS test 1335, where the PMHS also travelled off of the seat and into the floorpan. If these spikes are discounted, then the FGOA and PMHS exhibited similar general patterns of pelvis acceleration, with the PMHS exhibiting a greater high-frequency content of pelvis acceleration presumably due to differences in compliance in the pelvis and lumbar spine. The FGOA and PMHS also exhibited similar chest accelerations, with the FGOA peak chest accelerations falling within 10% of the PMHS.
Restraint system
Peak lower and upper shoulder belt forces were similar between the FGOA and PMHS. The lap belt forces, however, were greater with the FGOA compared to the PMHS (18% greater). This, combined with the greater forward motion of the pelvis and lower extremities exhibited by the FGOA, suggests that the FGOA interacted with the seat/seat cushion in a manner that was different than the PMHS. The PMHS tended to tear the seat cushion off of the seatpan, causing substantial deformation and/or failure of the metallic clips that secure the seat cushion to the seatpan. In contrast, the FGOA tended to slide over the seat cushion, resulting in less deformation of the seat cushion attachment hardware. This suggests that in the PMHS tests a greater portion of the restraining load was provided by interaction with the seat cushion, helping off-load the lap belt and limit forward pelvis excursion. Thus, future refinement of the FGOA should include consideration for the interaction with the seat cushion, including modifications to increase engagement with the seat cushion.
Perhaps most importantly, the obese ATD exhibited the kinematic characteristics which have been previously highlighted as potentially challenging for occupant restraint. Particularly, the addition of soft tissue material to the lower body limited the engagement of the pelvis in a manner similar to that observed with the obese PMHS. This, combined with increased body mass, resulted in a substantially greater forward motion of the lower body (with limited torso rotation) compared to what would be expected of a mid-sized dummy or PMHS (Forman et al. 2009, Kent et al. 2010). This increased forward motion of the lower extremities may contribute to lower extremity injury risk (Arbabi et al. 2003) through interaction with other vehicle structures (e.g., knee bolsters, toe pans, intruding structures). Penetration of the lap belt into the abdomen may also affect abdominal organ injury risk (Poplin et al. 2015).
Though further refinement may be warranted, the general challenges replicated by this dummy may provide a preliminary tool for designers to develop and evaluate new concepts for improved restraint for obese occupants. Given the diversity of anthropometries present in the field, such physical evaluations may be augmented through morphed human body computer modelling parametrically sweeping a range of occupant characteristics.

13
2015 Ohio State University Injury Biomechanics Symposium This paper has not been peer- reviewed.
CONCLUSIONS A preliminary biofidelity evaluation was performed with a first generation obese ATD
compared to two obese PMHS in frontal impact sled tests. The FGOA and PMHS exhibited similar head and upper body kinematics (excursions and accelerations), and both exhibited lower body kinematics that demonstrate the challenges posed to restraint system design. The FGOA exhibited somewhat greater concomitant pelvis motion and lap belt force, suggesting differences in the interaction with the seat/seat cushion. Though further refinement may be warranted, this dummy may provide a useful preliminary tool for designers to develop and evaluate new concepts for improved restraint for obese occupants.
ACKNOWLEDGEMENTS This study was partially supported by Autoliv Research. The sled buck was provided by
Ford Motor Corporation and the restraint systems were provided by Autoliv Research. The obese ATD was developed and provided by Humanetics Innovative Solutions Corporation. The authors would also like to acknowledge the assistance and support of the students and staff of the UVA Center for Applied Biomechanics.
REFERENCES
ARBABI, S., WAHL, W. L., et al. (2003). The Cushion Effect. J Trauma, Vol. 54, pp 1090–1093, 2003.
CHOBAN, P.S., WEIRETER, L. J., MAYNES, C. (1991). Obesity and Increased Mortality in Blunt Trauma. Journal of Trauma, Vol. 31, No. 9, pp 1253-1257.
CORMIER, J. M. (2008). The Influence of Body Mass Index on Thoracic Injuries in Frontal Impacts. Accident Analysis & Prevention, Volume 40, pp 610–615.
FLEGAL, K. M., CARROLL, M. D., KIT, B. K., OGDEN, C. L. (2012). Prevalence of obesity and in the distribution of body mass index among US adults, 1999-2010. JAMA. 2012, Vol. 307(5), pp 491-497.
FORMAN, J., MICHAELSON, J., KENT, R., KUPPA, S., BOSTROM, O. (2008). Occupant Restraint in the Rear Seat: ATD Responses to Standard and Pre-Tensioning, Force-Limiting Belt Restraints. Ann Adv Automot Med., Vol. 52. pp 141–154.
FORMAN, J., LOPEZ-VALDES, F. J., LESSLEY, D., KINDING, M., KENT, R. (2009). The Effect of Obesity on the Restraint of Automobile Occupants. AAAM, Vol. 53, pp 25–40.
Hedrick, T. L. (2008). Software Techniques for Two and Three-Timensional Kinematic Measurements of Biological and Biomimetic Systems. Bioinspiration and Biomimetics, Vol. 3.
JEHLE, D., GEMME, S., JEHLE, C. (2012). Influence of Obesity on Mortality of Drivers in Severe Motor Vehicle Crashes. The American Journal of Emergency Medicine, Volume 30, pp 191–195.

14
2015 Ohio State University Injury Biomechanics Symposium This paper has not been peer- reviewed.
KENT, R., FORMAN, J., BOSTROM, O. (2010). Is There Really a “Cushion Effect”?: a Biomechanical Investigation of Crash injury Mechanisms in the Obese. Obesity, Vol. 18, pages 749–753.
LADABAUM, U., MANNALITHARA, A., MYER, P. A., SINGH G. (2014). Obesity, Abdominal Obesity, Physical Activity, and Caloric Intake in US Adults: 1988 to 2010. The American Journal of Medicine, Volume 127, Issue 8, pp 717–727.
LI, C, FORD, E.S., MCGUIRE, LC, MOKDAD, AH (2007). Increasing Trends in Waist Circumference and Abdominal Obesity among U.S. Adults. Obesity Vol. 15, No. 1, pp 216-224.
MOCK, CN, GROSSMAN, DC, KAUFMAN, RP, MACK, CD, RIVARA, FP (2002). The relationship between body weight and risk of death and serious injury in motor vehicle crashes. Accid Anal Prev,Vol. 34, 221–228.
NEVILLE, AL, BROWN, CV, WENG, J, DEMETRIADES, D, VELHAMOS, GC (2004). Obesity is an Independent Risk Factor of Mortality in Severely Injured Blunt Trauma Patients. Arch. Surg. Vol. 139, pp 983-987.
OGDEN, C. L., CARROLL, M. D., KIT, B. K., FLEGAL, K. M. (2012). Prevalence of Obesity in the United States, 2009–2010. NCHS Data Brief, No. 82.
OGDEN, C. L., CARROLL, M. D., KIT, B.K., FLEGAL, K. M. (2014). Prevalence of Childhood and Adult Obesity in the United States, 2011-2012. JAMA, Vol. 311, pp 806-814.
POPLIN, G., McMURRY, T., et al. (2015). Nature and Etiology of Hollow-Organ Abdominal Injuries in Frontal Crashes. Accid Anal Prev. pp 51-57.
REED, M. P., EBERT, S. M., HALLMAN, J. J. (2013). Effects of Driver Characteristics on Seat Belt Fit. Stapp Car Crash Journal, Vol 57, pp. 43-57.
RICE, T. M., ZHU, M. (2014). Driver Obesity and the Risk of Fatal Injury During Traffic Collisions. Emerg Med J, Vol. 31, pp 9–12, January 2014.
SHAW, G., CRANDALL, J., BUTCHER, J. (2002). Comparative Evaluation of the THOR Advanced Frontal Crash Test Dummy (2002). International Journal of Crashworthiness, Vol. 7, Issue 3.
WHO (1995).Physical status: the use and interpretation of anthropometry. In: Geneva;
WHO (1997). Obesity: Preventing and Managing the Global Epidemic. Report of a WHO Consultation of Obesity. Geneva, 3-5.

15
2015 Ohio State University Injury Biomechanics Symposium This paper has not been peer- reviewed.
ZHU, S., LAYDE, P. M., GUSE, C. E., LAUD, P. W., PINTAR, F., NIRULA, R., HARGARTEN, S. (2006). Obesity and risk for death due to motor vehicle crashes. American Journal of Public Health, Vol 96, No. 4, pp 734–739.