Comparison of Harakeke with Hemp Fibre as a Potential ...
30
Comparison of Harakeke with Hemp Fibre as a Potential Reinforcement in Composites M.G Aruan Efendy a,b and K. L. Pickering a a Faculty of Science and Engineering, University of Waikato, New Zealand b Faculty of Civil Engineering, Universiti Teknologi MARA, Malaysia Corresponding author: M.G Aruan Efendy, Tel.: +64 22194491 E mail addresses: [email protected], [email protected] ABSTRACT The objective of this study was to characterize the performance of untreated and chemically treated harakeke fibre (a leaf fibre from a plant native to New Zealand) and compare with hemp fibre to assess its use as potential reinforcement in composites. Alkali treatment is among the most popular treatments used to remove unwanted fibre constituents such as pectin, hemicellulose and waxes; it can enhance fibre properties, fibre separation, interfacial bonding and fibre dispersion within a composite. Physical and mechanical properties of untreated and alkali treated fibres were assessed using single fibre tensile testing, X-ray diffraction (XRD), scanning electron microscopy (SEM) and thermal analysis using thermogravimetric analysis (TGA). Untreated harakeke fibre was found to be lower in tensile strength compared to untreated hemp fibre. It was also found that the tensile strength of harakeke and hemp fibres treated with 5wt% NaOH/2wt% Na2SO3 and 5wt% NaOH was not significantly affected and these fibres had good fibre separation. However, alkali treatment was found to lead to higher crystallinity index (Ic) and better thermal stability for harakeke as well as hemp fibres.
Transcript of Comparison of Harakeke with Hemp Fibre as a Potential ...
Comparison of Harakeke with Hemp Fibre as a Potential
Reinforcement in Composites
M.G Aruan Efendya,b and K. L. Pickeringa
a Faculty of Science and Engineering, University of Waikato, New Zealand
b Faculty of Civil Engineering, Universiti Teknologi MARA, Malaysia
Corresponding author:
M.G Aruan Efendy,
Tel.: +64 22194491
E mail addresses: [email protected], [email protected]
ABSTRACT
The objective of this study was to characterize the performance of untreated and
chemically treated harakeke fibre (a leaf fibre from a plant native to New Zealand) and
compare with hemp fibre to assess its use as potential reinforcement in composites.
Alkali treatment is among the most popular treatments used to remove unwanted fibre
constituents such as pectin, hemicellulose and waxes; it can enhance fibre properties,
fibre separation, interfacial bonding and fibre dispersion within a composite. Physical
and mechanical properties of untreated and alkali treated fibres were assessed using
single fibre tensile testing, X-ray diffraction (XRD), scanning electron microscopy
(SEM) and thermal analysis using thermogravimetric analysis (TGA). Untreated
harakeke fibre was found to be lower in tensile strength compared to untreated hemp
fibre. It was also found that the tensile strength of harakeke and hemp fibres treated with
5wt% NaOH/2wt% Na2SO3 and 5wt% NaOH was not significantly affected and these
fibres had good fibre separation. However, alkali treatment was found to lead to higher
crystallinity index (Ic) and better thermal stability for harakeke as well as hemp fibres.
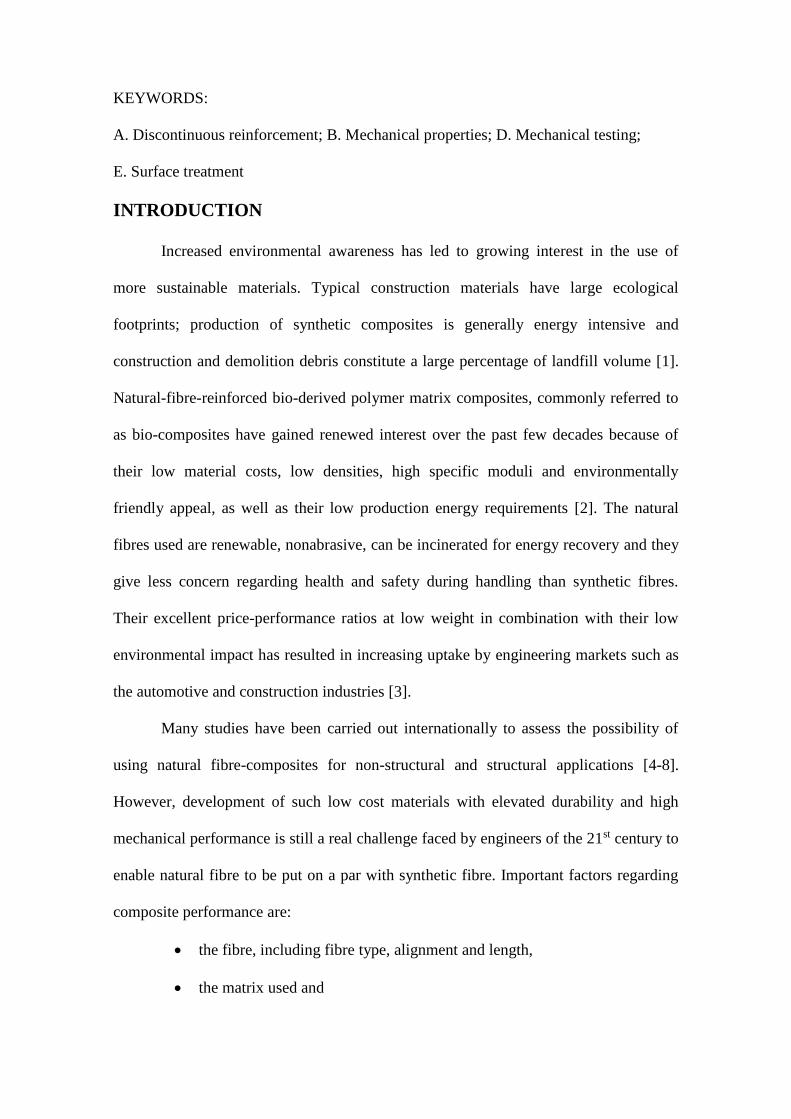
KEYWORDS:
A. Discontinuous reinforcement; B. Mechanical properties; D. Mechanical testing;
E. Surface treatment
INTRODUCTION
Increased environmental awareness has led to growing interest in the use of
more sustainable materials. Typical construction materials have large ecological
footprints; production of synthetic composites is generally energy intensive and
construction and demolition debris constitute a large percentage of landfill volume [1].
Natural-fibre-reinforced bio-derived polymer matrix composites, commonly referred to
as bio-composites have gained renewed interest over the past few decades because of
their low material costs, low densities, high specific moduli and environmentally
friendly appeal, as well as their low production energy requirements [2]. The natural
fibres used are renewable, nonabrasive, can be incinerated for energy recovery and they
give less concern regarding health and safety during handling than synthetic fibres.
Their excellent price-performance ratios at low weight in combination with their low
environmental impact has resulted in increasing uptake by engineering markets such as
the automotive and construction industries [3].
Many studies have been carried out internationally to assess the possibility of
using natural fibre-composites for non-structural and structural applications [4-8].
However, development of such low cost materials with elevated durability and high
mechanical performance is still a real challenge faced by engineers of the 21st century to
enable natural fibre to be put on a par with synthetic fibre. Important factors regarding
composite performance are:
the fibre, including fibre type, alignment and length,
the matrix used and

the interfacial bonding which enables transfer of the applied load to the
fibres
Weak interfacial bonding between the reinforcing agent and the matrix in natural
reinforced composites is a major drawback which limits their application. Interfacial
strength plays a vital role in determining the mechanical properties of composite
materials. A strong interface provides composites that display good strength and
stiffness but tend to be brittle. A weaker interface on the other hand, may reduce the
stress transfer from matrix to the fibre, hence the composite may display lower strength
and stiffness but may in contrast have increased toughness. Depending on the
application, interfacial strength can be engineered by modifying the fibre surface using
physical and chemical treatment and modifying the matrix by addition of coupling
agent. The literature shows that these methods increase compatibility and potential
reactivity between fibre and matrix and hence increase the interfacial strength between
matrix and reinforcing agent [9].
The present work is a preliminary study of the mechanical and physical properties of
harakeke fibre compared to hemp fibre including the effect of alkali treatment.
Harakeke is a monocotyledonous plant endemic to New Zealand and is renowned for its
fibre which was used by early European settlers in New Zealand as a replacement for
European flax and here is commonly called ‘native flax’. It fibre can be extracted from
upper and lower side of its leaves. However, unlike European flax, from which fibre is
extracted from stalk, the fibre from harakeke is extracted from the leaves of this plant.
The leaves are stiff and tough and can grow up to 3 m long and 125 mm wide. The
favourable strength and stiffness of the fibre and mechanisation of the extraction around
the 1920s resulted in an expansion of the harakeke fibre industry with the fibres
becoming an important export commodity used in a variety of applications such as
clothing, mats, baskets, ropes, fishing lines and nets [10, 11]. The chemical composition
of harakeke fibre is tabulated in Table 1[12]. Two different types of alkali with various
concentrations were used in isolation or in combination with the aim of maximising the
fibre properties for enhancement of mechanical and physical properties of composites.
There are several papers published reporting the improvement of fibre properties when
treated with various alkali treatments [10, 13, 14], but only limited papers discussing the
mechanical behaviour of single fibres, with none for harakeke that have been found by
the authors. This work was aimed at acquiring a better understanding of the potential of
these fibres for reinforcement in composites. Together with mechanical and physical
assessments, this paper also includes analysis of fibre strength using Weibull statistics.
EXPERIMENTAL
Materials
Harakeke fibre was obtained from the Templeton Flax mill, Riverton. It was
mechanically prepared and supplied in bundle form. Hemp fibre was locally grown
from October 2012 and harvested in February 2013 after 120 days and donated by the
Hemp Farm NZ Ltd. Green hemp stalks were dried exposed to air for two weeks and
then the bast fibre was hand separated from the stalks.
Methods
Alkali Fibre Treatment
Alkali treatment was carried out using a laboratory scale pulp digester (normally
used for paper making) at different temperatures and for different durations. Three
alkali formulations were used in this investigation: 5wt% sodium hydroxide (NaOH),
10wt% NaOH and 5wt% NaOH with 2wt% sodium sulphite (Na2SO3). The chemicals
used (purchased from Scharlau Chemie S.A.) were analytical grade Na2SO3 pellets and
NaOH powder, both with 98% purity level. The abbreviations used for the fibres and
treatments are shown in Table 2.

The three alkali solutions were used with a fibre (harakeke or hemp) to solution
ratio of 1:8 by weight. Predetermined amounts of harakeke and hemp fibres were placed
in stainless steel canisters with pre-mixed NaOH and Na2SO3 solutions. The canisters
were then placed into a small lab-scale pulp digester with the treatment cycles,
controlled by a 4-step controlled programme, chosen based on preliminary screening
trials. Trials had previously been conducted raising the temperature from ambient to a
maximum temperature over 90 minutes. It had been demonstrated that treatment
conducted for longer than 30 minutes at a temperature for more than 160°C reduced the
tensile strength of hemp fibre considerably. However, with treatment conducted at less
than 160°C the fibre tensile strength was maintained, but the separation of the fibre was
very poor. Therefore, treatment at 160°C for 30 minutes was chosen for hemp fibre. For
harakeke, it was found that in order to get fibre separation, treatment was required to be
conducted at 170°C for at least 40 minutes, however, harakeke fibre treated at higher
than 170°C was slightly degraded even though the fibre separation was improved. This
is supported by research conducted elsewhere, such that treatment at 170°C was found
to give the optimum fibre separation for harakeke [15]. Therefore, treatment at 170°C
for 40 minutes was chosen for harakeke fibre.
Scanning Electron Microscopy
SEM micrographs of untreated and treated fibres were taken using a Hitachi S-
4100 field emission scanning electron microscope (SEM). Prior to SEM observation,
the samples were mounted on aluminium stubs using carbon tape and then coated with
plasma sputtering to avoid the sample becoming charged under the electron beam. SEM
observation was carried out at 5 kV.
Single Fibre Tensile Testing
The tensile strength and Young’s modulus of untreated, NaOH and
NaOH/Na2SO3 treated harakeke and hemp fibres were tested according to the ASTM
D3379-75: Standard Test Method for Tensile Strength and Young's Modulus for High-
Modulus Single Filament Materials. Single fibres were mounted on 2mm thick
cardboard mounting-cards with a 2mm gauge length as schematically shown in Figure
1. PVA glue was applied to hold the fibres to the cardboard and define the gauge length.
Harakeke and hemp fibres, similar to other cellulosic fibres generally have variable
cross-sectional areas and diameters along their length. To account for this, the diameter
of the fibres was measured at five different points along the fibres length by means of an
Olympus BX60F5 optical microscope. Typical single harakeke and hemp fibres
observed under optical microscope are shown in Figure 2 and 3 respectively. It can be
seen that harakeke fibre is finer than hemp fibre, but otherwise looked similar.
The apparent cross-sectional area of each fibre was then calculated using the
mean fibre diameter and assuming a circular cross-section. The measured and mounted
fibres were then placed in the grips of an Instron-4204 universal testing machine and the
supporting sides of the mounting cards were cut using a hot-wire cutter. The fibres were
then tensile tested to failure at a rate of 0.5mm/min using a 10N-load cell. 30 replicate
samples were tested for each batch and average tensile strength (TS) and Young’s
moduli (YM) were obtained using the results from all specimens. As an extensometer
cannot be used on such thin specimens, elongation of single fibres was determined
through the displacement of the testing machine cross head. The crosshead
displacement, however, is actually a combination of the fibre elongation as well as the
crosshead deformation, specimen grips, and the cardboard mounting card. For accurate
measurement of fibre elongation and Young’s modulus, system compliance is required
and was determined experimentally using related procedures described in ASTM
D3375-75 [16]. In this study, specimens of different gauge lengths of 5, 10 and 15 mm
of hemp and harakeke were prepared using similar set up used in single fibre testing.
From the corresponding load-displacement curves for each specimen, the inverse of the
slope of the initial linear region of the force versus cross-head displacement curve
representing the apparent compliance was determined. By plotting indicated compliance
against gauge length and extrapolating this function to zero gauge length, leads to the
testing device compliance which was then used to calculate Young’s modulus.
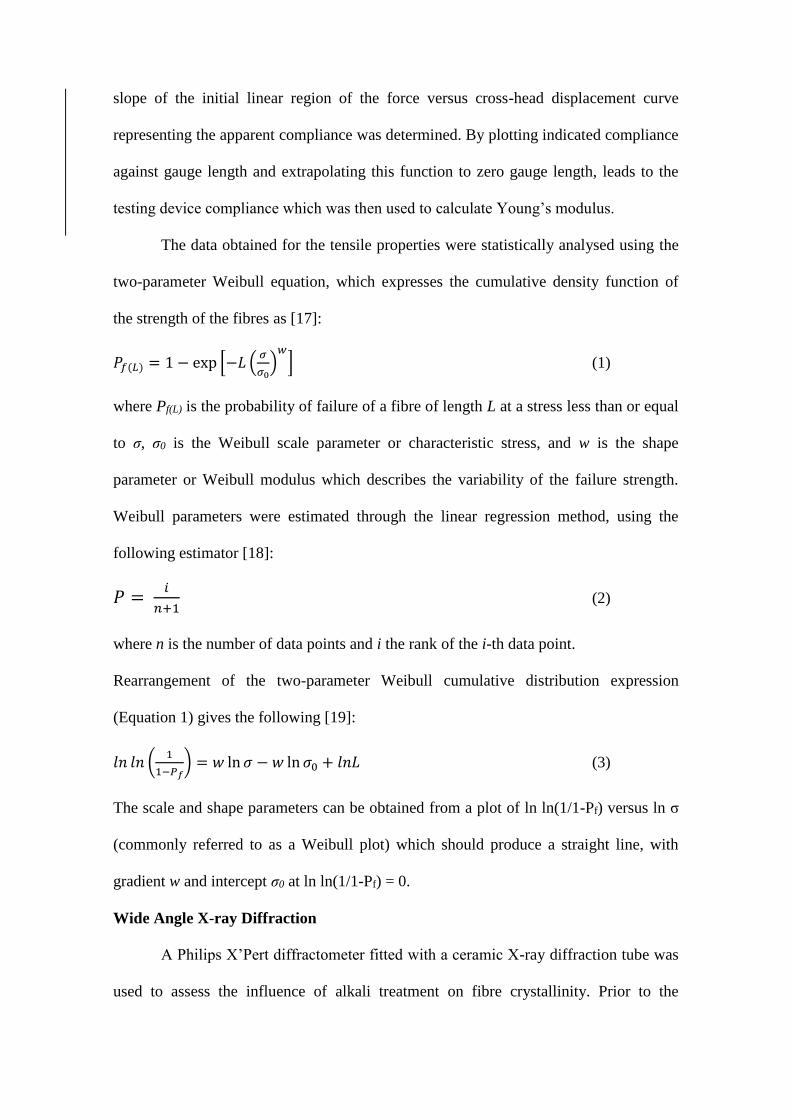
The data obtained for the tensile properties were statistically analysed using the
two-parameter Weibull equation, which expresses the cumulative density function of
the strength of the fibres as [17]:
𝑃𝑓(𝐿) = 1 − exp [−𝐿 (𝜎
𝜎0)
𝑤
] (1)
where Pf(L) is the probability of failure of a fibre of length L at a stress less than or equal
to σ, σ0 is the Weibull scale parameter or characteristic stress, and w is the shape
parameter or Weibull modulus which describes the variability of the failure strength.
Weibull parameters were estimated through the linear regression method, using the
following estimator [18]:
𝑃 = 𝑖
𝑛+1 (2)
where n is the number of data points and i the rank of the i-th data point.
Rearrangement of the two-parameter Weibull cumulative distribution expression
(Equation 1) gives the following [19]:
𝑙𝑛 𝑙𝑛 (1
1−𝑃𝑓) = 𝑤 ln 𝜎 − 𝑤 ln 𝜎0 + 𝑙𝑛𝐿 (3)
The scale and shape parameters can be obtained from a plot of ln ln(1/1-Pf) versus ln σ
(commonly referred to as a Weibull plot) which should produce a straight line, with
gradient w and intercept σ0 at ln ln(1/1-Pf) = 0.
Wide Angle X-ray Diffraction
A Philips X’Pert diffractometer fitted with a ceramic X-ray diffraction tube was
used to assess the influence of alkali treatment on fibre crystallinity. Prior to the

analysis, untreated and treated harakeke and hemp fibres were cut by hand into fine
particles and compressed into disks using a cylindrical steel mould with appropriate
amount of pressure. The diffracted intensity of CuKα radiation (λ = 1.54nm) was
recorded between 12° and 30° (2θ-angle range) using a current and voltage of 40 mA
and 40 mV with scanning speed of 0.02 degrees/second. The percentage crystallinity
index (Ic) was then determined using the Segal empirical method according to the
following equation [20, 21]:
𝐼𝐶 = (𝐼002−𝐼𝑎𝑚)
𝐼002𝑥 100 (4)
where I002 is the maximum intensity of diffraction of the lattice peak at a 2θ-angle of
between 22° and 23° and Iam is the intensity of diffraction of the amorphous material,
which is taken at a 2θ-angle between 18° and 19° where the intensity is at a minimum
[22, 23].
Thermal Analysis
Untreated and treated fibre samples weighing between 8 and 12 mg were
analysed using an SDT 2960 Simultaneous DTA-TGA analyser. The analysis was
operated in a dynamic mode, heating from ambient temperature to 500°C at 10°C/min
in air purged at 150 ml/min with an empty pan used as a reference. Differential thermal
analysis (DTA) and thermal gravimetric analysis (TGA) curves were obtained at the end
of the operation.
Results and Discussion
Scanning Electron Microscopy
SEM micrographs of harakeke fibres are shown in Figure 4 to Figure 6 and
hemp in Figures 7 and 8. As can be seen in Figure 4a, untreated harakeke fibre bundles
were composed of many single fibres attached to each other and coated with substances
known to include hemicellulose, pectin, lignin, and other non-strengthening components

[21]. In contrast, alkali treated harakeke fibres (shown Figure 5 and 6) were separated
from each other and appeared to have undergone removal of surface coating revealing
less rounded sides and a rougher texture with a large numbers of grooves, believed to be
cellulose rich as seen for treatment of other cellulosic fibres [24-26]. The fibre
separation resulting from the removal of non-strengthening components along with the
exposure of rougher texture would have increased contact area for bonding and could
therefore be expected to improve fibre-matrix interfacial bonding. The improvement of
fibre-matrix adhesion is also expected due to the exposure of more cellulose OH groups,
which could bond with reactive sites on the matrix [24]. Likewise for hemp, all treated
fibre was well separated and surfaces appeared to have increased overall rugosity
compared to the untreated fibre as shown in Figure 7(b) and Figure 8.
Single Fibre Tensile Testing
Alkali treatment of cellulosic fibres using NaOH and Na2SO3 is widely used in
the pulp and paper industry to separate single fibres from their bundles and as
mentioned previously has also been shown to remove non-reinforcing components and
can improve the fibre properties, although overtreatment can decrease fibre properties
significantly [27-30]. Ideally alkali treatment should separate fibres, improve fibre
dispersion within composites and offer an improvement to the fibre properties [31].
As can be seen in Table 3, the harakeke fibres were a lot finer than hemp fibres
(as seen in optical micrographs) and were not quite as strong but stiffer. Alkali
treatments resulted in a decrease of fibre diameter for both harakeke and hemp fibres,
which can be attributed to the removal of alkali-soluble components from the fibre cell
walls. For the treatments using NaOH only, the reduction in diameter for hemp and
harakeke fibre was found to correspond to the severity of the treatment used, considered
to be simply due to more alkali-soluble components removed from the fibre at higher
alkali concentration. The diameter of harakeke reduced by 5.8% and 12.2% and that for
hemp reduced by 16.3% and 16.8% when treated using 5wt% NaOH and 10wt% NaOH
solutions respectively. Treatment using 5wt% NaOH/2wt% Na2SO3 was found to give
maximum reduction in diameter for both fibres. The reductions in fibre diameter for
harakeke and hemp treated with this solution were found to be 13.8 and 18.9%
respectively. Addition of Na2SO3 has been shown elsewhere to assist NaOH in the
removal of lignin and shorten treatment times required [32-34]. These effects are
facilitated when sulphite groups (SO2-3) in the Na2SO3 are introduced into the lignin
side chains by means of sulphonation, and enable the lignin to be quickly dissolved into
the alkaline solution [12, 35]. Although no specific analysis was conducted to measure
the lignin content of treated fibres in this study, it is proven elsewhere that lignin was
effectively removed by the application of Na2SO3 [28]. It was found that treatment with
10wt% NaOH removed sufficient hemicellulose and pectin from hemp fibre to give
good fibre separation, but similar separation was not obtained with 10wt% NaOH for
harakeke as harakeke contains greater amount of lignin compared to hemp [12].
However, good separation was achieved for harakeke using 2wt% Na2SO3 with 5wt%
NaOH at the higher temperature and longer processing time required to remove a
greater amount of lignin.
Reduction in average tensile strength was observed for all treated harakeke and
hemp fibres. Tensile strength of harakeke and hemp fibres reduced dramatically, up to
nearly 30% relative to untreated fibres when treated with 10wt% NaOH solution. The
smallest reduction for treated harakeke and hemp fibres were 3 and 15.4% when treated
using 5wt% NaOH/2wt% Na2SO3 and 5wt% NaOH respectively. However, this
reduction was found to be insignificant when the tensile strength data was analysed
using a one-tailed Student's t-test and given that fibre separation had occurred, these
were considered useful treatments. That different treatment should be required for hemp
and harakeke is not surprising given the higher levels of non-cellulosic components
removal in harakeke leading to the requirement of a higher concentration of alkali even
when conducted at higher temperature and for a longer time.
Also from Table 3, Young’s modulus can be seen to increase or decrease
dependent on the treatment used. The average Young’s modulus for treated harakeke
fibres reduced by 1.54% and 10.0% when treated with 5wt% NaOH and 10wt% NaOH
but increased by 2.36% when treated with 5wt% NaOH/2wt% Na2SO3. Statistical
analysis did not support a significant reduction in Young’s modulus of treated hemp
fibres when compared with those of the untreated fibres, although high variability of
data was observed considering experimental errors which at some level have influenced
the variability in calculated values [30]. Surprisingly for hemp, the Young’s modulus
for all treated fibres was improved with treatment; treatment using 10wt% NaOH
improved the Young’s modulus the most, (by 37.9%) and was found significant as
suggested by the Student’s t-test. The increment in Young’s modulus could be due to
improvement in cellulose rigidity resulting in removal of non-cellulosic
components.Taking into consideration the desire for fibre separation as well as strength,
harakeke fibre treated with 5wt% NaOH/2wt% Na2SO3 was selected along with hemp
fibre treated with 5wt% NaOH for further study.
The tensile strength of fibres was further statistically analysed using the Weibull
cumulative distribution through linear regression and applying the estimator in equation
2. Weibull characteristic strength and Weibull modulus are tabulated in Table 4. It is
worthy of note that the two-parameter Weibull distribution approximated the
experimental data relatively well, particularly for alkali treated fibres. As expected,
Weibull characteristic strength has the same trend as the average tensile strength.
Bearing in mind that natural fibres generally possess much larger property variability
than commercially produced synthetic fibres in terms mechanical, physical, and
chemical properties, low Weibull modulus representing a high distribution of fibre
strength was expected as is seen here. From Table 4, it can be seen that, Weibull
modulus for harakeke fibre varied from 2.43 to 4.88 and from 1.75 to 3.00 for hemp
fibre with the lowest Weibull modulus observed in untreated harakeke and hemp fibres.
These values are comparable with those from other authors for cellulosic fibres [18, 29,
36-38]. The lower Weibull moduli values for untreated fibre may be explained by the
fact that the untreated fibre is larger in diameter having a bigger volume and therefore is
more likely to contain more defects.
Wide Angle X-ray Diffraction
For most cellulosic fibres, peaks for crystalline phases are normally observed at
around 2θ = 15, 17 and 20° (denoted as peaks 1, 2 and 3 respectively as shown in Figure
9) which represent the cellulose crystallographic planes (110), (1ī0) and (002). The
amorphous phase peak (denoted as peak 4) was assigned according to the current
literature [39] at the lowest point between peaks 2 and 3 (for (002) and (1ī0) planes).
Generally, it is found in studies that cellulose crystallographic (002) planes are clearly
represented, however, the cellulose crystallographic plane peaks of (110) and (1ī0) are
only clearly seen separately when the cellulose content is high [40], but when the fibre
contains high amounts of amorphous material, these two peaks overlap and appear as
one broad peak [21, 41].
The X-ray diffractograms of untreated, NaOH treated and NaOH/Na2SO3 treated
harakeke and hemp fibres are shown in Figure 10 and Figure 11. As expected, major
crystalline peaks for harakeke and hemp fibres occurred at 2θ around 22°. It can be seen
that intensity of the (002) crystallographic plane peak increased significantly as a result
of alkali treatment suggesting removal of amorphous material [22, 30]. Other peaks
were present on the X-ray diffractograms for harakeke and hemp fibre at 2θ around 15
and 17°, which represent the cellulose crystallographic planes of (110) and (1ī0)

respectively. These peaks can be clearly observed individually for all treated hemp fibre
but only with treatment using 10wt% NaOH for harakeke. Although the (002) peak is
not the highest for harakeke treated with 10wt% NaOH, it is the peak areas that give
most accurate information on crystallinity on which crystallinity index is established.
The values of crystallinity index (Ic) for treated and untreated harakeke and hemp fibres
are presented in Table 5. The values of crystallinity index (Ic) were calculated using
Equation 4 considering the peaks for the crystalline (peak 3) and the amorphous (peak
4) phases as depicted in Figure 9 [39]. It should be noted that the crystallinity index is
generally used for comparison rather than to define absolute crystallinity [28]. As can be
seen in the presented results, the crystallinity index (Ic) of harakeke and hemp fibres was
effectively increased by alkali treatment. The crystallinity index (Ic) of treated fibres
was increased up to 20% (using 10wt% NaOH solution) for harakeke and 15% (using
5wt% NaOH solution) for hemp with low variation between treated fibres. Such
behaviour is expected, as under the applied treatment, amorphous materials (e.g. lignin,
hemicellulose and wax) would be removed from the fibres [20, 29].
Increase in fibre crystallinity with alkali treatment has also been suggested to
occur due to better packing and stress relaxation of cellulose chains. However, the
removal of excessive amounts of amorphous materials can possibly reduce the tensile
strength by loss of adhesion between cellulose microfibrils [22].
Thermal Analysis
The TGA and DTA thermograms for harakeke and hemp fibres are shown in
Figure 12 and 13 respectively. The thermal degradation of harakeke and hemp fibre can
be identified by reduction in sample weight in TGA themograms and a temperature
difference in DTA thermograms. This was evidenced as starting at around 70°C for
harakeke and hemp fibre when it is believed there is evolution of adsorbed moisture
from the fibres. The fibre weight was then maintained until a reduction at around 250°C
for untreated fibre and around 300°C for treated fibre, which has been associated with
the initial thermal depolymerisation traces of hemicellulose and pectin followed by
cellulose [42]. This stage was completed when the temperature reached around 345°C
for harakeke and 355°C for hemp when the fibres had lost almost 60% for untreated and
80% for treated fibre of their initial weight. The final stage of thermal degradation
occurred at temperatures between 400 to 450°C when the fibres had lost almost 95% of
their initial weight leaving behind ash and unburnt minerals [28, 43]. The weight loss of
untreated and treated fibres at different stages of thermal degradation is presented in
Table 6. It can be seen that the degradation temperatures at different stages of thermal
degradation for treated fibres were consistently higher than for untreated fibres
indicating the heat resistance of fibre was effectively improved by alkali treatment [44].
DTA thermograms (Figure 12(b) and 13(b)) support the different stages of
moisture loss and decomposition at the same temperatures as those evaluated by weight
lost. Two main peaks were observed for all hemp and harakeke fibres, however,
narrower peaks can clearly be observed for treated fibre, representing a more
homogeneous cellulose content than for untreated fibre [45].
CONCLUSIONS
Compared to hemp fibre, harakeke fibre was found to be 25% weaker in its
untreated state and required a harsher treatment to bring about fibre separation, which is
believed to be due to the higher quantity of lignin in its composition. However, with a
strength of 782 MPa it would generally be expected to provide significant reinforcement
in most common polymer matrices. Treatment with NaOH and Na2SO3 was found to
improve separation and remove surface constituents for harakeke as well as hemp fibre.
As a consequence of constituent removal, fibre diameter, maximum tensile load and
tensile strength were found to decrease in most cases. However, it was found that the
tensile strength of hemp fibre treated with 5wt%NaOH and harakeke fibre treated with
5wt%NaOH/2wt% Na2SO3 was not significantly affected as confirmed by a Student’s t-
test, although the average tensile strength suggests a slight reduction. It was also found
that the crystallinity index (Ic) for all treated fibres increased significantly compared to
untreated fibres. Furthermore, the application of alkali treatment was also found to lead
to better thermal stability resulting in more homogeneous cellulose content as indicated
with narrower peaks in DTA thermograms.
FUNDING ACKNOWLEDGEMENT
This research received no specific grant from any funding agency in the public,
commercial, or not-for-profit sectors. However, the author would like to thank to the
Composites Research Group, University of Waikato for their support and the Ministry
of Education and Universiti Teknologi Mara Malaysia for the scholarship. The authors
also would like to thank The Hemp Farm, especially Mr Dave Jordan, for supply of
materials and their ongoing support of research in natural fibre composites.
REFERENCES
[1] Burgueno R, Quagliata MJ, Mehta GM, Mohanty AK, Misra M, Drzal LT. Sustainable cellular biocomposites from natural fibers and unsaturated polyester resin for housing panel applications. Journal of Polymers and the Environment. 2005;13(2):139-49. [2] Dittenber DB, GangaRao HVS. Critical Review of Recent Publications on Use of Natural Composites in Infrastructure. Composites Part A: Applied Science and Manufacturing. 2011. [3] Stamboulis A, Baillie C, Garkhail S, Van Melick H, Peijs T. Environmental durability of flax fibres and their composites based on polypropylene matrix. Applied Composite Materials. 2000;7(5):273-94. [4] Bodros E, Pillin I, Montrelay N, Baley C. Could biopolymers reinforced by randomly scattered flax fibre be used in structural applications? Composites Science and Technology. 2007;67(3):462-70. [5] Brouwer W. Natural fibre composites: where can flax compete with glass? Sampe Journal. 2000;36(6):18-23.

[6] Dweib M, Hu B, O’donnell A, Shenton H, Wool R. All natural composite sandwich beams for structural applications. Composite structures. 2004;63(2):147-57. [7] Satyanarayana K, Sukumaran K, Kulkarni A, Pillai S, Rohatgi P. Fabrication and properties of natural fibre-reinforced polyester composites. Composites. 1986;17(4):329-33. [8] Wambua P, Ivens J, Verpoest I. Natural fibres: can they replace glass in fibre reinforced plastics? Composites Science and Technology. 2003;63(9):1259-64. [9] Sawpan MA. Mechanical Performance of Industrial Hemp Fibre Reinforced Polylactide and Unsaturated Polyester Composites: The University of Waikato; 2010. [10] De Rosa IM, Kenny JM, Puglia D, Santulli C, Sarasini F. Tensile behavior of New Zealand flax (Phormium tenax) fibers. Journal of Reinforced Plastics and Composites. 2010;29(23):3450-4. [11] Jayaraman K, Halliwell R. Harakeke (phormium tenax) fibre–waste plastics blend composites processed by screwless extrusion. Composites Part B: Engineering. 2009;40(7):645-9. [12] Fortunati E, Puglia D, Monti M, Peponi L, Santulli C, Kenny J, et al. Extraction of cellulose nanocrystals from Phormium tenax fibres. Journal of Polymers and the Environment. 2013;21(2):319-28. [13] Duchemin B, Staiger MP. Treatment of Harakeke fiber for biocomposites. Journal of applied polymer science. 2009;112(5):2710-5. [14] Le Guen MJ, Newman RH. Pulped Phormium tenax leaf fibres as reinforcement for epoxy composites. Composites Part A: Applied Science and Manufacturing. 2007;38(10):2109-15. [15] Newman RH, Clauss EC, Carpenter JEP, Thumm A. Epoxy composites reinforced with deacetylated Phormium tenax leaf fibres. Composites Part A: Applied Science and Manufacturing. 2007;38(10):2164-70. [16] D A. Standard test method for tensile strength and Young's Modulus for high-modulus single-filament materials. 1989. [17] Weibull W. A statistical distribution function of wide applicability. Journal of applied mechanics. 1951;18(3):293-7. [18] Zafeiropoulos N, Baillie C. A study of the effect of surface treatments on the tensile strength of flax fibres: Part II. Application of Weibull statistics. Composites Part A: Applied Science and Manufacturing. 2007;38(2):629-38. [19] Biagiotti J, Puglia D, Torre L, Kenny JM, Arbelaiz A, Cantero G, et al. A systematic investigation on the influence of the chemical treatment of natural fibers on the properties of their polymer matrix composites. Polymer Composites. 2004;25(5):470-9. [20] Mwaikambo LY, Ansell MP. Chemical modification of hemp, sisal, jute, and kapok fibers by alkalization. Journal of applied polymer science. 2002;84(12):2222-34. [21] Tserki V, Zafeiropoulos N, Simon F, Panayiotou C. A study of the effect of acetylation and propionylation surface treatments on natural fibres. Composites Part A: Applied Science and Manufacturing. 2005;36(8):1110-8. [22] Beckermann G, Pickering KL. Engineering and evaluation of hemp fibre reinforced polypropylene composites: fibre treatment and matrix modification. Composites Part A: Applied Science and Manufacturing. 2008;39(6):979-88. [23] Roncero MB, Torres AL, Colom JF, Vidal T. The effect of xylanase on lignocellulosic components during the bleaching of wood pulps. Bioresource technology. 2005;96(1):21-30. [24] Le Troedec M, Sedan D, Peyratout C, Bonnet JP, Smith A, Guinebretiere R, et al. Influence of various chemical treatments on the composition and structure of hemp fibres. Composites Part A: Applied Science and Manufacturing. 2008;39(3):514-22. [25] Mehta G, Mohanty AK, Thayer K, Misra M, Drzal LT. Novel biocomposites sheet molding compounds for low cost housing panel applications. Journal of Polymers and the Environment. 2005;13(2):169-75. [26] Ouajai S, Shanks RA. Morphology and structure of hemp fibre after bioscouring. Macromolecular bioscience. 2005;5(2):124-34.
[27] Beckermann G. Performance of hemp-fibre reinforced polypropylene composite materials: The University of Waikato; 2007. [28] Islam MS, Pickering KL, Foreman NJ. Influence of alkali fiber treatment and fiber processing on the mechanical properties of hemp/epoxy composites. Journal of applied polymer science. 2011;119(6):3696-707. [29] Pickering K, Beckermann G, Alam S, Foreman N. Optimising industrial hemp fibre for composites. Composites Part A: Applied Science and Manufacturing. 2007;38(2):461-8. [30] Sawpan MA, Pickering KL, Fernyhough A. Effect of various chemical treatments on the fibre structure and tensile properties of industrial hemp fibres. Composites Part A: Applied Science and Manufacturing. 2011;42(8):888-95. [31] Kabir M, Wang H, Lau K, Cardona F. Chemical treatments on plant-based natural fibre reinforced polymer composites: An overview. Composites Part B: Engineering. 2012. [32] Bismarck A, Aranberri‐Askargorta I, Springer J, Lampke T, Wielage B, Stamboulis A, et al. Surface characterization of flax, hemp and cellulose fibers; surface properties and the water uptake behavior. Polymer Composites. 2002;23(5):872-94. [33] Rai A, Jha C. Natural fibre composites and its potential as building materials. Express Textile. 2004;25. [34] Shahzad A. Hemp fiber and its composites–a review. Journal of Composite Materials. 2012;46(8):973-86. [35] Wang H, Postle R, Kessler R, Kessler W. Removing pectin and lignin during chemical processing of hemp for textile applications. Textile Research Journal. 2003;73(8):664-9. [36] Doan T-T-L, Gao S-L, Mäder E. Jute/polypropylene composites I. Effect of matrix modification. Composites Science and Technology. 2006;66(7):952-63. [37] Joffe R, Andersons J, Wallström L. Strength and adhesion characteristics of elementary flax fibres with different surface treatments. Composites Part A: Applied Science and Manufacturing. 2003;34(7):603-12. [38] Xia Z, Yu J, Cheng L, Liu L, Wang W. Study on the breaking strength of jute fibres using modified Weibull distribution. Composites Part A: Applied Science and Manufacturing. 2009;40(1):54-9. [39] Oraji R. The effect of plasma treatment on flax fibres: University of Saskatchewan; 2008. [40] Wang B, Sain M, Oksman K. Study of structural morphology of hemp fiber from the micro to the nanoscale. Applied Composite Materials. 2007;14(2):89-103. [41] Ouajai S, Shanks R. Composition, structure and thermal degradation of hemp cellulose after chemical treatments. Polymer degradation and stability. 2005;89(2):327-35. [42] Islam M, Pickering K, Foreman N. Influence of alkali treatment on the interfacial and physico-mechanical properties of industrial hemp fibre reinforced polylactic acid composites. Composites Part A: Applied Science and Manufacturing. 2010;41(5):596-603. [43] Luyt A, Mokhothu T, Guduri B. Kenaf-fiber-reinforced copolyester biocomposites. Wiley Online Library. 2011. [44] Shih Y-F, Huang C-C. Polylactic acid (PLA)/banana fiber (BF) biodegradable green composites. Journal of Polymer Research. 2011;18(6):2335-40. [45] Gañán P, Mondragon I. Surface modification of fique fibers. Effect on their physico‐mechanical properties. Polymer Composites. 2002;23(3):383-94.
FIGURE CAPTIONS
Figure 1: Schematic diagram of cardboard used in testing with mounted single
fibre.
Figure 2: Single harakeke fibre as observed under optical microscope.
Figure 3: Single hemp fibre as observed under optical microscope.
Figure 4: Scanning electron micrographs of untreated harakeke: (a) in bundle
form, (b) a mechanically separated single fibre.
Figure 5: Scanning electron micrographs of treated harakeke fibre surface using:
(a) 5wt% NaOH and (b) 10wt% NaOH.
Figure 6: Scanning electron micrograph of treated harakeke fibre surface using
5wt% NaOH/2wt% Na2SO3.
Figure 7: Scanning electron micrographs of (a) untreated hemp and (b) 5wt%
NaOH treated fibre surface.
Figure 8: Scanning electron micrographs of treated hemp fibre surface using: (a)
10wt% NaOH and (b) 5wt% NaOH/2wt% Na2SO3.
Figure 9: Typical diffraction curves of natural fibres used in calculating
crystallinity index by the area method.
Figure 10: X-ray diffraction curves for untreated and treated harakeke fibres.
Figure 11: X-ray diffraction curves for untreated and treated hemp fibres.
Figure 12: (a) TGA thermograms for untreated and treated harakeke fibres
Figure 12: (b) DTA thermograms for untreated and treated harakeke fibres.
Figure 13: (a) TGA thermograms for untreated and treated hemp fibres.
Figure 13: (b) DTA thermograms for untreated and treated hemp fibres.
TABLE CAPTIONS
Table 1: Chemical composition of harakeke fibre Table 2: Abbreviations used for
fibre and treatment
Table 3: Mechanical properties of untreated and alkali treated fibres. Standard
deviations are included in parenthesis.
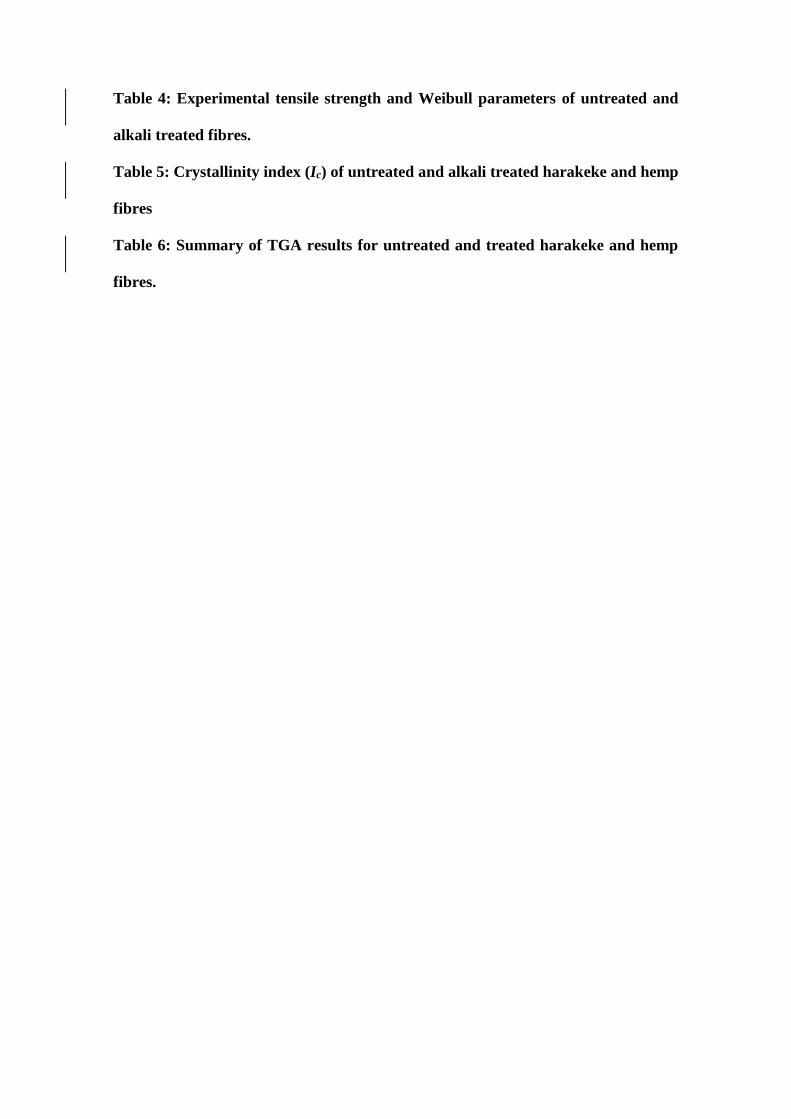
Table 4: Experimental tensile strength and Weibull parameters of untreated and
alkali treated fibres.
Table 5: Crystallinity index (Ic) of untreated and alkali treated harakeke and hemp
fibres
Table 6: Summary of TGA results for untreated and treated harakeke and hemp
fibres.

Figure 1: Schematic diagram of cardboard used in testing with mounted single fibre.
Figure 2: Single harakeke fibre as observed under optical microscope.
2mm thick cardboard
PVA glue Fibre
Gauge length
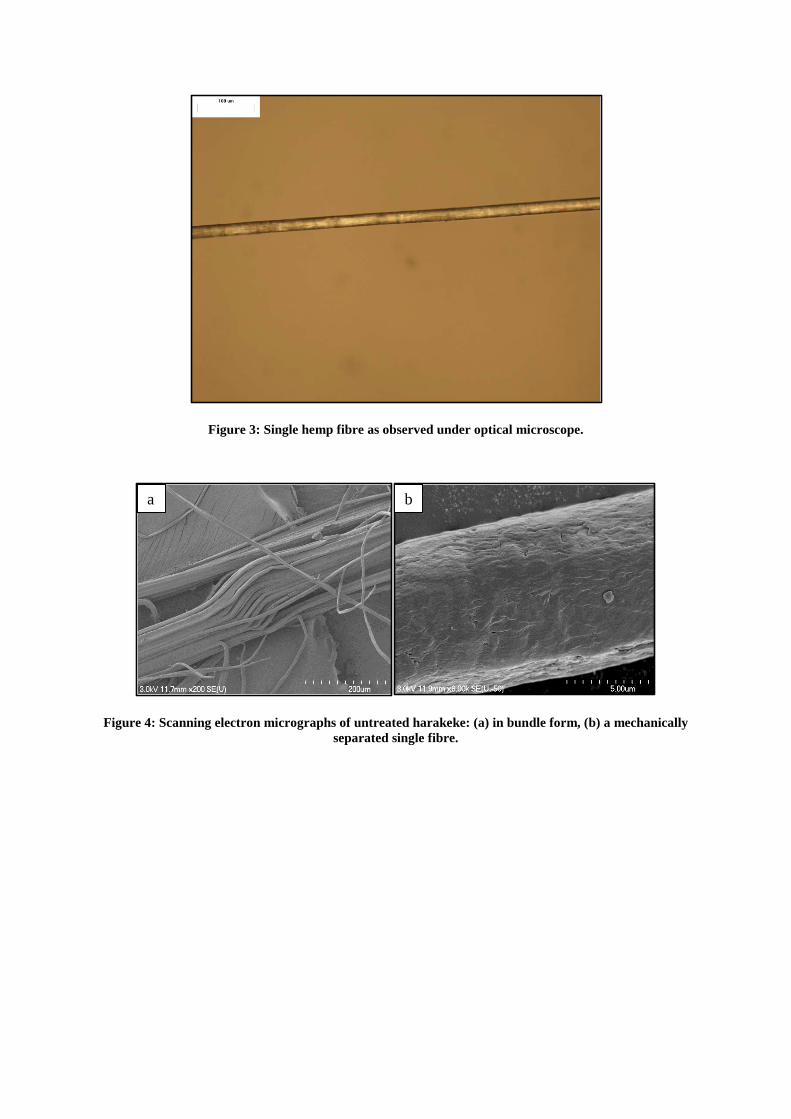
Figure 3: Single hemp fibre as observed under optical microscope.
Figure 4: Scanning electron micrographs of untreated harakeke: (a) in bundle form, (b) a mechanically separated single fibre.
a b

Figure 5: Scanning electron micrographs of treated harakeke fibre surface using: (a) 5wt% NaOH and (b) 10wt% NaOH.
Figure 6: Scanning electron micrograph of treated harakeke fibre surface using 5wt% NaOH/2wt% Na2SO3.
a b
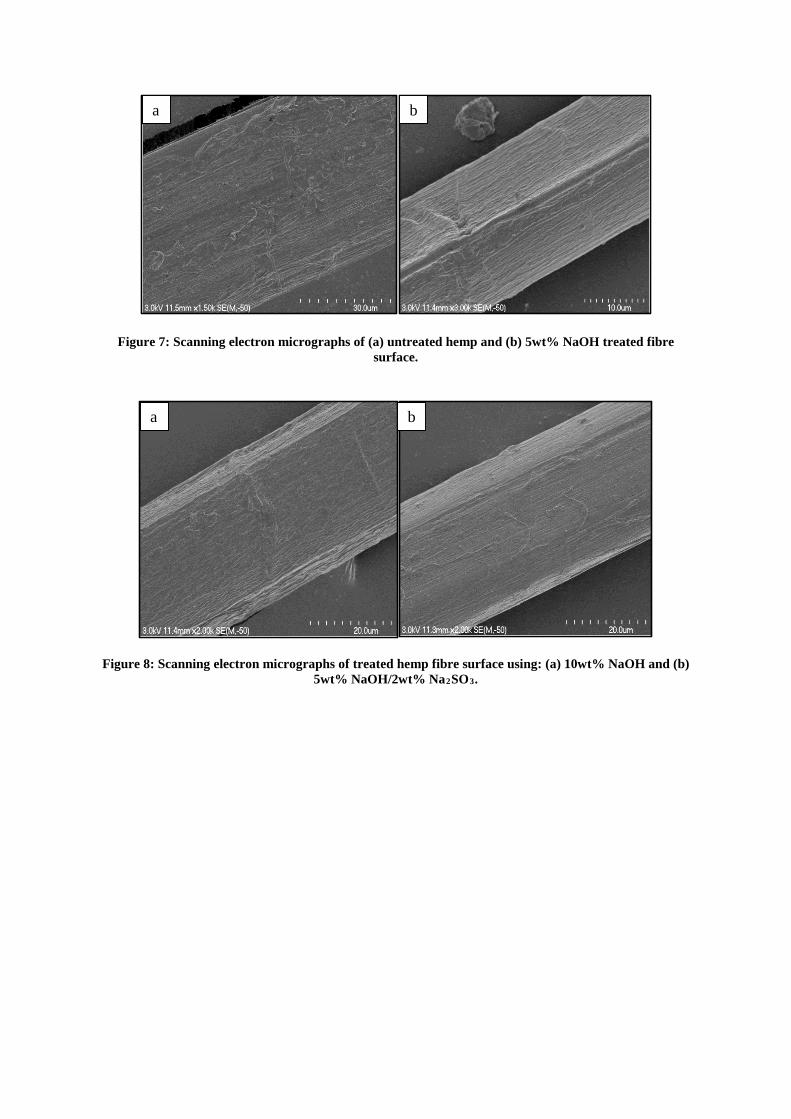
Figure 7: Scanning electron micrographs of (a) untreated hemp and (b) 5wt% NaOH treated fibre surface.
Figure 8: Scanning electron micrographs of treated hemp fibre surface using: (a) 10wt% NaOH and (b) 5wt% NaOH/2wt% Na2SO3.
a b
a b
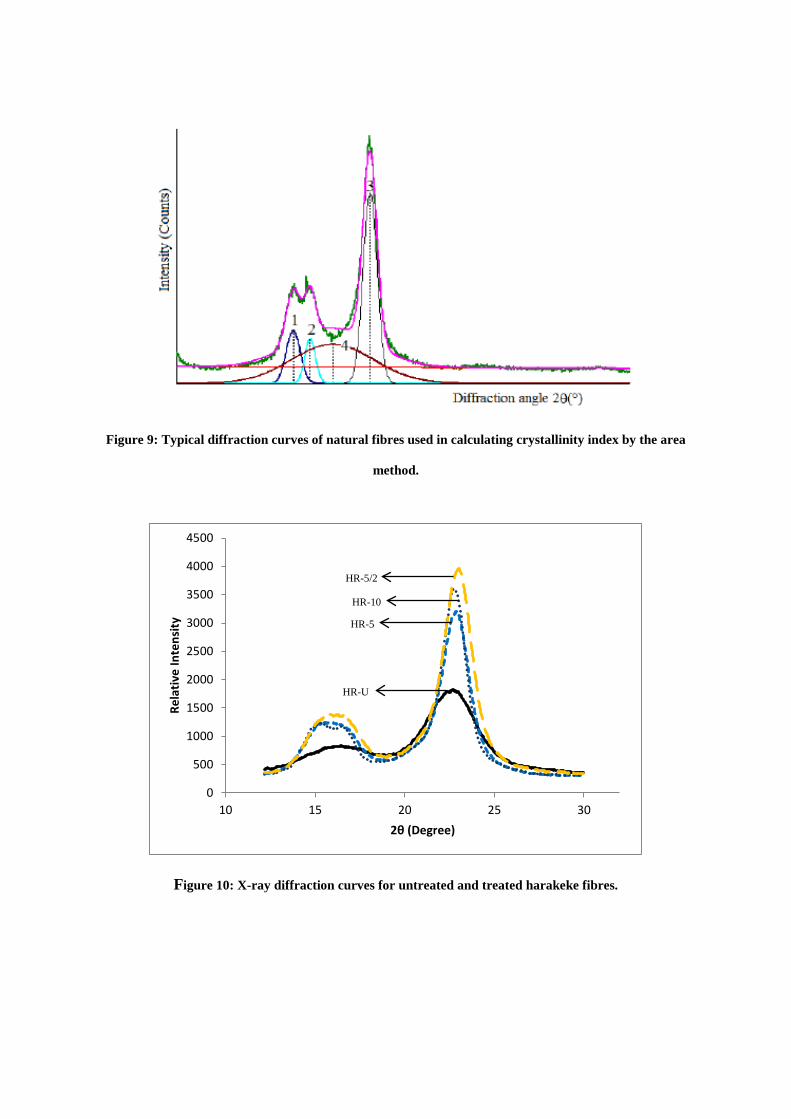
Figure 9: Typical diffraction curves of natural fibres used in calculating crystallinity index by the area
method.
Figure 10: X-ray diffraction curves for untreated and treated harakeke fibres.
0
500
1000
1500
2000
2500
3000
3500
4000
4500
10 15 20 25 30
Rela
tive
Inte
nsity
2θ (Degree)
HR-5/2
HR-10
HR-5
HR-U
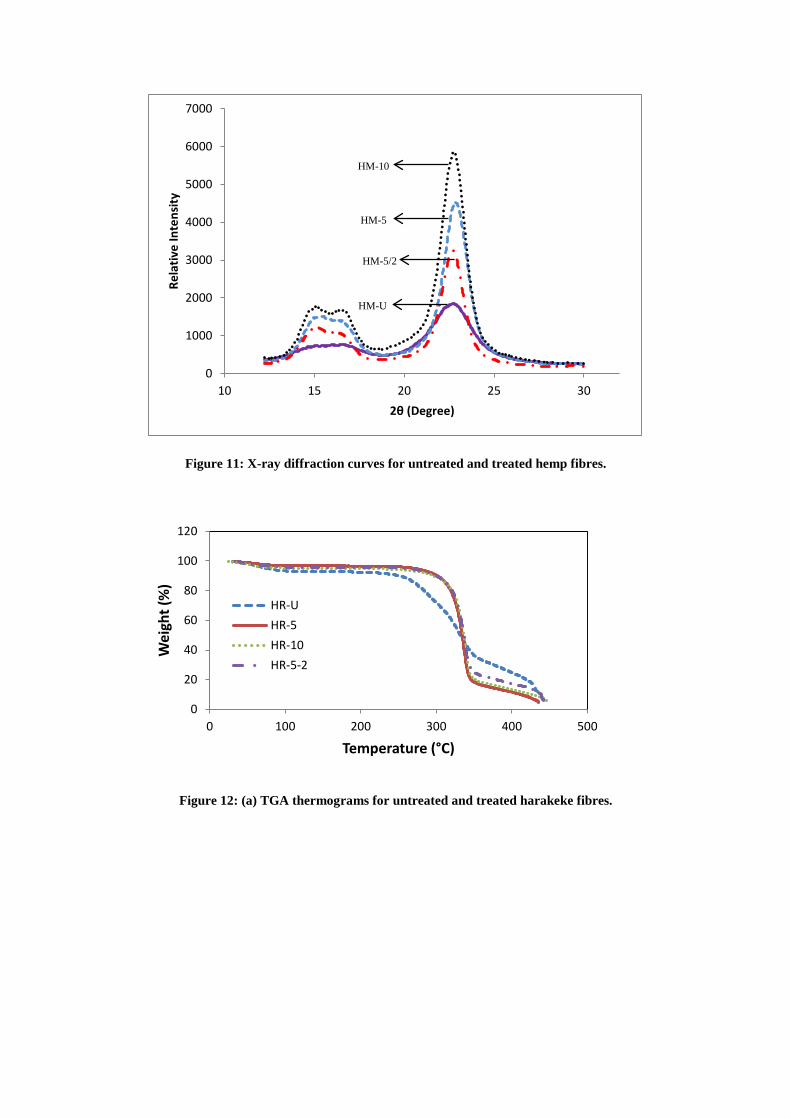
Figure 11: X-ray diffraction curves for untreated and treated hemp fibres.
Figure 12: (a) TGA thermograms for untreated and treated harakeke fibres.
0
1000
2000
3000
4000
5000
6000
7000
10 15 20 25 30
Rela
tive
Inte
nsity
2θ (Degree)
0
20
40
60
80
100
120
0 100 200 300 400 500
Wei
ght (
%)
Temperature (°C)
HR-UHR-5HR-10HR-5-2
HM-10
HM-5
HM-5/2
HM-U

Figure 12: (b) DTA thermograms for untreated and treated harakeke fibres.
Figure 13: (a) TGA thermograms for untreated and treated hemp fibres.
-202468
10121416
0 100 200 300 400 500 600
Tem
pera
ture
diff
eren
ce (°
C)
Temperature (°C)
HR-UHR-5HR-10HR-5-2
0
20
40
60
80
100
120
0 100 200 300 400 500
Wei
ght (
%)
Temperature (°C)
HM-U
HM-5
HM-10
HM-5-2

Figure 13: (b) DTA thermograms for untreated and treated hemp fibres.
-202468
10121416
0 100 200 300 400 500 600
Tem
pera
ture
diff
eren
ce (°
C)
Temperature (°C)
HM-U
HM-5
HM-10
HM-5-2
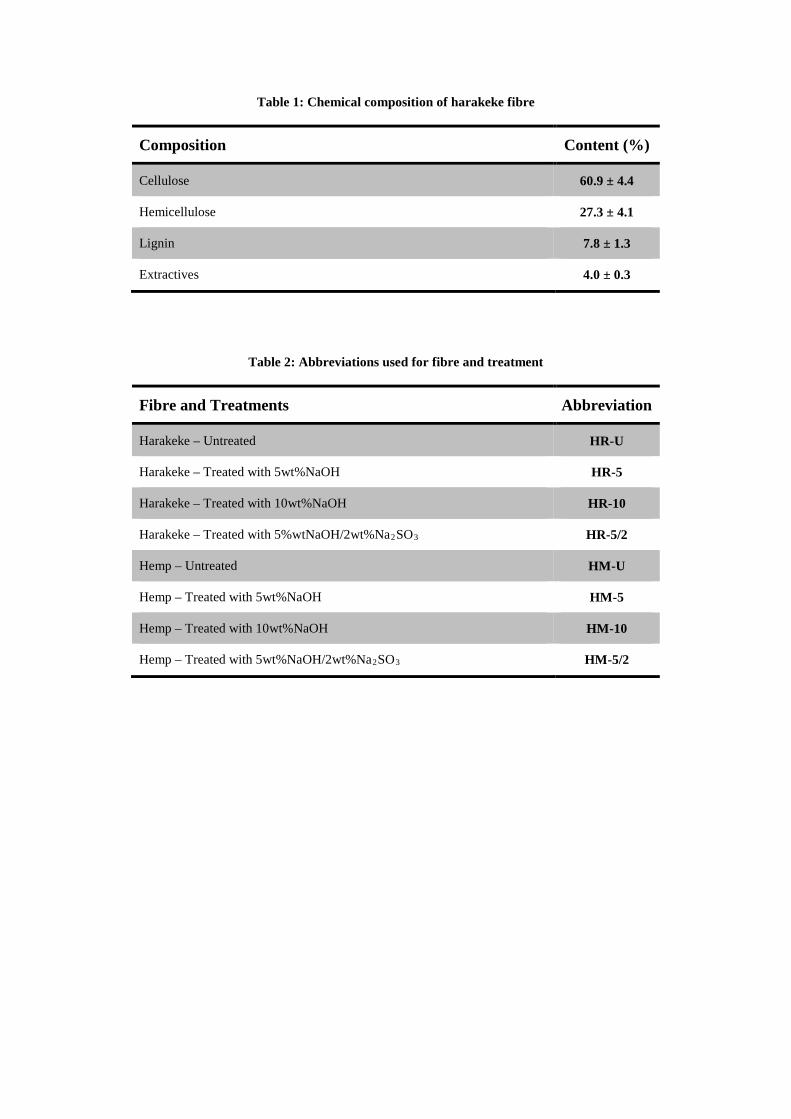
Table 1: Chemical composition of harakeke fibre
Composition Content (%)
Cellulose 60.9 ± 4.4
Hemicellulose 27.3 ± 4.1
Lignin 7.8 ± 1.3
Extractives 4.0 ± 0.3
Table 2: Abbreviations used for fibre and treatment
Fibre and Treatments Abbreviation
Harakeke – Untreated HR-U
Harakeke – Treated with 5wt%NaOH HR-5
Harakeke – Treated with 10wt%NaOH HR-10
Harakeke – Treated with 5%wtNaOH/2wt%Na2SO3 HR-5/2
Hemp – Untreated HM-U
Hemp – Treated with 5wt%NaOH HM-5
Hemp – Treated with 10wt%NaOH HM-10
Hemp – Treated with 5wt%NaOH/2wt%Na2SO3 HM-5/2
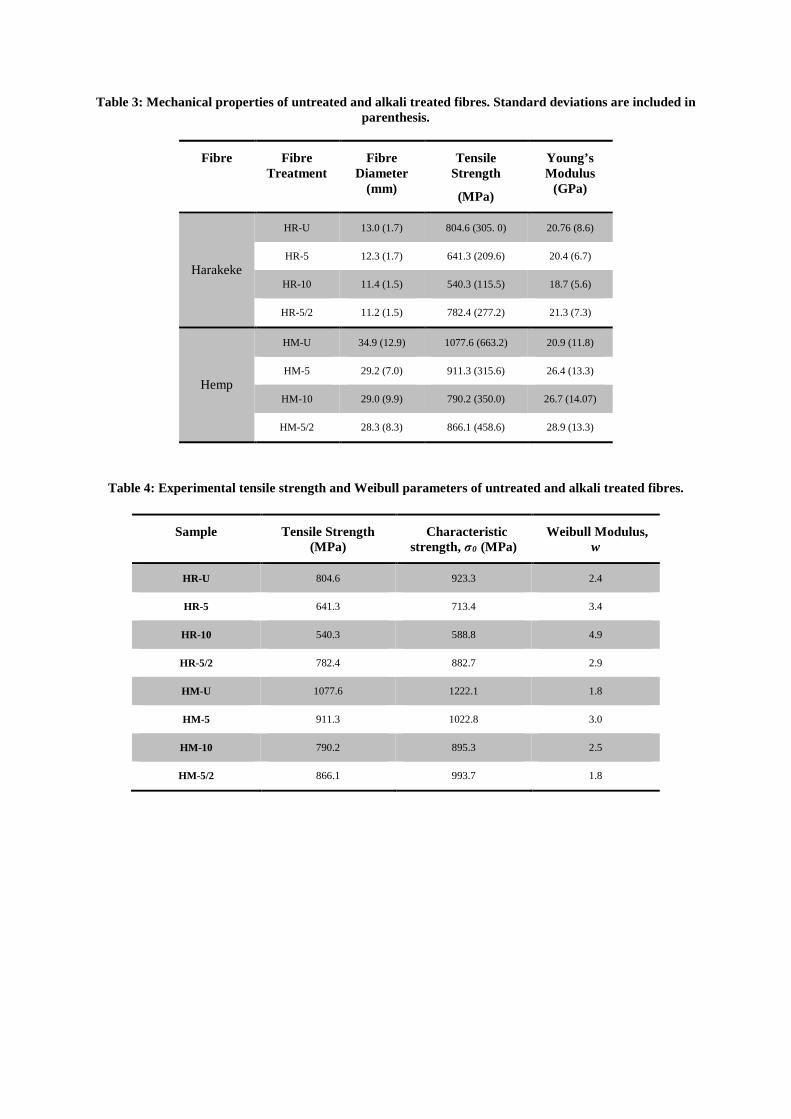
Table 3: Mechanical properties of untreated and alkali treated fibres. Standard deviations are included in parenthesis.
Fibre Fibre Treatment
Fibre Diameter
(mm)
Tensile Strength
(MPa)
Young’s Modulus
(GPa)
Harakeke
HR-U 13.0 (1.7) 804.6 (305. 0) 20.76 (8.6)
HR-5 12.3 (1.7) 641.3 (209.6) 20.4 (6.7)
HR-10 11.4 (1.5) 540.3 (115.5) 18.7 (5.6)
HR-5/2 11.2 (1.5) 782.4 (277.2) 21.3 (7.3)
Hemp
HM-U 34.9 (12.9) 1077.6 (663.2) 20.9 (11.8)
HM-5 29.2 (7.0) 911.3 (315.6) 26.4 (13.3)
HM-10 29.0 (9.9) 790.2 (350.0) 26.7 (14.07)
HM-5/2 28.3 (8.3) 866.1 (458.6) 28.9 (13.3)
Table 4: Experimental tensile strength and Weibull parameters of untreated and alkali treated fibres.
Sample Tensile Strength (MPa)
Characteristic strength, σ0 (MPa)
Weibull Modulus, w
HR-U 804.6 923.3 2.4
HR-5 641.3 713.4 3.4
HR-10 540.3 588.8 4.9
HR-5/2 782.4 882.7 2.9
HM-U 1077.6 1222.1 1.8
HM-5 911.3 1022.8 3.0
HM-10 790.2 895.3 2.5
HM-5/2 866.1 993.7 1.8
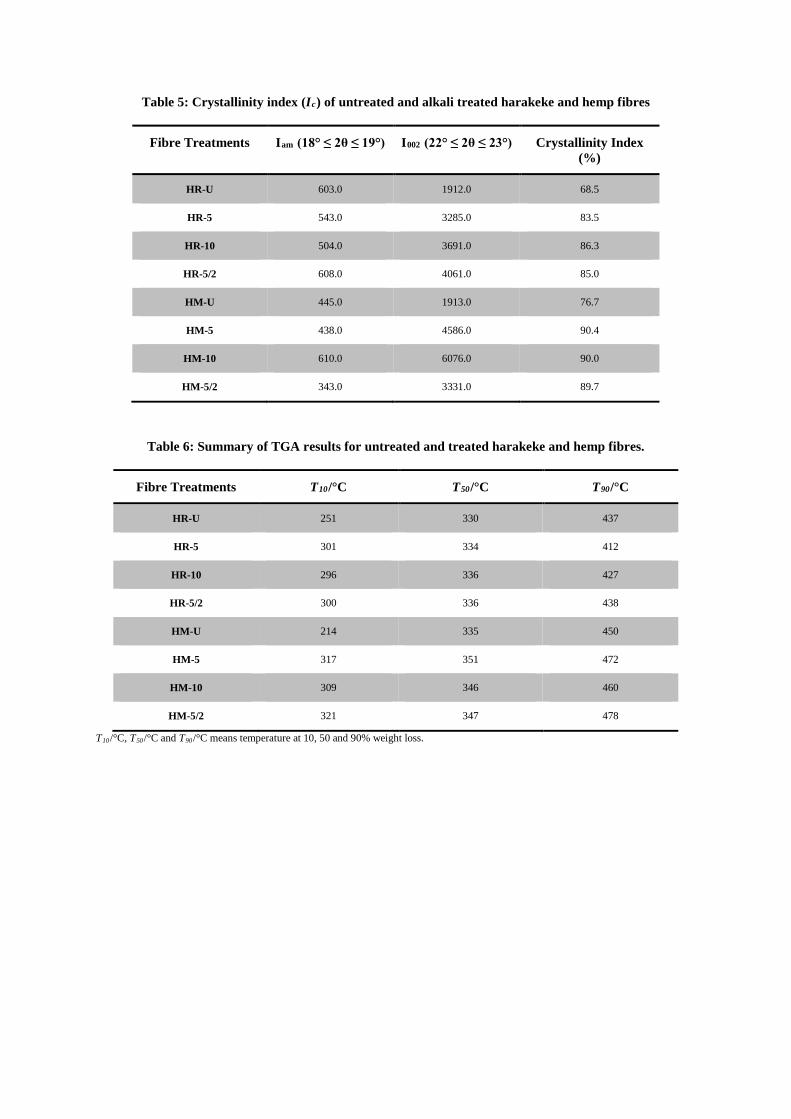
Table 5: Crystallinity index (Ic) of untreated and alkali treated harakeke and hemp fibres
Fibre Treatments Iam (18° ≤ 2θ ≤ 19°) I002 (22° ≤ 2θ ≤ 23°) Crystallinity Index (%)
HR-U 603.0 1912.0 68.5
HR-5 543.0 3285.0 83.5
HR-10 504.0 3691.0 86.3
HR-5/2 608.0 4061.0 85.0
HM-U 445.0 1913.0 76.7
HM-5 438.0 4586.0 90.4
HM-10 610.0 6076.0 90.0
HM-5/2 343.0 3331.0 89.7
Table 6: Summary of TGA results for untreated and treated harakeke and hemp fibres.
Fibre Treatments T10/°C T50/°C T90/°C
HR-U 251 330 437
HR-5 301 334 412
HR-10 296 336 427
HR-5/2 300 336 438
HM-U 214 335 450
HM-5 317 351 472
HM-10 309 346 460
HM-5/2 321 347 478
T10/°C, T50/°C and T90/°C means temperature at 10, 50 and 90% weight loss.