Comparison of Cocoa Beans from China, Indonesia and Papua ... of... · Foods 2013, 2 186 The...
15
Foods 2013, 2, 183-197; doi:10.3390/foods2020183 foods ISSN 2304-8158 www.mdpi.com/journal/foods Article Comparison of Cocoa Beans from China, Indonesia and Papua New Guinea Fenglin Gu 1,2,3, *, Lehe Tan 1,2,3,† , Huasong Wu 1,2,3,† , Yiming Fang 1,2,3,† , Fei Xu 1,2,3,† , Zhong Chu 1,2,3,† and Qinghuang Wang 1,2,3,† 1 Spice and Beverage Research Institute, Chinese Academy of Tropical Agricultural Sciences (CATAS), Wanning, Hainan 571533, China; E-Mails: [email protected] (L.T.); [email protected] (H.W.); [email protected] (Y.F.); [email protected] (F.X.); [email protected] (Z.C.); [email protected] (Q.W.) 2 National Center of Important Tropical Crops Engineering and Technology Research, Wanning, Hainan 571533, China 3 Key Laboratory of Genetic Resources Utilization of Spice and Beverage Crops, Ministry of Agriculture, Wanning, Hainan 571533, China † These authors contributed equally to this work. * Author to whom correspondence should be addressed; E-Mail: [email protected]; Tel.: +86-898-62556090, Fax: +86-898-62561083. Received: 3 April 2013; in revised form: 2 May 2013 / Accepted: 14 May 2013 / Published: 21 May 2013 Abstract: A survey on five kinds of cocoa beans from new cocoa planting countries was conducted to analyze each kind’s basic quality. The average bean weight and butter content of Hainan cocoa beans were the lowest, at less than 1.1 g, and 39.24% to 43.44%, respectively. Cocoa beans from Indonesia where shown to be about 8.0% and 9.0% higher in average bean weight and butter content, respectively, than that of Papua New Guinea and about 20.0% and 25.0% higher in average bean weight and butter content than Chinese dried beans, respectively. The average total polyphenolic content ranged from 81.22 mg/10 g to 301.01 mg/10 g. The Hainan 2011 sample had the highest total polyphenolic content, followed by the unfermented sample from Indonesia and the Papua New Guinea sample. The polyphenolic levels found in the Hainan 2010 sample were 123.61 mg/10 g and lower than the other three samples, but the Indonesian fermented sample had the lowest total polyphenolic content of 81.22 mg/10 g. The average total amino acid content ranged from 11.58 g/100 g to 18.17 g/100 g. The total amino acid OPEN ACCESS
Transcript of Comparison of Cocoa Beans from China, Indonesia and Papua ... of... · Foods 2013, 2 186 The...

Foods 2013, 2, 183-197; doi:10.3390/foods2020183
foods ISSN 2304-8158
www.mdpi.com/journal/foods
Article
Comparison of Cocoa Beans from China, Indonesia and
Papua New Guinea
Fenglin Gu 1,2,3,
*, Lehe Tan 1,2,3,†
, Huasong Wu 1,2,3,†
, Yiming Fang 1,2,3,†
, Fei Xu 1,2,3,†
,
Zhong Chu 1,2,3,†
and Qinghuang Wang 1,2,3,†
1 Spice and Beverage Research Institute, Chinese Academy of Tropical Agricultural Sciences
(CATAS), Wanning, Hainan 571533, China; E-Mails: [email protected] (L.T.);
[email protected] (H.W.); [email protected] (Y.F.);
[email protected] (F.X.); [email protected] (Z.C.); [email protected] (Q.W.) 2
National Center of Important Tropical Crops Engineering and Technology Research,
Wanning, Hainan 571533, China 3
Key Laboratory of Genetic Resources Utilization of Spice and Beverage Crops,
Ministry of Agriculture, Wanning, Hainan 571533, China
† These authors contributed equally to this work.
* Author to whom correspondence should be addressed; E-Mail: [email protected];
Tel.: +86-898-62556090, Fax: +86-898-62561083.
Received: 3 April 2013; in revised form: 2 May 2013 / Accepted: 14 May 2013 /
Published: 21 May 2013
Abstract: A survey on five kinds of cocoa beans from new cocoa planting countries was
conducted to analyze each kind’s basic quality. The average bean weight and butter content
of Hainan cocoa beans were the lowest, at less than 1.1 g, and 39.24% to 43.44%,
respectively. Cocoa beans from Indonesia where shown to be about 8.0% and 9.0% higher
in average bean weight and butter content, respectively, than that of Papua New Guinea
and about 20.0% and 25.0% higher in average bean weight and butter content than
Chinese dried beans, respectively. The average total polyphenolic content ranged from
81.22 mg/10 g to 301.01 mg/10 g. The Hainan 2011 sample had the highest total
polyphenolic content, followed by the unfermented sample from Indonesia and the Papua
New Guinea sample. The polyphenolic levels found in the Hainan 2010 sample were
123.61 mg/10 g and lower than the other three samples, but the Indonesian fermented
sample had the lowest total polyphenolic content of 81.22 mg/10 g. The average total
amino acid content ranged from 11.58 g/100 g to 18.17 g/100 g. The total amino acid
OPEN ACCESS

Foods 2013, 2 184
content was the highest in the Indonesian unfermented sample, followed by the
Hainan 2011 sample and the Papua New Guinea sample. The levels found in the Hainan
2010 sample were lower; the Indonesian fermented sample had the lowest total amino
acid content.
Keywords: cocoa beans; average bean weight; cocoa butter content; total polyphenolic
content; amino acids; e-nose
1. Introduction
Cocoa is widely consumed in the form of chocolates, and the consumption rate is rising, because of
the increasing popularity of chocolate confectioneries worldwide. Cocoa can also be found in
beverages, cosmetics, pharmaceuticals and toiletries [1]. Cocoa beans begin as seeds in fruit pods of
the tree Theobroma cacao L., where each fruit pod contains 30 to 40 beans embedded in
a mucilaginous pulp. Raw cocoa has an astringent, unpleasant taste and flavor. To obtain the
characteristic cocoa flavor and taste, raw cocoa must be fermented, dried and roasted [2]. The fresh
cocoa bean is approximately composed of 32%–39% water, 30%–32% fat, 8%–10% protein,
5%–6% polyphenols, 4%–6% starch, 4%–6% pentosans, 2%–3% cellulose, 2%–3% sucrose,
1%–2% theobromine, 1% acids and 1% caffeine [3].
Commercial cocoa is obtained from beans that originated as seeds from the ripe pods of the plant,
Theobroma cacao, which is cultivated in plantations in tropical regions throughout the world [4]. The
three major cocoa growing regions are West Africa, Southeast Asia and South America. Indonesia
produces about 15% of the world’s cocoa beans and ranks third in terms of international production.
Indonesia has expanded its cocoa production and is now producing almost as much as Ghana.
Indonesian cocoa production has the potential to substantially increase, but such increase would
depend on local political and economic factors. As a member of the International Cocoa Organization
(ICCO) and a signatory to the 2001 International Cocoa Agreement, Papua New Guinea is obliged to
promote a sustainable cocoa economy. Cocoa trees may be grown in China, particularly in the southern
region of Hainan province. The quality of the cocoa beans from that region was said to be similar to
that of Indonesian cocoa beans [5].
The processing of cocoa beans comprises two major steps, namely, fermentation and drying.
At cocoa plantations, fermentation and drying may primarily be looked upon as a curing process to
stabilize the fresh beans through the microbial degradation of the firmly adhering, perishable pulp and
through drying [6].
Genotype, soil, climate and harvest conditions, as well as processes, such as fermentation, drying
and roasting, have important effects on the characteristics of cocoa. Unfermented and partly fermented
cocoa beans are the beans of the Theobroma cacao L., which are dried without previously being
fermented or partly fermented or by using improper procedures. Research has shown that these beans
do not develop any chocolate flavor when roasted and are excessively astringent and bitter [7,8].
Malaysia is currently making use of these types of beans, which are imported from Indonesia,
especially for cocoa liquor, powder and cocoa butter production. Cocoa manufacturers usually blend

Foods 2013, 2 185
the unfermented and partly fermented beans with fully fermented beans to obtain the desired flavor
characteristics and to reduce the excessive astringency and bitterness.
So far, comprehensive studies have yet to be conducted on the total content variation of phenol and
flavonoid and of gallic acid and epicatechin. Moreover, no study has explored the content and
composition of free amino acids in commercially fermented and dried cocoa from different origins.
To address this gap in the literature, the present study is conducted by showcasing the variations in
fermented, dried cocoa samples from different countries. This paper also reports on the content and
composition of total and free amino acids of cocoa samples originating from three countries. The aim
of the present study is to assess the influence of unfermented, fermented and dried cocoa beans from
box fermentations performed by different countries in the last two years.
2. Experimental Section
2.1. Materials
Gallic acid, epicatechin and Folin-Ciocalteu phenol reagent were obtained from Sigma Chemical
Co., Ltd. (St. Louis, MO, USA). Methanol and acetonitrile (HPLC grade) were purchased from
Sigma-Aldrich Trading Co., Ltd. (Shanghai, China). All other chemicals used were of analytical grade
and were obtained from Sinopharm Co., Ltd. (Shanghai, China).
Theobroma cacao beans of different geographic origins (Papua New Guinea, Indonesia and China)
and of the Trinitario (hybrids of Criollo and Forastero) type were used in this study and were supplied
by the Spice and Beverage Research Institute (Hainan, China) and Huadong Cocoa Co. Ltd. (Wuxi,
China), and the cacao beans from Papua New Guinea and Indonesia were gotten from the main
producing region and were the varieties cultivated popularly there. Fermented cocoa beans from Papua
New Guinea were named C1, and fermented and unfermented cocoa beans from Indonesia were named
C2 and C3, respectively. Fully ripe Hainan cocoa pods (Theobroma cacao L.) were handily harvested
in 2010 and 2011 and were fermented in a box for six days. The fermentation mass was turned
manually every day by transferring the coca pods from one box to another. Cocoa beans that
underwent six-day fermentation were collected and sundried until a 7% moisture content was reached.
The beans (named C4 and C5) were then stored in a refrigerator for later use. The five sundried
samples, in turn, were roasted in an oven at 160 °C for 30 min in the laboratory and were milled using
a Retsch blender (Restch, Haan, Germany) to obtain cocoa liquor. The five samples were marked as
CR1, CR2, CR3, CR4 and CR5, respectively.
The frozen cocoa bean samples were lyophilized (Labconco, Kansas, USA) until dry or until the
beans became brittle and easily broken. The lyophilized beans were deshelled, degermed and ground
using a Retsch blender (Restch, Haan, Germany). Small pieces of solid carbon dioxide were added
occasionally to prevent cocoa lipids from melting, due to frictional heat caused by grinding.
2.2. Measurement of Average Bean Weight and Fat
The cocoa samples were placed in a ventilated oven at 60 °C until the constant dry weight of the
bean components (beans and nibs) was achieved. The dry weights of the samples were then recorded.
The results were shown as the gross weight and net weight of one cocoa bean.

Foods 2013, 2 186
The lyophilized dry cotyledons were crushed, and 5.0 g portions were extracted repeatedly in
a Soxhlet apparatus (Soxtec 2050, Foss, Hoganas, Sweden) with 500 mL of petroleum ether
(b.p. 40–70 °C). Fat content was determined and expressed as a percentage of weight [9].
2.3. Measurement of Color and Absorbance at 420 nm
A 5.0 g portion of ground cotyledons was boiled in 45 mL of water and homogenized at 5000 rpm
for 45 s. The homogenate was filtered and then centrifuged (1500× g, 15 min). The supernatant was
determined at 420 nm using a UV-Vis Shimadzu UV-1601 spectrophotometer (Tokyo, Japan) [10].
Color was measured using an X-rite colorimeter (Xrite Inc., Grand Rapids, MI, USA). The results
were expressed in the L*a*b* colorimetric system, according to the International Commission of
Illumination, in which a color can be defined conventionally by three numerical parameters:
sample luminance L* (quantity of reflected light), chromatic coordinated a* (red-green axis) and
b* (yellow-blue axis) [11].
2.4. Measurement of Total Phenolic Content and Total Flavonoid Content
The defatted residue (cocoa powder) was air dried and stored at −20 °C before being extracted in
boiling water for 1 h at a concentration of 20 mg/mL−1
. After cooling at room temperature, the samples
were centrifuged, yielding the final extract for analysis.
The total phenolic phytochemical concentration was measured using the Folin-Ciocalteu method
reported by [12]. Afterwards, 1 mL of appropriately diluted samples and a standard solution of
gallic acid were added to a 25 mL volumetric flask containing 9 mL of ddH2O. A reagent blank using
ddH2O was prepared. One milliliter of Folin-Ciocalteu phenol reagent was added to the mixture and
was then shaken. After 5 min, 10 mL of 7% Na2CO3 solution was added prior to mixing. The solution
was then immediately diluted to a volume of 25 mL with ddH2O and then mixed thoroughly.
After incubation for 90 min at 23 °C, the absorbance relative to that of a prepared blank at 750 nm was
measured using a spectrophotometer (Shimadzu UV-1601, SHIMADZU, Tokyo, Japan). The total
phenolic contents of the samples were expressed in milligrams per serving of gallic acid equivalents
(GAE). All samples were prepared in five replications.
The total flavonoid concentration was measured using a colorimetric assay developed by [13].
One milliliter of appropriately diluted sample was added to a 10 mL volumetric flask containing
4 mL of ddH2O. At time zero, 0.3 mL of 5% NaNO2 was added to each volumetric flask; at 5 min,
0.3 mL of 10% AlCl3 was added; and at 6 min, 2 mL of 1 M NaOH was added. Each reaction flask
was then immediately diluted with 2.4 mL of ddH2O and then mixed. The absorbances of the mixtures
upon the development of pink color were determined at 510 nm relative to a prepared blank. The total
flavonoid contents of the samples were expressed in milligrams per serving of epicatechin equivalents
(ECE). All samples were prepared in five replications.
2.5. Measurement of Gallic Acid (GA) and Epicatechin (EC) Content
The (−)-epicatechin and gallic acid content were determined and quantified using the modified
method of [14]. Dried cocoa samples were ground in a blender. Pieces of dry ice were added to the

Foods 2013, 2 187
beans to prevent the cocoa lipids from melting, due to frictional heat caused by grinding. After
grinding, the powder was sieved through a 710 μm screen. Powdered samples were defatted for
16 to 18 h using petroleum ether (b.p. 40–70 °C) as solvent. The samples were dried in a vacuum oven
at 65 °C for 5 min and then stored in the dark inside a desiccator over silica gel prior to
the extraction procedures.
Concentrations of epicatechin and gallic acid were determined through High Performance Liquid
Chromatography (HPLC, Agilent 1260 Infinity, Agilent, Waldbronn, Germany) and ultraviolet (UV,
Agilent 1260 Infinity, Agilent, Waldbronn, Germany) detection (280 nm). Before analysis, defatted
cocoa (4 g/L) was dissolved in 90% (v/v) water with 2% (v/v) acetic acid (pH 2.5) and
10% (v/v) acetonitrile, placed in an ultrasonic bath for 10 min and then filtered using
a 0.45 μm cellulose filter. The mobile phase, at a flow rate of 1.0 mL/min, consisted of water plus
acetic acid (pH 2.5, eluent A) and acetonitrile (eluent B) with the following gradients: 0.0 min, 90% A
and 10% B; 20.0 min, 85% A and 15% B. Quantification was performed through external calibration
with standard solutions of epicatechin and gallic acid. Results were expressed in milligram
components per 10 g of cocoa product.
2.6. Measurement of Total Amino Acids
The defatted residue or cocoa powder was hydrolyzed with 6 M hydrochloric acid at 110 °C
for 24 h under vacuum. The hydrolysate was submitted to an automated online derivatization with
O-phthalaldehyde and reversed phase high performance liquid chromatography (RP-HPLC) analysis in
an Agilent 1100 (Agilent Technology, Palo Alto, CA, USA) assembly system using a Zorbax 80A
C18 column (4.6 i.d. × 180 mm) running at 0.5 mL/min. The results acquired were analyzed with the
aid of ChemStation for LC 3D software (Agilent Technology, Palo Alto, CA, USA).
2.7. Measurement of Free Amino Acids
Determination of free amino acids was carried out using the extraction method of [15],
with slight modifications. Only L-amino acids were quantified as cocoa flavor precursors.
Seven hundred milligrams of defatted powder and 1.4 g of polyvinylpyrrolidone (PVP) were
homogenized for 5 min at 0 °C in 15 mL distilled water and then adjusted to pH 2.5 using glacial
acetic acid. The mixture was then centrifuged at 13,000× g for 15 min and then filtered through
Whatman No. 4 filter paper. The filtrate was made to reach 50 mL using distilled water.
Twelve milliliters of acetone and DL-alpha-amino-n-butyric acid (AABA, internal standard) were
added to 3 mL of the filtrate. The mixture was then mixed thoroughly using a Polytron homogenizer,
kept at room temperature for 30 min and centrifuged at 13,000× g for 15 min. Acetone was then
removed by streaming with nitrogen gas. The amino acids were converted into phenylthiocarbamyl
(PTC) amino acids using phenyl isothiocyanate (PITC). Twenty microliters of sample extract were
used. The free amino acids were separated using RP-HPLC with gradient elution at a flow rate of
0.8 mL/min. Free amino acids were detected at 254 nm. Solvent A of the gradient elution was acetate
buffer at pH 5.7, and solvent B was acetonitrile:deionized water (60:40). The gradient elutions were as
follows: 0 min, 100% A, 0% B; 5 min, 75% A, 25% B; 13 min, 52% A, 48% B; 13.5 min, 0% A,
100% B; 16.5 min, 0% A, 100% B; 17 min, 100% A, 0% B; and 22 min, 100% A, 0% B. A Waters

Foods 2013, 2 188
Pico-Tag Free Amino Acids Column (3.9 mm × 300 mm i.d., Waters, Millipore Corporation, Milford,
MA, USA) was used for the analysis, which was employed at a temperature of 37 °C.
2.8. Measurement of Flavor with Electronic Nose (E-Nose)
The e-nose (model Gemine, Alpha M.O.S., Toulouse, France) with MOS chambers equipped with
six sensors (LY/AA, LY/gCT, T30/1, P30/2, T70/2, PA/2) was connected to an auto sampler
(CTC 100). A change in mass of a chemical compound caused a change in electrical resistance, as
indicated by each sensor.
A 3.0 g mashed sample was placed into a glass vial. Using a crimping tool, each sample vial was
sealed with a fitted cap and septum. Each vial was sealed tightly to prevent leaks and uncharacteristic
decrease in sensor signal. The sample vials were then placed in the instrumental tray for further
analysis. In this study, the sample was incubated at 50 °C for 10 min. The data collected using the
e-nose were analyzed using principal component analysis (PCA) to differentiate the cocoa beans.
2.9. Statistical Analysis
One-way single-factor analysis of variance (ANOVA) was performed using SPSS software
(version 16.0, SPSS Inc., Chicago, IL, USA). The F ratio was used to determine statistical significance
at p < 0.05. A multiple-comparison test using Fisher’s least significance difference (LSD) was
conducted. PCA was employed to describe the variability of sensory data.
3. Results and Discussion
3.1. Average Bean Weight and Butter Content
The gross weight and net weight of Indonesian cocoa beans were found to be higher than that of the
beans from Papua New Guinea and China, which was the lightest (Table 1). Genotype, soil, climate,
field management and harvest conditions have important effects on the characteristics of cocoa [7].
Papua New Guinea and China only began to plant cocoa in recent years; hence, the planting conditions
for cocoa plants are not laid out effectively. The percentage of nib in Chinese cocoa beans was the
highest among the samples (Table 1). The difference was caused by the thinner shell of Chinese cocoa
beans compared with cocoa beans from Papua New Guinea and Indonesia.
Table 1. The average weight and butter content of a cocoa bean.
Samples Gross weight/g Net weight/g Butter content (%)
C1 1.2124 a,b,c ± 0.0572 1.0757 a,b,c ± 0.0346 45.86 a,c,d ± 5.42
C2 1.3000 a,b,c ± 0.0143 1.1115 a,b,c ± 0.0261 53.67 a ± 4.81
C3 1.3946 b ± 0.0049 1.1713 b ± 0.3148 49.85 a,b,d ± 3.18
C4 1.1020 a,c ± 0.0997 1.0980 a,c ± 0.1582 39.24 c,d ± 4.25
C5 1.0225 c ± 0.0741 1.0062 c ± 0.2653 43.44 b,c,d ± 5.13
Mean values assigned with a common letter within the same column are not significantly different according
to Duncan’s multiple range test at the 5% level.

Foods 2013, 2 189
The butter content of the dried beans of unfermented and fermented cocoa beans is shown in
Table 1. Butter content varied from 39.24% to 53.67% for both fresh and fermented cocoa beans.
Among the five dried samples studied, Indonesian cocoa beans showed higher butter content than both
Chinese and Papua New Guinea dried beans. Zak and Keeney [16] reported that on average, fat, the
main storage component of cocoa beans, comprises 53% to 58% of the cotyledon dry weight. These
values are typical of fermented beans, but in the present study, the values varied among samples,
genetic and geographic origins and climate. Demonstrably, ambient temperature and stress caused by
heat or drought affect biosynthesis. In turn, the final composition of triacylglycerols and the melting
and crystallization characteristics of cocoa butter are affected [17].
3.2. Color and Absorbance at 420 nm
After measuring the tristimulus color of cocoa beans obtained from unroasted and roasted cocoa
beans (Table 2), L* did not change progressively after the roast, but fermentation did reduce the L* of
cocoa beans obtained from C2 and C3. Both a* and b*, however, increased progressively after the
roast, and higher incremental rates were observed in unfermented and fermented Indonesian cocoa
beans after roasting. Great differences in a* and b* values were also observed in the cocoa beans of
Papua New Guinea and Indonesia compared with those exhibited by Chinese fermented beans. This
finding agrees with the spectral measurement (absorbance at 420 nm), wherein the spectral changes
were higher in unfermented cocoa beans than in the fermented beans. The differences in the
polyphenol oxidase activity and the phenolic compounds in unfermented and fermented cocoa beans
were suspected to influence color formation intensity. If the fresh beans were dried without any
fermentation, the nib would be slaty and grey in color, rather than brown or purple-brown, which is the
color of fermented dried cocoa beans [18].
Table 2. The absorbance at 420 nm and the tristimulus L*, a* and b* values of cocoa beans.
Samples A 420 nm L* a
* b
*
C1 0.053 ± 0.021 42.22 a,b ± 0.243 5.240 a,b,c ± 1.165 3.327 a ± 1.183
C2 0.058 ± 0.038 45.93 ± 1.043 6.793 c ± 0.902 7.420 d ± 1.121
C3 0.887 a ± 0.022 47.42 c ± 0.904 4.940 a,b ± 0.242 6.783 c,d ± 0.193
C4 0.161 b ± 0.005 41.30 a ± 0.667 3.787 a ± 0.191 3.327 a ± 0.424
C5 0.195 c ± 0.005 41.52 a ± 1.187 4.633 a ± 1.166 2.323 a ± 1.020
CR1 0.217 d ± 0.002 43.59 b ± 0.621 6.393 c,b ± 0.263 5.367 b,c ± 0.194
CR2 0.218 d ± 0.004 43.67 b ± 0.501 7.457 ± 0.410 6.943 c,d ± 0.611
CR3 0.087 e ± 0.003 49.31 d ± 1.165 6.807 c ± 0.564 9.357 ± 1.310
CR4 0.048 ± 0.001 41.17 a ± 0.943 4.830 a,b ± 0.327 4.153 a,b ± 0.468
CR5 0.144 b ± 0.004 40.59 a ± 0.861 5.363 a,b,c ± 0.631 3.835 a,b ± 0.190
Mean values assigned with a common letter within the same column are not significantly different according
to Duncan’s multiple range tests at the 5% level.
During fermentation of cocoa beans, polyphenols diffuse with cell liquids from their storage cells
and undergo oxidation and complexation into high molecular mass, mostly insoluble, tannins.
Anthocyanins are rapidly hydrolyzed into anthocyanidins and sugars (galactose and arabinose) by
glycosidases. This process accounts for the bleaching of the purple color of the cotyledons.
Foods 2013, 2 190
Polyphenol oxidases convert the polyphenols (mainly epicatechin and free anthocyanidins) into
quinones. Polyphenols and quinones form complexes with other polyphenols, proteins and peptides.
This process decreases the solubility and astringency of cocoa beans and gives rise to the brown color
typical of well-fermented cocoa beans. The trismiclus L*, a* and b* values are reduced during
roasting, because of Maillard reactions [18].
3.3. Total Phenolic Content and Total Flavonoid Content
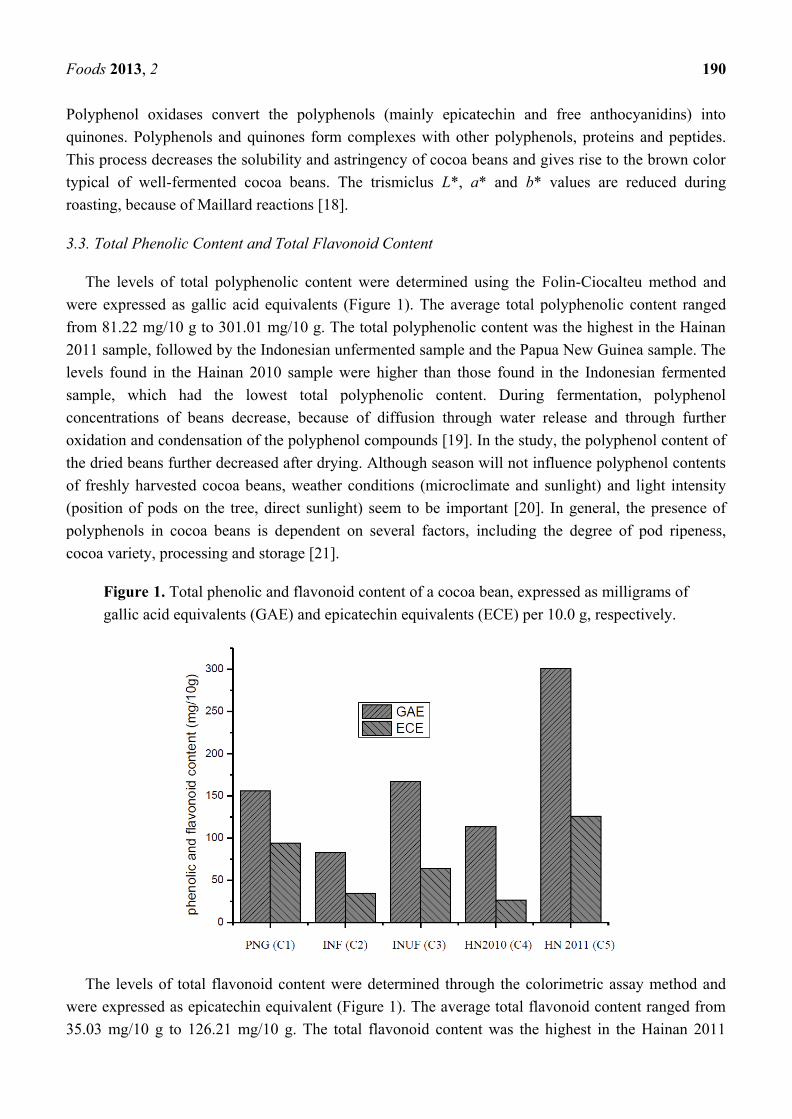
The levels of total polyphenolic content were determined using the Folin-Ciocalteu method and
were expressed as gallic acid equivalents (Figure 1). The average total polyphenolic content ranged
from 81.22 mg/10 g to 301.01 mg/10 g. The total polyphenolic content was the highest in the Hainan
2011 sample, followed by the Indonesian unfermented sample and the Papua New Guinea sample. The
levels found in the Hainan 2010 sample were higher than those found in the Indonesian fermented
sample, which had the lowest total polyphenolic content. During fermentation, polyphenol
concentrations of beans decrease, because of diffusion through water release and through further
oxidation and condensation of the polyphenol compounds [19]. In the study, the polyphenol content of
the dried beans further decreased after drying. Although season will not influence polyphenol contents
of freshly harvested cocoa beans, weather conditions (microclimate and sunlight) and light intensity
(position of pods on the tree, direct sunlight) seem to be important [20]. In general, the presence of
polyphenols in cocoa beans is dependent on several factors, including the degree of pod ripeness,
cocoa variety, processing and storage [21].
Figure 1. Total phenolic and flavonoid content of a cocoa bean, expressed as milligrams of
gallic acid equivalents (GAE) and epicatechin equivalents (ECE) per 10.0 g, respectively.
The levels of total flavonoid content were determined through the colorimetric assay method and
were expressed as epicatechin equivalent (Figure 1). The average total flavonoid content ranged from
35.03 mg/10 g to 126.21 mg/10 g. The total flavonoid content was the highest in the Hainan 2011

Foods 2013, 2 191
sample, followed by the samples from Papua New Guinea and Indonesia, unfermented. The levels
found in the Indonesian fermented sample were higher than those found in the Hainan 2010 sample,
which had the lowest total flavonoid content. Recently, cocoa bean polyphenols have attracted a lot of
attention, because of their potential benefits on human health. The health-promoting effects of
polyphenols are believed to be the result of the relatively high antioxidant activity of these compounds,
which protect people from chronic diseases by reducing oxidative damage. Cocoa polyphenols have
been reported to have a wide range of biological properties, including modulating eicosanoid synthesis,
increasing nitric oxide synthesis, lowering the rate of low-density lipoprotein oxidation, inhibiting
platelet activation, stimulating the production of anti-inflammatory cytokines and inhibiting the
production of certain pro-inflammatory cytokines [22].
3.4. Gallic Acid (GC) and Epicatechin (EA)
The predominant polyphenols identified in the freeze-dried defatted cocoa bean were catechin and
epicatechin. Epicatechin represented 2% to 4% of the dry mass of defatted powder, whereas catechin
was about 0.05% to 0.1% of the defatted bean. Epicatechin is the main polyphenol found in cocoa
beans [20]. The gallic acid and epicatechin contents of the cocoa bean samples are shown in Figure 2.
Hainan 2011 cocoa beans had the highest epicatechin content, followed by the Indonesian unfermented
cocoa beans for water extracts. The highest levels of gallic acid were found in the Hainan 2011 cocoa
beans followed by the samples from Papua New Guinea. The differences in values may be the result of
the fermentation process and the storage period. Each stage in the processing of cocoa alters the
chemistry of polyphenols. During cocoa fermentation, polyphenols are subjected to biochemical
modifications through oxidation and polymerization and to binding with proteins, thereby decreasing
their solubility and astringency effects [19]. Subsequently, during drying, the amount of polyphenols is
substantially reduced mainly by enzymatic browning [14]. On the contrary, the roasting process, which
is responsible for reducing bitter and acidic tastes, causes small changes in polyphenolic concentration.
Several studies showed a correlation between antioxidant activity and phenolic content [23].
Figure 2. The content of gallic acid and epicatechin per 10.0 g of cocoa.

Foods 2013, 2 192
3.5. Total and Free Amino Acids
Aroma precursors in cocoa beans, which include free amino acids, peptides and reducing sugars,
develop into cocoa-specific aroma through Maillard reactions during roasting. The concentrations of
total, hydrophobic, acidic and other free amino acids in dried cocoa beans are presented in
Tables 3 and 4. In the study, the average total amino acid content ranged from 11.58 g/100 g to
18.17 g/100 g. The total amino acid content was the highest in the Indonesian unfermented sample,
followed by the Hainan 2011 and Papua New Guinea samples. The levels found in the Hainan 2010
sample was higher than those found in the Indonesian fermented sample, which had the lowest total
amino acid content.
Table 3. The concentration of total amino acids (g/100 g).
Amino acids C1
(g/100 g)
C2
(g/100 g)
C3
(g/100 g)
C4
(g/100 g)
C5
(g/100 g)
asp 1.48234112 1.248726 2.03329 1.638016 2.285384
glu 2.76421738 2.33606 3.61903 2.745753 3.024123
ser 0.66305973 0.567914 0.928503 0.797482 0.934248
his 0.27536076 0.231274 0.392731 0.290148 0.342329
gly 0.67713588 0.553377 0.85647 0.71582 0.873638
thr 0.58388107 0.515058 0.778265 0.684044 0.812028
arg 0.96300469 0.884542 1.344468 1.123294 1.302416
ala 0.72384247 0.549737 0.911206 0.675514 0.82077
tyr 0.40220555 0.376532 0.569141 0.481996 0.507722
cys-s 0.09059641 0.103466 0.134149 0.14175 0.144297
val 0.88030156 0.772049 1.147787 0.929087 1.15285
met 0.16747286 0.069999 0.204375 0.1672 0.213946
phe 0.75009401 0.659956 1.148313 0.837903 0.958442
ile 0.56001189 0.503279 0.714016 0.610186 0.740686
leu 0.91887279 0.80002 1.254947 1.036056 1.242061
lys 0.6899189 0.685431 1.130527 0.802536 1.032648
pro 0.85167766 0.723573 1.004048 0.837604 0.858958
Total 13.4439947 11.58099 18.17126 14.51439 17.24655

Foods 2013, 2 193
Table 4. The concentration of free amino acids (g/100 g).
Amino acids C1
(g/100 g)
C2
(g/100 g)
C3
(g/100 g)
C4
(g/100 g)
C5
(g/100 g)
asp 0.06175624 0.052118 0.0595 0.03942 0.080142
glu 0.0616727 0.061372 0.076922 0.034869 0.064857
ser 0.00145676 0.002074 0.000417 0.000607 0.001391
his 0.00334901 0.003545 0.006681 0.002198 0.012053
gly 0.00981977 0.007367 0.017332 0.006294 0.023166
thr 0.01156708 0.011032 0.013705 0.008447 0.022726
arg 0.03857273 0.061132 0.017908 0.025347 0.095447
ala 0.11614724 0.073076 0.079882 0.047004 0.112538
tyr 0.04184931 0.0555 0.034151 0.029755 0.077396
cys-s 0.00110326 0.001001 1.25E-07 0.001071 0.001652
val 0.07068854 0.064691 0.054895 0.052798 0.11922
met 0.0015651 0.002192 0.000395 0.000734 0.003633
phe 0.06475303 0.083083 0.020958 0.050539 0.146415
ile 0.03503073 0.034275 0.019892 0.029651 0.073133
leu 0.09972465 0.117406 0.036901 0.061232 0.168642
lys 0.02884247 0.04466 0.018216 0.017223 0.051872
pro 0.05347026 0.043259 0.055476 0.048206 0.102607
Total 0.70136889 0.717783 0.513232 0.455394 1.15689
During cocoa fermentation, proteolysis, catalyzed by aspartic endoprotease and carboxypeptidase,
gives rise to amino acids and oligopeptides. The aspartic endoprotease from cocoa beans cleaves
protein substrate preferentially at hydrophobic amino acid residues to produce oligopeptides with
hydrophobic amino acid residues at their carboxy terminal ends [10].
The predominant release of hydrophobic free amino acids during proteolysis results in the high
proportion of these amino acids after fermentation. The concentration of hydrophobic free amino acids
generally increased in the samples added with carboxypeptidase as incubation progressed, whereas in
samples without carboxypeptidase, the concentration of hydrophobic free amino acids was relatively
constant. Kirchhoff et al. [24] found that hydrophobic free amino acids, such as leucine, phenylalanine,
alanine and tyrosine, contribute to the formation of cocoa flavor. These free amino acids are
presumably the result of the specific activity of aspartic endoprotease, which splits proteins into
hydrophobic peptides, allowing a limited action of carboxypeptidase to release predominantly
hydrophobic free amino acids.
3.6. Flavor with Electronic Nose (E-nose)
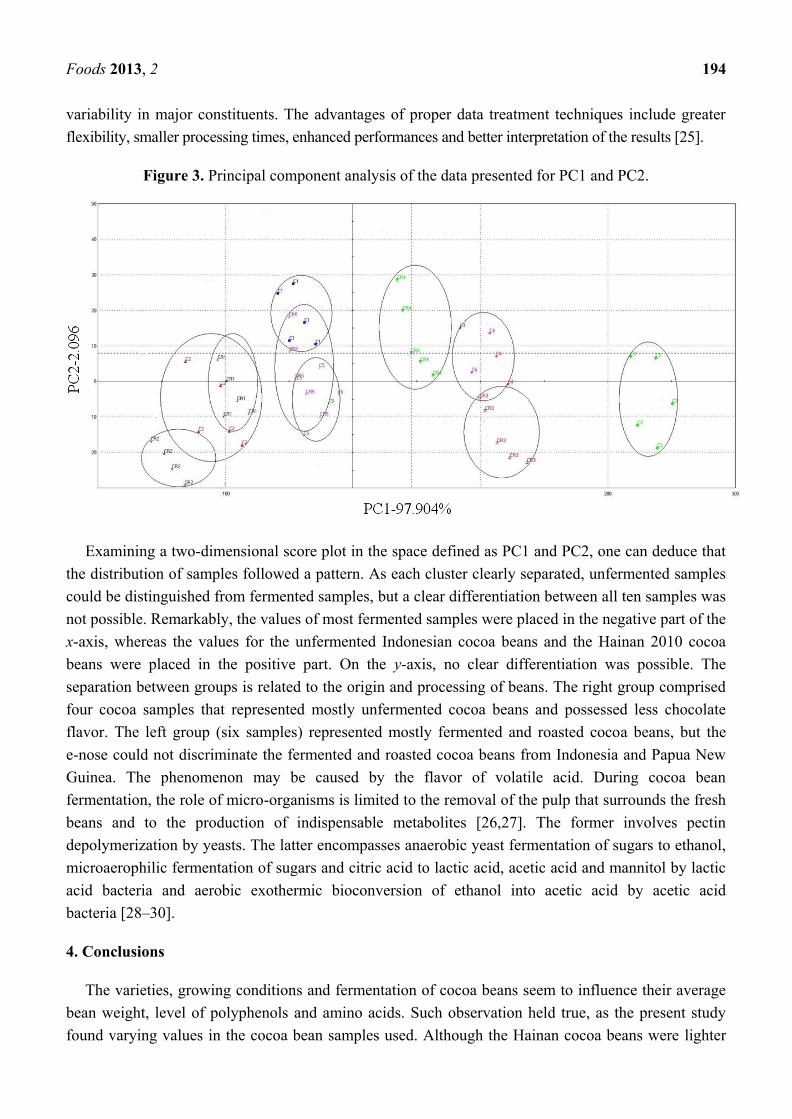
The e-nose clearly distinguished all the different cocoa bean samples using PCA as a data treatment
technique (Figure 3). PCA, associated with linear correlation, was applied to the complete collection of
sensor signals. The set of maximum signal values for each sensor resulted in a six-dimensional
(six sensors) pattern or data vector. The PCA plot showed the associations of large percentage
variances in PC scores of 1 and 2 are 97.904% and 2.096%, respectively. These values represented
Foods 2013, 2 194
variability in major constituents. The advantages of proper data treatment techniques include greater
flexibility, smaller processing times, enhanced performances and better interpretation of the results [25].
Figure 3. Principal component analysis of the data presented for PC1 and PC2.
Examining a two-dimensional score plot in the space defined as PC1 and PC2, one can deduce that
the distribution of samples followed a pattern. As each cluster clearly separated, unfermented samples
could be distinguished from fermented samples, but a clear differentiation between all ten samples was
not possible. Remarkably, the values of most fermented samples were placed in the negative part of the
x-axis, whereas the values for the unfermented Indonesian cocoa beans and the Hainan 2010 cocoa
beans were placed in the positive part. On the y-axis, no clear differentiation was possible. The
separation between groups is related to the origin and processing of beans. The right group comprised
four cocoa samples that represented mostly unfermented cocoa beans and possessed less chocolate
flavor. The left group (six samples) represented mostly fermented and roasted cocoa beans, but the
e-nose could not discriminate the fermented and roasted cocoa beans from Indonesia and Papua New
Guinea. The phenomenon may be caused by the flavor of volatile acid. During cocoa bean
fermentation, the role of micro-organisms is limited to the removal of the pulp that surrounds the fresh
beans and to the production of indispensable metabolites [26,27]. The former involves pectin
depolymerization by yeasts. The latter encompasses anaerobic yeast fermentation of sugars to ethanol,
microaerophilic fermentation of sugars and citric acid to lactic acid, acetic acid and mannitol by lactic
acid bacteria and aerobic exothermic bioconversion of ethanol into acetic acid by acetic acid
bacteria [28–30].
4. Conclusions
The varieties, growing conditions and fermentation of cocoa beans seem to influence their average
bean weight, level of polyphenols and amino acids. Such observation held true, as the present study
found varying values in the cocoa bean samples used. Although the Hainan cocoa beans were lighter

Foods 2013, 2 195
than the other samples, their total polyphenolic and flavonoid content were higher or equal to the cocoa
beans from Papua New Guinea and Indonesia. Aside from the interest in the quality standards and
economic specification of raw material, manufacturers today pay great attention to declaring their
products as functional food. Thus, our data provide additional knowledge to be considered in the
promotion of cocoa plantations in China.
The results obtained from this study are essential in understanding and solving the problems
associated with the quality of raw cocoa beans. Further research is needed to determine the effect of
the growing conditions, storage time and fermentation on the physico-chemical and flavor quality
attributes of industrial raw cocoa material. Such a direction is intended for improving the quality of
raw cocoa beans sourced from China, Indonesia and Papua New Guinea.
Acknowledgments
This study was funded by the Chinese Central Public-Interest Scientific Institution Basal Research
Fund (1630052012017) and the Natural Science Foundation of Hainan Province (311085).
Conflict of Interest
The authors declare no conflict of interest.
References
1. Tafuri, A.; Ferracane, R.; Ritieni, A. Ochratoxin A in Italian marketed cocoa products. Food Chem.
2004, 88, 487–494.
2. Thompson, S.S.; Miller, K.B.; Lopez, A.S. Cocoa and Coffee. In Food Microbiology—
Fundamentals and Frontiers; Doyle, M.J., Beuchat, L.R., Montville, T.J., Eds.; ASM Press:
Washington, DC, USA, 2001; pp. 721–733.
3. Lopez, A.S.; Dimick, P.S. Cocoa Fermentation. In Enzymes, Biomass, Food and Feed; Reed, G.,
Nagodawithana, T.W., Eds.; VCH: Weinheim, Germany, 1995; pp. 561–577.
4. Ardhana, M.M.; Fleet, H.G. The microbial ecology of cocoa bean fermentations in Indonesia. Int.
J. Food Microbiol. 2003, 86, 87–99.
5. LMC International. Anonymous. In The World Cocoa Market Outlook; LMC International Ltd.:
New York, NY, USA, 2001; pp. 1–29.
6. Hii, C.L.; Law, C.L.; Cloke, M.; Suzannah, S. Thin layer drying kinetics of cocoa and dried
product quality. Biosyst. Eng. 2009, 102, 153–161.
7. Biehl, B.; Voigt, J. Biochemistry of Chocolate Flavour Precursors. In Proceedings of the 12th
International Cocoa Conference, Salvador, Brazil, 17–23 November 1996.
8. Puziah, H.; Jinap, S.; Sharifah, K.S.M.; Asbi, A. Changes in free amino acids, peptide-N, sugar
and pyrazine concentration during cocoa fermentation. J. Sci. Food Agric. 1998, 78, 535–542.
9. Kratzer, U.; Frank, R.; Kalbacher, H.; Biehl, B.; Wöstemeyer, J.; Voigt, J. Subunit structure of the
vicilin-like globular storage protein of cocoa seeds and the origin of cocoa- and chocolate-specific
aroma precursors. Food Chem. 2009, 113, 903–913.

Foods 2013, 2 196
10. Jinap, M.; Nazamid, S.; Jamilah, B. Activation of remaining key enzymes in dried
under-fermented cocoa beans and its effect on aroma precursor formation. Food Chem. 2002, 78,
407–417.
11. Hammami, C.; Rene, F.; Marin, M. Processquality optimization of the vacuum freeze-drying of
apple slice by the response surface method. Int. J. Food Sci. Technol. 1999, 34, 145–160.
12. Lee, W.K.; Kim, J.Y.; Lee, J.H.; Lee, Y.C. Cocoa has more phenolic phytochemicals and
a higher antioxidant capacity than teas and red wine. J. Agric. Food Chem. 2003, 51, 7292–7295.
13. Jia, Z.S.; Tang, M.C.; Wu, J.M. The determination of flavonoid contents in mulberry and their
scavenging effects on superoxide radicals. Food Chem. 1999, 64, 555–559.
14. Kyi, M.T.; Daud, W.W.R.; Mohammad, B.M.A.; Samsudin, W.; Kadhum, A.A.H.; Talib, M.Z.M.
The kinetics of polyphenol degradation during the drying of Malaysian cocoa beans. Int. J. Food
Sci. Technol. 2005, 40, 323–331.
15. Noor-Soffalina, S.S.; Jinap, S.; Nazamid, S.; Nazimah, S.A.H. Effect of polyphenol and pH on
cocoa Maillard-related flavour precursors in a lipidic model system. Int. J. Food Sci. Technol.
2009, 44, 168–180.
16. Zak, D.L.; Keeney, P.G. Changes in cocoa proteins during ripening of fruit, fermentation, and
further processing of cocoa beans. J. Agric. Food Chem. 1976, 24, 483–486.
17. Afoakwa, O.E. Chocolate Science and Technology; Wiley-Blackwell: Oxford, UK, 2010;
pp. 110–156.
18. Beckett, T.S. Industrial Chocolate Manufacture and Use, 4th ed.; Wiley-Blackwell: Oxford, UK,
2009; pp. 1–10.
19. Nazaruddin, R.; Seng, L.K.; Hassan, O.; Said, M. Effect of pulp preconditioning on the content of
polyphenols in cocoa beans (Theobroma cacao) during fermentation. Ind. Crops Prod. 2006, 24,
87–94.
20. Niemenak, N.; Rohsius, C.; Elwers, S.; Ndoumoua, D.O.; Lieberei, R. Comparative study of
different cocoa (Theobroma cacao L.) clones in terms of their phenolics and anthocyanins
contents. J. Food Compos. Anal. 2006, 19, 612–619.
21. Camu, N.; Winter, D.T.; Addo, K.S.; Takrama, S.J.; Bernaert, H.; Vuyst, D.L. Fermentation of
cocoa beans: Influence of microbial activities and polyphenol concentrations on the flavour of
chocolate. J. Sci. Food Agric. 2008, 88, 2288–2297.
22. Redovniković, I.R.; Delonga, K.; Mazor, S.; Dragović-Uzelac, V.; Carić, M.; Vorkapić-Furač, J.
Polyphenolic content and composition and antioxidative activity of different cocoa liquors. Czech
J. Food Sci. 2009, 27, 330–337.
23. Ramli, N.; Hassan, O.; Said, M.; Samsudin, W.; Idris, A.N. Influence of roasting conditions on
volatile flavor of roasted Malaysian cocoa beans. J. Food Proc. Preserv. 2006, 30, 280–298.
24. Tomas-Barberán, F.A.; Cienfuegos-Jovellanos, E.; Marín, A.; Muguerza, B.; Gil-Izquierdo, A.;
Cerdá, B.; Zafrilla, P.; Morillas, J.; Mulero, J.; Ibarra, A.; et al. A new process to develop a cocoa
powder with higher flavonoid monomer content and enhanced bioavailability in healthy humans. J.
Agr. Food Chem. 2007, 55, 3926–3935.

Foods 2013, 2 197
25. Miller, B.K.; Hurst, W.J.; Flannigan, N.; Gan, L.N.; Ou, B.X.; Lee, C.Y.; Smith, N.; Stuart, A.D.
Survey of commercially available chocolate- and cocoa-containing products in the United States. 2.
Comparison of flavan-3-ol content with nonfat cocoa solids, total polyphenols, and percent cacao.
J. Agric. Food Chem. 2009, 57, 9169–9180.
26. Hans-Dieter, W. Discrimination of chocolates and packaging materials by an electronic nose. Eur.
Food Res. Technol. 2001, 212, 529–533.
27. Schwan, R.F.; Wheals, A.E. The microbiology of cocoa fermentation and its role in chocolate
quality. Crit. Rev. Food Sci. Nutr. 2004, 44, 205–221.
28. De Brito, E.S.; Pezoa García, N.H.; Gallao, M.I.; Cortelazzo, A.L.; Fevereiro, P.S.; Braga, M.R.
Structural and chemical changes in cocoa (Theobroma cacao L) during fermentation, drying and
roasting. J. Sci. Food Agric. 2000, 81, 281–288.
29. Hansen, C.E.; del Olmo, M.; Burri, C. Enzyme activities in cocoa beans during fermentation.
J. Sci. Food Agric. 1998, 77, 273–281.
30. Jinap, M.; Jamilah, B.; Nazamid, S. Effects of incubation and polyphenol oxidase enrichment on
colour, fermentation index, procyanidins and astringency of unfermented and partly fermented
cocoa beans. Int. J. Food Sci. Technol. 2003, 38, 285–295.
© 2013 by the authors; licensee MDPI, Basel, Switzerland. This article is an open access article
distributed under the terms and conditions of the Creative Commons Attribution license
(http://creativecommons.org/licenses/by/3.0/).