Comparison of Army/ Air Force and Private-Sector … analysis of current compensation (cash and...
110
CIM D0003361.A1/Final February 2001 Comparison of Army/Air Force and Private-Sector Physicians' Total Compensation, by Medical Specialty (Supplement to Health Professions' Retention- Accession Incentives Study) Shayne Brannman • Cori Rattelman Center for Naval Analyses 4825 Mark Center Drive • Alexandria, Virginia 22311-1850
Transcript of Comparison of Army/ Air Force and Private-Sector … analysis of current compensation (cash and...

CIM D0003361.A1/Final
February 2001
Comparison of Army/ Air Force and Private-Sector Physicians' Total Compensation, by Medical Specialty (Supplement to Health Professions' RetentionAccession Incentives Study)
Shayne Brannman • Cori Rattelman
Center for Naval Analyses 4825 Mark Center Drive • Alexandria, Virginia 22311-1850

Report Documentation Page Form ApprovedOMB No. 0704-0188
Public reporting burden for the collection of information is estimated to average 1 hour per response, including the time for reviewing instructions, searching existing data sources, gathering andmaintaining the data needed, and completing and reviewing the collection of information. Send comments regarding this burden estimate or any other aspect of this collection of information,including suggestions for reducing this burden, to Washington Headquarters Services, Directorate for Information Operations and Reports, 1215 Jefferson Davis Highway, Suite 1204, ArlingtonVA 22202-4302. Respondents should be aware that notwithstanding any other provision of law, no person shall be subject to a penalty for failing to comply with a collection of information if itdoes not display a currently valid OMB control number.
1. REPORT DATE FEB 2001 2. REPORT TYPE
3. DATES COVERED 00-00-2001 to 00-00-2001
4. TITLE AND SUBTITLE Comparison of Army/Air Force and Private-Sector Physicians’ TotalCompensation, by Medical Specialty (Supplement to Health Professions’Retention-Accession Incentives Study)
5a. CONTRACT NUMBER
5b. GRANT NUMBER
5c. PROGRAM ELEMENT NUMBER
6. AUTHOR(S) 5d. PROJECT NUMBER
5e. TASK NUMBER
5f. WORK UNIT NUMBER
7. PERFORMING ORGANIZATION NAME(S) AND ADDRESS(ES) CNA Analysis & Solutions,Center for Naval Analyses ,4825 Mark Center Drive,Alexandria,VA,22311
8. PERFORMING ORGANIZATIONREPORT NUMBER
9. SPONSORING/MONITORING AGENCY NAME(S) AND ADDRESS(ES) 10. SPONSOR/MONITOR’S ACRONYM(S)
11. SPONSOR/MONITOR’S REPORT NUMBER(S)
12. DISTRIBUTION/AVAILABILITY STATEMENT Approved for public release; distribution unlimited
13. SUPPLEMENTARY NOTES
14. ABSTRACT
15. SUBJECT TERMS
16. SECURITY CLASSIFICATION OF: 17. LIMITATION OF ABSTRACT Same as
Report (SAR)
18. NUMBEROF PAGES
109
19a. NAME OFRESPONSIBLE PERSON
a. REPORT unclassified
b. ABSTRACT unclassified
c. THIS PAGE unclassified
Standard Form 298 (Rev. 8-98) Prescribed by ANSI Std Z39-18

Copyright CNA ~orporation/~canned October 2002
Approved for distribution:
$ ~ a . . w Laurie 1. May, Director
Medical programs Resource Analysis Division
This document represents the best opinion of CNA at the time of issue. It does not necessarily represent the opinion of the Department of the Navy.
Approved for Public Release; Distribution Unlimited. Specific authority: N00014-00-D-0700. For copies of this document call: CNA Document Control and Distribution Section at 703-824-2943.
February 2001
Copyright O 2001 The CNA Corporation

Contents
Introduction and background. 1 Findings. . . 2 Methodology . . . . . . . 2 Conclusions . . . . . . . . 5
Chapter 1: Introduction and approach. 1-1
Chapter 2: Results . . . . . 2-1
Appendix A: Assumptions . . A-1
Appendix B: Private sector survey participants . . B-1
Appendix C: Benefit Value Comparison (BVC) methodology . . . . . . . . . . . . . . . . . . . . . . C-1

THIS PAGE INTENTIONALLY LEFT BLANK

Introduction and background
The appropriate level of compensation for individuals serving in the military is continually being monitored. This issue is particularly
important for Military Health System (MHS) physicians because they
are costly to access and train, and they have skills that are readily
transferable to the private sector. If compensation is perceived to be
too low for the demands and duties required, uniformed medical
officers may abandon the military for a private-sector career path.
Conversely, total compensation should be no higher than the amount
required to attract and retain a quality force.
Congressional awareness of these issues resulted in the following
committee language in the National Defense Authorization Act for
Fiscal Year 2001:
The committee directs the Secretary of Defense to conduct a review and to report to the Committee on Armed Services of the Senate and the House of Representatives on the adequacy of special pays and bonuses for medical corps officers and other health care professionals. The committee directs this review because of the level of competition within the economy for health care professionals and the potential devaluation of current special pays and bonuses, which could have a significant impact on recruiting and retention of health care professionals.
As a result of this language, the TRICARE Management Agency
(TMA) at DoD asked CNA to conduct a study to address the concerns
voiced by Congress.1 To respond to TMA's request, CNA conducted a
comparative analysis of current compensation (cash and benefits)
between Army and Air Force physicians and private-sector physicians.
1. An August 2000 CNA document (CIM D0002053.A, Comparison of Navy and Private-Sector Physicians' Total Compensation, by Medical Specialty) and a February 2001 CNA document (CRM D0003360.Al, Health Professions' Retention-Accession Incentive Study Report to Congress (Phase I: Compensation Comparison of Selected Uniformed and Private-Sector Health Care Professionals) provide detailed descriptions of Navy physician compensation and analyses of how uniformed and private-sector physician pay gaps have changed over the last decade.
1

Findings
Methodology
2
The results of that comparison are contained in the attachments of this information memorandum.
We calculated and compared the current total compensation (sum of cash salary, all special pays, and benefits) between uniformed Army,
Air Force, and private-sector (salaried) physicians for 24 physician
specialties at three military physician career junctures: completion of
7, 12, and 17 years of service (YOS). We find that, looking at a cross
section or "snapshot" of current compensation, a pay gap does exist between Army and Air Force and private-sector physicians for all of the physician specialties that we examined, with the exception of family practice and at the 17-YOS juncture.2 Our analysis shows that the current military-civilian physician pay gap varies widely by specialty-13 to 63 percent at the 7-YOSjuncture and 3 to 55 percent at
the 12-YOS career point. The pay gap is generally wider for physician
specialties that perform mostly procedures, such as surgeons and radiologists, than for those specialties that do mostly evaluation and management-type activities, such as family practice and internal medicine.
We have developed a model comparing total compensation (salary,
special and incentive pays, pension, and other benefits) for 24 physician specialties based on the most typical Army and Air Force physician career.3 Private-sector compensation was culled from proprietary databases representing over 90 employer-based health care organiza
tions and over 22,000 physician incumbents. The robustness of this data source is necessary when comparing specialties at different
career junctures. We feel that comparisons to this sample, salaried
physicians, are appropriate because the characteristics of the organizations reporting data most closely resemble the military environment (56 percent are hospital-based facilities, 29 percent are group practices, and 15 percent are Health Maintenance Organizations) .4
2. Military-civilian pay gap equals the absolute value of (MC/CC) - 1, where MC = military compensation and CC = civilian compensation.

There are concerns about using only salaried physician compensation
data. According to the American Medical Association (AMA), 36 per
cent of America's physicians self-reported working for an employer.
This same report shows a pay gap, at the median net income level,
between self-employed (private practice) and employee (salaried)
physicians. 5 The report also states:
Self-employed physicians tend to work more hours and see more patients, have more years of experience, are likely to be certified by one or more speciality boards, and are more likely to be male, all factors associated with higher earning. Controlling for these factors, the income advantage of selfemployed physicians would be much less than reported.
Although our compensation comparisons may underestimate the
potential compensation differential for those military physicians who
choose to separate and have the option to join select private practices,
our model provides policy-makers a valuable tool for comparing the
maximum amount of compensation an Army or Air Force physician
can receive versus a salaried specialist working in a similar
environment with the same years of experience. This methodology
3. Based on discussions with representatives from the TMA, Army, and Air Force, the model adopts an accession, career, and training profile typical of most military physicians. The profile assumes graduation from medical school at age 26, due course promotion, a 4-year Armed Forces Health Professional Scholarship Program followed by an active duty internship (PGY-1), and completion of a full-time in-service residency (PGY-2). The Army and Air Force typically send physicians immediately into residency training after internship, and into fellowship training right after residency training. The predominant profile for Army and Air Force physicians is the same with the exceptions of neurosurgery and otolaryngology (residency programs are assumed to be 6 and 5 years (Army), respectively, and 5 and 4 years, respectively (Air Force)).
4. The Hay Group served as subcontractor for all physician cash and benefit compensations. We wish to acknowledge the efforts of Michael Gaffney and Sevim Kuyumcu of Hay Group.
5. 1999/2000 AMA Physician Socioeconomic Statistics report shows that the median net income for self-employed physicians was $200,000 versus $140,000 for employee (salaried) physicians. Data are from the 1998 Socioeconomic Monitoring System Survey of Physicians.
3

4
reflects a conservative estimate of the pay gap, using an alternative wage that a military physician can be fairly assured of receiving in the civilian sector.
Compensation includes all cash and benefits for fully trained special
ists. 6 For uniformed physicians, cash compensation includes regular military compensation (RMC), and medical officer special and incen
tive pays (including board certification pays).7 Benefit compensation includes health care, military retirement, the Survivor Benefit Plan, and other active duty benefits.
Private-sector compensation includes base salary, incentive pay,
health care, pension and capital accumulation plan, and other benefits. Capital accumulation plans include 401(k) and 403(b) plans.
The value shown for capital accumulation plans is based on employer matching contributions only. Amounts resulting from employee contributions and executive benefits, such as supplemental non-qualified retirement plans, are not included. Calculations for uniformed and
private sector cash and benefits are as of 1 July 2000.8
6. The study did not consider the subsidization value for the Armed Forces Health Professional Scholarship Program, nor did it make compensation comparisons during the period of residency training.
7. RMC consists of basic pay, basic allowance for housing, basic allowance for subsistence, and the tax advantage accruing to the non-taxable nature of housing and subsistence allowances. Basic pay represents about 66 percent of RMC for an 0-3 and approximately 75 percent of RMC for an 0-6. We also include all medical special pays (including board certification) offered to these specialties and assume each specialist takes advantage of all available special programs when eligible. Appendix A describes each of these components in more detail.
8. Physician survey data are effective as of mid-1999. We adjusted all data to 2000 by applying a 4.5-percent trend factor.

Conclusions
Our comparison takes a snapshot of an Army/ Air Force physician's
compensation as of july 2000 and compares this to the compensation
of his or her civilian equivalent.9 We refer to this as a cross-sectional
comparison. We have calculated cross-sectional compensation com
parisons for Army and Air Force physicians who are at one of three
decision points in their careers-completion of 7, 12, or 17 years of
service. We present these cross-sectional comparisons because these
data are often a compelling factor for many individuals faced with the
decision to continue in their current career path or to change course.
For this reason, the cross-sectional comparisons may have a signifi
cant role in physician retention. Both the cross-sectional and present
value comparisons are presented for median and 75th- percentile pri
vate-sector data.
We find that a current Army, Air Force, and private-sector physician
pay gap exists and that they vary significantly by specialty.10 The data
presented in this information memorandum describe the methodol
ogy used and results for each of the 24 physician specialties.
9. By civilian equivalent, we mean a physician of the same specialization with equivalent years of practice (YOP) as a fully trained specialist working in the private sector. As an example, for internal medicine, at age 33 an Army and Air Force physician would have completed 7 years of service, composed of a 1-year active duty internship, 2 years in internal medicine (IM) residency, and 4 years of practice as a IM specialist. The Army and Air Force physician total compensation will be compared with a private sector IM specialist with 4 years in practice.
10. A February 2001 CNA document (CRM D0003360.A1) describes current uniformed and private-sector pay gaps and the change over the last decade. This report also includes Navy and private-sector physician pay gap data.
5

THIS PAGE INTENTIONALLY LEFT BLANK

Center for Naval Analyses Comparison of Physician Total Compensation
Chapter 1: Introduction and Approach
Organization of Analysis
Total compensation comparisons are presented as a "shapshot" of the value of current cash compensation and benefits for Army and Air Force physicians who are presently at one of three points during their careers.
The three points during an Army and Air Force medical career that were chosen for comparison with private sector physicians were upon completion of 7, 12 or 17 years of service. These were the three career decision points used in the study of Navy physicians.
Physicians in some specialties and subspecialties may not be able to separate at each of the three points because they are either in residency or fellowship training, or they are serving an active duty service commitment resulting from training. Table 1-1 on the following page summarizes the possible separation decisions by specialty.
Elements of Compensation
Compensation includes all cash and benefits 1• For Army and Air Force physicians, cash compensation includes Regular Military Compensation (RMC), and medical officer special and incentive pays. Benefits compensation includes health care, military retirement, the Survivor Benefit Plan, and other active duty and retired Army and Air Force benefits.
Private sector compensation includes base salary, incentive pay, health care, pension and capital accumulation plan, and other benefits. Capital accumulation plans include 401 (k) plans and 403(b) plans. The value shown for capital accumulation plans is based on employer matching contributions only. Amounts resulting from employee contributions are not included. Executive benefits, such as supplemental non-qualified retirement plans, are not included. The value of Army and Air Force-sponsored training, either before or after accession is not included.
Calculations reflect Army, Air Force and private sector cash and benefits available on 1 July 2000.
Appendix A provides complete details on the Army, Air Force and private sector compensation elements.
1 The study did not consider the subsidization value for the Armed Forces Health Professional Scholarship Program, nor did it make compensation comparisons during the period of residency training.
HayGroup Page 1-1

Center for Naval Analyses Comparison of Physician Total Compensation
Table 1-1: Possible Separation Points for Army and Air Force Physicians~
Specialty 7YOS 12YOS 17YOS Anesthesiology No Yes Yes Cardiology (Invasive) N/A Yes Yes Dermatology No Yes Yes Emergency Medicine No Yes Yes Family Practice Yes Yes Yes Gastroenterology N/A Yes Yes General Surgery No Yes Yes Hematology/Oncology N/A Yes Yes Internal Medicine Yes Yes Yes Neurology No Yes Yes Neurosurgery (Army) No No Yes Neurosurgery (Air Force) No Yes Yes Obstetrics/Gy_necoloqy No Yes Yes Industrial & Occupational Medicine Yes Yes Yes Ophthalmology No Yes Yes Orthopedic Surgery No Yes Yes Otolarynqoloqy No Yes Yes Pathology No Yes Yes Pediatric Primary Care Yes Yes Yes Phy§ical Medicine & Rehabilitation No Yes Yes Plastic & Reconstructive Surgery N/A No Yes Psychiatly No Yes Yes Radiology (Diagnostic) No Yes Yes Radiolo_gy_(Therapeutic) No Yes Yes Urology No Yes Yes
Assumptions
The study makes a number of important career progression, economic and other assumptions in order to make consistent Army, Air Force and private sector compensation comparisons. Appendix A describes each assumption.
The analysis shows compensation comparisons of Army and Air Force physicians with private sector physician specialists who have the same number of years of practice in the specialty or subspecialty.
The study adopts an accession and training profile typical of most Army and Air Force physicians. The profile assumes a four-year Health Profession Scholarship Program (HPSP) followed by a one-year active duty internship (PG-1). Army and Air Force physicians are assumed to enter residency programs immediately following internship. Those Army and Air Force physicians receiving
2 "N/A" indicates physician is in primary residency training program. "No" indicates physician has completed primary residency training but has no active duty service commitment that precludes separation.
HayGroup · Page 1-2

Center for Naval Analyses Comparison of Physician Total Compensation
fellowship training are assumed to begin fellowship training immediately following residency training. Both residency and fellowship training are assumed to occur on active duty.
Private sector physicians are assumed to begin a year of internship following medical school at age 26, followed immediately by residency training and then fellowship training for invasive cardiology, gastroenterology, hematology/ oncology, and plastic & reconstructive surgery. The study also assumes that private sector physicians enter practice in their specialty/subspecialty following residency/fellowship training.
As an example for internal medicine, at age 33 an Army or Air Force physician would have completed seven years of service, composed of one year of PG-1, two years in internal medicine residency, and four years of practice as an IM specialist. This physician's total compensation would be compared with a private sector IM specialist with four years of practice in the specialty.
An Army or Air Force orthopedic surgeon at age 38 with 12 completed years of service would have spent that time serving one year in PG-1, four years in orthopedic residency, and seven years practicing in the specialty. The appropriate compensation comparator would be a private sector orthopedic surgeon with seven years of practice in the specialty.
An Army or Air Force cardiologist at age 43 with 17 completed years of service would have spent that time serving one year in PG-1, two years in internal medicine residency, three years in cardiology fellowship training, and 11 years of practice as a cardiologist. The appropriate compensation comparator would be a private sector cardiologist with 11 years of practice in the specialty.
With two exceptions, the study assumes that residency and fellowship training lengths are the same for the Army and Air Force within a particular specialty or subspecialty. For example, the study assumes a four-year residency program for both Army and Air Force physicians specializing in pathology. The exceptions are neurosurgery and otolaryngology where the Army residency programs are assumed to be six and five years in length, respectively, and the Air Force residency programs are assumed to be five and four years in length, respectively.
Data Sources
The study uses the Basic Pay and Regular Military Compensation tables that were effective 1 July 2000. Specialty and incentive pays are those effective 1 October 1999. The study assumes no future increases in specialty or incentive pays, primarily because most increases require congressional legislation that cannot be predicted with certainty.
HayGroup Page 1-3

Center for Naval Analyses Comparison of Physician Total Compensation
Private sector cash compensation by specialty was extracted from the 1999 Physician's Total Compensation Survey conducted by the Hay Group. The survey represents responses from more than 22,300 physicians employed nationwide in 91 group practices, Health Maintenance Organizations, and hospital-based facilities. The data are trended by 4.5 percent to 2000.
The study uses private sector benefits data from the organizations participating in the Physician's Compensation Survey. Benefit values for Army, Air Force and private sector physicians were determined using the methodology described in Appendix C.
Individual private sector compensation data are not separately identified by whether the physician is board certified or a graduate of a U.S. medical school. These factors can affect total compensation levels. In some cases, survey respondents indicated the employer applied a salary differential for board certification, but specific amounts are not available. Most Army and Air Force physicians are board certified and the majority are graduates of U.S. schools. Consequently, total private sector compensation data are shown for the median (50th percentile3
) and the 75th percentile4. We believe this presents a reasonable
range within which it is possible to make valid comparisons. For one specialty, neurosur~ery, we had an insufficient sample size to develop a reliable estimate of the 751 percentile.
Snapshot of Current Compensation
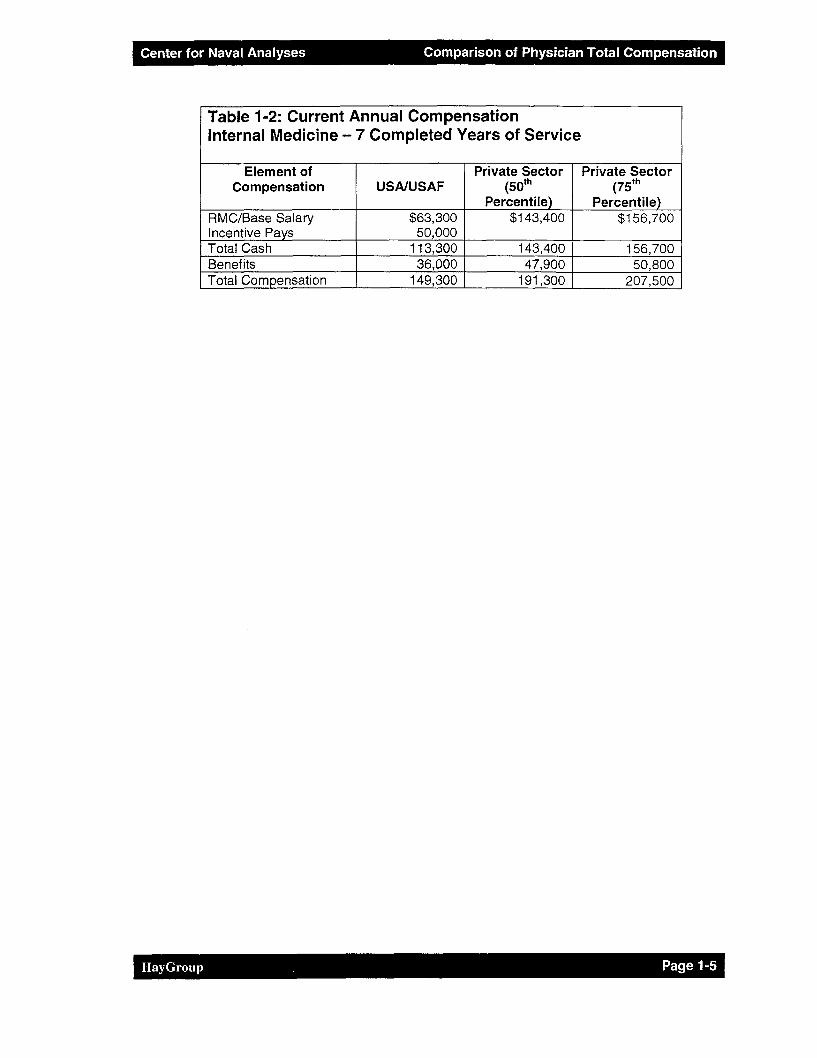
As an example, Table 1-2 summarizes current compensation information for the internal medicine specialty, illustrating the value of annual cash and benefits for a 33-year-old Army or Air Force physician with seven completed years of service. The example compares the most typical Army or Air Force internal medicine physician with seven years of completed service (assumes one-year of PG-1, two years in an active duty residency, and four years in a staff utilization tour) with a private-sector internal medicine physician with four years of practice.
3 The median value divides the data set in half. Half of the physicians have total annual compensation above the median and half have total compensation below the median. 4 Twenty-five percent of physicians have total compensation above the 751
h percentile level and 75 percent have total compensation below this amount.
HayGroup Page 1-4
Center for Naval Analyses Comparison of Physician Total Compensation
Table 1-2: Current Annual Compensation Internal Medicine- 7 Completed Years of Service
Element of Private Sector Private Sector Compensation USA/USAF (50th (75th
Percentile) Percentile) RMC/Base Salary $63,300 $143,400 $156,700 Incentive Pays 50,000 Total Cash 113,300 143,400 156,700 Benefits 36,000 47,900 50,800 Total Compensation 149,300 191,300 207,500
HayGroup Page 1-5

Center for Naval Analyses Comparison of Physician Total Compensation
Chapter 2: Results
Results by Medical Specialty and Subspecialty
This chapter provides the current annual cash compensation and benefit comparisons of Army, Air Force and private sector physicians for the following medical specialties and subspecialties.
• Anesthesiology • Cardiology (Invasive) • Dermatology • Emergency Medicine • Family Practice • Gastroenterology • General Surgery • Hematology/Oncology • Internal Medicine • Neurology • Neurosurgery • Obstetrics/Gynecology • Industrial/Occupational Medicine • Ophthalmology • Orthopedic Surgery • Otolaryngology • Pathology • Pediatric Primary Care • Physical Medicine & Rehabilitation • Plastic & Reconstructive Surgery • Psychiatry • Radiology (Diagnostic) • Radiology (Therapeutic) • Urology
Comparisons are made for Army and Air Force physicians who have completed 7, 12, and 17 years of service.
All comparisons are made at the median and 75th percentiles of private sector physician compensation. ·
HayGroup Page 2-1

Center for Naval Analyses Comparison of Total Compensation
Years of Completed
USNUSAF Servic 7
Years of Completed
USNUSAF Servic 12
Years of Completed
USNUSAF Servic 17
Anesthesiology Current Annual Compensation
Compensation Element USNUSAF
RMC/Base Salary $63,300 Incentive Pays $58,000
Total Cash $121,300
Total Benefits $36,000
Total Compensation $157,300
Compensation Element USNUSAF
RMC/Base Salary $77,600 Incentive Pays $66,000
Total Cash $143,600
Total Benefits $42,900
Total Compensation $186,500
Compensation Element USNUSAF
RMC/Base Salary $86,100 Incentive Pays $66,000
Total Cash $152,100
Total Benefits $47,400
Total Compensation $199,500
Private Sector Private Sector (50th Percentile) (75th Percentile)
$208,600 $229,500
$208,600 $229,500
$64,900 $73,000
$273,500 $302,500
Private Sector Private Sector (50th Percentile) (75th Percentile)
$215,900 $239,500
$215,900 $239,500
$68,200 $75,700
$284,100 $315,200
Private Sector Private Sector (50th Percentile) (75th Percentile)
$223,100 $249,400
$223,100 $249,400
$71,400 $78,400
$294,500 $347,800
Army and Air Force compensation is RMC, special and incentive pays, and benefits as of 1 July 2000
Private Sector compensation is total salary (including base and incentives) and benefits as of 1 July 2000
llayGroup Page 2-2

I
Center for Naval Analyses Comparison of Total Compensation
$350,000
$300,000
$250,000
$200,000
$150,000
$100,000
$50,000
$0 u. s < It)
.~ Q.
<i: ;;;
~ Q.
Anesthesiology Current Annual Compensation
li) .... Q. ;;; Q.
u. s li) u. s li) < It) .... < It) .... ~ Q. Q. ~ Q. Q.
<i: ;;; Ci{
~ ;;;· ;;;
~ Q. Q. Q. Q.
7 Yrs Completed 12 Yrs Completed 17 Yrs Completed
D Total Benefits
• Total Cash
HayGroup Page 2-3

Center for Naval Analyses Comparison of Total Compensation
Cardiology (Invasive) Current Annual Compensation
Years of Completed Private Sector Private Sector
USNUSAF Service Compensation Element USNUSAF (50th Percentile) (75th Percentile) 7
RMC/Base Salary $63,300 $226,800 $267,100 Incentive Pays $65,000
Total Cash $128,300 $226,800 $267,100
Total Benefits $36,000 $69,100 $91,800
Total Compensation $164,300 $295,900 $358,900
Years of Completed Private Sector Private Sector
USNUSAF Service Compensation Element USNUSAF (50th Percentile) (75th Percentile) 12
RMC/Base Salary $77,600 $230,500 $268,400 Incentive Pays $73,000
Total Cash $150,600 $230,500 $268,400
Total Benefits $42,900 $72,200 $88,700
Total Compensation $193,500 $302,700 $357,100
Years of Completed Private Sector Private Sector
USNUSAF Service Compensation Element USNUSAF (50th Percentile) (75th Percentile) 17
RMC/Base Salary $86,100 $234,200 $269,600 Incentive Pays $65,000
Total Cash $151,100 $234,200 $269,600
Total Benefits $47,400 $75,400 $85,700
Total Compensation $198,500 $309,600 $355,300
Army and Air Force compensation is RMC, special and incentive pays, and benefits as of 1 July 2000
Private Sector compensation is total salary (including base and incentives) and benefits as of 1 July 2000. At 7, 12 and 17 years of completed service, private sector compensation is for cardiology.
llayGrnup Page 2-4

I
Center for Naval Analyses Comparison of Total Compensation
$400,000
$350,000
$300,000
$250,000
$200,000
$150,000
$100,000
$50,000
$0
Cardiology (Invasive) Current Annual Compensation
LL s it) <( U) ..... ~ a. a. ;,t en en· ~
a. a.
LL s it) LL s it) <( U) ..... <( U) ..... ~ a. a. ~ a. a. ;,t (j) (j) ;,t ·(j) en ~
a. a. ~
a. a.
7 Yrs Completed 12 Yrs Completed 17 Yrs Completed
o Total Benefits
• Total Cash
HayGroup Page 2-5
Center for Naval Analyses Comparison of Total Compensation
Years of Completed
USA/USAF Servic 7
Years of Completed
USA/USAF Servic 12
Years of Completed
USA/USAF Servic 17
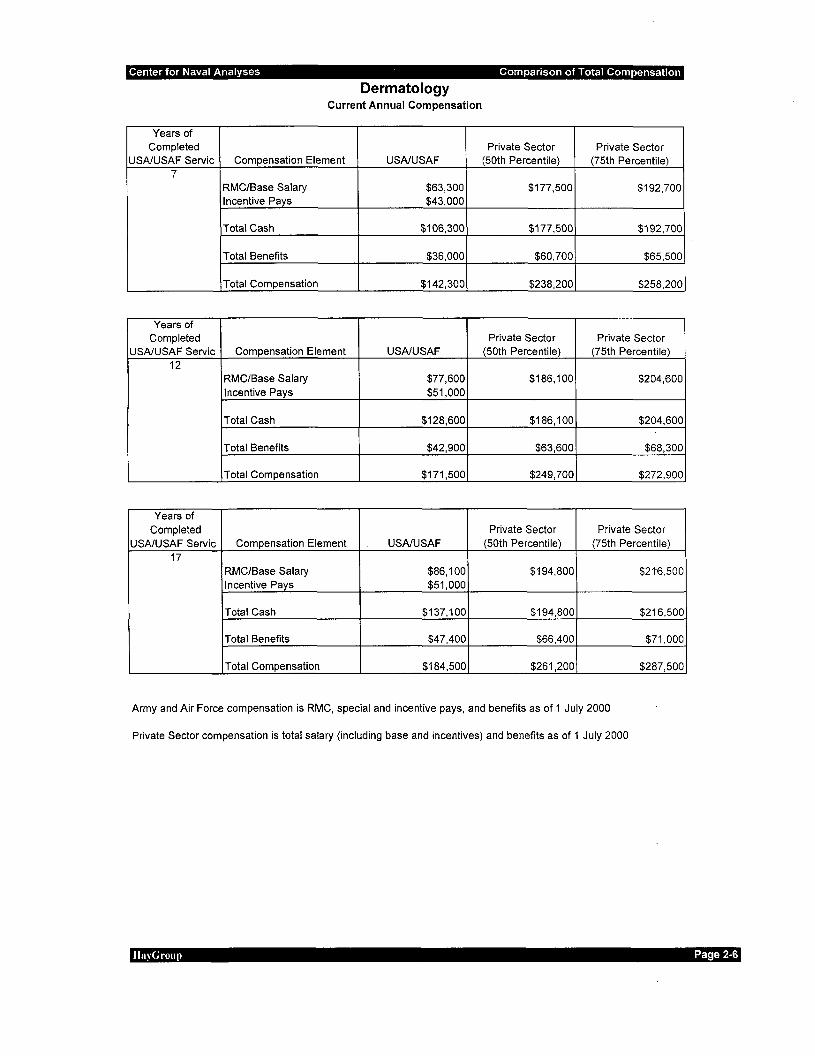
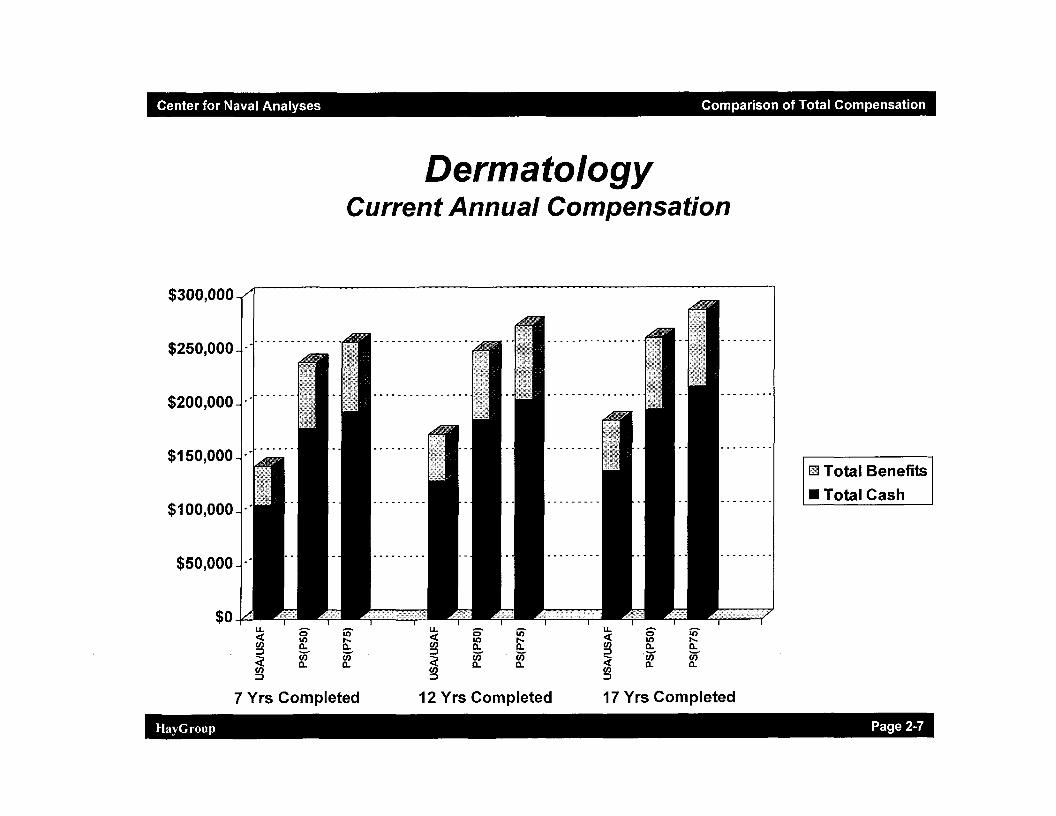
Dermatology Current Annual Compensation
Compensation Element USA/USAF
RMC/Base Salary $63,300 Incentive Pays $43,000
Total Cash $106,300
Total Benefits $36,000
Total Compensation $142,300
Compensation Element USA/USAF
RMC/Base Salary $77,600 Incentive Pays $51,000
Total Cash $128,600
Total Benefits $42,900
Total Compensation $171,500
Compensation Element USA/USAF
RMC/Base Salary $86,100 Incentive Pays $51,000
Total Cash $137,100
Total Benefits $47,400
Total Compensation $184,500
Private Sector Private Sector (50th Percentile) (75th Percentile)
$177,500 $192,700
$177,500 $192,700
$60,700 $65,500
$238,200 $258,200
Private Sector Private Sector (50th Percentile) (75th Percentile)
$186,100 $204,600
$186,100 $204,600
$63,600 $68,300
$249,700 $272,900
Private Sector Private Sector (50th Percentile) (75th Percentile)
$194,800 $21-6,500
$194,800 $216,500
$66,400 $71,000
$261,200 $287,500
Army and Air Force compensation is RMC, special and incentive pays, and benefits as of 1 July 2000
Private Sector compensation is total salary (including base and incentives) and benefits as of 1 July 2000
llayGroup Page 2-6
Center for Naval Analyses Comparison of Total Compensation
$300,000
$250,000
$200,000
$150,000
$100,000
$50,000
$0
Dermatology Current Annual Compensation
u. s ii) u. s ii) <( I()
""" <( I()
""" ~ a. a. ~ a. a. ~
Ci) ·;n
~ ·;n Ci)
~ a. a. a. a.
7 Yrs Completed 12 Yrs Completed 17 Yrs Completed
Dl Total Benefits
• Total Cash
1-layGroup Page 2-7

Center for Naval Analyses Comparison of Total Compensation
Years of Completed
USA/USAF Servic 7
Years of Completed
USA/USAF Servic 12
Years of Completed
USA/USAF Servic 17
Emergency Medicine Current Annual Compensation
Compensation Element USA/USAF
RMC/Base Salary $63,300 Incentive Pays $51,000
Total Cash $114,300
Total Benefits $36,000
Total Compensation $150,300
Compensation Element USA/USAF
RMC/Base Salary $77,600 Incentive Pays $59,000
Total Cash $136,600
Total Benefits $42,900
Total Compensation $179,500
Compensation Element USA/USAF
RMC/Base Salary $86,100 Incentive Pays $59,000
Total Cash $145,100
Total Benefits $47,400
Total Compensation $192,500
Private Sector Private Sector (50th Percentile) (75th Percentile)
$181,300 $196,600
$181,300 $196,600
$60,000 $63,400
$241,300 $260,000
Private Sector Private Sector (50th Percentile) (75th Percentile)
$189,300 $208,200
$189,300 $208,200
$62,800 $67,600
$252,100 $275,800
Private Sector Private Sector (50th Percentile) (75th Percentile)
$197,300 $219,700
$197,300 $219,700
$65,600 $71 ,BOO
$262,900 $291,500
Army and Air Force compensation is RMC, special and incentive pays, and benefits as of 1 July 2000
Private Sector compensation is total salary (including base and incentives) and benefits as of 1 July 2000
lla)Group Page 2-8

Center for Naval Analyses Comparison of Total Compensation
$300,000
$250,000
$200,000
$150,000
$100,000
$50,000
$0 0 10 a.. en a..
Emergency Medicine Current Annual Compensation
u.. 0 it) u.. s it) <( 10 ""'
<( ll) ""' ~ a.. a. ~ a. a.
~ en ;n· ~ Uf Uf
~ a.. a.
~ a. a.
7 Yrs Completed 12 Yrs Completed 17 Yrs Completed
D Total Benefits
• Total Cash
HayGroup Page 2-9

Center for Naval Analyses Comparison of Total Compensation
Years of Completed
USA/USAF Servic 7
Years of Completed
USA/USAF Servic 12
Years of Completed
USA/USAF Servic 17
Family Practice Current Annual Compensation
Compensation Element USA/USAF
RMC/Base Salary $63,300 Incentive Pays $56,000
Total Cash $119,300
Total Benefits $36,000
Total Compensation $155,300
Compensation Element USA/USAF
RMC/Base Salary $77,600 Incentive Pays $56,000
Total Cash $133,600
Total Benefits $42,900
Total Compensation $176,500
Compensation Element USA/USAF
RMC/Base Salary $86,100 Incentive Pays $56,000
Total Cash $142,100
Total Benefits $47,400
Total Compensation $189,500
Private Sector Private Sector (50th Percentile) (75th Percentile)
$133,000 $154,700
$133,000 $154,700
$45,200 $49,600
$178,200 $204,300
Private Sector Private Sector (50th Percentile) (75th Percentile)
$136,100 $160,700
$136,100 $160,700
$45,900 $51,200
$182,000 $211,900
Private Sector Private Sector (50th Percentile) (75th Percentile)
$139,100 $166,800
$139,100 $166,800
$46,600 $52,700
$185,700 $219,500
Army and Air Force compensation is RMC, special and incentive pays, and benefits as of 1 July 2000
Private Sector compensation is total salary (including base and incentives) and benefits as of 1 July 2000
lla~Group Page 2-10

Center for Naval Analyses Comparison of Total Compensation
$250,000
$200,000
$150,000
$100,000
$50,000
$0 u. s <( ., !B. c..
< en c.. !B
Family Practice Current Annual Compensation
it) u. s it) u. s it) ..... <( ., ..... <( ., ..... c.. !B c.. c.. !B c.. c.. en < ~ en < en ·en c.. c.. c.. c..
!B !B 7 Yrs Completed 12 Yrs Completed 17 Yrs Completed
Bl Total Benefits
• Total Cash
1-tayGroup Page 2-11

Center for Naval Analyses Comparison of Total Compensation
Years of Completed
USA/USAF Servic 7
Years of Completed
USA/USAF Servic 12
Years of Completed
USA/USAF Servic 17
Gastroenterology Current Annual Compensation
Compensation Element USA/USAF
RMC/Base Salary $63,300 Incentive Pays $52,000
Total Cash $115,300
Total Benefits $36,000
Total Compensation $151,300
Compensation Element USA/USAF
RMC/Base Salary $77,600 Incentive Pays $60,000
Total Cash $137,600
Total Benefits $42,900
Total Compensation $180,500
Compensation Element USA/USAF
RMC/Base Salary $86,100 Incentive Pays $52,000
Total Cash $138,100
Total Benefits $47,400
Total Compensation $185,500
Private Sector Private Sector (50th Percentile) (75th Percentile)
$190,100 $218,200
$190,100 $218,200
$59,100 $70,000
$249,200 $288,200
Private Sector Private Sector (50th Percentile) (75th Percentile)
$194,000 $221,600
$194,000 $221,600
$61,300 $72,400
$255,300 $294,000
Private Sector Private Secror (50th Percentile) (75th Percentile)
$197,900 $225,100
$197,900 $225,100
$63,600 $74,800
$261,500 $299,900
Army and Air Force compensation is RMC, special and incentive pays, and benefits as of 1 July 2000
Private Sector compensation is total salary (including base and incentives) and benefits as of 1 July 2000. At 7, 12 and 17 years of completed service, private sector compensation is for gastroenteroloy.
llayGroup Page 2-12

Center for Naval Analyses Comparison of Total Compensation
$300,000
$250,000
$200,000
$150,000
$100,000
$50,000
$0 0 G; ll) ,...
a. a. U) ·(ji a. a.
Gastroenterology Current Annual Compensation
u. 0 ill u. 0 iO <( ll) ,... <( ll) ,... ~ a. a.
~ a. a.
< (ji (ji (ji U) a. a. a. a.
~ ~
7 Yrs Completed 12 Yrs Completed 17 Yrs Completed
o Total Benefits
• Total Cash
HayGroup Page 2-13

Center for Naval Analyses Comparison of Total Compensation
Years of Completed
USA/USAF Servic 7
Years of Completed
USA/USAF Servic 12
Years of Completed
USA/USAF Servic 17
General Surgery Current Annual Compensation
Compensation Element USA/USAF
RMC/Base Salary $63,300 Incentive Pays $55,000
Total Cash $118,300
Total Benefits $36,000
Total Compensation $154,300
Compensation Element USA/USAF
RMC/Base Salary $77,600 Incentive Pays $69,000
Total Cash $146,600
Total Benefits $42,900
Total Compensation $189,500
Compensation Element USA/USAF
RMC/Base Salary $86,100 Incentive Pays $69,000
Total Cash $155,100
Total Benefits $47,400
Total Compensation $202,500
Private Sector Private Sector (50th Percentile) (75th Percentile)
$184,700 $222,800
$184,700 $222,800
$55,000 $68,600
$239,700 $291,400
Private Sector Private Sector (50th Percentile) (75th Percentile)
$198,900 $236,400
$198,900 $236,400
$59,200 $72,100
$258,100 $308,500
Private Sector Private Sector (50th Percentile) (75th Percentile)
$213,000 $249,900
$213,000 $249,900
$63,400 $75,700
$276,400 $325,600
Army and Air Force compensation is RMC, special and incentive pays, and benefits as of 1 July 2000
Private Sector compensation is total salary (including base and incentives) and benefits as of 1 July 2000
lla~Group Page 2-14

Center for Naval Analyses Comparison of Total Compensation
$350,000
$300,000
$250,000
$200,000
$150,000
$100,000
$50,000
$0 u.. 0 < It)
~ 0-
<( ii)
~ 0-
General Surgery Current Annual Compensation
iii "" 0-
•(;) ll..
u.. s iii u.. 0 iii < ll) "" < ll) "" ~ ll. ll.. ~. ll. ll..
~ ~ ii) <( en en ll.
~ ll.. ll.
7 Yrs Completed 12 Yrs Completed 17 Yrs Completed
D Total Benefits
• Total Cash
1-IayGroup Page 2-15
Center for Naval Analyses Comparison of Total Compensation
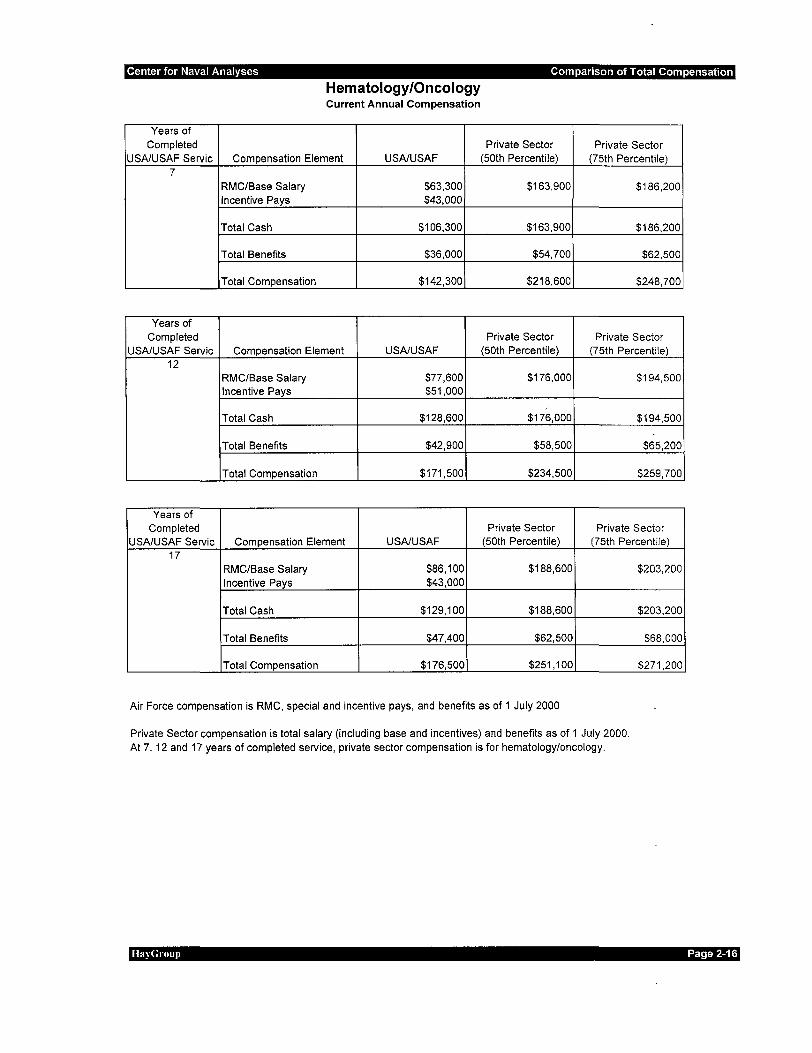
Hematology/Oncology Current Annual Compensation
Years of Completed Private Sector Private Sector
USA/USAF Servic Compensation Element USA/USAF (50th Percentile) (75th Percentile) 7
RMC/Base Salary $63,300 $163,900 $186,200 Incentive Pays $43,000
Total Cash $106,300 $163,900 $186,200
Total Benefits $36,000 $54,700 $62,500
Total Compensation $142,300 $218,600 $248,700
Years of Completed Private Sector Private Sector
USA/USAF Servic Compensation Element USA/USAF (50th Percentile) (75th Percentile) 12
RMC/Base Salary $77,600 $176,000 $194,500 Incentive Pays $51,000
Total Cash $128,600 $176,000 $194,500
Total Benefits $42,900 $58,500 $65,200
Total Compensation $171,500 $234,500 $259,700
Years of Completed Private Sector Private Sector
USA/USAF Servic Compensation Element USA/USAF (50th Percentile) (75th Percentile) 17
RMC/Base Salary $86,100 $188,600 $203,200 Incentive Pays $43,000
Total Cash $129,100 $188,600 $203,200
Total Benefits $47,400 $62,500 $68,000
Total Compensation $176,500 $251,100 $271,200
Air Force compensation is RMC, special and incentive pays, and benefits as of 1 July 2000
Private Sector compensation is total salary (including base and incentives) and benefits as of 1 July 2000. At 7, 12 and 17 years of completed service, private sector compensation is for hematology/oncology.
lla)Gruup Page 2-16

Center for Naval Analyses Comparison of Total Compensation
$300,000
$250,000
$200,000
$150,000
$100,000
$50,000
$0
Hematology/Oncology Current Annual Compensation
0 U)
0.. iii 0..
u.. 0 it) u.. 0 it) <1: U) t-- <1: U) ..... ~. c. 0.. ~ 0.. 0..
< ~ U) < U) U)
~ 0..
~ 0.. 0..
7 Yrs Completed 12 Yrs Completed 17 Yrs Completed
El Total Benefits
• Total Cash
1-IayGroup Page 2-17

Center for Naval Analyses Comparison of Total Compensation
Years of Completed
USNUSAF Servic 7
Years of Completed
USNUSAF Servic 12
Years of Completed
USNUSAF Servic 17
Internal Medicine Current Annual Compensation
Compensation Element USNUSAF
RMC/Base Salary $63,300 Incentive Pays $50,000
Total Cash $113,300
Total Benefits $36,000
Total Compensation $149,300
Compensation Element USNUSAF
RMC/Base Salary $77,600 Incentive Pays $50,000
Total Cash $127,600
Total Benefits $42,900
Total Compensation $170,500
Compensation Element USNUSAF
RMC/Base Salary $86,100 Incentive Pays $50,000
Total Cash $136,100
Total Benefits $47,400
Total Compensation $183,500
Private Sector Private Sector (50th Percentile) (75th Percentile)
$143,400 $156,700
$143,400 $156,700
$47,900 $50,800
$191,300 $207,500
Private Sector Private Sector (50th Percentile) (75th Percentile)
$151,200 $167,300
$151,200 $167,300
$50,000 $54,600
$201,200 $221,900
Private Sector Private Sector (50th Percentile) (75th Percentile)
$159,000 $177,800
$159,000 $177,800
$52,100 $58,500
$211,100 $236,300
Army and Air Force compensation is RMC, special and incentive pays, and benefits as of 1 July 2000
Private Sector compensation is total salary (including base and incentives) and benefits as of 1 July 2000
lla~Group Page 2-18

Center for Naval Analyses Comparison of Total Compensation
$250,000
$200,000
$150,000
$100,000
$50,000
Internal Medicine Current Annual Compensation
D Total Benefits
• Total Cash
HayGroup Page 2-19

Center for Naval Analyses Comparison of Total Compensation
Years of Completed
USA/USAF Servic 7
Years of Completed
USA/USAF Servic 12
Years of Completed
USA/USAF Servic 17
Neurology Current Annual Compensation
Compensation Element USA/USAF
RMC/Base Salary $63,300 Incentive Pays $42,000
Total Cash $105,300
Total Benefits $36,000
Total Compensation $141,300
Compensation Element USA/USAF
RMC/Base Salary $77,600 Incentive Pays $50,000
Total Cash $127,600
Total Benefits $42,900
Total Compensation $170,500
Compensation Element USA/USAF
RMC/Base Salary $86,100 Incentive Pays $50,000
Total Cash $136,100
Total Benefits $47,400
Total Compensation $183,500
Private Sector Private Sector (50th Percentile) (75th Percentile)
$160,200 $178,400
$160,200 $178,400
$54,700 $63,000
$214,900 $241,400
Private Sector Private Sector (50th Percentile) (75th Percentile)
$166,800 $185,100
$166,800 $185,100
$56,300 $64,400
$223,100 $249,500
Private Sector Private Sector (50th Percentile) (75th Percentile)
$173,400 $191,800
$173,400 $191,800
$57,900 $65,700
$231,300 $257,500
Army and Air Force compensation is RMC, special and incentive pays, and benefits as of 1 July 2000
Private Sector compensation is total salary (including base and incentives) and benefits as of 1 July 2000
lin~ Group Page 2-20

Center for Naval Analyses Comparison of Total Compensation
$300,000
$250,000
$200,000
$150,000
$100,000
$50,000
$0 0 ll)
c.. u; c..
Neurology Current Annual Compensation
u.. 0 Iii u.. 0 Iii <1: ll) ...... ~ ll) ...... ~ c.. c.. c.. c..
< u; u;· < u; u;
~ c.. c..
~ c.. c..
7 Yrs Completed 12 Yrs Completed 17 Yrs Completed
o Total Benefits
• Total Cash
l-layGroup Page 2-21

Center for Naval Analyses Comparison of Total Compensation
Years of Completed
Army Service 7
Years of Completed
Army Service 12
Years of Completed
Army Service 17
Neurosurgery (Army) Current Annual Compensation
Compensation Element Army
RMC/Base Salary $63,300 Incentive Pays $62,500
Total Cash $125,800
Total Benefits $36,000
Total Compensation $161,800
Compensation Element Army
RMC/Base Salary $77,600 Incentive Pays $74,000
Total Cash $151,600
Total Benefits $42,900
Total Compensation $194,500
Compensation Element Army
RMC/Base Salary $86,100 Incentive Pays $65,000
Total Cash $151,100
Total Benefits $47,400
Total Compensation $198,500
Private Sector (50th Percentile)
$342,500
$342,500
$95,700
$438,200
Private Sector (50th Percentile)
$334,500
$334,500
$96,500
$431,000
Private Sector (50th Percentile)
$326,600
$326,600
$97,300
$423,900
Army compensation is RMC, special and incentive pays, and benefits as of 1 July 2000
Private Sector (75th Percentile)
Insufficient Data
Private Sector (75th Percentile)
Insufficient Data
Private Sector (75th Percentile)
Insufficient Data
Private Sector compensation is total salary (including base and incentives) and benefits as of 1 July 2000
Private Sector base compensation increases by years of practice in the specialty. However, incentive pays decrease by years of practice so that total cash compensation (base plus incentives) declines by years of practice.
Insufficient data to display comparisons for Private Sector 75th percentile
lla~Group Page 2-22

Center for Naval Analyses Comparison of Total Compensation
$450,000
$400,000
$350,000
$300,000
$250,000
$200,000
$150,000
$100,000
$50,000
$0
Neurosurgery- Army Current Annual Compensation
Army PS(P50) PS(P75) Army PS(P50) PS(P75)
7 Yrs Completed 12 Yrs Completed
D Total Benefits ······-·- .... ----
.Total Cash
Insufficient Data to ---------------- · Determine the 75th
Percentile
Army PS(P50) PS(P75)
17 Yrs Completed
HayGroup Page 2-23
Center for Naval Analyses Comparison of Total Compensation
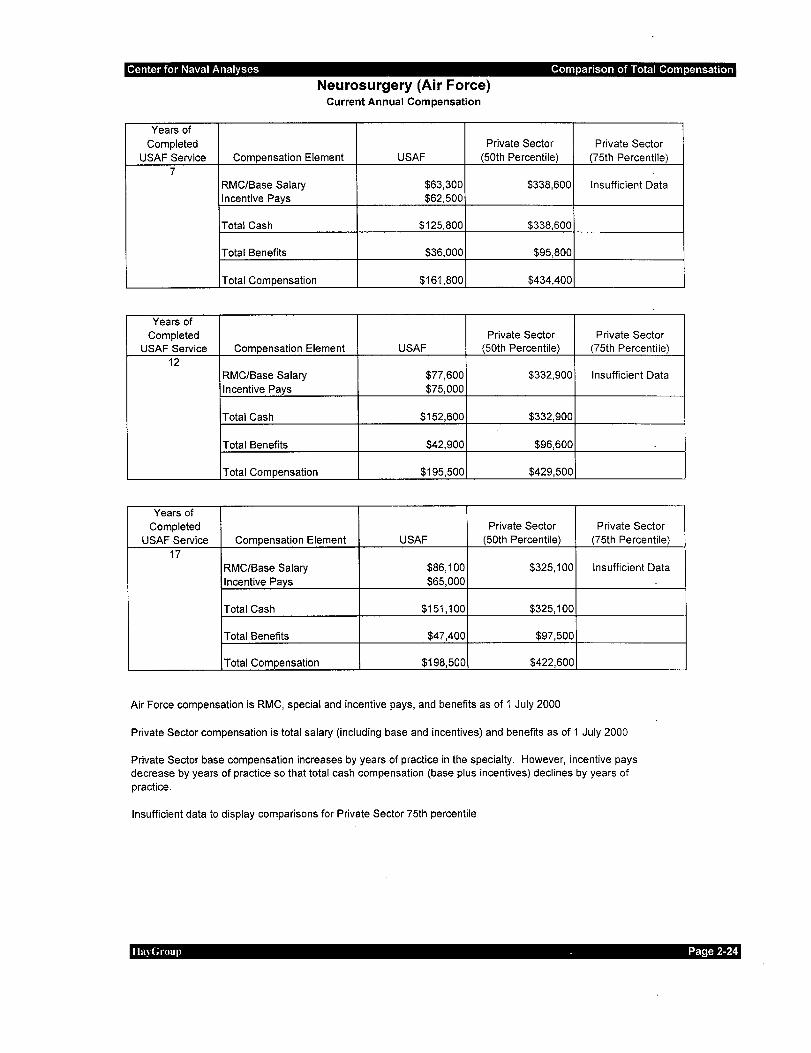
Years of Completed
USAF Service 7
Years of Completed
USAF Service 12
Years of Completed
USAF Service 17
Neurosurgery (Air Force) Current Annual Compensation
Private Sector Compensation Element USAF (50th Percentile)
RMC/Base Salary $63,300 $338,600 Incentive Pays $62,500
Total Cash $125,800 $338,600
Total Benefits $36,000 $95,800
Total Compensation $161,800 $434,400
Private Sector Compensation Element USAF (50th Percentile)
RMC/Base Salary $77,600 $332,900 Incentive Pays $75,000
Total Cash $152,600 $332,900
Total Benefits $42,900 $96,600
Total Compensation $195,500 $429,500
Private Sector Compensation Element USAF (50th Percentile)
RMC/Base Salary $86,100 $325,100 Incentive Pays $65,000
Total Cash $151,100 $325,100
Total Benefits $47,400 $97,500
Total Compensation $198,500 $422,600
Air Force compensation is RMC, special and incentive pays, and benefits as of 1 July 2000
Private Sector (75th Percentile)
Insufficient Data
Private Sector (75th Percentile)
Insufficient Data
Private Sector (75th Percentile)
Insufficient Data
Private Sector compensation is total salary (including base and incentives) and benefits as of 1 July 2000
Private Sector base compensation increases by years of practice in the specialty. However, incentive pays decrease by years of practice so that total cash compensation (base plus incentives) declines by years of practice.
Insufficient data to display comparisons for Private Sector 75th percentile
lla~Group . Page 2-24

Center for Naval Analyses Comparison of Total Compensation
$450,000
$400,000
$350,000
$300,000
$250,000
$200,000
$150,000
$100,000
$50,000
$0
Neurosurgery- Air Force Current Annual Compensation
Air · PS(P50) PS(P75) Force
7 Yrs Completed
Air PS(P50) PS(P75)
Force
12 Yrs Completed
-----------------
Air PS(P50) PS(P75) Force
17 Yrs Completed
D Total Benefits
• Total Cash
Insufficient Data to Determine the 75th
Percentile
HayGroup Page 2-25
Center for Naval Analyses Comparison of Total Compensation
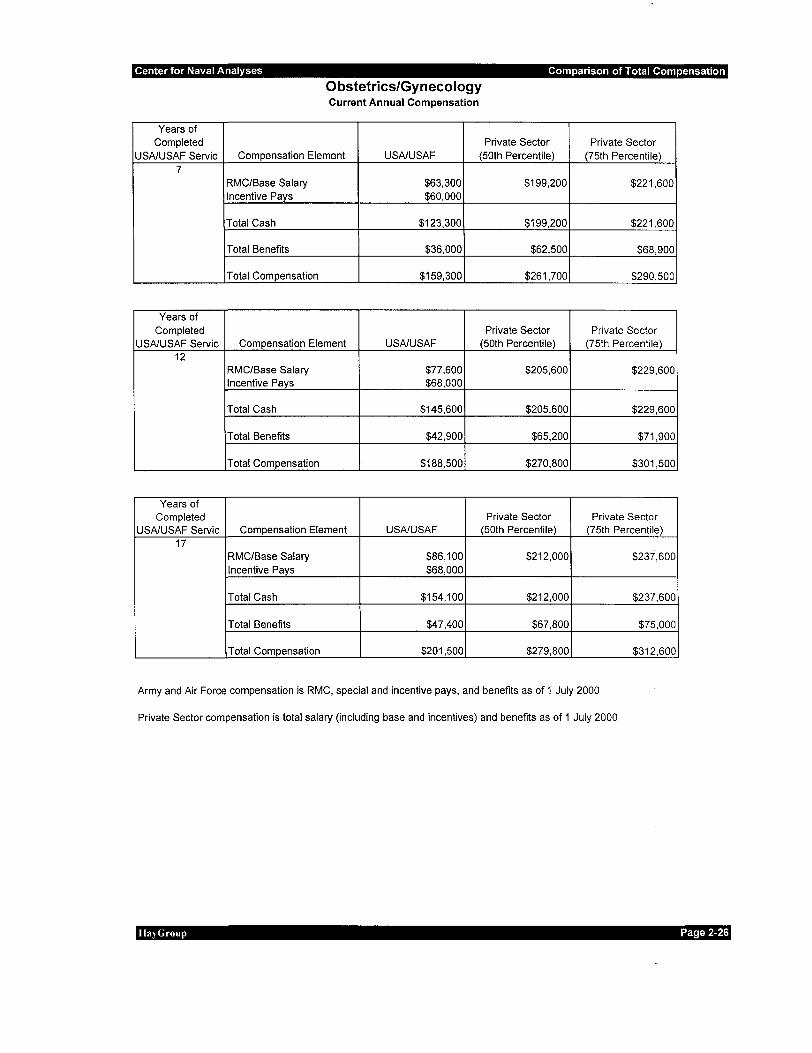
Years of Completed
USA/USAF Servic 7
Years of Completed
USA/USAF Servic 12
Years of Completed
USA/USAF Servic 17
0 bstetrics/Gynecology Current Annual Compensation
Private Sector Compensation Element USA/USAF (50th Percentile)
RMC/Base Salary $63,300 $199,200 Incentive Pays $60,000
Total Cash $123,300 $199,200
Total Benefits $36,000 $62,500
Total Compensation $159,300 $261,700
Private Sector Compensation Element USA/USAF (50th Percentile)
RMC/Base Salary $77,600 $205,600 Incentive Pays $68,000
Total Cash $145,600 $205,600
Total Benefits $42,900 $65,200
Total Compensation $188,500 $270,800
Private Sector Compensation Element USA/USAF (50th Percentile)
RMC/Base Salary $86,100 $212,000 Incentive Pays $68,000
Total Cash $154,100 $212,000
Total Benefits $47,400 $67,800
Total Compensation $201,500 $279,800
Private Sector (75th Percentile)
$221,600
$221,600
$68,900
$290,500
Private Sector (75th Percentile)
$229,600
$229,600
$71,900
$301,500
Private Sector (75th Percentile)
$231,600
$237,600
$75,000
$312,600
Army and Air Force compensation is RMC, special and incentive pays, and benefits as of 1 July 2000
Private Sector compensation is total salary (including base and incentives) and benefits as of 1 July 2000
lla~·Group Page 2-26

Center for Naval Analyses Comparison of Total Compensation
$350,000
$300,000
$250,000
$200,000
$150,000
$100,000
$50,000
$0
Obstetrics/Gynecology Current Annual Compensation
u.. 0 u;-<(
"' ..... 3 c.. c..
~ iJ) en c.. 0..
u.. 0 u;- u.. 0 u;-<(
~ ..... <(
"' ..... 3. 0.. 3 c.. 0..
< en en < en en 3
c.. c.. 3
c.. c..
7 Yrs Completed 12 Yrs Completed 17 Yrs Completed
El Total Benefits
• Total Cash
1-JayGroup Page 2-27

Center for Naval Analyses Comparison of Total Compensation
Years of Completed
USNUSAF Servic 7
Years of Completed
USNUSAF Servic 12
Years of Completed
USNUSAF Servic 17
Industrial/Occupational Medicine Current Annual Compensation
Private Sector Compensation Element USNUSAF (50th Percentile)
RMC/Base Salary $63,300 $152,000 Incentive Pays $50,000
Total Cash $113,300 $152,000
Total Benefits $36,000 $50,400
Total Compensation $149,300 $202,400
Private Sector Compensation Element USNUSAF (50th Percentile)
RMC/Base Salary $77,600 $152,600 Incentive Pays $50,000
Total Cash $127,600 $152,600
Total Benefits $42,900 $51,600
Total Compensation $170,500 $204,200
Private Sector Compensation Element USNUSAF (50th Percentile)
RMC/Base Salary $86,100 $153,100 Incentive Pays $50,000
Total Cash $136,100 $153,100
Total Benefits $47,400 $52,800
Total Compensation $183,500 $205,900
Private Sector (75th Percentile)
$165,500
$165,500
$54,300
$219,800
Private Sector (75th Percentile)
$168,800
$168,800
$55,400
$224,200
Private Sector (75th Percentile)
$172,100
$172,100
$56,500
$228,600
Army and Air Force compensation is RMC, special and incentive pays, and benefits as of 1 July 2000
Private Sector compensation is total salary (including base and incentives) and benefits as of 1 July 2000
II a~ (;roup Page 2-28

$250,000
$200,000
$150,000
$100,000
$50,000
$0
Industrial/Occupational Medicine Current Annual Compensation
LL s it) LL s it) <1: It) .... <1: It) .... ~ c.. c.. ~ c.. c..
~ ;;; Ui
~ ;;; ;;;·
c.. c.. c.. c..
7 Yrs Completed 12 Yrs Completed
LL s it) <1: It) .... ~ c.. c..
~ ;;; ;;; c.. c..
17 Yrs Completed
o Total Benefits
• Total Cash
HayGroup Page 2-29
Center for Naval Analyses Comparison of Total Compensation
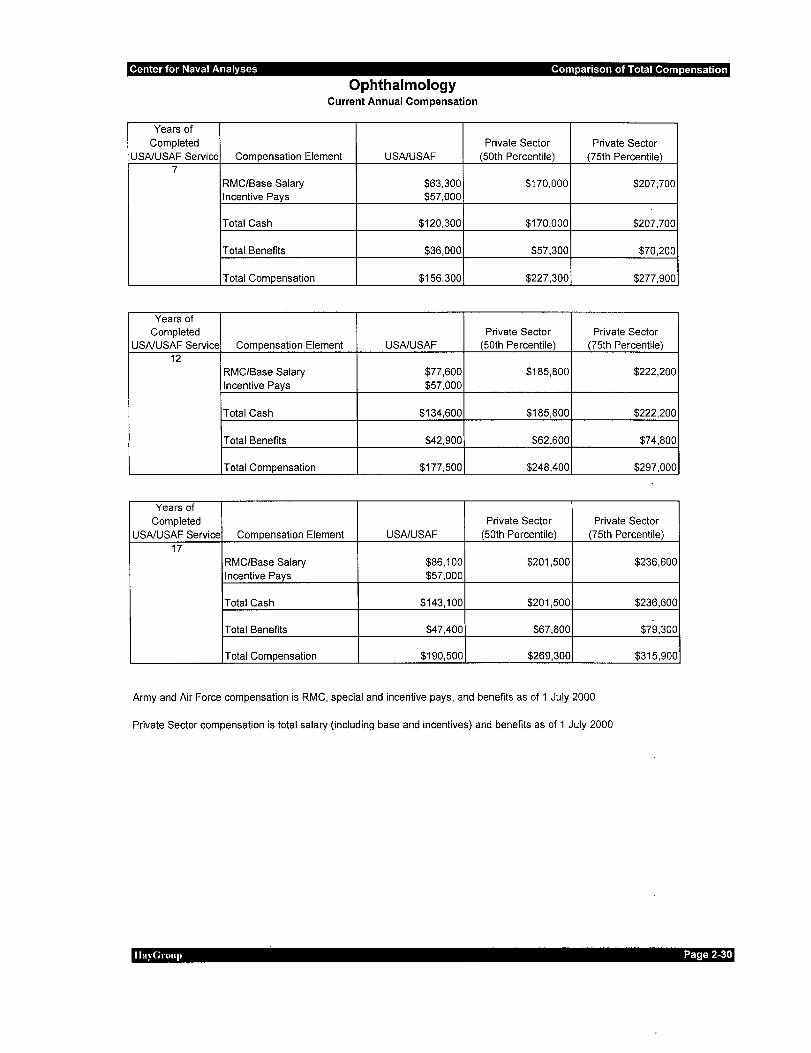
Ophthalmology Current Annual Compensation
Years of Completed Private Sector Private Sector
USNUSAF Service Compensation Element USNUSAF (50th Percentile) (75th Percentile) 7
RMC/Base Salary $63,300 $170,000 $207,700 Incentive Pays $57,000
Total Cash $120,300 $170,000 $207,700
Total Benefits $36,000 $57,300 $70,200
Total Compensation $156,300 $227,300 $277,900
Years of Completed Private Sector Private Sector
USNUSAF Service Compensation Element USN USAF (50th Percentile) (75th PercenWe) 12
RMC/Base Salary $77,600 $185,800 $222,200 Incentive Pays $57,000
Total Cash $134,600 $185,800 $222,200
Total Benefits $42,900 $62,600 $74,800
Total Compensation $177,500 $248,400 $297,000
Years of Completed Private Sector Private Sector
USNUSAF Service Compensation Element USNUSAF (50th Percentile) (75th Percentile) 17
RMC/Base Salary $86,100 $201,500 $236,600 Incentive Pays $57,000
Total Cash $143,100 $201,500 $236,600
Total Benefits $47,400 $67,800 $79,300
Total Compensation $190,500 $269,300 $315,900
Army and Air Force compensation is RMC, special and incentive pays, and benefits as of 1 July 2000
Private Sector compensation is total salary (including base and incentives) and benefits as of 1 July 2000
llayGroup Page 2-30

Center for Naval Analyses Comparison of Total Compensation
$350,000
$300,000
$250,000
$200,000
$150,000
$100,000
$50,000
$0
Ophthalmology Current Annual Compensation
u.. s it)
~ It) ..... a.. a..
<( ;;; en C/)
a.. a.. ::J
u.. s it) u.. s it) <( It) ..... <( It) ..... ~. a.. a.. ~ a.. a..
~ en en
~ en en
a.. a.. a.. a..
7 Yrs Completed 12 Yrs Completed 17 Yrs Completed
rEI Total Benefits
• Total Cash
liayGroup Page 2-31

Center for Naval Analyses Comparison of Total Compensation
Years of Completed
USA/USAF Servic 7
Years of Completed
USA/USAF Servic 12
Years of Completed
USA/USAF Servic 17
Orthopedic Surgery Current Annual Compensation
Compensation Element USA/USAF
RMC/Base Salary $63,300 Incentive Pays $65,000
Total Cash $128,300
Total Benefits $36,000
Total Compensation $164,300
Compensation Element USA/USAF
RMC/Base Salary $77,600 Incentive Pays $79,000
Total Cash $156,600
Total Benefits $42,900
Total Compensation $199,500
Compensation Element USA/USAF
RMC/Base Salary $86,100 Incentive Pays $79,000
Total Cash $165,100
Total Benefits $47,400
Total Compensation $212,500
Private Sector Private Sector (50th Percentile) (75th Percentile)
$237,600 $274,100
$237,600 $274,100
$76,900 $86,000
$314,500 $360,100
Private Sector Private Sector (50th Percentile) (75th Percentile)
$249,300 $282,600
$249,300 $282,600
$80,900 $88,500
$330,200 $371,100
Private Sector Private Sector (50th Percentile) (75th Percentile)
$261,000 $291 '100
$261,000 $291 '100
$84,900 $91 '100
$345,900 $382,200
Army and Air Force compensation is RMC, special and incentive pays, and benefits as of 1 July 2000
Private Sector compensation is total salary (including base and incentives) and benefits as of 1 July 2000
lla~Group Page 2-32

Center for Naval Analyses Comparison of Total Compensation
$400,000
$350,000
$300,000
$250,000
$200,000
$150,000
$100,000
$50,000
$0
Orthopedic Surgery Current Annual Compensation
u.. 0 10
~ ll) ..... a. c..
<( en en ~
a. c..
u.. 0 10 u.. 0 10 <( ll) ..... <( ll) ..... ~ a. c.. ~ a. c..
~ en en·
~ en en c.. c.. c.. c..
7 Yrs Completed 12 Yrs Completed 17 Yrs Completed
D Total Benefits
• Total Cash
l-layGroup Page 2-33

Center for Naval Analyses Comparison of Total Compensation
Otolaryngology (Army) Current Annual Compensation
Years of Completed Private Sector Private Sector
Army Service Compensation Element Army (50th Percentile) (75th Percentile) 7
RMC/Base Salary $63,300 $240,000 $243,300 Incentive Pays $56,500
Total Cash $119,800 $240,000 $243,300
Total Benefits $36,000 $72,300 $83,000
Total Compensation $155,800 $312,300 $326,300
Years of Completed Private Sector Private Sector
Army Service Compensation Element Army (50th Percentile) (75th Percentile) 12
RMC/Base Salary $77,600 $235,000 $256,600 Incentive Pays $67,000
Total Cash $144,600 $235,000 $256,600
Total Benefits $42,900 $72,300 $87,300
Total Compensation $187,500 $307,300 $343,900
Years of Completed Private Sector Private Sector
Army Service Compensation Element Army (50th Percentile) (75th Percentile) 17
RMC/Base Salary $86,100 $230,200 $270,200 Incentive Pays $59,000
Total Cash $145,100 $230,200 $270,200
Total Benefits $47,400 $72,400 $91,800
Total Compensation $192,500 $302,600 $362,000
Army compensation is RMC, special and incentive pays, and benefits as of 1 July 2000
Private Sector compensation is total salary (including base and incentives) and benefits as of 1 July 2000
lla~Group Page 2-34

Center for Naval Analyses Comparison of Total Compensation
$400,000
$350,000
$300,000
$250,000
$200,000
$150,000
$100,000
$50,000
$0
Otolaryngology -Army Current Annual Compensation
Army PS(P50) PS(P75) Army PS(P50) PS(P75) Army PS(P50) PS(P75)
7 Yrs Completed 12 Yrs Completed 17 Yrs Completed
D Total Benefits
• Total Cash
HayGroup Page 2-35

Center for Naval Analyses Comparison of Total Compensation
Years of Completed
USAF Service 7
Years of Completed
USAF Service 12
Years of Completed
USAF Service 17
Otolaryngology (Air Force) Current Annual Compensation
Private Sector Compensation Element USAF (50th Percentile)
RMC/Base Salary $63,300 $238,900 Incentive Pays $59,000
Total Cash $122,300 $238,900
Total Benefits $36,000 $72,300
Total Compensation $158,300 $311,200
Private Sector Compensation Element USAF (50th Percentile)
RMC/Base Salary $77,600 $234,100 Incentive Pays $67,000
Total Cash $144,600 $234,100
Total Benefits $42,900 $72,300
Total Compensation $187,500 $306,400
Private Sector Compensation Element USAF (50th Percentile)
RMC/Base Salary $86,100 $229,200 Incentive Pays $59,000
Total Cash $145,100 $229,200
Total Benefits $47,400 $72,400
Total Compensation $192,500 $301,600
Air Force compensation is RMC, special and incentive pays, and benefits as of 1 July 2000
Private Sector (75th Percentile)
$245,700
$245,700
$83,700
$329,400
Private Sector (75th Percentile)
$259,300
$259,300
$88,200
$347,500
Private Sector (75th Percentile)
$273,000
$273,000
$92,600
$365,600
Private Sector compensation is total salary (including base and incentives) and benefits as of 1 July 2000
llayGnmp Page 2-36

Center for Naval Analyses Comparison of Total Compensation
$400,000
$350,000
$300,000
$250,000
$200,000
$150,000
$100,000
$50,000
$0
Otolaryngology - Air Force Current Annual Compensation
Air .PS(PSO) PS(P75) · Air PS(PSO) PS(P75)· Air PS(PSO)· PS(P75)
Force Force Force
7 Yrs Completed 12 Yrs Completed 17 Yrs Completed
D Total Benefits
• Total Cash
l-layGroup Page 2-37

Center for Naval Analyses Comparison of Total Compensation
Pathology Current Annual Compensation
Years of Completed Private Sector Private Sector
USA/USAF Servic Compensation Element USA/USAF (50th Percentile) (75th Percentile) 7
RMC/Base Salary $63,300 $163,300 $21-8,200 Incentive Pays $45,000
Total Cash $108,300 $163,300 $218,200
Total Benefits $36,000 $56,400 $74,200
Total Compensation $144,300 $219,700 $292,400
Years of Completed Private Sector Private Sector
USA/USAF Servic Compensation Element USA/USAF (50th Percentile) (75th Percentile) 12
RMC/Base Salary $77,600 $173,700 $221,200 Incentive Pays $53,000
Total Cash $130,600 $173,700 $221,200
Total Benefits $42,900 $59,700 $75,700
Total Compensation $173,500 $233,400 $296,900
Years of Completed Private Sector Private Sector
USA/USAF Servic Compensation Element USA/USAF (5oth Percentile) (75th Percentile) 17
RMC/Base Salary $86,100 $184,000 $224,100 Incentive Pays $45,000
Total Cash $131,100 $184,000 $224,100
Total Benefits $47,400 $62,900 $77,300
Total Compensation $178,500 $246,900 $301,400
Army and Air Force compensation is RMC, special and incentive pays, and benefits as of 1 July 2000
Private Sector compensation is total salary (including base and incentives) and benefits as of 1 July 2000
lilt) Group Page 2-38

Center for Naval Analyses Comparison of Total Compensation
$350,000
$300,000
$250,000
$200,000
$150,000
$100,000
$50,000
$0
Pathology Current Annual Compensation
u.. s il) ~ It) ""' ~ a. a. <( ;n· ii)
~ a. a.
u.. s il) u.. s il) ~ It) ""'
~ It) ""' ~ a. a. ~ a. a. <( ii) ii) <( ii) ii)
~ a. a.
~ a. a.
7 Yrs Completed 12 Yrs Completed 17 Yrs Completed
D Total Benefits
• Total Cash
HayGroup Page 2-39

Center for Naval Analyses Comparison of Total Compensation
Pediatric Primary Care Current Annual Compensation
Years of Completed Private Sector Private Sector
USA/USAF Servic Compensation Element USA/USAF (50th Percentile) (75th Percentile) 7
RMC/Base Salary $63,300 $133,500 $144,600 Incentive Pays $48,000
Total Cash $111,300 $133,500 $144,600
Total Benefits $36,000 $45,100 $48,500
Total Compensation $147,300 $178,600 $193,100
Years of Completed Private Sector Private Sector
USA/USAF Servic Compensation Element USA/USAF (50th Percentile) (75th Percentile) 12
RMC/Base Salary $77,600 $140,600 $159,200 Incentive Pays $48,000
Total Cash $125,600 $140,600 $159,200
Total Benefits $42,900 $46,500 $53,000
Total Compensation $168,500 $187,100 $212,200
Years of Completed Private Sector Private Sector
USA/USAF Servic Compensation Element USA/USAF (50th Percentile) (75th Percentile) 17
RMC/Base Salary $86,100 $147,700 $173,700 Incentive Pays $48,000
Total Cash $134,100 $147,700 $173,700
Total Benefits $47,400 $47,900 $~7,600
Total Compensation $181,500 $195,600 $231,300
Army and Air Force compensation is RMC, special and incentive pays, and benefits as of 1 July 2000
Private Sector compensation is total salary (including base and incentives) and benefits as of 1 July 2000
llayGroup Page 2-40

Center for Naval Analyses Comparison of Total Compensation
$250,000
$200,000
$150,000
$100,000
$50,000
$0 u.. s <1: ll)
~ c.. en <( ~
c..
Pediatric Primary Care Current Annual Compensation
iD u.. 0 iD u.. 0 Li) .... <1: ll) .... <1: ll) .... c.. ~ c.. c.. ~ c.. c.. en en Ui
._ en <( <( (/) c..
~ c.. c..
~ c.. c..
7 Yrs Completed 12 Yrs Completed 17 Yrs Completed
o Total Benefits
• Total Cash
1-tayGroup Page 2-41

Center for Naval Analyses Comparison of Total Compensation
Physical Medicine & Rehabilitation Current Annual Compensation
Years of Completed Private Sector Private Sector
USA/USAF Servic Compensation Element USA/USAF (50th Percentile) (75th Percentile) 7
RMC/Base Salary $63,300 $153,600 $173,400 Incentive Pays $40,000
Total Cash $103,300 $153,600 $173,400
Total Benefits $36,000 $51,500 $60,100
Total Compensation $139,300 $205,100 $233,500
Years of Completed Private Sector Private Sector
USA/USAF Servic Compensation Element USA/USAF (50th Percentile) (75th Percentile) 12
RMC/Base Salary $77,600 $155,200 $181,600 Incentive Pays $50,000
Total Cash $127,600 $155,200 $181,600
Total Benefits $42,900 $52,100 $61,500
Total Compensation $170,500 $207,300 $243,100
Years of Completed Private Sector Private Sector
USA/USAF Servic Compensation Element USA/USAF (50th Percentile) (75th Percentile) 17
RMC/Base Salary $86,100 $156,700 $189,700 Incentive Pays $50,000
Total Cash $136,100 $156,700 $189,700
Total Benefits $47,400 $52,800 $62,900
Total Compensation $183,500 $209,500 $252,600
Army and Air Force compensation is RMC, special and incentive pays, and benefits as of 1 July 2000
Private Sector compensation is total salary (including base and incentives) and benefits as of 1 July 2000
lla}Group Page 2-42

Center for Naval Analyses Comparison of Total Compensation
Physical Medicine & Rehabilitation
$300,000
$250,000
$200,000
$150,000
$100,000
$50,000
$0
Current Annual Compensation
0 ll) a.. in a..
7 Yrs Completed
1.1.. s li) <1: 10 ..... ~ a.. a.. ~ in '(if
~ a.. a..
12 Yrs Completed
1.1.. s u;-<1: ll) ..... ~ a.. a.. ~ 'in in ~
a.. a..
17 Yrs Completed
Dl Total Benefits
• Total Cash
1-JayGroup Page 2-43

Center for Naval Analyses Comparison of Total Compensation
Years of Completed
USA/USAF Servic 7
Years of Completed
USA/USAF Servic 12
Years of Completed
USA/USAF Servic 17
Plastic & Reconstructive Surgery Current Annual Compensation
Private Sector Compensation Element USA/USAF (50th Percentile)
RMC/Base Salary $63,300 $209,700 Incentive Pays $65,000
Total Cash $128,300 $209,700
Total Benefits $36,000 $65,400
Total Compensation $164,300 $275,100
Private Sector Compensation Element USA/USAF (50th Percentile)
RMC/Base Salary $77,600 $224,300 Incentive Pays $73,000
Total Cash $150,600 $224,300
Total Benefits $42,900 $70,800
Total Compensation $193,500 $295,100
Private Sector Compensation Element USA/USAF (50th Percentile)
RMC/Base Salary $86,100 $239,600 Incentive Pays $65,000
Total Cash $151,100 $239,600
Total Benefits $47,400 $76,500
Total Compensation $198,500 $316,100
Private Sector (75th Percentile)
$301,000
$301,000
$104,100
$405,100
Private Sector (75th Percentile)
$309,200
$309,200
$104,300
$413,500
Private Sector (75th Percentile)
$317,600
$317,600
$104,400
$422,000
Army and Air Force compensation is RMC, special and incentive pays, and benefits as of 1 July 2000
Private Sector compensation is total salary (including base and incentives) and benefits as of 1 July 2000
At 7 years of completed service, private sector compensation is for general surgery. At 12 and 17 years of completed service, private sector compensation is for plastic and reconstructive surgery.
llayGroup Page 2-44

Center for Naval Analyses Comparison of Total Compensation
$450,000
$400,000
$350,000
$300,000
$250,000
$200,000
$150,000
$100,000
$50,000
$0
Plastic & Reconstructive Surgery Current Annual Compensation
u. s iO <( ll) "" ~ D.. D..
~ ·u; (f)
~ D.. D..
u. s iO <( ll) "" .~ D.. D..
~ (f) (f) D.. D..
7 Yrs Completed 12 Yrs Completed
u. s iO <( ll) "" ~ ll. D..
~ Iii (f) D.. D..
17 Yrs Completed
D Total Benefits
• Total Cash
1-layGroup Page 2-45

Center for Naval Analyses Comparison of Total Compensation
Psychiatry Current Annual Compensation
Years of Completed Private Sector Private Sector
USNUSAF Servic Compensation Element USNUSAF (50th Percentile) (75th Percentile) 7
RMC/Base Salary $63,300 $141,700 $151,000 Incentive Pays $43,000
Total Cash $106,300 $141,700 $151,000
Total Benefits $36,000 $48,400 $51,700
Total Compensation $142,300 $190,100 $202,700
Years of Completed Private Sector Private Sector
USNUSAF Servic Compensation Element USNUSAF (50th Percentile) (75th Percentile)
12 RMC/Base Salary $77,600 $148,700 $158,000 Incentive Pays $57,000
Total Cash $134,600 $148,700 $158,000
Total Benefits $42,900 $50,700 $54,000
Total Compensation $177,500 $199,400 $212,000
Years of Completed Private Sector Private Sector
USNUSAF Servic Compensation Element USNUSAF (50th Percentile) (75th Percentile)
17 RMC/Base Salary $86,100 $155,600 $165,100 Incentive Pays $57,000
Total Cash $143,100 $155,600 $165,100
Total Benefits $47,400 $53,000 $56,300
Total Compensation $190,500 $208,600 $221,400
Army and Air Force compensation is RMC, special and incentive pays, and benefits as of 1 July 2000
Private Sector compensation is total salary (including base and incentives) and benefits as of 1 July 2000
llayGroup Page 2-46

Center for Naval Analyses Comparison of Total Compensation
$250,000
$200,000
$150,000
$100,000
$50,000
$0
Psychiatry Current Annual Compensation
LL. s lO LL. s lO u. s lO <( It) ..... <( It) ..... <( Ill ..... ~ a. a. ~ a. a. ~ a. a. <( ur ur <( ur ur
~ ur Iii'
~ a. a.
~ a. a. a. a.
7 Yrs Completed 12 Yrs Completed 17 Yrs Completed
D Total Benefits
• Total Cash
1-JayGroup Page 2-47

Center for Naval Analyses Comparison of Total Compensation
Radiology (Diagnostic) Current Annual Compensation
Years of Completed Private Sector Private Sector
USNUSAF Servic Compensation Element USNUSAF (50th Percentile) (75th Percentile) 7
RMC/Base Salary $63,300 $208,500 $259,600 Incentive Pays $60,000
Total Cash $123,300 $208,500 $259,600
Total Benefits $36,000 $68,500 $7_9,300
Total Compensation $159,300 $277,000 $338,900
Years of Completed Private Sector Private Sector
USNUSAF Servic Compensation Element USA/USAF (50th Percentile) (75th Percentile) 12
RMC/Base Salary $77,600 $215,500 $261,600 Incentive Pays $68,000
Total Cash $145,600 $215,500 $261,600
Total Benefits $42,900 $71,000 $80,500
Total Compensation $188,500 $286,500 $342,100
Years of Completed Private Sector Private Sector
USNUSAF Servic Compensation Element USA/USAF (50th Percentile) (75th Percentile) 17
RMC/Base Salary $86,100 $222,500 $263,600 Incentive Pays $68,000
Total Cash $154,100 $222,500 $263,600
Total Benefits $47,400 $73,400 $81,700
Total Compensation $201,500 $295,900 $345,300
Army and Air Force compensation is RMC, special and incentive pays, and benefits as of 1 July 2000
Private Sector compensation is total salary (including base and incentives) and benefits as of 1 July 2000
lla}Group Page 2-48

Center for Naval Analyses Comparison of Total Compensation
$350,000
$300,000
$250,000
$200,000
$150,000
$100,000
$50,000
$0
Radiology (Diagnostic) Current Annual Compensation
1.1.. s iO ~ I() ..... ~ c. a.
~ Ci) Ci) c. a.
1.1.. s iO 1.1.. s iO ~ I() ..... ~ I() ..... ~ c. a. ~ c. c. <( U) u;· <( Vi Vi ~
c. a. ~
c. c.
7 Yrs Completed 12 Yrs Completed 17 Yrs Completed
o Total Benefits
• Total Cash
1-JayGroup Page 2-49

Center for Naval Analyses Comparison of Total Compensation
Radiology (Therapeutic) Current Annual Compensation
Years of Completed Private Sector Private Sector
USA/USAF Servic Compensation Element USA/USAF (50th Percentile) (75th Percentile) 7
RMC/Base Salary $63,300 $215,500 $263,900 Incentive Pays $60,000
Total Cash $123,300 $215,500 $263,900
Tota I Benefits $36,000 $71,100 $72,700
Total Compensation $159,300 $286,600 $336,600
Years of Completed Private Sector Private Sector
USA/USAF Servic Compensation Element USA/USAF (50th Percentile) (75th Percentile) 12
RMC/Base Salary $77,600 $224,800 $276,300 Incentive Pays $68,000
Total Cash $145,600 $224,800 $276,300
Total Benefits $42,900 $74,100 $76,600
Total Compensation $188,500 $298,900 $352,900
Years of Completed Private Sector Private Sector
USA/USAF Servic Compensation Element USA/USAF (50th Percentile) (75th Percentile) 17
RMC/Base Salary $86,100 $234,700 $289,600 Incentive Pays $68,000
Total Cash $154,100 $234,700 $289,600
Total Benefits $47.400 $77,400 $80,900
Total Compensation $201,500 $312,100 $370,500
Army and Air Force compensation is RMC, special and incentive pays, and benefits as of 1 July 2000
Private Sector compensation is total salary (including base and incentives) and benefits as of 1 July 2000
lla)·Group Page 2-50

Center for Naval Analyses Comparison of Total Compensation
$400,000
$350,000
$300,000
$250,000
$200,000
$150,000
$100,000
$50,000
$0
Radiology (Therapeutic) Current Annual Compensation
u.. 0 it) ~ 10 ,... ~ c.. c..
~ iTi iTi c.. c..
u.. 0 it) u.. s it) ~ 10 ,...
~ 10 ,... en c.. c.. ll. ll. :::> ur· Iii iTi iTi
~ <t ll. ll. ~
ll. ll.
7 Yrs Completed 12 Yrs Completed 17 Yrs Completed
D Total Benefits
• Total Cash
' HayGroup Page 2-51
Center for Naval Analyses Comparison of Total Compensation
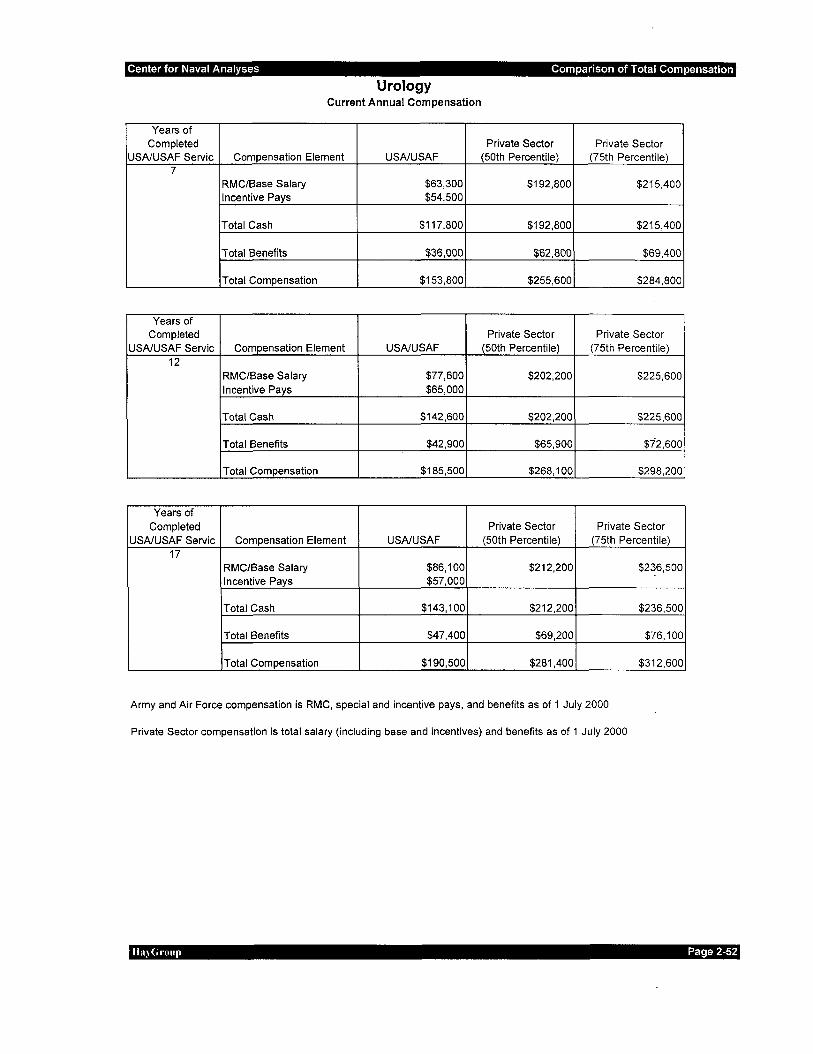
Urology Current Annual Compensation
Years of Completed Private Sector Private Sector
USA/USAF Servic Compensation Element USA/USAF (50th Percentile) (75th Percentile) 7
RMC/Base Salary $63,300 $192,800 $215,400 Incentive Pays $54,500
Total Cash $117,800 $192,800 $215,400
Total Benefits $36,000 $62,800 $69,400
Total Compensation $153,800 $255,600 $284,800
Years of Completed Private Sector Private Sector
USA/USAF Servic Compensation Element USA/USAF (50th Percentile) (75th Percentile) 12
RMC/Base Salary $77,600 $202,200 $225,600 Incentive Pays $65,000
Total Cash $142,600 $202,200 $225,600
Total Benefits $42,900 $65,900 $72,600
Total Compensation $185,500 $268,100 $298,200
Years of Completed Private Sector Private Sector
USA/USAF Servic Compensation Element USA/USAF (50th Percentile) (75th Percentile) 17
RMC/Base Salary $86,100 $212,200 $236,500 Incentive Pays $57,000
Total Cash $143,100 $212,200 $236,500
Total Benefits $47,400 $69,200 $76,100
Total Compensation $190,500 $281,400 $312,600
Army and Air Force compensation is RMC, special and incentive pays, and benefits as of 1 July 2000
Private Sector compensation is total salary (including base and incentives) and benefits as of 1 July 2000
llayGroup Page 2-52

Center for Naval Analyses Comparison of Total Compensation
$350,000
$300,000
$250,000
$200,000
$150,000
$100,000
$50,000
$0
Urology Current Annual Compensation
s ll)
ll.
~
u.. s iii' u.. s iii' ~ ll) ..... ~ ll) ..... ~ ll. ll. .~ c.. ll.
<( Ci) Ci)
~ Ci) Ci)
~ ll. ll. c.. ll.
7 Yrs Completed 12 Yrs Completed 17 Yrs Completed
D Total Benefits
• Total Cash
HayGroup Page 2-53

Center for Naval Analyses Comparison of Physician Total Compensation
Appendix A: Assumptions
Career Profiles
Army and Air Force Physicians:
Army and Air Force physicians are assumed to enter active service at age 26 following completion of medical school. Residency and fellowship training are assumed to occur while on active duty.
Separate career profiles 1 are developed for each specialty in the study. These profiles represent the predominant or most typical experience in that specialty. All entering Army and Air Force physicians are assumed to serve one year of internship (PG-1) immediately upon entering active duty. All specialty training is assumed to begin following the PG-1 tour, and fellowship training immediately follows residency training. Table A-7 at the end of this Appendix illustrate the career profiles, training lengths, and training Active Duty Service Commitments (ADSCs) for each specialty.
All entering physicians are assumed to carry a four-year ADSC resulting from a four-year Armed Forces Health Professional Scholarship Program (HPSP) No active duty obligation is discharged when in PG-1 or residency training. Attending residency training produces additional ADSCs and these commitments are served concurrently with the HPSP following completion of in-service residency training. For example, an Army or Air Force physician attending radiology residency training will enter the program with a four-year ADSC from the scholarship program subsidization, and will incur an additional four-year commitment from residency. However, after residency training, the four-year service commitment from medical school is served concurrently with the fouryear obligation from radiology training.
With two exceptions, the study assumes that residency and fellowship training lengths are the same for the Army and Air Force within a particular specialty or subspecialty. For example, the study assumes a four-year residency program for both Army and Air Force physicians specializing in pathology. The exceptions are neurosurgery and otolaryngology where the Army residency programs are assumed to be six and five years in length, respectively, and the Air Force residency programs are assumed to be five and four years in length, respectively.
1 Service representatives from the Army, Air Force, and the TRICARE Management Agency approved the career profiles, training lengths, active duty service commitments and specialty pays used in the study.
HayGroup Page A-1

Center for Naval Analyses Comparison of Physician Total Compensation
Table A-7 also indicates promotion points to 0-4, 0-5 and 0-6. There are no ADSCs that would prohibit separation at any time following a promotion. The separations modeled in this study (following 7, 12 and 17 years of service) are unaffected by promotions.
Private Sector Physicians:
Private sector physicians are assumed to enter practice following completion of residency/specialty training. For total compensation purposes, private sector physicians are compared with Army and Air Force physicians having the same number of years of practice in the specialty.
For example, an Army or Air Force family practice physician with seven years of completed service (one year of PG-1, two years of residency, and four years in a staff utilization tour) would be compared with a private sector family practice physician with four completed years of practice.
In the case of fellowship training, the Army and Air Force physician would be compared with the private sector internal medicine specialist through completion of fellowship training, then with the appropriate subspecialty, for example, cardiology. In this example, the Army or Air Force physician one year out of fellowship training would be compared with a private sector cardiologist with one year of practice.
Cash Compensation2
Army and Air Force Physicians:
Cash compensation for Army and Air Force physicians consists of Regular Military Compensation and incentive pays.
Regular Military Compensation (RMC). RMC is composed of Basic Pay, Basic Allowance for Housing, Basic Allowance for Subsistence, and the tax advantage accruing to the non-taxable nature of housing and subsistence allowances. Basic pay represents approximately 66 percent of RMC for an 0-3 and approximately 75 percent of RMC for an 0-6. The study was based on the 1 July 2000 RMC table, shown in Table A-7 at the end of this Appendix for the grade and year of service combinations in this study.
Incentive pays are Variable Special Pay (VSP), Additional Special Pay (ASP), Board Certification Pay (BCP), Incentive Special Pay (ISP) and Multi-year Special Pay (MSP). Incentive pays are assumed to be paid in annual installments based on specialty and year of service (as appropriate). Payments are at rates
2 The study did not consider the subsidization value for the Armed Forces Health Professional Scholarship Program, nor did it make compensation comparisons during the period of residency training.
HayGroup Page A-2

Center for Naval Analyses Comparison of Physician Total Compensation
effective 1 October 1999. Because future increases in incentive pays are subject to legislation, the study assumes current payment levels remain unchanged.
Variable Special Pay (VSP). VSP varies by year of service. The payment amounts are the same for each specialty we examined and are shown in Table A-7.
Additional Special Pay (ASP). ASP is $15,000 for each year earned. ASP is not payable during periods of internship (PG-1) or initial residency training. ASP is payable during periods of fellowship training if the physician treats patients as part of the training regime. The study assumes ASP is payable during fellowship training. Table A-7 shows the ASP payment schedules used in the study.
Board Certification Pay (BCP). BCP payments begin after successfully completing board certification examinations following residency training, and the amounts vary by year of service. The study assumes that internal medicine, pediatrics, and family practice physicians will pass board certification exams on a schedule that will permit them to receive BCP during their first year following residency. All other specialties are assumed to pass certification exams by the end of the second year following residency. Table A-7 at the end of the Appendix illustrates the payment schedules for each specialty.
Incentive Special Pay (ISP). ISP requires a one-year service contract. Payment varies by specialty and is assumed to begin the fiscal year following residency training. Payment amounts do not vary by year of service. The three subspecialties receive ISP for internal medicine until completion of fellowship training, then begin receiving the ISP for their subspecialty. ISP amounts are also shown in Table A-7.
Multiyear Special Pay (MSP). MSP is payable to Army and Air Force physicians signing contracts for two, three or four years of additional service. Payment amounts vary by specialty. To qualify, physicians must have either discharged all ADSC's for training or completed at least eight years creditable service as determined by their Health Profession Pay Entry Date (HPPED). If a physician qualifies to receive MSP after completing at least eight years creditable service as determined by their HPPED but has not completed all ADSC for training, at some time prior to separation or retirement the physician may not receive MSP for the number of years equivalent to the remaining period of obligated service. For example, if a urologist with a three-year ADSC for training begins receiving MSP after completing at least eight years of creditable service as determined by their HPPED, that physician would not be able to receive MSP during the threeyear period immediately preceding separation or retirement. Table A-7 illustrates the MSP payment schedules used in this study.
HayGroup Page A-3

Center for Naval Analyses Comparison of Physician Total Compensation
Private Sector Physicians:
Base, incentive and total salary data are taken from the Hay Group 1999 Physicians' Total Compensation Survey. Survey data are effective as of mid-1999. We adjusted all data to 2000 by applying a 4.5 percent trend factor.
Participants in the Physician's survey included 91 healthcare organizations in one of three categories: 1) group practices (29 percent), 2) Health Maintenance Organizations (HMOs) (15 percent), and 3) hospital based facilities (56 percent). The data from these organizations represent over 22,300 physician incumbents. The list of participating organizations is provided in Appendix B. The following table illustrates several characteristics of the organizations.
Table A-1: Characteristics of Participating Organizations
Category Median Gross Average Number of Average Number of Revenue Employed Operating/Staffed (Millions) Physicians Beds
Group Practice $107.1M 251 N/A HMO $217.9M 677 N/A Hospital Systems $679.4M 187 1,132 Hospitals/Medical $306.6M 119 388 Centers
Compensation data used in the study is for employed staff physicians only. Physicians serving as executives, medical directors, or faculty are excluded.
Total salary is the sum of base salary, incentives and other compensation. Sixty-nine percent of the organizations have incentive or bonus plans, and 47 percent of incumbents received an incentive or bonus payout. Details by type of facility are shown in Table A-2.
Table A-2: Prevalence and Payouts of Incentive Programs
Group Hospital-Based Total for all Practice HMO Facility Physicians
Percentage Offering an 74% 86% 59% 69% Incentive Program
Percentage of Physicians Receiving an Incentive All Physician Specialties 36.5% 67.4% 23.2% 46.5% Primary Care 47.3% 62.1% 19.9% 47.0% Other Specialties 30.1% 72.5% 25.7% 46.1%
Other compensation includes:
• Board fees • Partnership or other equity distribution • Profit sharing payout • Property distribution
HayGroup Page A-4

Center for Naval Analyses Comparison of Physician Total Compensation
• On-call differential • Overtime • Hire-in bonus or other recruiting incentives • Distribution from owned ancillary services, and • Administrative differential.
Individual private sector compensation data are not separately identified by whether the physician is board certified or a graduate of a U.S. medical school. These factors can affect total compensation levels. In some cases, survey respondents indicated the employer applied a salary differential for board certification, but specific amounts are not available. Most Army and Air Force physicians are eventually board certified and a majority are graduates of U.S. schools. Consequently, total private sector compensation data are shown for the median (50th percentile3
) and the 75th percentile4. We believe this presents a
reasonable range within which it is possible to make valid comparisons.
Annual base salary and total salary (including incentives and other compensation) are provided for selected years of practice in Tables A-3 and A-4 below.
3 The median value divides the data set in half. Half of the physicians have total annual compensation above the median and half have total compensation below the median. 4 Twenty-five percent of physicians have incomes above the 75th percentile, and 75 percent of physicians have income below the 75th percentile.
HayGroup Page A-5

Center for Naval Analyses Comparison of Physician Total Compensation
Table A-3: Annual Total Compensation (Median)- Private Sector Physicians 1 by Years of Practice in the Specialty/Subspecialty
Specialty/Subspecialty 3 Years 9 Years 15 Years Anesthesiology $207,108 $215,854 $224,600 Cardiology (Invasive) 225,360 229,790 234,220 Dermatology 175,715 186,144 196,574 Emeqwncy Medicine 179,741 189,324 198,906 Family Practice 131,813 135,453 139,094 Gastroenterology 190,810 195,553 200,295 General Surgery 184,742 201,687 218,632 Hematology/Oncology 165,295 181,056 196,188 Internal Medicine 140,254 149,631 159,009 Neurology 158,933 166,806 174,679 Neurosurgery 339,225 329,781 320,337 Obstetrics/Gynecology 197,958 205,615 213,271 Industrial & Occupational Medicine 151,784 152,446 153,108 Ophthalmology 166,871 185,775 204,679 Orthopedic Surgery 237,571 251,621 265,671 Otolaryngology 238,925 233,081 227,237 Pathology 163,339 175,733 188,126 Pediatric Primary Care 130,596 139,164 147,732 Physical Medicine & Rehabilitation 153,279 155,170 157,060 Plastic & Reconstructive SurQerv 184,742 233,443 251,786 Psychiatry 140,349 148,685 157,021 Radiology (Diagnostic) 208,495 216,899 225,303 Radiology (Therapeutic) 215,493 226,664 238,697 Urology 294,671 206,081 218,479 1. Source: 1999 Hay Physician's Compensation Survey. Salaries are trended to 1 July 2000.
HayGroup Page A-6
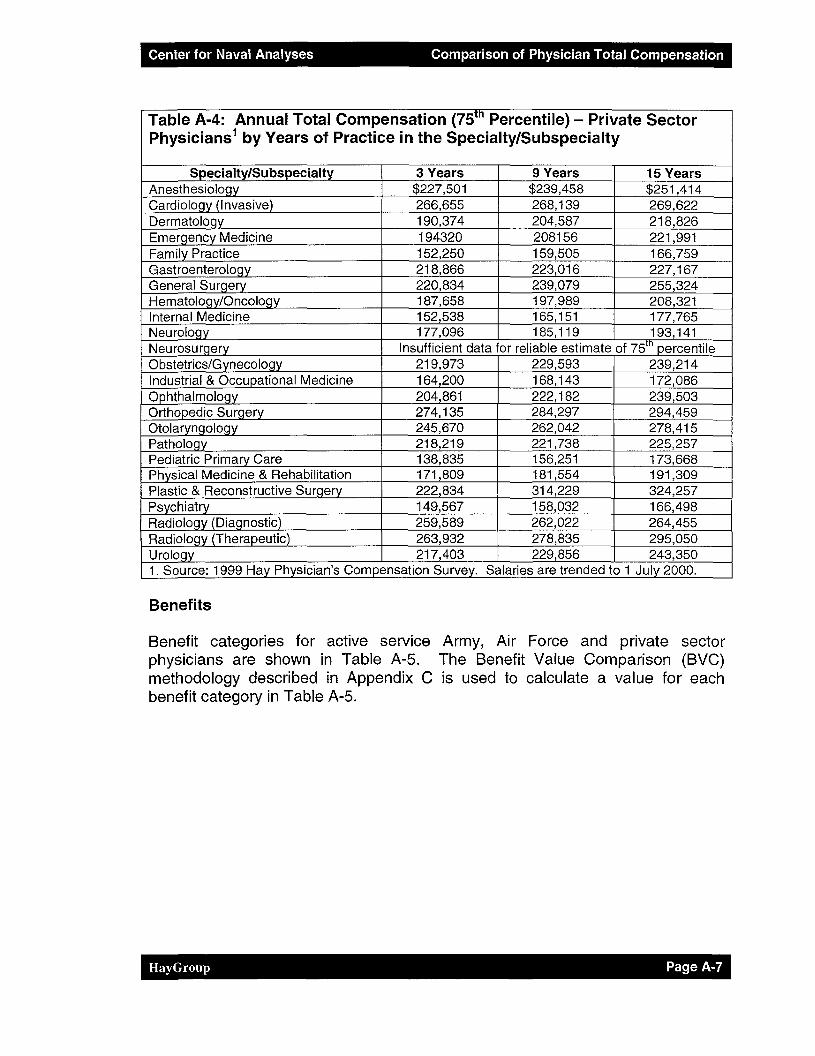
Center for Naval Analyses Comparison of Physician Total Compensation
Table A-4: Annual Total Compensation (751h Percentile)- Private Sector
Physicians 1 by Years of Practice in the Specialty/Subspecialty
Specialty/Subspecialty 3 Years 9 Years 15 Years Anesthesiology $227,501 $239,458 $251,414 Cardiology (Invasive)_ 266,655 268,139 269,622 Dermatology 190,374 204,587 218,826 Emergency Medicine 194320 208156 221,991 Family Practice 152,250 159,505 166,759 Gastroenterology 218,866 223,016 227,167 General Surgery 220,834 239,079 255,324 Hematology/Oncology 187,658 197,989 208,321 Internal Medicine 152,538 165,151 177,765 Neurology 177,096 185,119 193,141 Neurosurgery Insufficient data for reliable estimate of 75rn percentile Obstetrics/GynecologY' 219,973 229,593 239,214 Industrial & Occupational Medicine 164,200 168,143 172,086 Ophthalmology 204,861 222,182 239,503 Orthopedic Surgery 274,135 284,297 294,459 Otolary_flgology 245,670 262,042 278,415 Pathology 218,219 221,738 225,257 Pediatric Primary Care 138,835 156,251 173,668 Physical Medicine & Rehabilitation 171,809 181,554 191,309 Plastic & Reconstructive Surgery 222,834 314,229 324,257 Psychiatry 149,567 158,032 166,498 Radiology (Diagnostic) 259,589 262,022 264,455 RadioloQy (Therapeutic) 263,932 278,835 295,050 Urology 217,403 229,856 243,350 1. Source: 1999 Hay Physician's Compensation Survey. Salaries are trended to 1 July 2000.
Benefits
Benefit categories for active service Army, Air Force and private sector physicians are shown in Table A-5. The Benefit Value Comparison (BVC) methodology described in Appendix C is used to calculate a value for each benefit category in Table A-5.
HayGroup Page A-7

Center for Naval Analyses Comparison of Physician Total Compensation
Table A-5: Army, Air Force and Private Sector Physician Benefit Categories (Active Service)
Benefit Category Army and Air Force Private Sector Group Life Servicemen's Group Life Insurance Basic Group Life Insurance (SGLI) Supplemental Group Life
Veterans Group Life Insurance Dependent Group Life (VGLI) Basic Accidental Death Dependency and Indemnity Business Travel insurance Compensation (DIC) Death Gratuity Burial Allowance Social Security Death Benefit Unused Leave Payback
Disability Short Term Disability Short Term Disability Long Term Disability (Temporary Long Term Disability and Permanent Disability Retirement)
Health Care Medical and Dental for Physician Health Care Insurance (Medical, and Family (MTF and Tricare) Dental, Vision)
Pension Plan Military Retirement System Defined Benefit Pension Plan Survivor Benefit Plan
Capital No military analogue currently 401 (k) or 403(b) plans Accumulation Plan available Holida ysN a cation Holidays Holidays
Leave Vacations Other Benefits Commissary Flexible Benefits Programs
Exchange Morale, Welfare and Recreation (MWR) Personal legal services Child care
Statutory Benefits Unemployment Compensation Unemployment Compensation Workmen's Compensation Workmen's Compensation Social Security Social Security
All Army and Air Force physicians are assumed to retire under the military retirement system that bases payments on the average of the highest three years of basic pay (High-3 system). Currently serving physicians who are at or near the 7 and 12 year of service points entered military service following enactment of the Military Retirement Reform Act of 1996 and are covered by that system (REDUX). However, the FY2000 National Defense Authorization Act authorized all REDUX participants the opportunity to transfer to the High-3 system at their fifteen year of service points. The study assumes that all physicians will transfer to the High-3 system.
Military benefits for retired Army and Air Force physicians working in the private sector include military retirement and the survivor benefit plan. The study does not include the value of several benefits under the presumption that they would
HayGroup Page A-8

Center for Naval Analyses Comparison of Physician Total Compensation
not be used. These include retiree medical care, commissary and exchange, MWR, childcare, and use of installation legal services.
Benefits for retired private sector physicians include pension and capital accumulation plans, survivor benefit plans, and retiree health coverage.
HayGroup Page A-9

Center for Naval Analyses Comparison of Physician Total Compensation Table A-7 (USA/USAF)
Anesthesiology
Current End YOS
Type of Military
~ Service** ADSC***
PG-1 4 26 0-3 $46,115.52 $1,200 $0 IR 4 2 27 $46,115.52 $5,000 $0 IR 4 3 28 $49,360.81 $5,000 $0 IR 4 4 29 $52,104.01 $5,000 $0 su 3 5 30 $55,128.01 $5,000 $15,000 su 2 6 31 0-4 $55,128.01 $12,000 $15,000 su 1 7 32 $63,312.76 $12,000 $15,000 su 0 8 33 $63,312.76 $11,500 $15,000 su 9 34 $65,565.16 $11,500 $15,000 su 10 35 $65,565.16 $11,000 $15,000 su 11 36 $69,295.30 $11,000 $15,000 su X 12 37 0-5 $69,295.30 $10,000 $15,000 su 13 38 $77,636.70 $10,000 $15,000 su 14 39 $77,636.70 $9,000 $15,000 su 15 40 $81,944.86 $9,000 $15,000 su 16 41 $81,944.86 $9,000 $15,000 su X 17 42 $86,077.62 $9,000 $15,000 su 18 43 0-6 $86,077.62 $8,000 $15,000 su 19 44 $97,489.60 $8,000 $15,000 su X 20 45 $97,489.60 $8,000 $15,000
* Promotion to 0-4 occurs at end of YOS 6; to 0-5 at end of YOS 12; to 0-6 at end of YOS 18 ** Use this key to indicate the type of service for each year
PG-1 Internship IR In-Service Residency Training FT In-Service Fellowship Training SU Staff Utilization Tour- Practicing as specialist FP Practicing as fellow· ·
$0 $0 $0 $0 $0 $0
$2,500 $2,500 $2,500 $3,500 $3,500 $4,000 $4,000 $5,000 $5,000 $5,000 $5,000 $6,000 $6,000 $6,000
$0 $0 $0 $0
$29,000 $29,000 $29,000 $29,000 $29,000 $29,000 $29,000 $29,000 $29,000 $29,000 $29,000 $29,000 $29,000 $29,000 $29,000 $29,000
MSP****
$0 $0 $0 $0 $0 $0 $0 $0
$8,000 $8,000 $8,000 $8,000 $8,000 $8,000 $8,000 $8,000 $8,000 $8,000 $8,000 $8,000
***Active Duty Service Commitment at the end of the current year of service; maximum of HPSP or IR+FT; x = separation point of interest in study
**** MSP amounts reflect combinations of contract lengths that would result in a contract expiration at end of 20 YOS;
Zero amounts occur for N years prior to retirement if physician signed MSP contract while having an N year ADSC for training
HayGroup Page A-10

Center for Naval Analyses Comparison of Physician Total Compensation
Cardiology (Invasive)
Current Type of Military
Table A-7 (USA/USAF)
End YOS ~ Grade* Service** ADSC***
1 26 0-3 PG-1 4 $46,115.52 $1,200 2 27 IR 4 $46,115.52 $5,000 3 28 IR 4 $49,360.81 $5,000 4 29 FT 5 $52,104.01 $5,000 5 30 FT 5 $55,128.01 $5,000 6 31 0-4 FT 5 $55,128.01 $12,000 7 32 FP 4 $63,312.76 $12,000 8 33 FP 3 $63,312.76 $11,500 9 34 FP 2 $65,565.16 $11,500 10 35 FP 1 $65,565.16 $11,000 11 36 FP 0 $69,295.30 $11,000 12 37 0-5 FP X $69,295.30 $10,000 13 38 FP $77,636.70 $10,000 14 39 FP $77,636.70 $9,000 15 40 FP $81,944.86 $9,000 16 41 FP $81,944.86 $9,000 17 42 FP X $86,077.62 $9,000 18 43 0-6 FP $86,077.62 $8,000 19 44 FP $97,489.60 $8,000 20 45 FP X $97,489.60 $8,000
$0 $0 $0
$15,000 $15,000 $15,000 $15,000 $15,000 $15,000 $15,000 $15,000 $15,000 $15,000 $15,000 $15,000 $15,000 $15,000 $15,000 $15,000 $15,000
* Promotion to 0-4 occurs at end of YOS 6; to 0-5 at end of YOS 12; to 0-6 at end of YOS 18 ** Use this key to indicate the type of service for each year
PG-1 Internship IR In-Service Residency Training FT In-Service Fellowship Training SU Staff Utilization Tour- Practicing as specialist FP Practicing as fellow ·
$0 $0 $0 $0 $0
$2,500 $2,500 $2,500 $2,500 $3,500 $3,500 $4,000 $4,000 $5,000 $5,000 $5,000 $5,000 $6,000 $6,000 $6,000
$0 $0 $0
$13,000 $13,000 $13,000 $36,000 $36,000 $36,000 $36,000 $36,000 $36,000 $36,000 $36,000 $36,000 $36,000 $36,000 $36,000 $36,000 $36,000
MSP****
$0 $0 $0 $0 $0 $0 $0 $0
$8,000 $8,000 $8,000 $8,000 $8,000 $8,000 $8,000 $8,000 $8,000
$0 $0 $0
***Active Duty Service Commitment at the end of the current year of service; maximum of HPSP or IR+FT; x =separation point of interest in study
**** MSP amounts reflect combinations of contract lengths that would result in a contract expiration at end of 20 YOS;
Zero amounts occur for N years prior to retirement if physician signed MSP contract while having an N year ADSC for training
HayGroup Page A-11

Center for Naval Analyses Comparison of Physician Total Compensation Table A-7 (USA/USAF)
Dermatology
Current End YOS
Type of Military
Grade* Service** ADSC***
PG-1 4 1 26 0-3 $46,115.52 $1,200 $0 IR 4 2 27 $46,115.52 $5,000 $0 IR 4 3 28 $49,360.81 $5,000 $0 IR 4 4 29 $52,104.01 $5,000 $0 su 3 5 30 $55,128.01 $5,000 $15,000 su 2 6 31 0-4 $55,128.01 $12,000 $15,000 su 1 7 32 $63,312.76 $12,000 $15,000 su 0 8 33 $63,312.76 $11,500 $15,000 su 9 34 $65,565.16 $11,500 $15,000 su 10 35 $65,565.16 $11,000 $15,000 su 11 36 $69,295.30 $11,000 $15,000 su X 12 37 0-5 $69,295.30 $10,000 $15,000 su 13 38 $77,636.70 $10,000 $15,000 su 14 39 $77,636.70 $9,000 $15,000 su 15 40 $81,944.86 $9,000 $15,000 su 16 41 $81,944.86 $9,000 $15,000 su X 17 42 $86,077.62 $9,000 $15,000 su 18 43 0-6 $86,077.62 $8,000 $15,000 su 19 44 $97,489.60 $8,000 $15,000 su X 20 45 $97,489.60 $8,000 $15,000
* Promotion to 0-4 occurs at end of YOS 6; to 0-5 at end of YOS 12; to 0-6 at end of YOS 18 ** Use this key to indicate the type of service for each year
PG-1 Internship IR In-Service Residency Training FT In-Service Fellowship Training SU Staff Utilization Tour- Practicing as specialist FP Practicing as feliow ·
$0 $0 $0 $0 $0 $0
$2,500 $2,500 $2,500 $3,500 $3,500 $4,000 $4,000 $5,000 $5,000 $5,000 $5,000 $6,000 $6,000 $6,000
$0 $0 $0 $0
$14,000 $14,000 $14,000 $14,000 $14,000 $14,000 $14,000 $14,000 $14,000 $14,000 $14,000 $14,000 $14,000 $14,000 $14,000 $14,000
MSP****
$0 $0 $0 $0 $0 $0 $0 $0
$8,000 $8,000 $8,000 $8,000 $8,000 $8,000 $8,000 $8,000 $8,000 $8,000 $8,000 $8,000
***Active Duty Service Commitment at the end of the current year of service; maximum of HPSP or IR+FT; x =separation point of interest in study
**** MSP amounts reflect combinations of contract lengths that would result in a contract expiration at end of 20 YOS;
Zero amounts occur for N years prior to retirement if physician signed MSP contract while having an N year ADSC for training
HayGroup Page A-12

Center for Naval Analyses Comparison of Physician Total Compensation
Emergency Medicine
Current End YOS ~
1 26 2 27 3 28 4 29 5 30 6 31 7 32 8 33 9 34 10 35 11 36 12 37 13 38 14 39 15 40 16 41 17 42 18 43 19 44 20 45
Type of Military
Table A-7 (USA/USAF)
Grade* Service** ADSC***
0-3 PG-1 4 $46,115.52 $1,200 IR 4 $46,115.52 $5,000 IR 4 $49,360.81 $5,000 IR 4 $52,104.01 $5,000 su 3 $55,128.01 $5,000
0-4 su 2 $55,128.01 $12,000 su 1 $63,312.76 $12,000 su 0 $63,312.76 $11,500 su $65,565.16 $11,500 su $65,565.16 $11,000 su $69,295.30 $11,000
0-5 su X $69,295.30 $10,000 su $77,636.70 $10,000 su $77,636.70 $9,000 su $81,944.86 $9,000 su $81,944.86 $9,000 su X $86,077.62 $9,000
0-6 su $86,077.62 $8,000 su $97,489.60 $8,000 su X $97,489.60 $8,000
$0 $0 $0 $0
$15,000 $15,000 $15,000 $15,000 $15,000 $15,000 $15,000 $15,000 $15,000 $15,000 $15,000 $15,000 $15,000 $15,000 $15,000 $15,000
* Promotion to 0-4 occurs at end of YOS 6; to 0-5 at end of YOS 12; to 0-6 at end of YOS 18 ** Use this key to indicate the type of service for each year
PG-1 Internship IR In-Service Residency Training FT In-Service Fellowship Training SU Staff Utilization Tour- Practicing as specialist FP Practicing as fellow .
$0 $0 $0 $0 $0 $0
$2,500 $2,500 $2,500 $3,500 $3,500 $4,000 $4,000 $5,000 $5,000 $5,000 $5,000 $6,000 $6,000 $6,000
$0 $0 $0 $0
$22,000 $22,000 $22,000 $22,000 $22,000 $22,000 $22,000 $22,000 $22,000 $22,000 $22,000 $22,000 $22,000 $22,000 $22,000 $22,000
MSP****
$0 $0 $0 $0 $0 $0 $0 $0
$8,000 $8,000 $8,000 $8,000 $8,000 $8,000 $8,000 $8,000 $8,000 $8,000 $8,000 $8,000
***Active Duty Service Commitment at the end of the current year of service; maximum of HPSP or IR+FT; x = separation point of interest in study
**** MSP amounts reflect combinations of contract lengths that would result in a contract expiration at end of 20 YOS;
Zero amounts occur for N years prior to retirement if physician signed MSP contract while having an N year ADSC for training
HayGroup Page A-13

Center for Naval Analyses Comparison of Physician Total Compensation
Family Practice
Current End YOS ~
1 26 2 27 3 28 4 29 5 30 6 31 7 32 8 33 9 34 10 35 11 36 12 37 13 38 14 39 15 40 16 41 17 42 18 43 19 44 20 45
Table A-7 (USA/USAF)
Type of Military
Grade* Service** ADSC***
0-3 PG-1 4 IR 4 IR 4 su 3 su 2
0-4 su 1 su o (x) su su su su
0-5 su X
su su su su su X
0-6 su su su X
$46,115.52 $1,200 $46,115.52 $5,000 $49,360.81 $5,000 $52,104.01 $5,000 $55,128.01 $5,000 $55,128.01 $12,000 $63,312.76 $12,000 $63,312.76 $11,500 $65,565.16 $11,500 $65,565.16 $11,000 $69,295.30 $11,000 $69,295.30 $10,000 $77,636.70 $10,000 $77,636.70 $9,000 $81,944.86 $9,000 $81,944.86 $9,000 $86,077.62 $9,000 $86,077.62 $8,000 $97,489.60 $8,000 $97,489.60 $8,000
$0 $0 $0
$15,000 $15,000 $15,000 $15,000 $15,000 $15,000 $15,000 $15,000 $15,000 $15,000 $15,000 $15,000 $15,000 $15,000 $15,000 $15,000 $15,000
* Promotion to 0-4 occurs at end of YOS 6; to 0-5 at end of YOS 12; to 0-6 at end of YOS 18 ** Use this key to indicate the type of service for each year
PG-1 Internship IR In-Service Residency Training FT In-Service Fellowship Training SU Staff Utilization Tour- Practicing as specialist ·FP Practicing as fellow ·
MSP****
$0 $0 $0 $0 $0 $0 $0 $0 $0
$2,500 $13,000 $0 $2,500 $13,000 $0 $2,500 $13,000 $0 $2,500 $13,000 $0 $2,500 $13,000 $14,000 $2,500 $13,000 $14,000 $3,500 $13,000 $14,000 $3,500 $13,000 $14,000 $4,000 $13,000 $14,000 $4,000 $13,000 $14,000 $5,000 $13,000 $14,000 $5,000 $13,000 $14,000 $5,000 $13,000 $14,000 $5,000 $13,000 $14,000 $6,000 $13,000 $14,000 $6,000 $13,000 $14,000 $6,000 $13,000 $14,000
***Active Duty Service Commitment at the end of the current year of service; maximum of HPSP or IR+FT; x =separation point of interest in study
**** MSP amounts reflect combinations of contract lengths that would result in a contract expiration at end of 20 YOS;
Zero amounts occur for N years prior to retirement if physician signed MSP contract while having an N year ADSC for training
HayGroup Page A-14

Center for Naval Analyses Comparison of Physician Total Compensation
Gastroenterology
Current End YOS ~
1 26 2 27 3 28 4 29 5 30 6 31 7 32 8 33 9 34 10 35 11 36 12 37 13 38 14 39 15 40 16 41 17 42 18 43 19 44 20 45
Type of Military
Table A-7 (USA/USAF)
Grade* Service** ADSC***
0-3 PG-1 4 $46,115.52 $1,200 IR 4 $46,115.52 $5,000 IR 4 $49,360.81 $5,000 FT 5 $52,104.01 $5,000 FT 5 $55,128.01 $5,000
0-4 FT 5 $55,128.01 $12,000 FP 4 $63,312.76 $12,000 FP 3 $63,312.76 $11,500 FP 2 $65,565.16 $11,500 FP 1 $65,565.16 $11,000 FP 0 $69,295.30 $11,000
0-5 FP X $69,295.30 $10,000 FP $77,636.70 $10,000 FP $77,636.70 $9,000 FP $81,944.86 $9,000 FP $81,944.86 $9,000 FP X $86,077.62 $9,000
0-6 FP $86,077.62 $8,000 FP $97,489.60 $8,000 FP X $97,489.60 $8,000
$0 $0 $0
$15,000 $15,000 $15,000 $15,000 $15,000 $15,000 $15,000 $15,000 $15,000 $15,000 $15,000 $15,000 $15,000 $15,000 $15,000 $15,000 $15,000
* Promotion to 0-4 occurs at end of YOS 6; to 0-5 at end of YOS 12; to 0-6 at end of YOS 18 ** Use this key to indicate the type of service for each year
PG-1 Internship IR In-Service Residency Training FT In-Service Fellowship Training SU Staff Utilization Tour- Practicing as specialist FP Practicing as fellow· ·
$0 $0 $0 $0 $0
$2,500 $2,500 $2,500 $2,500 $3,500 $3,500 $4,000 $4,000 $5,000 $5,000 $5,000 $5,000 $6,000 $6,000 $6,000
$0 $0 $0
$13,000 $13,000 $13,000 $23,000 $23,000 $23,000 $23,000 $23,000 $23,000 $23,000 $23,000 $23,000 $23,000 $23,000 $23,000 $23,000 $23,000
MSP****
$0 $0 $0 $0 $0 $0 $0 $0
$8,000 $8,000 $8,000 $8,000 $8,000 $8,000 $8,000 $8,000 $8,000
$0 $0 $0
***Active Duty Service Commitment at the end of the current year of service; maximum of HPSP or IR+FT; x =separation point of interest in study
**** MSP amounts reflect combinations of contract lengths that would result in a contract expiration at end of 20 YOS;
Zero amounts occur for N years prior to retirement if physician signed MSP contract while having an N year ADSC for training
HayGroup Page A-15

Center for Naval Analyses Comparison of Physician Total Compensation Table A-7 (USA/USAF)
General Surgery
Current End YOS
Type of Military
Grade* Service** APSC***
PG-1 4 1 26 0-3 $46,115.52 $1,200 $0 IR 4 2 27 $46,115.52 $5,000 $0 IR 4 3 28 $49,360.81 $5,000 $0 IR 4 4 29 $52,104.01 $5,000 $0 IR 4 5 30 $55,128.01 $5,000 $0 su 3 6 31 0-4 $55,128.01 $12,000 $15,000 su 2 7 32 $63,312.76 $12,000 $15,000 su 1 8 33 $63,312.76 $11,500 $15,000 su 0 9 34 $65,565.16 $11,500 $15,000 su 10 35 $65,565.16 $11,000 $15,000 su 11 36 $69,295.30 $11,000 $15,000 su X 12 37 0-5 $69,295.30 $10,000 $15,000 su 13 38 $77,636.70 $10,000 $15,000 su 14 39 $77,636.70 $9,000 $15,000 su 15 40 $81,944.86 $9,000 $15,000 su 16 41 $81,944.86 $9,000 $15,000 su X 17 42 $86,077.62 $9,000 $15,000 su 18 43 0-6 $86,077.62 $8,000 $15,000 su 19 44 $97,489.60 $8,000 $15,000 su X 20 45 $97,489.60 $8,000 $15,000
*Promotion to 0-4 occurs at end of YOS 6; to 0-5 at end of YOS 12; to 0-6 at end of YOS 18 ** Use this key to indicate the type of service for each year
PG-1 Internship IR In-Service Residency Training FT In-Service Fellowship Training SU Staff Utilization Tour- Practicing as specialist FP Practicing as fellow ·
$0 $0 $0 $0 $0 $0 $0
$2,500 $2,500 $3,500 $3,500 $4,000 $4,000 $5,000 $5,000 $5,000 $5,000 $6,000 $6,000 $6,000
$0 $0 $0 $0 $0
$26,000 $26,000 $26,000 $26,000 $26,000 $26,000 $26,000 $26,000 $26,000 $26,000 $26,000 $26,000 $26,000 $26,000 $26,000
MSP****
$0 $0 $0 $0 $0 $0 $0 $0
$14,000 $14,000 $14,000 $14,000 $14,000 $14,000 $14,000 $14,000 $14,000 $14,000 $14,000
$0
***Active Duty Service Commitment at the end of the current year of service; maximum of HPSP or IR+FT; x =separation point of interest in study
**** MSP amounts reflect combinations of contract lengths that would result in a contract expiration at end of 20 YOS;
Zero amounts occur for N years prior to retirement if physician signed MSP contract while having an N year ADSC for training
HayGroup Page A-16

Center for Naval Analyses Comparison of Physician Total Compensation Table A-7 (USA/USAF)
Hematology/Oncology
Current End YOS
Type of Military
Grade* Service** ADSC***
PG-1 4 1 26 0-3 $46,115.52 $1,200 $0 IR 4 2 27 $46,115.52 $5,000 $0 IR 4 3 28 $49,360.81 $5,000 $0 FT 5 4 29 $52,104.01 $5,000 $15,000 FT 5 5 30 $55,128.01 $5,000 $15,000 FT 5 6 31 0-4 $55,128.01 $12,000 $15,000 FP 4 7 32 $63,312.76 $12,000 $15,000 FP 3 8 33 $63,312.76 $11,500 $15,000 FP 2 9 34 $65,565.16 $11,500 $15,000 FP 1 10 35 $65,565.16 $11,000 $15,000 FP 0 11 36 $69,295.30 $11,000 $15,000 FP X 12 37 0-5 $69,295.30 $10,000 $15,000 FP 13 38 $77,636.70 $10,000 $15,000 FP 14 39 $77,636.70 $9,000 $15,000 FP 15 40 $81,944.86 $9,000 $15,000 FP 16 41 $81,944.86 $9,000 $15,000 FP X 17 42 $86,077.62 $9,000 $15,000 FP 18 43 0-6 $86,077.62 $8,000 $15,000 FP 19 44 $97,489.60 $8,000 $15,000 FP X 20 45 $97,489.60 $8,000 $15,000
* Promotion to 0-4 occurs at end of YOS 6; to 0-5 at end of YOS 12; to 0-6 at end of YOS 18 ** Use this key to indicate the type of service for each year
PG-1 Internship IR In-Service Residency Training FT In-Service Fellowship Training SU Staff Utilization Tour- Practicing as specialist FP Practicing as fellow ·
$0 $0 $0 $0 $0
$2,500 $2,500 $2,500 $2,500 $3,500 $3,500 $4,000 $4,000 $5,000 $5,000 $5,000 $5,000 $6,000 $6,000 $6,000
$0 $0 $0
$13,000 $13,000 $13,000 $14,000 $14,000 $14,000 $14,000 $14,000 $14,000 $14,000 $14,000 $14,000 $14,000 $14,000 $14,000 $14,000 $14,000
MSP****
$0 $0 $0 $0 $0 $0 $0 $0
$8,000 $8,000 $8,000 $8,000 $8,000 $8,000 $8,000 $8,000 $8,000
$0 $0 $0
***Active Duty Service Commitment at the end of the current year of service; maximum of HPSP or IR+FT; x = separation point of interest in study
**** MSP amounts reflect combinations of contract lengths that would result in a contract expiration at end of 20 YOS;
Zero amounts occur for N years prior to retirement if physician signed MSP contract while having an N year ADSC for training
HayGroup Page A-17

Center for Naval Analyses Comparison of Physician Total Compensation
Internal Medicine
Current End YOS ~
26 2 27 3 28 4 29 5 30 6 31 7 32 8 33 9 34 10 35 11 36 12 37 13 38 14 39 15 40 16 41 17 42 18 43 19 44 20 45
Type of Military
Table A-7 (USA/USAF)
Grade* Service** ADSC***
0-3 PG-1 4 $46,115.52 $1,200 IR 4 $46,115.52 $5,000 IR 4 $49,360.81 $5,000 su 3 $52,104.01 $5,000 su 2 $55,128.01 $5,000
0-4 su 1 $55,128.01 $12,000 su O(x) $63,312.76 $12,000 su $63,312.76 $11,500 su $65,565.16 $11,500 su $65,565.16 $11,000 su $69,295.30 $11,000
0-5 su X $69,295.30 $10,000 su $77,636.70 $10,000 su $77,636.70 $9,000 su $81,944.86 $9,000 su $81,944.86 $9,000 su X $86,077.62 $9,000
0-6 su $86,077.62 $8,000 su $97,489.60 $8,000 su X $97,489.60 $8,000
$0 $0 $0
$15,000 $15,000 $15,000 $15,000 $15,000 $15,000 $15,000 $15,000 $15,000 $15,000 $15,000 $15,000 $15,000 $15,000 $15,000 $15,000 $15,000
* Promotion to 0-4 occurs at end of YOS 6; to 0-5 at end of YOS 12; to 0-6 at end of YOS 18 ** Use this key to indicate the type of service for each year
PG-1 Internship IR In-Service Residency Training FT In-Service Fellowship Training SU Staff Utilization Tour- Practicing as specialist FP Practicing as fe.llow ·
$0 $0 $0
$2,500 $2,500 $2,500 $2,500 $2,500 $2,500 $3,500 $3,500 $4,000 $4,000 $5,000 $5,000 $5,000 $5,000 $6,000 $6,000 $6,000
$0 $0 $0
$13,000 $13,000 $13,000 $13,000 $13,000 $13,000 $13,000 $13,000 $13,000 $13,000 $13,000 $13,000 $13,000 $13,000 $13,000 $13,000 $13,000
MSP****
$0 $0 $0 $0 $0 $0 $0
$8,000 $8,000 $8,000 $8,000 $8,000 $8,000 $8,000 $8,000 $8,000 $8,000 $8,000 $8,000 $8,000
***Active Duty Service Commitment at the end of the current year of service; maximum of HPSP or IR+FT; x = separation point of interest in study
**** MSP amounts reflect combinations of contract lengths that would result in a contract expiration at end of 20 YOS;
Zero amounts occur for N years prior to retirement if physician signed MSP contract while having an N year ADSC for training
HayGroup Page A-18

Center for Naval Analyses Comparison of Physician Total Compensation
Neurology
Current End YOS ~
26 2 27 3 28 4 29 5 30 6 31 7 32 8 33 9 34 10 35 11 36 12 37 13 38 14 39 15 40 16 41 17 42 18 43 19 44 20 45
Type of Military
Table A-7 (USA/USAF)
Grade* Service** ADSC***
0-3 PG-1 4 $46,115.52 $1,200 IR 4 $46,115.52 $5,000 IR 4 $49,360.81 $5,000 IR 4 $52,104.01 $5,000 su 3 $55,128.01 $5,000
0-4 su 2 $55,128.01 $12,000 su 1 $63,312.76 $12,000 su 0 $63,312.76 $11,500 su $65,565.16 $11,500 su $65,565.16 $11,000 su $69,295.30 $11,000
0-5 su X $69,295.30 $10,000 su $77,636.70 $10,000 su $77,636.70 $9,000 su $81,944.86 $9,000 su $81,944.86 $9,000 su X $86,077.62 $9,000
0-6 su $86,077.62 $8,000 su $97,489.60 $8,000 su X $97,489.60 $8,000
$0 $0 $0 $0
$15,000 $15,000 $15,000 $15,000 $15,000 $15,000 $15,000 $15,000 $15,000 $15,000 $15,000 $15,000 $15,000 $15,000 $15,000 $15,000
* Promotion to 0-4 occurs at end of YOS 6; to 0-5 at end of YOS 12; to 0-6 at end of YOS 18 ** Use this key to indicate the type of service for each year
PG-1 Internship IR In-Service Residency Training FT In-Service Fellowship Training SU Staff Utilization Tour- Practicing as specialist FP Practicing as fellow ·
$0 $0 $0 $0 $0 $0
$2,500 $2,500 $2,500 $3,500 $3,500 $4,000 $4,000 $5,000 $5,000 $5,000 $5,000 $6,000 $6,000 $6,000
$0 $0 $0 $0
$13,000 $13,000 $13,000 $13,000 $13,000 $13,000 $13,000 $13,000 $13,000 $13,000 $13,000 $13,000 $13,000 $13,000 $13,000 $13,000
MSP****
$0 $0 $0 $0 $0 $0 $0 $0
$8,000 $8,000 $8,000 $8,000 $8,000 $8,000 $8,000 $8,000 $8,000 $8,000 $8,000 $8,000
***Active Duty Service Commitment at the end of the current year of service; maximum of HPSP or IR+FT; x = separation point of interest in study
**** MSP amounts reflect combinations of contract lengths that would result in a contract expiration at end of 20 YOS;
Zero amounts occur for N years prior to retirement if physician signed MSP contract while having an N year ADSC for training
HayGroup Page A-19
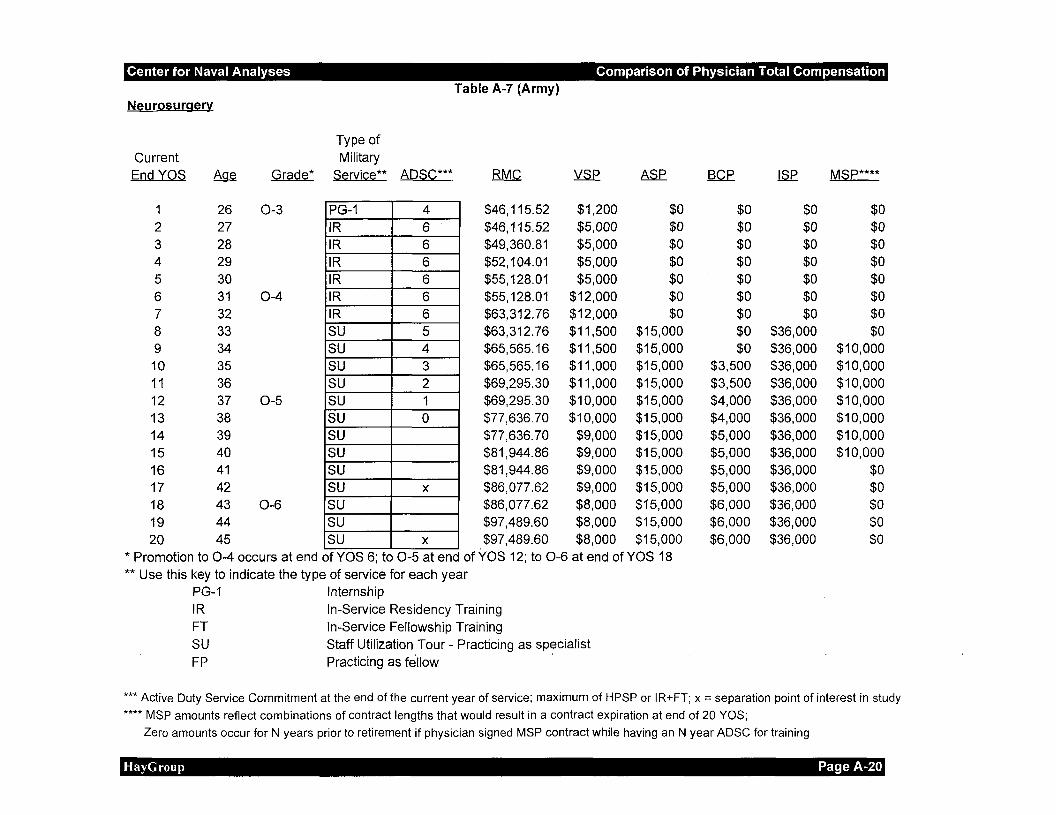
Center for Naval Analyses Comparison of Physician Total Compensation Table A~7 (Army)
Neurosurgery
Current End YOS
Type of Military
Grade* Service** ADSC***
PG-1 4 1 26 0-3 $46,115.52 $1,200 $0 IR 6 2 27 $46,115.52 $5,000 $0 IR 6 3 28 $49,360.81 $5,000 $0 IR 6 4 29 $52,104.01 $5,000 $0 IR 6 5 30 $55,128.01 $5,000 $0 IR 6 6 31 0-4 $55,128.01 $12,000 $0 IR 6 7 32 $63,312.76 $12,000 $0 su 5 8 33 $63,312.76 $11,500 $15,000 su 4 9 34 $65,565.16 $11,500 $15,000 su 3 10 35 $65,565.16 $11,000 $15,000 su 2 11 36 $69,295.30 $11,000 $15,000 su 1 12 37 0-5 $69,295.30 $10,000 $15,000 su 0 13 38 $77,636.70 $10,000 $15,000 su 14 39 $77,636.70 $9,000 $15,000 su 15 40 $81,944.86 $9,000 $15,000 su 16 41 $81,944.86 $9,000 $15,000 su X 17 42 $86,077.62 $9,000 $15,000 su 18 43 0~6 $86,077.62 $8,000 $15,000 su 19 44 $97,489.60 $8,000 $15,000 su X 20 45 $97,489.60 $8,000 $15,000
* Promotion to 0~4 occurs at end of YOS 6; to 0-5 at end of YOS 12; to 0-6 at end of YOS 18 ** Use this key to indicate the type of service for each year
PG-1 Internship IR In-Service Residency Training FT In-Service Fellowship Training SU Staff Utilization Tour- Practicing as specialist FP Practicing as fellow ·
$0 $0 $0 $0 $0 $0 $0 $0 $0
$3,500 $3,500 $4,000 $4,000 $5,000 $5,000 $5,000 $5,000 $6,000 $6,000 $6,000
$0 $0 $0 $0 $0 $0 $0
$36,000 $36,000 $36,000 $36,000 $36,000 $36,000 $36,000 $36,000 $36,000 $36,000 $36,000 $36,000 $36,000
MSP****
$0 $0 $0 $0 $0 $0 $0 $0
$10,000 $10,000 $10,000 $10,000 $10,000 $10,000 $10,000
$0 $0 $0 $0 $0
***Active Duty Service Commitment at the end of the current year of service; maximum of HPSP or IR+FT; x =separation point of interest in study
**** MSP amounts reflect combinations of contract lengths that would result in a contract expiration at end of 20 YOS;
Zero amounts occur for N years prior to retirement if physician signed MSP contract while having an N year ADSC for training
HayGroup Page A-20

Center for Naval Analyses Comparison of Physician Total Compensation Table A-7 (Air Force)
Neurosurgery
Current End YOS
Type of Military
Grade* Service** ADSC***
PG-1 4 1 26 0-3 $46,115.52 $1,200 $0 IR 5 2 27 $46,115.52 $5,000 $0 IR 5 3 28 $49,360.81 $5,000 $0 IR 5 4 29 $52,104.01 $5,000 $0 IR 5 5 30 $55,128.01 $5,000 $0 IR 5 6 31 0-4 $55,128.01 $12,000 $0 su 4 7 32 $63,312.76 $12,000 $15,000 su 3 8 33 $63,312.76 $11,500 $15,000 su 2 9 34 $65,565.16 $11,500 $15,000 su 1 10 35 $65,565.16 $11,000 $15,000 su 0 11 36 $69,295.30 $11,000 $15,000 su X 12 37 0-5 $69,295.30 $10,000 $15,000 su 13 38 $77,636.70 $10,000 $15,000 su 14 39 $77,636.70 $9,000 $15,000 su 15 40 $81,944.86 $9,000 $15,000 su 16 41 $81,944.86 $9,000 $15,000 su X 17 42 $86,077.62 $9,000 $15,000 su 18 43 0-6 $86,077.62 $8,000 $15,000 su 19 44 $97,489.60 $8,000 $15,000 su X 20 45 $97,489.60 $8,000 $15,000
* Promotion to 0-4 occurs at end of YOS 6; to 0-5 at end of YOS 12; to 0-6 at end of YOS 18 ** Use this key to indicate the type of service for each year
PG-1 Internship IR In-Service Residency Training FT In-Service Fellowship Training SU Staff Utilization Tour- Practicing as specialist FP Practicing as fellow ·
$0 $0 $0 $0 $0 $0 $0 $0
$2,500 $3,500 $3,500 $4,000 $4,000 $5,000 $5,000 $5,000 $5,000 $6,000 $6,000 $6,000
$0 $0 $0 $0 $0 $0
$36,000 $36,000 $36,000 $36,000 $36,000 $36,000 $36,000 $36,000 $36,000 $36,000 $36,000 $36,000 $36,000 $36,000
MSP****
$0 $0 $0 $0 $0 $0 $0 $0
$10,000 $10,000 $10,000 $10,000 $10,000 $10,000 $10,000 $10,000 $10,000
$0 $0 $0
***Active Duty Service Commitment at the end of the current year of service; maximum of HPSP or IR+FT; x =separation point of interest in study
**** MSP amounts reflect combinations of contract lengths that would result in a contract expiration at end of 20 YOS;
Zero amounts occur for N years prior to retirement if physician signed MSP contract while having an N year ADSC for training
HayGroup Page A-21

Center for Naval Analyses Comparison of Physician Total Compensation Table A-7 (USA/USAF)
Obstetrics/Gynecology
Current End YOS
Type of Military
Grade* Service** ADSC***
PG-1 4 1 26 0-3 $46,115.52 $1,200 $0 IR 4 2 27 $46,115.52 $5,000 $0 IR 4 3 28 $49,360.81 $5,000 $0 IR 4 4 29 $52,104.01 $5,000 $0 su 3 5 30 $55,128.01 $5,000 $15,000 su 2 6 31 0-4 $55,128.01 $12,000 $15,000 su 1 7 32 $63,312.76 $12,000 $15,000 su 0 8 33 $63,312.76 $11,500 $15,000 su 9 34 $65,565.16 $11,500 $15,000 su 10 35 $65,565.16 $11,000 $15,000 su 11 36 $69,295.30 $11,000 $15,000 su X 12 37 0-5 $69,295.30 $10,000 $15,000 su 13 38 $77,636.70 $10,000 $15,000 su 14 39 $77,636.70 $9,000 $15,000 su 15 40 $81,944.86 $9,000 $15,000 su 16 41 $81,944.86 $9,000 $15,000 su X 17 42 $86,077.62 $9,000 $15,000 su 18 43 0-6 $86,077.62 $8,000 $15,000 su 19 44 $97,489.60 $8,000 $15,000 su X 20 45 $97,489.60 $8,000 $15,000
* Promotion to 0-4 occurs at end of YOS 6; to 0-5 at end of YOS 12; to 0-6 at end of YOS 18 ** Use this key to indicate the type of service for each year
PG-1 Internship IR In-Service Residency Training FT In-Service Fellowship Training SU Staff Utilization Tour- Practicing as specialist FP Practicing as fellow ·
$0 $0 $0 $0 $0 $0
$2,500 $2,500 $2,500 $3,500 $3,500 $4,000 $4,000 $5,000 $5,000 $5,000 $5,000 $6,000 $6,000 $6,000
$0 $0 $0 $0
$31,000 $31,000 $31,000 $31,000 $31,000 $31,000 $31,000 $31,000 $31,000 $31,000 $31,000 $31,000 $31,000 $31,000 $31,000 $31,000
MSP****
$0 $0 $0 $0 $0 $0 $0 $0
$8,000 $8,000 $8,000 $8,000 $8,000 $8,000 $8,000 $8,000 $8,000 $8,000 $8,000 $8,000
***Active Duty Service Commitment at the end of the current year of service; maximum of HPSP or IR+FT; x = separation point of interest in study
**** MSP amounts reflect combinations of contract lengths that would result in a contract expiration at end of 20 YOS;
Zero amounts occur for N years prior to retirement if physician signed MSP contract while having an N year ADSC for training
HayGroup Page A-22

Center for Naval Analyses Comparison of Physician Total Compensation Table A-7 (USA/USAF)
lndustriaJ/Occupational Medicine
Current End YOS
Type of Military
Grade* Service** ADSC***
PG-1 4 26 0-3 $46,115.52 $1,200 $0 IR 4 2 27 $46,115.52 $5,000 $0 IR 4 3 28 $49,360.81 $5,000 $0 su 3 4 29 $52,104.01 $5,000 $15,000 su 2 5 30 $55,128.01 $5,000 $15,000 su 1 6 31 0-4 $55,128.01 $12,000 $15,000 su 0 (x) 7 32 $63,312.76 $12,000 $15,000 su 8 33 $63,312.76 $11,500 $15,000 su 9 34 $65,565.16 $11,500 $15,000 su 10 35 $65,565.16 $11,000 $15,000 su 11 36 $69,295.30 $11,000 $15,000 su X 12 37 0-5 $69,295.30 $10,000 $15,000 su 13 38 $77,636.70 $10,000 $15,000 su 14 39 $77,636.70 $9,000 $15,000 su 15 40 $81,944.86 $9,000 $15,000 su 16 41 $81,944.86 $9,000 $15,000 su X 17 42 $86,077.62 $9,000 $15,000 su 18 43 0-6 $86,077.62 $8,000 $15,000 su 19 44 $97,489.60 $8,000 $15,000 su X 20 45 $97,489.60 $8,000 $15,000
* Promotion to 0-4 occurs at end of YOS 6; to 0-5 at end of YOS 12; to 0-6 at end of YOS 18 ** Use this key to indicate the type of service for each year
PG-1 Internship IR In-Service Residency Training FT In-Service Fellowship Training SU Staff Utilization Tour- Practicing as specialist FP Practicing as fellow ·
$0 $0 $0 $0 $0
$2,500 $2,500 $2,500 $2,500 $3,500 $3,500 $4,000 $4,000 $5,000 $5,000 $5,000 $5,000 $6,000 $6,000 $6,000
$0 $0 $0
$11,000 $11,000 $11,000 $11,000 $11,000 $11,000 $11,000 $11,000 $11,000 $11,000 $11,000 $11,000 $11,000 $11,000 $11,000 $11,000 $11,000
MSP****
$0 $0 $0 $0 $0 $0 $0
$10,000 $10,000 $10,000 $10,000 $10,000 $10,000 $10,000 $10,000 $10,000 $10,000 $10,000 $10,000 $10,000
***Active Duty Service Commitment at the end of the current year of service; maximum of HPSP or IR+FT; x =separation point of interest in study
**** MSP amounts reflect combinations of contract lengths that would result in a contract expiration at end of 20 YOS;
Zero amounts occur for N years prior to retirement if physician signed MSP contract while having an N year ADSC for training
HayGroup Page A-23

Center for Naval Analyses Comparison of Physician Total Compensation
Ophthalmology
Current End YOS ~
1 26 2 27 3 28 4 29 5 30 6 31 7 32 8 33 9 34 10 35 11 36 12 37 13 38 14 39 15 40 16 41 17 42 18 43 19 44 20 45
Type of Military
Table A-7 (USA/USAF)
Grade* Service** ADSC***
0-3 PG-1 4 $46,115.52 $1,200 IR 4 $46,115.52 $5,000 IR 4 $49,360.81 $5,000 IR 4 $52,104.01 $5,000 su 3 $55,128.01 $5,000
0-4 su 2 $55,128.01 $12,000 su 1 $63,312.76 $12,000 su 0 $63,312.76 $11,500 su $65,565.16 $11,500 su $65,565.16 $11,000 su $69,295.30 $11,000
0-5 su X $69,295.30 $10,000 su $77,636.70 $10,000 su $77,636.70 $9,000 su $81,944.86 $9,000 su $81,944.86 $9,000 su X $86,077.62 $9,000
0-6 su $86,077.62 $8,000 su $97,489.60 $8,000 su X $97,489.60 $8,000
$0 $0 $0 $0
$15,000 $15,000 $15,000 $15,000 $15,000 $15,000 $15,000 $15,000 $15,000 $15,000 $15,000 $15,000 $15,000 $15,000 $15,000 $15,000
* Promotion to 0-4 occurs at end of YOS 6; to 0-5 at end of YOS 12; to 0-6 at end of YOS 18 ** Use this key to indicate the type of service for each year
PG-1 Internship IR In-Service Residency Training FT In-Service Fellowship Training SU Staff Utilization Tour- Practicing as specialist FP Practicing as fellow .
$0 $0 $0 $0 $0 $0
$2,500 $2,500 $2,500 $3,500 $3,500 $4,000 $4,000 $5,000 $5,000 $5,000 $5,000 $6,000 $6,000 $6,000
$0 $0 $0 $0
$28,000 $28,000 $28,000 $28,000 $28,000 $28,000 $28,000 $28,000 $28,000 $28,000 $28,000 $28,000 $28,000 $28,000 $28,000 $28,000
MSP****
$0 $0 $0 $0 $0 $0 $0 $0 $0 $0 $0 $0 $0 $0 $0 $0 $0 $0 $0 $0
***Active Duty Service Commitment at the end of the current year of service; maximum of HPSP or IR+FT; x = separation point of interest in study
**** MSP amounts reflect combinations of contract lengths that would result in a contract expiration at end of 20 YOS;
Zero amounts occur for N years prior to retirement if physician signed MSP contract while having an N year ADSC for training
HayGroup Page A-24

Center for Naval Analyses Comparison of Physician Total Compensation Table A-7 (USA/USAF)
Orthopedic Surgery
Current End YOS
Type of Military
Grade* Service** ADSC***
PG-1 4 1 26 0-3 $46,115.52 $1,200 $0 IR 4 2 27 $46,115.52 $5,000 $0 IR 4 3 28 $49,360.81 $5,000 $0 IR 4 4 29 $52,104.01 $5,000 $0 IR 4 5 30 $55,128.01 $5,000 $0 su 3 6 31 0-4 $55,128.01 $12,000 $15,000 su 2 7 32 $63,312.76 $12,000 $15,000 su 1 8 33 $63,312.76 $11,500 $15,000 su 0 9 34 $65,565.16 $11,500 $15,000 su 10 35 $65,565.16 $11,000 $15,000 su 11 36 $69,295.30 $11,000 $15,000 su X 12 37 0-5 $69,295.30 $10,000 $15,000 su 13 38 $77,636.70 $10,000 $15,000 su 14 39 $77,636.70 $9,000 $15,000 su 15 40 $81,944.86 $9,000 $15,000 su 16 41 $81,944.86 $9,000 $15,000 su X 17 42 $86,077.62 $9,000 $15,000 su 18 43 0-6 $86,077.62 $8,000 $15,000 su 19 44 $97,489.60 $8,000 $15,000 su X 20 45 $97,489.60 $8,000 $15,000
* Promotion to 0-4 occurs at end of YOS 6; to 0-5 at end of YOS 12; to 0-6 at end of YOS 18 ** Use this key to indicate the type of service for each year
PG-1 Internship IR In-Service Residency Training FT In-Service Fellowship Training SU Staff Utilization Tour- Practicing as specialist FP Practicing as fellow .
$0 $0 $0 $0 $0 $0 $0
$2,500 $3,500 $3,500 $3,500 $4,000 $4,000 $5,000 $5,000 $5,000 $5,000 $6,000 $6,000 $6,000
$0 $0 $0 $0 $0
$36,000 $36,000 $36,000 $36,000 $36,000 $36,000 $36,000 $36,000 $36,000 $36,000 $36,000 $36,000 $36,000 $36,000 $36,000
MSP****
$0 $0 $0 $0 $0 $0 $0 $0
$14,000 $14,000 $14,000 $14,000 $14,000 $14,000 $14,000 $14,000 $14,000 $14,000 $14,000
$0
***Active Duty Service Commitment at the end of the current year of service; maximum of HPSP or IR+FT; x =separation point of interest in study
**** MSP amounts reflect combinations of contract lengths that would result in a contract expiration at end of 20 YOS;
Zero amounts occur for N years prior to retirement if physician signed MSP contract while having an N year ADSC for training
HayGroup Page A-25
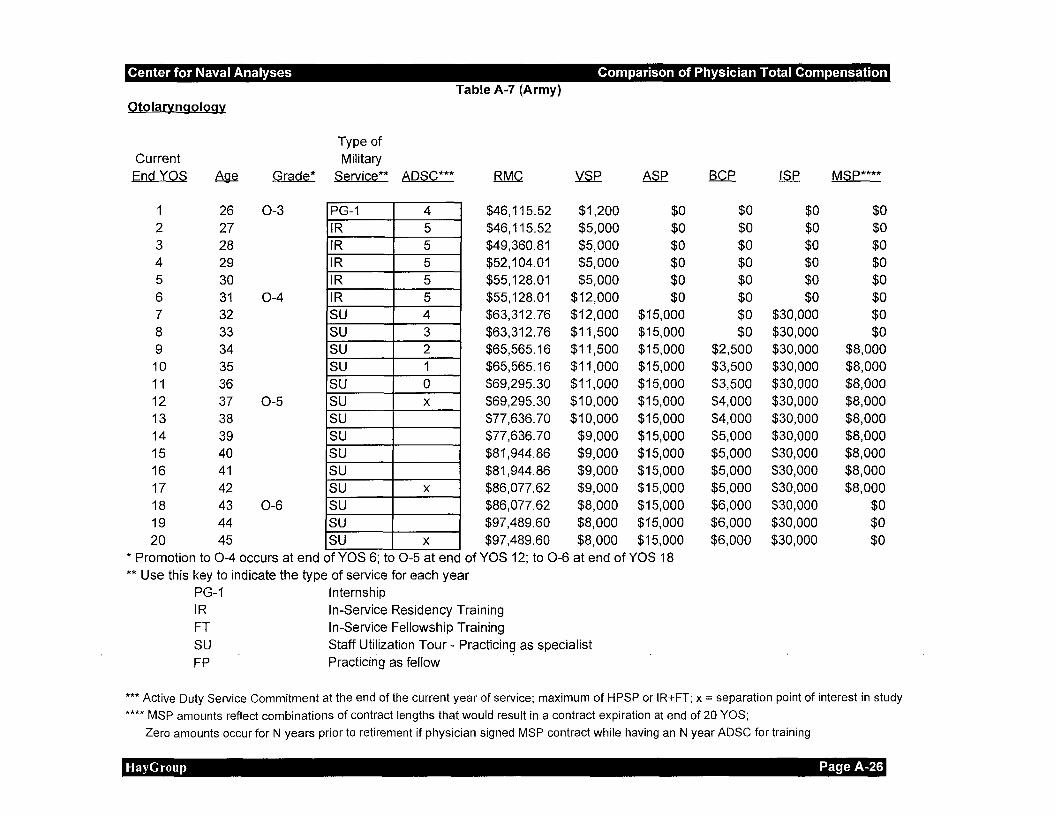
Center for Naval Analyses Comparison of Physician Total Compensation Table A-7 (Army)
Otolaryngology
Current End YOS
Type of Military
Grade* Service** ADSC***
PG-1 4 1 26 0-3 $46,115.52 $1,200 $0 IR 5 2 27 $46,115.52 $5,000 $0 IR 5 3 28 $49,360.81 $5,000 $0 IR 5 4 29 $52,104.01 $5,000 $0 IR 5 5 30 $55,128.01 $5,000 $0 IR 5 6 31 0-4 $55,128.01 $12,000 $0 su 4 7 32 $63,312.76 $12,000 $15,000 su 3 8 33 $63,312.76 $11,500 $15,000 su 2 9 34 $65,565.16 $11,500 $15,000 su 1 10 35 $65,565.16 $11,000 $15,000 su 0 11 36 $69,295.30 $11,000 $15,000 su X 12 37 0-5 $69,295.30 $10,000 $15,000 su 13 38 $77,636.70 $10,000 $15,000 su 14 39 $77,636.70 $9,000 $15,000 su 15 40 $81,944.86 $9,000 $15,000 su 16 41 $81,944.86 $9,000 $15,000 su X 17 42 $86,077.62 $9,000 $15,000 su 18 43 0-6 $86,077.62 $8,000 $15,000 su 19 44 $97,489.60 $8,000 $15,000 su X 20 45 $97,489.60 $8,000 $15,000
* Promotion to 0-4 occurs at end of YOS 6; to 0-5 at end of YOS 12; to 0-6 at end of YOS 18 ** Use this key to indicate the type of service for each year
PG-1 Internship IR In-Service Residency Training FT In-Service Fellowship Training SU Staff Utilization Tour- Practicing as specialist FP Practicing as fellow ·
$0 $0 $0 $0 $0 $0 $0 $0
$2,500 $3,500 $3,500 $4,000 $4,000 $5,000 $5,000 $5,000 $5,000 $6,000 $6,000 $6,000
$0 $0 $0 $0 $0 $0
$30,000 $30,000 $30,000 $30,000 $30,000 $30,000 $30,000 $30,000 $30,000 $30,000 $30,000 $30,000 $30,000 $30,000
MSP****
$0 $0 $0 $0 $0 $0 $0 $0
$8,000 $8,000 $8,000 $8,000 $8,000 $8,000 $8,000 $8,000 $8,000
$0 $0 $0
***Active Duty Service Commitment at the end of the current year of service; maximum of HPSP or IR+FT; x =separation point of interest in study
**** MSP amounts reflect combinations of contract lengths that would result in a contract expiration at end of 20 YOS;
Zero amounts occur for N years prior to retirement if physician signed MSP contract while having an N year ADSC for training
HayGroup Page A-26

Center for Naval Analyses Comparison of Physician Total Compensation
Otolaryngology
Current End YOS ~
26 2 27 3 28 4 29 5 30 6 31 7 32 8 33 9 34 10 35 11 36 12 37 13 38 14 39 15 40 16 41 17 42 18 43 19 44 20 45
Type of Military
Table A-7 (Air Force)
Grade* Service** ADSC***
0-3 PG-1 4 $46,115.52 $1,200 IR 4 $46,115.52 $5,000 IR 4 $49,360.81 $5,000 IR 4 $52,104.01 $5,000 IR 4 $55,128.01 $5,000
0-4 su 3 $55,128.01 $12,000 su 2 $63,312.76 $12,000 su 1 $63,312.76 $11,500 su 0 $65,565.16 $11,500 su $65,565.16 $11,000 su $69,295.30 $11,000
0-5 su X $69,295.30 $10,000 su $77,636.70 $10,000 su $77,636.70 $9,000 su $81,944.86 $9,000 su $81,944.86 $9,000 su X $86,077.62 $9,000
0-6 su $86,077.62 $8,000 su $97,489.60 $8,000 su X $97,489.60 $8,000
$0 $0 $0 $0 $0 $0
$15,000 $15,000 $15,000 $15,000 $15,000 $15,000 $15,000 $15,000 $15,000 $15,000 $15,000 $15,000 $15,000 $15,000
*Promotion to 0-4 occurs at end of YOS 6; to 0-5 at end of YOS 12; to 0-6 at end of YOS 18 ** Use this key to indicate the type of service for each year
PG-1 Internship IR In-Service Residency Training FT In-Service Fellowship Training SU Staff Utilization Tour- Practicing as specialist FP Practicing as fellow .
$0 $0 $0 $0 $0 $0 $0
$2,500 $2,500 $3,500 $3,500 $4,000 $4,000 $5,000 $5,000 $5,000 $5,000 $6,000 $6,000 $6,000
$0 $0 $0 $0 $0 $0
$30,000 $30,000 $30,000 $30,000 $30,000 $30,000 $30,000 $30,000 $30,000 $30,000 $30,000 $30,000 $30,000 $30,000
MSP****
$0 $0 $0 $0 $0 $0 $0 $0
$8,000 $8,000 $8,000 $8,000 $8,000 $8,000 $8,000 $8,000 $8,000
$0 $0 $0
***Active Duty Service Commitment at the end of the current year of service; maximum of HPSP or IR+FT; x = separation point of interest in study
**** MSP amounts reflect combinations of contract lengths that would result in a contract expiration at end of 20 YOS;
Zero amounts occur for N years prior to retirement if physician signed MSP contract while having an N year ADSC for training
HayGroup Page A-27

Center for Naval Analyses Comparison of Physician Total Compensation
Pathology
Current End YOS
2 3 4 5 6 7 8 9 10 11 12 13 14 15 16 17 18 19 20
26 27 28 29 30 31 32 33 34 35 36 37 38 39 40 41 42 43 44 45
Type of Military
Table A-7 (USA/USAF)
Grade* Service** ADSC***
0-3 PG-1 4 $46,115.52 $1,200 IR 4 $46,115.52 $5,000 IR 4 $49,360.81 $5,000 IR 4 $52,104.01 $5,000 IR 4 $55,128.01 $5,000
0-4 su 4 $55,128.01 $12,000 su 4 $63,312.76 $12,000 su 3 $63,312.76 $11,500 su 2 $65,565.16 $11,500 su 1 $65,565.16 $11,000 su 0 $69,295.30 $11,000
0-5 su X $69,295.30 $10,000 su $77,636.70 $10,000 su $77,636.70 $9,000 su $81,944.86 $9,000 su $81,944.86 $9,000 su X $86,077.62 $9,000
0-6 su $86,077.62 $8,000 su $97,489.60 $8,000 su X $97,489.60 $8,000
$0 $0 $0 $0 $0
$15,000 $15,000 $15,000 $15,000 $15,000 $15,000 $15,000 $15,000 $15,000 $15,000 $15,000 $15,000 $15,000 $15,000 $15,000
* Promotion to 0-4 occurs at end of YOS 6; to 0-5 at end of YOS 12; to 0-6 at end of YOS 18 ** Use this key to indicate the type of service for each year
PG-1 Internship IR In-Service Residency Training FT In-Service Fellowship Training SU Staff Utilization Tour- Practicing as specialist FP Practicing· as fellow ·
$0 $0 $0 $0 $0 $0 $0
$2,500 $2,500 $3,500 $3,500 $4,000 $4,000 $5,000 $5,000 $5,000 $5,000 $6,000 $6,000 $6,000
$0 $0 $0 $0 $0
$16,000 $16,000 $16,000 $16,000 $16,000 $16,000 $16,000 $16,000 $16,000 $16,000 $16,000 $16,000 $16,000 $16,000 $16,000
MSP****
$0 $0 $0 $0 $0 $0 $0 $0
$8,000 $8,000 $8,000 $8,000 $8,000 $8,000 $8,000 $8,000 $8,000
$0 $0 $0
***Active Duty Service Commitment at the end of the current year of service; maximum of HPSP or IR+FT; x = separation point of interest in study
**** MSP amounts reflect combinations of contract lengths that would result in a contract expiration at end of 20 YOS;
Zero amounts occur for N years prior to retirement if physician signed MSP contract while having an N year ADSC for training
HayGroup Page A-28

Center for Naval Analyses Comparison of Physician Total Compensation Table A-7 (USA/USAF)
Pediatric Primary Care
Current End YOS
Type of Military
Grade* Service** ADSC***
PG-1 4 1 26 0-3 $46,115.52 $1,200 $0 IR 4 2 27 $46,115.52 $5,000 $0 IR 4 3 28 $49,360.81 $5,000 $0 su 3 4 29 $52,104.01 $5,000 $15,000 su 2 5 30 $55,128.01 $5,000 $15,000 su 1 6 31 0-4 $55,128.01 $12,000 $15,000 su 0 (x) 7 32 $63,312.76 $12,000 $15,000 su 8 33 $63,312.76 $11,500 $15,000 su 9 34 $65,565.16 $11,500 $15,000 su 10 35 $65,565.16 $11,000 $15,000 su 11 36 $69,295.30 $11,000 $15,000 su X 12 37 0-5 $69,295.30 $10,000 $15,000 su 13 38 $77,636.70 $10,000 $15,000 su 14 39 $77,636.70 $9,000 $15,000 su 15 40 $81,944.86 $9,000 $15,000 su 16 41 $81,944.86 $9,000 $15,000 su X 17 42 $86,077.62 $9,000 $15,000 su 18 43 0-6 $86,077.62 $8,000 $15,000 su 19 44 $97,489.60 $8,000 $15,000 su X 20 45 $97,489.60 $8,000 $15,000
* Promotion to 0-4 occurs at end of YOS 6; to 0-5 at end of YOS 12; to 0-6 at end of YOS 18 ** Use this key to indicate the type of service for each year
PG-1 Internship IR In-Service Residency Training FT In-Service Fellowship Training SU Staff Utilization Tour- Practicing as specialist FP Practicing as fellow
$0 $0 $0
$2,500 $2,500 $2,500 $2,500 $2,500 $2,500 $3,500 $3,500 $4,000 $4,000 $5,000 $5,000 $5,000 $5,000 $6,000 $6,000 $6,000
$0 $0 $0
$11,000 $11,000 $11,000 $11,000 $11,000 $11,000 $11,000 $11,000 $11,000 $11,000 $11,000 $11,000 $11,000 $11,000 $11,000 $11,000 $11,000
MSP****
$0 $0 $0 $0 $0 $0 $0
$8,000 $8,000 $8,000 $8,000 $8,000 $8,000 $8,000 $8,000 $8,000 $8,000 $8,000 $8,000 $8,000
***Active Duty Service Commitment at the end of the current year of service; maximum of HPSP or IR+FT; x =separation point of interest in study
**** MSP amounts reflect combinations of contract lengths that would result in a contract expiration at end of 20 YOS;
Zero amounts occur for N years prior to retirement if physician signed MSP contract while having an N year ADSC for training
HayGroup Page A-29

Center for Naval Analyses Comparison of Physician Total Compensation Table A-7 (USA/USAF)
Physical Medicine & Rehabilitation
Current End YOS
Type of Military
Grade* Service** ADSC***
PG-1 4 1 26 0-3 $46,115.52 $1,200 $0 IR 4 2 27 $46,115.52 $5,000 $0 IR 4 3 28 $49,360.81 $5,000 $0 IR 4 4 29 $52,104.01 $5,000 $0 su 3 5 30 $55,128.01 $5,000 $15,000 su 2 6 31 0-4 $55,128.01 $12,000 $15,000 su 1 7 32 $63,312.76 $12,000 $15,000 su 0 8 33 $63,312.76 $11,500 $15,000 su 9 34 $65,565.16 $11,500 $15,000 su 10 35 $65,565.16 $11,000 $15,000 su 11 36 $69,295.30 $11,000 $15,000 su X 12 37 0-5 $69,295.30 $10,000 $15,000 su 13 38 $77,636.70 $10,000 $15,000 su 14 39 $77,636.70 $9,000 $15,000 su 15 40 $81,944.86 $9,000 $15,000 su 16 41 $81,944.86 $9,000 $15,000 su X 17 42 $86,077.62 $9,000 $15,000 su 18 43 0-6 $86,077.62 $8,000 $15,000 su 19 44 $97,489.60 $8,000 $15,000 su X 20 45 $97,489.60 $8,000 $15,000
* Promotion to 0-4 occurs at end of YOS 6; to 0-5 at end of YOS 12; to 0-6 at end of YOS 18 ** Use this key to indicate the type of service for each year
PG-1 Internship IR In-Service Residency Training FT In-Service Fellowship Training SU Staff Utilization Tour- Practicing as specialist FP Practicing as fellow ·
$0 $0 $0 $0 $0 $0
$2,500 $2,500 $2,500 $3,500 $3,500 $4,000 $4,000 $5,000 $5,000 $5,000 $5,000 $6,000 $6,000 $6,000
$0 $0 $0 $0
$11,000 $11,000 $11,000 $11,000 $11,000 $11,000 $11,000 $11,000 $11,000 $11,000 $11,000 $11,000 $11,000 $11,000 $11,000 $11,000
MSP****
$0 $0 $0 $0 $0 $0 $0 $0
$10,000 $10,000 $10,000 $10,000 $10,000 $10,000 $10,000 $10,000 $10,000 $10,000 $10,000 $10,000
***Active Duty Service Commitment at the end of the current year of service; maximum of HPSP or IR+FT; x = separation point of interest in study
**** MSP amounts reflect combinations of contract lengths that would result in a contract expiration at end of 20 YOS;
Zero amounts occur for N years prior to retirement if physician signed MSP contract while having an N year ADSC for training
HayGroup Page A-30

Center for Naval Analyses Comparison of Physician Total Compensation
Plastic & Reconstructive Surgery
Current Type of Military
Table A-7 (USA/USAF)
End YOS 8g_e Grade* Service** ADSC***
26 0-3 PG-1 4 $46,115.52 $1,200 2 27 IR 4 $46,115.52 $5,000 3 28 IR 4 $49,360.81 $5,000 4 29 IR 4 $52,104.01 $5,000 5 30 IR 4 $55,128.01 $5,000 6 31 0-4 FT 6 $55,128.01 $12,000 7 32 FT 6 $63,312.76 $12,000 8 33 FP 5 $63,312.76 $11,500 9 34 FP 4 $65,565.16 $11,500 10 35 FP 3 $65,565.16 $11,000 11 36 FP 2 $69,295.30 $11,000 12 37 0-5 FP 1 $69,295.30 $10,000 13 38 FP 0 $77,636.70 $10,000 14 39 FP $77,636.70 $9,000 15 40 FP $81,944.86 $9,000 16 41 FP $81,944.86 $9,000 17 42 FP X $86,077.62 $9,000 18 43 0-6 FP $86,077.62 $8,000 19 44 FP $97,489.60 $8,000 20 45 FP X $97,489.60 $8,000
$0 $0 $0 $0 $0
$15,000 $15,000 $15,000 $15,000 $15,000 $15,000 $15,000 $15,000 $15,000 $15,000 $15,000 $15,000 $15,000 $15,000 $15,000
* Promotion to 0-4 occurs at end of YOS 6; to 0-5 at end of YOS 12; to 0-6 at end of YOS 18 ** Use this key to indicate the type of service for each year
PG-1 Internship IR In-Service Residency Training FT In-Service Fellowship Training SU Staff Utilization Tour- Practicing as specialist FP Practicing as fellow ·
$0 $0 $0 $0 $0 $0 $0
$2,500 $3,500 $3,500 $3,500 $4,000 $4,000 $5,000 $5,000 $5,000 $5,000 $6,000 $6,000 $6,000
$0 $0 $0 $0 $0
$26,000 $26,000 $36,000 $36,000 $36,000 $36,000 $36,000 $36,000 $36,000 $36,000 $36,000 $36,000 $36,000 $36,000 $36,000
MSP****
$0 $0 $0 $0 $0 $0 $0 $0
$8,000 $8,000 $8,000 $8,000 $8,000 $8,000 $8,000
$0 $0 $0 $0 $0
***Active Duty Service Commitment at the end of the current year of service; maximum of HPSP or IR+FT; x = separation point of interest in study
**** MSP amounts reflect combinations of contract lengths that would result in a contract expiration at end of 20 YOS;
Zero amounts occur for N years prior to retirement if physician signed MSP contract while having an N year ADSC for training
HayGroup Page A-31

Center for Naval Analyses Comparison of Physician Total Compensation Table A-7 (USA/USAF)
Psychiatry
Current End YOS
Type of Military
Grade* Service** ADSC***
PG-1 4 26 0-3 $46,115.52 $1,200 $0 IR 4 2 27 $46,115.52 $5,000 $0 IR 4 3 28 $49,360.81 $5,000 $0 IR 4 4 29 $52,104.01 $5,000 $0 su 3 5 30 $55,128.01 $5,000 $15,000 su 2 6 31 0-4 $55,128.01 $12,000 $15,000 su 1 7 32 $63,312.76 $12,000 $15,000 su 0 8 33 $63,312.76 $11,500 $15,000 su 9 34 $65,565.16 $11,500 $15,000 su 10 35 $65,565.16 $11,000 $15,000 su 11 36 $69,295.30 $11,000 $15,000 su X 12 37 0-5 $69,295.30 $10,000 $15,000 su 13 38 $77,636.70 $10,000 $15,000 su 14 39 $77,636.70 $9,000 $15,000 su 15 40 $81,944.86 $9,000 $15,000 su 16 41 $81,944.86 $9,000 $15,000 su X 17 42 $86,077.62 $9,000 $15,000 su 18 43 0-6 $86,077.62 $8,000 $15,000 su 19 44 $97,489.60 $8,000 $15,000 su X 20 45 $97,489.60 $8,000 $15,000
* Promotion to 0-4 occurs at end of YOS 6; to 0-5 at end of YOS 12; to 0-6 at end of YOS 18 ** Use this key to indicate the type of service for each year
PG-1 Internship IR In-Service Residency Training FT In-Service Fellowship Training SU Staff Utilization Tour- Practicing as specialist FP Practicing as fellow
$0 $0 $0 $0 $0 $0
$2,500 $2,500 $2,500 $3,500 $3,500 $4,000 $4,000 $5,000 $5,000 $5,000 $5,000 $6,000 $6,000 $6,000
$0 $0 $0 $0
$14,000 $14,000 $14,000 $14,000 $14,000 $14,000 $14,000 $14,000 $14,000 $14,000 $14,000 $14,000 $14,000 $14,000 $14,000 $14,000
MSP****
$0 $0 $0 $0 $0 $0 $0 $0
$14,000 $14,000 $14,000 $14,000 $14,000 $14,000 $14,000 $14,000 $14,000 $14,000 $14,000 $14,000
***Active Duty Service Commitment at the end of the current year of service; maximum of HPSP or IR+FT; x =separation point of interest in study
**** MSP amounts reflect combinations of contract lengths that would result in a contract expiration at end of 20 YOS;
Zero amounts occur for N years prior to retirement if physician signed MSP contract while having an N year ADSC for training
HayGroup Page A-32

Center for Naval Analyses Comparison of Physician Total Compensation
Radiology (Diagnostic)
Current Type of Military
Table A-7 (USA/USAF)
End YOS ~ Grade* Service** ADSC***
1 26 0-3 PG-1 4 $46,115052 $1,200 2 27 IR 4 $46,115052 $5,000 3 28 IR 4 $49,360081 $5,000 4 29 IR 4 $52,104001 $5,000 5 30 IR 4 $55,128001 $5,000 6 31 0-4 su 3 $55,128001 $12,000 7 32 su 2 $63,312076 $12,000 8 33 su 1 $63,312076 $11,500 9 34 su 0 $65,565016 $11,500 10 35 su $65,565016 $11,000 11 36 su $69,295030 $11,000 12 37 0-5 su X $69,295030 $10,000 13 38 su $77,636070 $10,000 14 39 su $77,636070 $9,000 15 40 su $81,944086 $9,000 16 41 su $81,944086 $9,000 17 42 su X $86,077062 $9,000 18 43 0-6 su $86,077062 $8,000 19 44 su $97,489060 $8,000 20 45 su X $97,489060 $8,000
$0 $0 $0 $0 $0
$15,000 $15,000 $15,000 $15,000 $15,000 $15,000 $15,000 $15,000 $15,000 $15,000 $15,000 $15,000 $15,000 $15,000 $15,000
* Promotion to 0-4 occurs at end of YOS 6; to 0-5 at end of YOS 12; to 0-6 at end of YOS 18 ** Use this key to indicate the type of service for each year
PG-1 Internship IR In-Service Residency Training FT In-Service Fellowship Training SU Staff Utilization Tour- Practicing as specialist FP Practicing as fellow
0 0
$0 $0 $0 $0 $0 $0 $0
$2,500 $2,500 $3,500 $3,500 $4,000 $4,000 $5,000 $5,000 $5,000 $5,000 $6,000 $6,000 $6,000
$0 $0 $0 $0 $0
$31,000 $31,000 $31,000 $31,000 $31,000 $31,000 $31,000 $31,000 $31,000 $31,000 $31,000 $31,000 $31,000 $31,000 $31,000
MSP****
$0 $0 $0 $0 $0 $0 $0 $0
$8,000 $8,000 $8,000 $8,000 $8,000 $8,000 $8,000 $8,000 $8,000 $8,000 $8,000
$0
***Active Duty Service Commitment at the end of the current year of service; maximum of HPSP or IR+FT; x = separation point of interest in study
**** MSP amounts reflect combinations of contract lengths that would result in a contract expiration at end of 20 YOS;
Zero amounts occur for N years prior to retirement if physician signed MSP contract while having an N year ADSC for training
HayGroup Page A-33

Center for Naval Analyses Comparison of Physician Total Compensation
Radiology (Therapeutic)
Current Type of Military
Table A-7 (USA/USAF)
End YOS 6g_e Grade* Service** ADSC***
1 26 0-3 PG-1 4 $46,115.52 $1,200 2 27 IR 4 $46,115.52 $5,000 3 28 IR 4 $49,360.81 $5,000 4 29 IR 4 $52,104.01 $5,000 5 30 IR 4 $55,128.01 $5,000 6 31 0-4 su 3 $55,128.01 $12,000 7 32 su 2 $63,312.76 $12,000 8 33 su 1 $63,312.76 $11,500 9 34 su 0 $65,565.16 $11,500 10 35 su $65,565.16 $11,000 11 36 su $69,295.30 $11,000 12 37 0-5 su X $69,295.30 $10,000 13 38 su $77,636.70 $10,000 14 39 su $77,636.70 $9,000 15 40 su $81,944.86 $9,000 16 41 su $81,944.86 $9,000 17 42 su X $86,077.62 $9,000 18 43 0-6 su $86,077.62 $8,000 19 44 su $97,489.60 $8,000 20 45 su X $97,489.60 $8,000
$0 $0 $0 $0 $0
$15,000 $15,000 $15,000 $15,000 $15,000 $15,000 $15,000 $15,000 $15,000 $15,000 $15,000 $15,000 $15,000 $15,000 $15,000
* Promotion to 0-4 occurs at end of YOS 6; to 0-5 at end of YOS 12; to 0-6 at end of YOS 18 ** Use this key to indicate the type of service for each year
PG-1 Internship IR In-Service Residency Training FT In-Service Fellowship Training SU Staff Utilization Tour- Practicing as specialist FP Practicing as fellow .
$0 $0 $0 $0 $0 $0 $0
$2,500 $3,500 $3,500 $3,500 $4,000 $4,000 $5,000 $5,000 $5,000 $5,000 $6,000 $6,000 $6,000
$0 $0 $0 $0 $0
$31,000 $31,000 $31,000 $31,000 $31,000 $31,000 $31,000 $31,000 $31,000 $31,000 $31,000 $31,000 $31,000 $31,000 $31,000
MSP****
$0 $0 $0 $0 $0 $0 $0 $0
$8,000 $8,000 $8,000 $8,000 $8,000 $8,000 $8,000 $8,000 $8,000 $8,000 $8,000
$0
***Active Duty Service Commitment at the end of the current year of service; maximum of HPSP or IR+FT; x = separation point of interest in study **** MSP amounts reflect combinations of contract lengths that would result in a contract expiration at end of 20 YOS;
Zero amounts occur for N years prior to retirement if physician signed MSP contract while having an N year ADSC for training
HayGroup Page A-34

Center for Naval Analyses Comparison of Physician Total Compensation
Urology
Current End YOS
Type of Military
Table A-7 (USA/USAF)
Grade* Service** ADSC***
PG-1 4 26 0-3 $46,115.52 $1,200 $0 IR 5 2 27 $46,115.52 $5,000 $0 IR 5 3 28 $49,360.81 $5,000 $0 IR 5 4 29 $52,104.01 $5,000 $0 IR 5 5 30 $55,128.01 $5,000 $0 IR 5 6 31 0-4 $55,128.01 $12,000 $0 su 4 7 32 $63,312.76 $12,000 $15,000 su 3 8 33 $63,312.76 $11,500 $15,000 su 2 9 34 $65,565.16 $11,500 $15,000 su 1 10 35 $65,565.16 $11,000 $15,000 su 0 11 36 $69,295.30 $11,000 $15,000 su X 12 37 0-5 $69,295.30 $10,000 $15,000 su 13 38 $77,636.70 $10,000 $15,000 su 14 39 $77,636.70 $9,000 $15,000 su 15 40 $81,944.86 $9,000 $15,000 su 16 41 $81,944.86 $9,000 $15,000 su X 17 42 $86,077.62 $9,000 $15,000 su 18 43 0-6 $86,077.62 $8,000 $15,000 su 19 44 $97,489.60 $8,000 $15,000 su X 20 45 $97,489.60 $8,000 $15,000
* Promotion to 0-4 occurs at end of YOS 6; to 0-5 at end of YOS 12; to 0-6 at end of YOS 18 ** Use this key to indicate the type of service for each year
PG-1 Internship IR In-Service Residency Training FT In-Service Fellowship Training SU Staff Utilization Tour- Practicing as specialist FP Practidng as fellow ·
$0 $0 $0 $0 $0 $0 $0 $0
$2,500 $3,500 $3,500 $4,000 $4,000 $5,000 $5,000 $5,000 $5,000 $6,000 $6,000 $6,000
$0 $0 $0 $0 $0 $0
$28,000 $28,000 $28,000 $28,000 $28,000 $28,000 $28,000 $28,000 $28,000 $28,000 $28,000 $28,000 $28,000 $28,000
MSP****
$0 $0 $0 $0 $0 $0 $0 $0
$8,000 $8,000 $8,000 $8,000 $8,000 $8,000 $8,000 $8,000 $8,000
$0 $0 $0
***Active Duty Service Commitment at the end of the current year of service; maximum of HPSP or IR+FT; x = separation point of interest in study
**** MSP amounts reflect combinations of contract lengths that would result in a contract expiration at end of 20 YOS;
Zero amounts occur for N years prior to retirement if physician signed MSP contract while having an N year ADSC for training
HayGroup Page A-35

Center for Naval Analyses Comparison of Physician Total Compensation
Appendix B: Private Sector Survey Participants
Group Practices (26)
Camino Medical Group (Sunnyvale, CA) Children's Associated Medical Group, Inc. (San Diego, CA) The Children's Heart Center (Atlanta, GA) Children's Physicians/Children's Hospital (Omaha, NE) Clinical Care Associates of the University of Pennsylvania Health System
(Radnor, PA) Cook Children's Physician's Network (Fort Worth, TX) Emory Clinic (Atlanta, GA) Fairfield Medical Group, Inc. (Fairfield, CA) Harvard Vanguard Medical Associates (Brookline, MA) Hitchcock Clinic (Lebanon, NH) Kelsey-Seybold Clinic, P.A. (Houston, TX) Lovelace Health Systems, Inc. (Albuquerque, NM) Mayo Clinic (Rochester, MN) Med Pro (Phoenix, AZ) Mercy Health Centers (San Diego, CA) MeritCare Medical Group (Fargo, ND) Munson Healthcare, Inc. (Traverse City, Ml) Northwestern Medical Faculty Foundation, Inc. (Chicago, IL) Providence Medical Group (Seattle, WA) Sharp HealthCare (San Diego, CA) Southwest Medical Associates (Las Vegas, NV) SSM Health Care (St. Louis, MO) University of Minnesota Physicians (Minneapolis, MN) Valley Children's Hospital Specialty Medical Group (Fresno, CA) Virginia Mason Medical Center (Seattle, WA) York Health System Medical Group (York, PA)
HMOs (14)
Blue Cross Blue Shield of Michigan (Detroit, Ml) Carolina Permanente Medical Group, P.A. (Raleigh, NC) CIGNA Corporation (Bloomfield, CT) Colorado Permanente Medical Group, P.C. (Denver, CO) Family Health Plan Cooperative (Milwaukee, WI) Group Health Cooperative (Madison, WI) Group Health Permanente (Seattle, WA) Horizon Blue Cross Blue Shield of New Jersey (Newark, NJ) M.I.T. Medical Department (Cambridge, MA) Northeast Permanente Medical Group, P.C. (Farmington, CT)
HayGroup Page B-1

Center for Naval Analyses Comparison of Physician Total Compensation
Northwest Permanente Medical Group, Inc. (Portland, OR) Ohio Permanente Medical Group, Inc. (Cleveland, OH) The Permanente Medical Group, Inc. (Oakland, CA) Southern California Permanente Medical Group (Pasadena, CA)
Hospital-Based Facilities (51)
Advocate Health Care (Oak Brook, IL) All Children's Hospital (St. Petersburg, FL) Alta Bates Medical Center (Berkeley, CA) Atlantic Health System (Florham Park, NJ) Aurora Health Care, Inc. (Milwaukee, WI) Baylor College of Medicine (Dallas, TX) Brockton Hospital (Brockton, MA) Children's Health Care Associates (Philadelphia, PA) Children's Health System (Milwaukee, WI) The Children's Hospital (Denver, CO) Children's Hospital (New Orleans, LA) Children's Hospital Medical Center of Akron (Akron, OH) Children's Hospital of Alabama (Birmingham, AL) The Children's Medical Center (Dayton, OH) Children's Mercy Hospital (Kansas City, MO) Children's Specialty Group, PLLC (Norfolk, VA) Connecticut Children's Medical Center (Hartford, CT) Detroit Medical Center (Detroit, Ml) DuBois Regional Medical Center (DuBois, PA) Egleston Children's Health Care System (Atlanta, GA) Fairview Hospital- Cleveland Clinic Health System (Cleveland, OH) Fairview Hospital and Healthcare Services (Minneapolis, MN) Greenville Hospital System (Greenville, SC) Intermountain Health Care, Inc. (Salt Lake City, UT) Latrobe Area Hospital (Latrobe, PA) Legacy Health System (Portland, OR) Lehigh Valley Hospital (Allentown, PA) Long Beach Memorial Medical Center (Long Beach, CA) Madigan Army Medical Center (Tacoma, WA) Mary Imogene Bassett Hospital (Cooperstown, NY) MedStar Baltimore Division, dba Helix Health System (Lutherville, MD) Memorial Hospital (Colorado Springs, CO) Memorial Sloan-Kettering Cancer Center (New York, NY) Mercy Health Services (Farmington Hills, Ml) Methodist Medical Center of Illinois (Peoria, IL) Miami Children's Hospital (Miami, FL) Mt. Clemens General Hospital (Mount Clemens, Ml) North Memorial Medical Center (Robbinsdale, MN) Parkland Health and Hospital System (Dallas, TX) Phoenix Children's Hospital (Phoenix, AZ)
HayGroup . Page B-2

Center for Naval Analyses Comparison of Physician Total Compensation
Pinnacle Health System (Harrisburg, PA) Presbyterian Healthcare Services (Albuquerque, NM) Providence Health System- Oregon Region (Portland, OR) Sarah Bush Lincoln Health Center (Mattoon, IL) Southern New Hampshire Regional Medical Center (Nashua, NH) Southwestern Vermont Medical Center (Bennington, VT) St. Joseph's Regional Medical Center, Inc. (South Bend, IN) State of Minnesota Department of Human Services (St. Paul, MN) University of Texas Medical Branch at Galveston (Galveston, TX) Valley Medical Center (Renton, WA) York Hospital (York, PA)
HayGroup Page B-3

Center for Naval Analyses Comparison of Physician Total Compensation
Appendix C: Benefit Value Comparison (BVC) Methodology
The salary-equivalent values allocated with each employee benefit are derived through the use of a "standard cost" model. The purpose of this approach is to eliminate the effect of differences in employee population, financing methods and other factors that can result in identical benefit programs in two different organizations having different costs. Under this approach, standard assumptions were derived for all factors other than benefit provisions (e.g. employee population, financing method, etc.) and applied uniformly to all organizations. The "standard assumptions" are based on the national average private sector exempt employee population and the most common funding methods.
The methods used to value each type of benefit are those generally used by companies to fund each benefit. Therefore, group insurance rates were developed through the use of group rate manuals of major underwriters for those benefits that are generally insured. The defined benefit retirement value· factors were developed reflecting major companies' employee populations and experience using reasonable actuarial assumptions as to interest, salary increases and other factors that affect retirement payments.
The results are salary-equivalent benefit values that represent the approximate cost of providing each benefit program to an average salaried employee population in a large private sector organization. Because these values are based on a standard private sector work force and funding assumptions, they will be referred to as standard BVCs.
Standard BVC values are then reduced by the amount of any employee cost sharing in order to reflect that portion of the plan that is paid for by the employer. Accordingly, these values are called employer-provided or EP values. For plans that require an employee contribution, these salary-equivalent EP values represent only the portion of the total value that is employer paid. Defined contribution retirement plans (401 (k) plans) provide a good example. The benefit value for the private sector 401 (k) plan is based only on the employer matching contribution. The model assumes that participants will contribute enough of their own salary to receive the maximum employer match. In this study, the most prevalent private sector practice resulted in a maximum 2.5 percent employer matching contribution.
In addition to the employer-provided standard BVCs, the Army, Air Force, and private sector benefits were also valued as if they had been applied to the Army and Air Force workforce. These are referred to as military employer-provided BVCs and are the benefit values used in this study. If there existed a known DoD cost analogous to a BVC, such as the normal cost of the military retirement system, that cost was used as the BVC and the private sector BVC was recalibrated on that basis. While this process produces a different set of values
HayGroup . Page C-1

Center for Naval Analyses Comparison of Physician Total Compensation
for each comparator's benefits package, the relative values of the different benefits remain unchanged. The values are simply rescaled. However, the sum of the values of all benefits does change as more value is based on the unit cost of some programs and less on the unit cost of others. The advantage of this approach is that it uses known military benefit cost factors, employs the demographics of the military work force, and is, therefore, a more appropriate baseline for this analysis.
The BVCs shown in the study are the average values (costs) for benefits for the Army, Air Force, and private sector physician work forces, assuming a workforce with military demographic characteristics. As averages, the values do not represent the values for any specific individual. While it is not possible to present the values for specific individuals it is important to understand how the values might vary depending on an individual's circumstances.
Some benefits, such as annual leave in the Army and Air Force, have approximately the same economic value for all members. Most of the benefits, however, can vary widely depending on the circumstances of the employee. For instance, health insurance has little economic value for a young, healthy singe employee or servicemember but the economic values are much higher than the average BVC for a married employee with a spouse or child with a severe medical problem.
The variation in economic value is most diverse for the retirement system. A young uniformed service physician who does not plan to stay beyond the first obligated period of service will receive no economic value from the retirement system. However, a uniformed service physician with 17 years service will receive a benefit that is worth much more than the average BVC simply by staying to 20 years.
The range is even wider when it comes to the employee's perceived value of benefits. Even an employee who might eventually stay to retirement will place little value on the retirement benefit early in the career. On the other hand, the employee with a dependent who is at risk for severe medical problems may place a much higher value on health care than a strict economic analysis would predict.
In considering the BVCs it is important to recognize what the value is and to understand what it is not. The BVC is an average cost of benefits for all employees. It is not the economic value for any individual member, and it is even less the perceived value of any individual member. The BVCs provide a quantitative measure of the relative cost of the overall benefits package. The use of the analysis should be tempered with consideration of the economic and perceived values for the individuals being considered.
HayGroup Page C-2

Distribution list
CNA Information Manual D000336l.Al/Final
USA Surgeon General Attn: LTG Peake Attn: MG Sculley Attn: MG Kiley Attn: Craig Buss
USAF Surgeon General Attn: LTG Carlton Attn: MG Randolph Attn: MAJ Bartholomew
USN Surgeon General Attn: RADM Arthur Attn: CAPT Sentell Attn: LCDR Bradley
TRICARE Management Agency Attn: MAJ Wooten