Comparison between fixed base and isolated base in seismic ...
11
CHALLENGE JOURNAL OF STRUCTURAL MECHANICS 6 (4) (2020) 204–214 * Corresponding author. E-mail address: [email protected] (A. M. Fares) ISSN: 2149-8024 / DOI: https://doi.org/10.20528/cjsmec.2020.04.005 Case Study Comparison between fixed base and isolated base in seismic response of high-rise buildings: a case study Anas M. Fares a, * a Department of Civil Engineering, Faculty of Engineering, Necmettin Erbakan University, 42140 Konya, Turkey A B S T R A C T In this study, the influence of soil condition under the isolated and fixed bases is stud- ied by using ETABS 16 software for a high-rise regular building. A regular building with 10 floors is modeled and the results are obtained for story displacements, story shear forces and spectral acceleration according to the Uniform Building Code 97 (UBC-97) code. The time history analysis has been performed by using 1999 Izmit earthquake record. 3 types of soil which have different stiffnesses are considered in this study. The results show that the value of the base shear increases when the soil stiffness decreases. It also noticed that the spectral acceleration is larger in soft soil condition than that of other soil conditions; and this confirms that the structural re- sponse spectrum depends on the soil condition. In addition, when using base isolated building the drift of lower floors will be larger than that of using base isolated, but in the upper floors the drifts of fixed base building will be larger than that of the isolated base building. Finally, the time history method in the seismic design will produce base shear less than that from equivalent static method, so calibration factor for de- sign purpose shall be used. A R T I C L E I N F O Article history: Received 20 April 2020 Revised 21 May 2020 Accepted 3 June 2020 Keywords: Nonlinear time history analysis Isolated base Fixed base Spectral acceleration UBC-97 1. Introduction Loads are transferred from vertical structural ele- ments to the soil by foundations. The foundations repre- sent the upper layer of the earth. The condition of soil under foundations may be assumed as an important fac- tor in the seismic analysis and design of structures. The engineering codes such as the Uniform Building Code 97 (UBC-97, 1997) and the International Building Code (IBC) have been classified soil according to its stiffness. In UBC-97, the soil is classified into 6 categories: 1) hard rock (SA), 2) rock (SB), 3) very dense soil and soft rock (SC), 4) stiff soil profile (SD), 5) soft soil profile (SE), 6) very soft soil which requiring site-specific anal- ysis (SF). (UBC-97, 1997). During the earthquake, the deformation and vibration of the soil under the footings of the building cause the structure to vibrate and floors to move which produce base shear, base moment, and lateral displacement of slabs (Sayani and Ryan, 2009; Hatami, 2015). Researchers (Sayani and Ryan, 2009; Hatami, 2015; Hassan et al., 2018) have tried to study the effect of soil- structure interaction on the seismic response of struc- tures. They found that the interaction between soil and structure play major role especially in the results of nat- ural frequency of building and in the energy dissipation. Conflicting assumptions in design process are found be- tween structural engineers who assume flexible struc- tures on rigid foundations and geotechnical engineers who assume flexible foundations supporting rigid struc- tures (Touqan, 2008). Researchers found that the dam- ages which occur during the earthquake are not in the same pattern for buildings which locate in the same re- gion, and same earthquake magnitude (Jayalekshmi et al., 2016). It means that there are some factors which affect the shape of damage of structures like: soil condition under foundations, structural system of plans, building mass and stiffness and vertical irregularities of buildings (Gjorgjiev, 2012; Magade et al., 2008).
Transcript of Comparison between fixed base and isolated base in seismic ...

CHALLENGE JOURNAL OF STRUCTURAL MECHANICS 6 (4) (2020) 204–214
* Corresponding author. E-mail address: [email protected] (A. M. Fares)
ISSN: 2149-8024 / DOI: https://doi.org/10.20528/cjsmec.2020.04.005
Case Study
Comparison between fixed base and isolated base
in seismic response of high-rise buildings: a case study
Anas M. Fares a,*
a Department of Civil Engineering, Faculty of Engineering, Necmettin Erbakan University, 42140 Konya, Turkey
A B S T R A C T
In this study, the influence of soil condition under the isolated and fixed bases is stud-ied by using ETABS 16 software for a high-rise regular building. A regular building
with 10 floors is modeled and the results are obtained for story displacements, story
shear forces and spectral acceleration according to the Uniform Building Code 97
(UBC-97) code. The time history analysis has been performed by using 1999 Izmit
earthquake record. 3 types of soil which have different stiffnesses are considered in
this study. The results show that the value of the base shear increases when the soil stiffness decreases. It also noticed that the spectral acceleration is larger in soft soil
condition than that of other soil conditions; and this confirms that the structural re-
sponse spectrum depends on the soil condition. In addition, when using base isolated
building the drift of lower floors will be larger than that of using base isolated, but in
the upper floors the drifts of fixed base building will be larger than that of the isolated
base building. Finally, the time history method in the seismic design will produce
base shear less than that from equivalent static method, so calibration factor for de-
sign purpose shall be used.
A R T I C L E I N F O
Article history:
Received 20 April 2020
Revised 21 May 2020
Accepted 3 June 2020 Keywords:
Nonlinear time history analysis
Isolated base
Fixed base
Spectral acceleration
UBC-97
1. Introduction
Loads are transferred from vertical structural ele-ments to the soil by foundations. The foundations repre-sent the upper layer of the earth. The condition of soil under foundations may be assumed as an important fac-tor in the seismic analysis and design of structures. The engineering codes such as the Uniform Building Code 97 (UBC-97, 1997) and the International Building Code (IBC) have been classified soil according to its stiffness. In UBC-97, the soil is classified into 6 categories: 1) hard rock (SA), 2) rock (SB), 3) very dense soil and soft rock (SC), 4) stiff soil profile (SD), 5) soft soil profile (SE), 6) very soft soil which requiring site-specific anal-ysis (SF). (UBC-97, 1997). During the earthquake, the deformation and vibration of the soil under the footings of the building cause the structure to vibrate and floors to move which produce base shear, base moment, and lateral displacement of slabs (Sayani and Ryan, 2009; Hatami, 2015).
Researchers (Sayani and Ryan, 2009; Hatami, 2015; Hassan et al., 2018) have tried to study the effect of soil-structure interaction on the seismic response of struc-tures. They found that the interaction between soil and structure play major role especially in the results of nat-ural frequency of building and in the energy dissipation. Conflicting assumptions in design process are found be-tween structural engineers who assume flexible struc-tures on rigid foundations and geotechnical engineers who assume flexible foundations supporting rigid struc-tures (Touqan, 2008). Researchers found that the dam-ages which occur during the earthquake are not in the same pattern for buildings which locate in the same re-gion, and same earthquake magnitude (Jayalekshmi et al., 2016).
It means that there are some factors which affect the shape of damage of structures like: soil condition under foundations, structural system of plans, building mass and stiffness and vertical irregularities of buildings (Gjorgjiev, 2012; Magade et al., 2008).

Fares / Challenge Journal of Structural Mechanics 6 (4) (2020) 204–214 205
Nomenclature
𝐶𝑎 acceleration seismic coefficient
𝐶𝑣 velocity seismic coefficient
𝑉 total base shear
𝑅 overstrength factor
𝐼 importance factor of the building
𝑊 total weight of the building
𝑇 fundamental period of the building
𝐹𝑦 yielding strength of steel
𝑓𝑐′ concrete compressive strength
ℎ height of the building
𝐶𝑡 coefficient of period depending on the lateral resisting system
𝑓𝑖 lateral force at level i of the floor
𝛿𝑖 elastic deflection due to lateral force at level i of the floor
𝑔 gravity acceleration
𝑤𝑖 weight at level i of the floor
It is thus of prime importance to quantify the effect of
soil condition beneath the foundation on the dynamic performance of the building. To conduct this study the popular commercial finite element program, ETABS16
software, has been used by running nonlinear time his-tory analysis (CSI, 2017). Then, the seismic response of the building which is provided by fixed base and isolated base of the structure at 3 different soil type conditions according to UBC-97 will be discussed. The soil profiles are: hard rock (SA), very dense soil and soft rock (SC) and soft soil profile (SE).
When using UBC-97 code, the seismic coefficient Ca and Cv shall be found from code tables for a specific seis-mic zone (Z). In this paper and for seismic zone Z=0.30, the Ca and Cv are found and summarized in Table 1. The reasons for using the same seismic zone are to compare the results of the three different soil types at that same zone. Moreover, to study the effect of the stiffness of soil on the seismic response of the high buildings in both fixed bases and isolated bases conditions.
Fig. 1 shows the UBC-97 response spectrum curve for the previous types of soil.
Table 1. Seismic coefficient.
Z=0.30
Soil type Ca Cv
SA 0.24 0.24
SC 0.33 0.45
SE 0.36 0.84
Fig. 1. UBC-97 response spectrum curve.
2. Modeling of the Building
In this study, ETABS 16 has been used as a commer-cial Finite Element software. The nonlinear time history analysis is conducted. The slabs are modeled as 2D shell-thin members. The beams and columns are modeled as 1D line members. The results from the program will show the performance levels and the behavior of the buildings.
10 floors are simulated and Uniform Building Code 1997 (UBC-97) is taken into consideration. All input data for materials properties, reinforced concrete sections, and type of loads as given in Table 2.
Isolator characteristics are as described and calcu-lated at the book of Kelly and Naeim (Kelly J. and Naeim F., Design of seismic isolated structures, 1999) and Table 3 summarizes the final results. The isolator which used in the model will be the same for all columns and de-pending on the maximum axial load in the building. This
206 Fares / Challenge Journal of Structural Mechanics 6 (4) (2020) 204–214
assumption is used to simplify the modeling process and to make the analysis as fast as possible. The structural system is chosen to be special moment resisting frames.
Fig. 2 shows the modeled columns layout, while Fig. 3 shows the 3D view of the building as modeled in ETABS 16. The building is assumed to be regular in the both main directions, because this type of building behaves more safely during the earthquake. Moreover, using this assumption leads to simplifying the modeling process and it reduces the time which is required to analyze the model using nonlinear time history analysis.
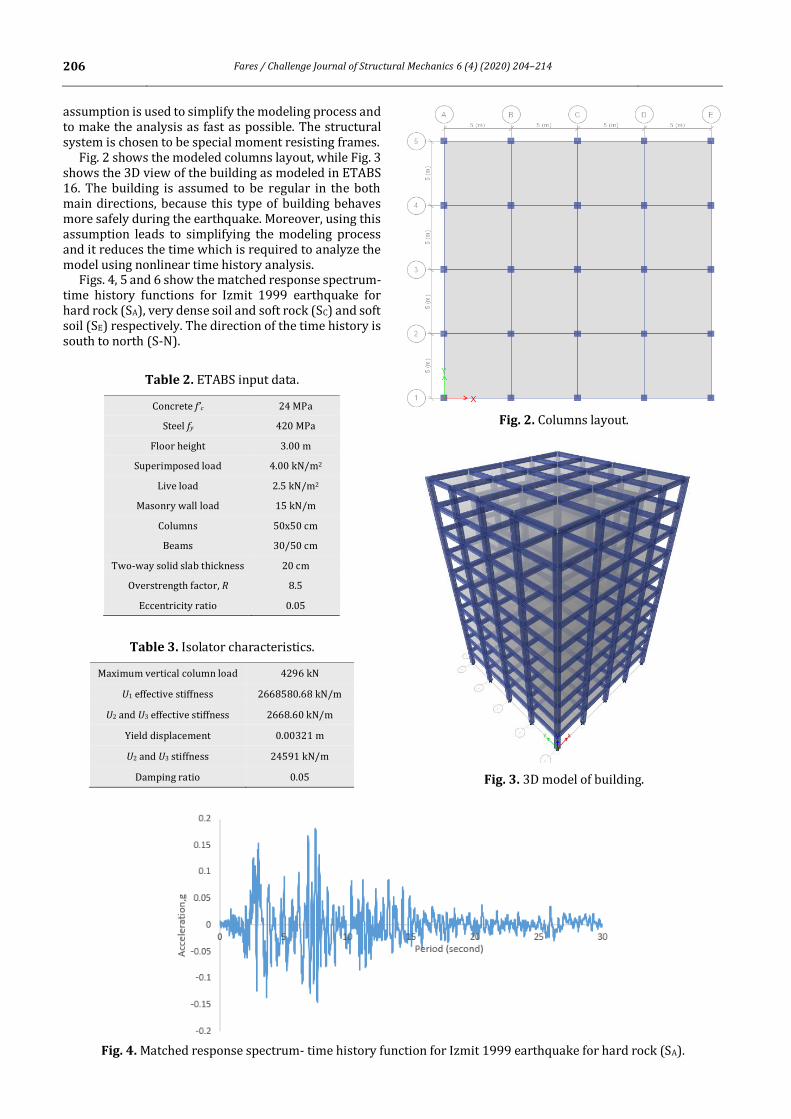
Figs. 4, 5 and 6 show the matched response spectrum- time history functions for Izmit 1999 earthquake for hard rock (SA), very dense soil and soft rock (SC) and soft soil (SE) respectively. The direction of the time history is south to north (S-N).
Table 2. ETABS input data.
Concrete f’c 24 MPa
Steel fy 420 MPa
Floor height 3.00 m
Superimposed load 4.00 kN/m2
Live load 2.5 kN/m2
Masonry wall load 15 kN/m
Columns 50x50 cm
Beams 30/50 cm
Two-way solid slab thickness 20 cm
Overstrength factor, R 8.5
Eccentricity ratio 0.05
Table 3. Isolator characteristics.
Maximum vertical column load 4296 kN
U1 effective stiffness 2668580.68 kN/m
U2 and U3 effective stiffness 2668.60 kN/m
Yield displacement 0.00321 m
U2 and U3 stiffness 24591 kN/m
Damping ratio 0.05
Fig. 2. Columns layout.
Fig. 3. 3D model of building.
Fig. 4. Matched response spectrum- time history function for Izmit 1999 earthquake for hard rock (SA).

Fares / Challenge Journal of Structural Mechanics 6 (4) (2020) 204–214 207
Fig. 5. Matched response spectrum- time history function for Izmit 1999 earthquake for very dense soil and soft rock (SC).
Fig. 6. Matched response spectrum- time history function for Izmit 1999 earthquake for soft soil (SE).
3. Verification of the Analysis
When using any finite element program, it is much im-portant to verify the analysis results which will obtain. The verifications can be found as a percentage of differ-ence between hand calculation and program results (Al-najajra et al., 2017). This difference shall not be greater than a certain value which described in the ETABS man-ual. The results of the static analysis are proved accord-ing to CSI (2017): 1. The condition of compatibility: Where all members in
the model should be connected and move together with no gaps. Fig. 7 shows the satisfaction of this con-dition from the dead load deflected shape.
2. The condition of equilibrium: Where the applied loads shall be equal to the reaction loads from the analysis; If it is not, then a difference between program results and manual results should be less than or equal to 5% to be accepted. This condition is satisfied as shown in Table 4.
3. The stress strain relationship: Where the internal forces such as bending moment, shear and axial forces from program results should be equal to the manual results; If it is not, then an acceptable difference be-tween program results and manual results should be less than or equal to 10% . This condition is satisfied by finding axial load in a specific column as shown in Fig. 8 and Table 5.
Fig. 7. 3D deflection shape from dead load.

208 Fares / Challenge Journal of Structural Mechanics 6 (4) (2020) 204–214
Table 4. Check for the balance of forces.
Item ETABS results
Manual results
Difference (%)
Weight of the structure (kN)
28737.50 29187.50 1.54
Superimposed dead load (kN)
28000 28000 0.00
Live load (kN) 10000 10000 0.00
Fig. 8. Location of the checked columns.
4. Results of the Building Analysis
After analyzing the models, the results are obtained and curves are drawn.
4.1. Story displacement
Fig. 9 shows the floors top displacement results for both conditions of isolated base (IB) and fixed base (FB) for soil SA for Time History Analysis in X direction. Due to the symmetry of the building the THA results are the same for both X direction and Y direction. Fig. 10 shows the same but for medium soil SC and for soft soil SE Fig. 11.
Tables 6, 7 and 8 show the difference between floors top displacements according to fixed base and isolated base for soil SA, SC and SA respectively. The differences are calculated with respect to fixed base condition.
As shown in the following figures and tables, the soil stiffness is playing a major role in the lateral displace-ment of each floor in the building. When the soil stiffness is very strong as in SA case, then the lateral displacement value of floors will be small comparing to the other cases such as SC and SE soils. This result can make advice to en-gineers to construct buildings on a hard soil such as rock, and to avoid build structures on a weak soil.
Also, when using base isolated buildings, the first floor lateral displacement value shall be more than that of the fixed base building and if you move away from the footing, the lateral displacement of floors of fixed base will be larger than the base isolated buildings, and this trend is the same for all type of soil cases.
In general, it can be illustrated that base isolated gives lateral displacement more than that of fixed base, and this will produce flexible structures.
Table 5. Check for the axial load internal force.
Columns position
Item ETABS results
Manual results
Difference (%)
Internal Dead load (kN) 1646.50 1662.50 0.97
Internal Superimposed load (kN) 994.87 1000 0.51
Internal Live load (kN) 628 625 0.47
Edge Dead load (kN) 965.22 981.25 1.66
Edge Superimposed load (kN) 1223.93 1250 2.13
Edge Live load (kN) 312.86 312.50 0.11
Corner Dead load (kN) 586.09 612.50 4.50
Corner Superimposed load (kN) 968.26 1000 3.27
Corner Live load (kN) 147.69 156.25 5.79

Fares / Challenge Journal of Structural Mechanics 6 (4) (2020) 204–214 209
Fig. 9. Floor displacements for hard rock (SA).
Table 6. Variation of floor displacement for hard rock (SA).
Floor number
Floor displacement for FB (mm)
Floor displacement for IB (mm)
Difference (%)
1 5.59 21.70 288.02
2 15.70 29.81 89.91
3 26.51 37.46 41.32
4 36.82 44.41 20.62
5 46.13 50.05 8.50
6 54.20 54.30 0.19
7 60.86 57.57 -5.41
8 66.02 60.31 -8.64
9 69.64 62.63 -10.07
10 71.85 64.27 -10.54
Fig. 10. Floor displacements for medium soil (SC).

210 Fares / Challenge Journal of Structural Mechanics 6 (4) (2020) 204–214
Table 7. Variation of floor displacement for medium soil (SC).
Floor number
Floor displacement for FB (mm)
Floor displacement for IB (mm)
Difference (%)
1 8.08 33.90 319.62
2 22.67 45.57 100.96
3 38.29 56.09 46.48
4 53.18 65.69 23.52
5 66.63 73.9 10.97
6 78.29 80.75 3.15
7 87.91 86.40 -1.72
8 95.36 91.09 -4.48
9 100.59 94.72 -5.84
10 103.78 97.12 -6.41
Fig. 11. Floor displacements for soft soil (SE).
Table 8. Variation of floor displacement for soft soil (SE).
Floor number
Floor displacement for FB (mm)
Floor displacement for IB (mm)
Difference (%)
1 8.77 37.15 323.48
2 24.62 49.83 102.38
3 41.58 61.23 47.25
4 57.75 71.66 24.08
5 72.36 80.69 11.51
6 85.02 88.21 3.75
7 95.47 94.45 -1.07
8 103.56 99.58 -3.84
9 109.24 103.50 -5.26
10 103.78 97.12 -6.41
Fares / Challenge Journal of Structural Mechanics 6 (4) (2020) 204–214 211
4.2. Story shear
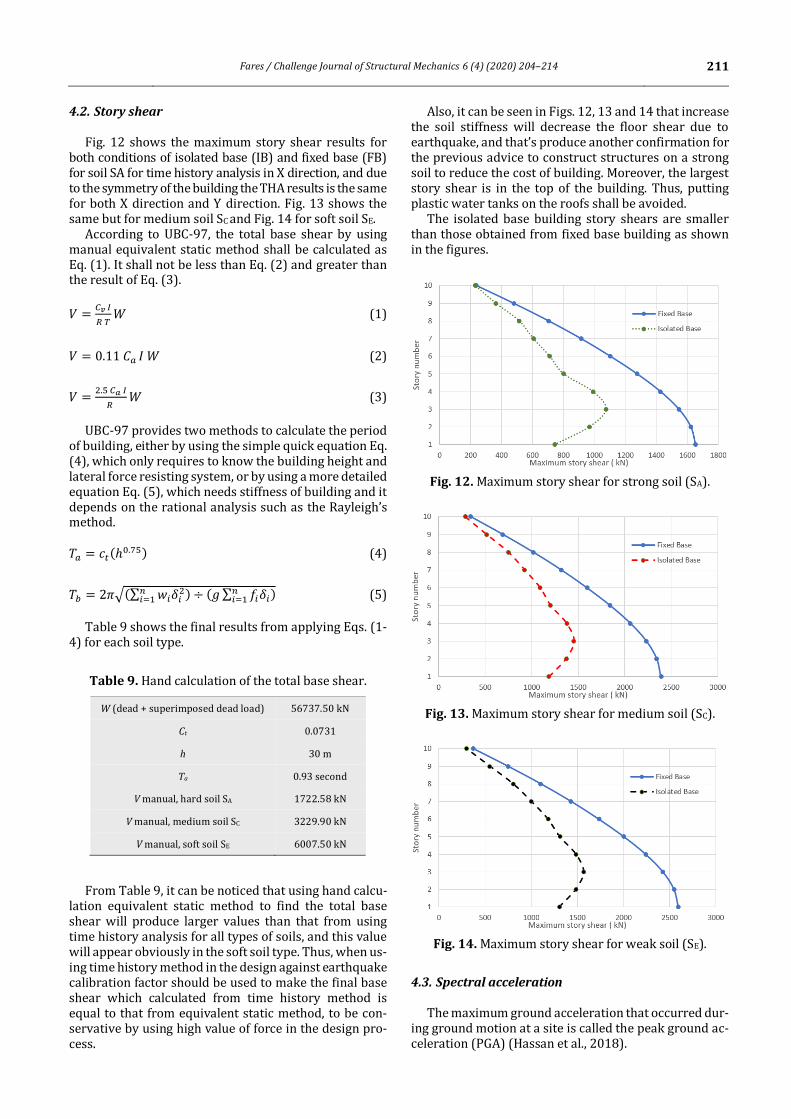
Fig. 12 shows the maximum story shear results for both conditions of isolated base (IB) and fixed base (FB) for soil SA for time history analysis in X direction, and due to the symmetry of the building the THA results is the same for both X direction and Y direction. Fig. 13 shows the same but for medium soil SC and Fig. 14 for soft soil SE.
According to UBC-97, the total base shear by using manual equivalent static method shall be calculated as Eq. (1). It shall not be less than Eq. (2) and greater than the result of Eq. (3).
𝑉 =𝐶𝑣 𝐼
𝑅 𝑇𝑊 (1)
𝑉 = 0.11 𝐶𝑎 𝐼 𝑊 (2)
𝑉 =2.5 𝐶𝑎 𝐼
𝑅 𝑊 (3)
UBC-97 provides two methods to calculate the period of building, either by using the simple quick equation Eq. (4), which only requires to know the building height and lateral force resisting system, or by using a more detailed equation Eq. (5), which needs stiffness of building and it depends on the rational analysis such as the Rayleigh’s method.
𝑇𝑎 = 𝑐𝑡(ℎ0.75) (4)
𝑇𝑏 = 2𝜋√(∑ 𝑤𝑖𝛿𝑖2𝑛
𝑖=1 ) ÷ (𝑔 ∑ 𝑓𝑖𝛿𝑖𝑛𝑖=1 ) (5)
Table 9 shows the final results from applying Eqs. (1- 4) for each soil type.
Table 9. Hand calculation of the total base shear.
W (dead + superimposed dead load) 56737.50 kN
Ct 0.0731
h 30 m
Ta 0.93 second
V manual, hard soil SA 1722.58 kN
V manual, medium soil SC 3229.90 kN
V manual, soft soil SE 6007.50 kN
From Table 9, it can be noticed that using hand calcu-lation equivalent static method to find the total base shear will produce larger values than that from using time history analysis for all types of soils, and this value will appear obviously in the soft soil type. Thus, when us-ing time history method in the design against earthquake calibration factor should be used to make the final base shear which calculated from time history method is equal to that from equivalent static method, to be con-servative by using high value of force in the design pro-cess.
Also, it can be seen in Figs. 12, 13 and 14 that increase the soil stiffness will decrease the floor shear due to earthquake, and that’s produce another confirmation for the previous advice to construct structures on a strong soil to reduce the cost of building. Moreover, the largest story shear is in the top of the building. Thus, putting plastic water tanks on the roofs shall be avoided.
The isolated base building story shears are smaller than those obtained from fixed base building as shown in the figures.
Fig. 12. Maximum story shear for strong soil (SA).
Fig. 13. Maximum story shear for medium soil (SC).
Fig. 14. Maximum story shear for weak soil (SE).
4.3. Spectral acceleration
The maximum ground acceleration that occurred dur-ing ground motion at a site is called the peak ground ac-celeration (PGA) (Hassan et al., 2018).

212 Fares / Challenge Journal of Structural Mechanics 6 (4) (2020) 204–214
During the earthquake the largest absolute accelera-tion amplitude recorded on an accelerogram at a studied location equals the PGA. Earthquakes usually occur in all three directions (Hatami, 2015). So, PGA can be compo-nents in horizontal and vertical. In general, the horizon-tal PGAs direction are larger than the vertical direction. Therefore, in engineering applications, the peak horizon-tal acceleration (PHA) is the most frequently used.
Fig. 15 shows isolated base building spectral acceler-ation for the three cases of soil: hard, medium, and soft for 0.05 damping ratio. It can be noticed that the maxi-mum spectral acceleration values can be produced by
soft soil and this will give maximum shear force in build-ing. The maximum values of spectral acceleration are 1545.29 mm/second2, 2155.10 mm/second2 and 2304.52 mm/second2 for hard soil, medium soil, and soft soil respectively.
As it is seen in Fig. 16, it is found that the increasing percentage of spectral acceleration values obtained by considering the hard soil condition is 39.46% when com-paring to the medium soil condition, and 49.13% when comparing to the soft soil condition. So, as it is found, the soft soil condition produces higher acceleration as com-pared to other type of soils.
Fig. 15. Spectral acceleration.
Figs. 16, 17 and 18 show comparison between iso-lated and fixed base building in term of maximum values of spectral acceleration for three cases of soil. In these figures the maximum values of spectral acceleration for isolated and fixed base respectively are; 1545.29 mm/s2, 3150.91 mm/s2 in case of hard soil, and 2155.10 mm/s2, 4551.32 mm/s2 in case of medium soil. The increasing in
spectral acceleration will be in the case of soft soil, the values are 2304.52 mm/s2 for isolate base condition and 4942.61 mm/s2 for fixed base condition. As it is noticed in the three cases of soil, the fixed base model’s spectral acceleration values are greater than that in isolated base models. Thus, the design base shear of fixed base build-ing will be larger than isolated base building.
Fig. 16. Spectral acceleration for hard soil.

Fares / Challenge Journal of Structural Mechanics 6 (4) (2020) 204–214 213
Fig. 17. Spectral acceleration for medium soil.
Fig. 18. Spectral acceleration for soft soil.
5. Conclusions
This study is an investigation in the seismic perfor-mance of an isolated and fixed base regular buildings un-der different soil conditions according to UBC-97. 10-floors high-rise building with an isolated base and fixed base has been studied for three types of soil: hard, me-dium and soft soil conditions according to UBC-97 code. Nonlinear time history analysis has been carried out us-ing ETABS16 software and Izmit 1999 earthquake. Story displacements, story shear force and roof spectral accel-eration have been studied. The main results and conclu-sions in this study as follows: Story shear force value increases when the soil stiff-
ness decreases. It is found that the value of shear force will be the highest for soft soil and the lowest for hard soil type.
Using equivalent static method will produce a total base shear larger than that by using time history anal-ysis, and this appears clearly when reducing the stiff-ness of the soil.
When using time history method in the seismic de-sign, calibration factor shall be used to make the final base shear value from time history method equaled to that from equivalent static method.
The roof level spectral acceleration of an isolated base model increases in medium soil condition by 39.46% and 49.13%in soft soil condition when compared with hard soil.
Soft soil conditions produced the largest displace-ment compared with hard soil and medium soil.
The first-floor lateral displacement value will be more than that of the fixed base building when using base isolated buildings. But if you move away from the foun-dations, the lateral displacement of floors of fixed base will be larger than that of the base isolated buildings, and this trend is the same for all types of soil cases.
When using base isolated building, the drift of lower floors will be larger than that of the case of base iso-lated; but in the upper floors the drifts of fixed base building will be larger than that of the isolated base building.
214 Fares / Challenge Journal of Structural Mechanics 6 (4) (2020) 204–214
REFERENCES
Alnajajra H, Touqan A (2017). The effect of reducing superimposed
dead load on the lateral seismic deformations of structures. Inter-
national Journal of Civil and Environmental Engineering, 11, 1587–1593.
CSI (2017). CSI Analysis Reference Manual. Computers and Structures
Inc., Berkeley. Gjorgjiev I (2012). Effects of soil medium on response of base isolated
multistory frame structures. 15th World Conference on Earthquake
Engineering, Lisbon, Portugal. Hassan A, Pal S (2018). Effect of soil condition on seismic response of
isolated base buildings. International Journal of Advanced Struc-
tural Engineering, 10, 249–261. Hatami F (2015). Effects of soil-structure interaction on the seismic re-
sponse of base isolated in high-rise buildings. International Journal
of Structural and Civil Engineering Research, 4(3), 237–242. Jayalekshmi BR, Chinmayi HK (2016). Effect of soil stiffness on seismic
response of reinforced concrete buildings with shear walls. Innova-
tive Infrastructure Solutions, 1(1), 2. Kelly J, Naeim F (1999). Design of Seismic Isolated Structures, 1st edn.
John Wiley & Sons Inc., USA.
Magade SB, Patankar JP (2008). Effect of soil structure interaction on the dynamic behavior of buildings. Second International Conference
on Emerging Trends in Engineering (SICETE). IOSR
Journal of Mechanical and Civil Engineering, Pune, 9–14. Sayani PJ, Ryan KL (2009). Comparative evaluation of base-isolated
and fixed-base buildings using a comprehensive response index.
Journal of Structural Engineering, 135(6), 1141–1160. Touqan AR (2008). Three dimensional response spectrum soil struc-
ture modeling versus conceptual understanding to illustrate seis-
mic response of structures. 2008 Seismic Engineering Conference Commemorating the 1908 Messina and Reggio Calabria Earthquake,
American Institute of Physics.
UBC-97 (1997). Uniform Building Code: Structural Engineering Design Provisions. International Conference of Building Officials, Whittier,
California.