Comparing the effects of dynamic computer visualization on ...
21
RESEARCH Open Access Comparing the effects of dynamic computer visualization on undergraduate students’ understanding of osmosis with randomized posttest-only control group design Shannon Hsianghan-Huang Sung 1* , Ji Shen 2 , Shiyan Jiang 3 and Guanhua Chen 3 * Correspondence: [email protected] 1 Assistant Professor, Education Department, Spelman College, 350 Spelman Lane, Atlanta, GA 30314, USA Full list of author information is available at the end of the article Abstract This study describes the impact of embedding dynamic computer visualization (DCV) in an online instrument that was designed to assess students’ understanding of osmosis. The randomized posttest-only control group research was designed to compare the effect and the perceived helpfulness of the integration of DCV before and after the administration of an osmosis instrument. College students from three large classes ( N = 640) were randomly assigned to participate in the research through an online system. Rasch-PCM was applied to determine the psychometric properties of the instrument and differentiate the student’ s understanding of osmosis. Welch two-sample t test was applied to examine whether there was significant discrepancy between groups. Multiple regressions analysis was conducted to evaluate the association between predictors and the student’ s understanding level, alluding to the performance on the online instrument. We found (a) the psychometric properties of the instrument with DCVs were reliable with good construct validity, (b) students who viewed DCV before they took the assessment performed better than those without, especially on solvation-related items, (c) students’ time spent on the DCVs significantly contributed to their performance, (d) the current data analytics enabled us to study respondents’ DCV navigation behavior, and (e) we summarized how participants perceived DCVs that are in the assessment. Educational implications and significance of this study is also discussed. Keywords: Dynamic computer visualization, Osmosis, Online assessment, Item response theory, Data analytics, Navigation behavior Introduction A growing number of reforms and studies stress on the practice of deepening learners’ understanding of dynamic interaction in natural phenomena (Chiu and Linn 2014; NGSS Lead States 2013; Smetana and Bell 2012; Wu et al. 2010). Demand to integrate advanced educational technologies to model or represent natural science systems in action, thus, is also increasing in this decade (Cook 2006; Marbach-Ad et al. 2008; Quellmalz et al. 2012; Xie and Tinker 2006). Incorporating dynamic computer visualization (DCV) in instruction on students’ science learning has been documented © The Author(s). 2017 Open Access This article is distributed under the terms of the Creative Commons Attribution 4.0 International License (http://creativecommons.org/licenses/by/4.0/), which permits unrestricted use, distribution, and reproduction in any medium, provided you give appropriate credit to the original author(s) and the source, provide a link to the Creative Commons license, and indicate if changes were made. Sung et al. Research and Practice in Technology Enhanced Learning (2017) 12:26 DOI 10.1186/s41039-017-0067-3
Transcript of Comparing the effects of dynamic computer visualization on ...
RESEARCH Open Access
Comparing the effects of dynamiccomputer visualization on undergraduatestudents’ understanding of osmosis withrandomized posttest-only control groupdesignShannon Hsianghan-Huang Sung1*, Ji Shen2, Shiyan Jiang3 and Guanhua Chen3
* Correspondence:[email protected] Professor, EducationDepartment, Spelman College, 350Spelman Lane, Atlanta, GA 30314,USAFull list of author information isavailable at the end of the article
Abstract
This study describes the impact of embedding dynamic computer visualization (DCV) inan online instrument that was designed to assess students’ understanding of osmosis. Therandomized posttest-only control group research was designed to compare the effect andthe perceived helpfulness of the integration of DCV before and after the administration ofan osmosis instrument. College students from three large classes (N = 640) were randomlyassigned to participate in the research through an online system. Rasch-PCM was appliedto determine the psychometric properties of the instrument and differentiate the student’sunderstanding of osmosis. Welch two-sample t test was applied to examine whether therewas significant discrepancy between groups. Multiple regressions analysis was conductedto evaluate the association between predictors and the student’s understanding level,alluding to the performance on the online instrument. We found (a) the psychometricproperties of the instrument with DCVs were reliable with good construct validity, (b)students who viewed DCV before they took the assessment performed better than thosewithout, especially on solvation-related items, (c) students’ time spent on the DCVssignificantly contributed to their performance, (d) the current data analytics enabled us tostudy respondents’ DCV navigation behavior, and (e) we summarized how participantsperceived DCVs that are in the assessment. Educational implications and significance ofthis study is also discussed.
Keywords: Dynamic computer visualization, Osmosis, Online assessment, Item responsetheory, Data analytics, Navigation behavior
IntroductionA growing number of reforms and studies stress on the practice of deepening learners’
understanding of dynamic interaction in natural phenomena (Chiu and Linn 2014;
NGSS Lead States 2013; Smetana and Bell 2012; Wu et al. 2010). Demand to integrate
advanced educational technologies to model or represent natural science systems in
action, thus, is also increasing in this decade (Cook 2006; Marbach-Ad et al. 2008;
Quellmalz et al. 2012; Xie and Tinker 2006). Incorporating dynamic computer
visualization (DCV) in instruction on students’ science learning has been documented
© The Author(s). 2017 Open Access This article is distributed under the terms of the Creative Commons Attribution 4.0 InternationalLicense (http://creativecommons.org/licenses/by/4.0/), which permits unrestricted use, distribution, and reproduction in any medium,provided you give appropriate credit to the original author(s) and the source, provide a link to the Creative Commons license, andindicate if changes were made.
Sung et al. Research and Practice in Technology Enhanced Learning (2017) 12:26 DOI 10.1186/s41039-017-0067-3
in abundant studies (e.g., Brunye et al. 2004; Chiu and Linn 2014; Jensen et al. 1996;
Ryoo and Linn 2012; Sanger et al. 2001; Smetana and Bell 2012).
With the development of technology-enhanced activities and curricula, conventional
ways of assessing students’ knowledge gradually become inadequate to precisely deter-
mine their understanding about the dynamic interactions of science systems (Marbach-
Ad et al. 2008; Quellmalz et al. 2012; Wu et al. 2010). Unlike DCV (e.g., Molecular Work-
bench, Xie and Pallant 2011; PhET, Wieman et al. 2008), text or static visualizations used
in a traditional assessment instrument are less likely to elicit higher-level molecular rea-
soning for the dynamic nature of phenomena (Jensen et al. 1996; Marbach-Ad et al. 2008;
McElhaney et al. 2015; Levy 2013; Pedrosa and Dias 2000; Smetana and Bell 2012).
To address the potential assessment gap, emerging technologies have enabled the in-
tegration and administration of a measurement instrument that captures complex
learning processes (Linn and Eylon 2011; Quellmalz and Pellegrino 2009). The ad-
vancement of technology also has the affordance of documenting users’ behavior in
using the designated means (e.g., animation, inquiry learning tools, simulation) when
progressing along with the online assessment (Ryoo and Linn 2012; Ryoo and Bedell
2017). Nevertheless, very little research has examined the measure and impact of in-
corporating DCV in assessing students’ performance on the same instrument (e.g., pilot
study in Wu et al. 2010) and how exactly students utilize DCV during assessment.
Rationale of using dynamic computer visualization for osmosisThe concept of osmosis is listed as one of the most important and difficult concepts
for undergraduate science learning (Shen et al. 2015; Odom and Barrow 1995, 2007;
Sanger et al. 2001). Osmosis is the net movement of water through a selectively perme-
able membrane from a region of lower solute concentration to a region of higher solute
concentration. It is a phenomenon that associates with molecular level interactions that
oftentimes could be observed macroscopically (e.g., U-tube example in Fig. 5). Osmosis
is also critical to various biological processes that are essential to plant water intake,
maintaining cell shapes, water balance and transport in all types of living creatures, and
sustaining a nurturing ecosystem. It is related to many physical and chemical concepts,
such as pressure, solutions, and the particulate nature of matter (Friedler et al. 1987;
Jensen et al. 1996; Sanger et al. 2001).
Osmosis is a poorly understood science concept, despite being an important one
(Shen et al. 2014; Fisher et al. 2011; Odom 1995; Odom and Barrow 1995, 2007). Os-
mosis is oftentimes perceived by students to be only driven by life forces or an input of
energy (Odom 1995), which pertains to the misunderstanding that the whole process is
purpose-driven (e.g., plant cells undergo osmosis in order to prevent from withering or
human drinks water to quench thirst). In fact, the wither-prevention and thirst sensa-
tion is not directed by osmosis but rather the mechanism living creatures developed in
order to consume/uptake water so osmosis can take place. However, studies have regu-
larly suggested that students have retained such misconceptions concerning the mecha-
nisms and processes of osmosis at all levels (Jensen et al. 1996; Kramer and Myers
2012; Odom 1995; Odom and Barrow 1995, 2007; Sanger et al. 2001). Moreover, stu-
dents think that the solvent (i.e., most common one is water) stops moving once the
solution reaches equilibrium and the solute “absorbs” water from areas with low con-
centration (Jensen et al. 1996), just like a sponge.
Sung et al. Research and Practice in Technology Enhanced Learning (2017) 12:26 Page 2 of 21
Studies suggested that even with the assistance of dynamic visualization, learners
may still experience a difficult time comprehending the dynamic and interactive struc-
tures of biological systems (Buckley and Quellmalz 2013; Hmelo-Silver and Pfeffer
2004; Rundgren and Tibell 2010; Tasker and Dalton 2006). The learning obstacle could
be partly attributed to the lack of explicit demonstration concerning how osmosis is ap-
plicable among different systems when dynamic visualizations are introduced and used
(Buckley and Quellmalz 2013). For instance, in our textbook analysis study (Sung et al.
2015), we found that in many textbooks, the classic U-tube experiment was used to
demonstrate and explain osmosis as governed by stringent scientific law (e.g., random
motion of molecules that takes place without external energy input), which is always
carried out in a well-defined, lifeless scenario. In our study, we would like to capture
whether participants find the DCVs helpful in responding to the osmosis items.
The learning challenge might also be caused by their inability to acknowledge “dy-
namic equilibrium,” (Meir et al. 2005) which is closely related to one of the seven
crosscutting concepts summarized in the National Research Council’s (NRC) Frame-
work for K-12 Science Education (2012)—stability and change. The dynamic equilibrium
depicts the ongoing random movement of molecules when the system stabilizes, which
is an essential concept in order to fully acquire understanding of osmotic processes at
the microscopic level. Failing to recognize the dynamic process, students might be
stuck with the macroscopic, static equilibrium example portrayed in the textbooks. The
raised column of solution provides visual reinforcement that osmosis must be sustained
by an external input of energy, just like the static equilibrium example where the “stair
is leaning against the wall” (National Research Council (NRC) 2012).
Many of these misconceptions students have on osmosis will be carried over through
the different stages of education. This does not have to be the case as many of these
misconceptions can be addressed by well-designed DCVs (Meir et al. 2005; Rundgren
and Tibell 2010). For example, a previous study did show that students with DCV ex-
posure were less likely to perceive that particles stopped moving at equilibrium (Sanger
et al. 2001). However, assessment items that include concrete, dynamic representation
of abstract concepts (Wu et al. 2010) and incorporate essential variables that could
draw attention to the target mechanism (Smetana and Bell 2012) are relatively scarce.
In order to address the aforementioned challenges, we developed four short DCVs in an
online assessment instrument to assess the effect of dynamic visualizations on college stu-
dents’ interdisciplinary understanding of osmosis (Shen et al. 2014). The study evaluated
the effect of the integration of DCVs demonstrating molecular movement on the student’s
understanding of osmosis. Specifically, three research questions (RQs) directed the exam-
ination of whether these DCVs imposed any impact on students’ performance:
1. What are the psychometric properties of the instrument with DCVs in assessing
students’ understanding of osmosis?
2. How does the integration of DCVs impact students’ performance on the osmosis
assessment? Specifically, the following two sub-questions were investigated:
(a)What is the difference between treatment group, which interacted with four DCV
clips prior to answering the osmosis survey, as compared to the control group?
(b)What variable(s) (e.g., gender, language, major, time spent on animation or
survey) best predict(s) student understanding of osmosis?
Sung et al. Research and Practice in Technology Enhanced Learning (2017) 12:26 Page 3 of 21
3. How do students use and perceive the DCVs when responding to and reviewing the
assessment?
Due to the highly dynamic interactions among water and solute molecules during osmo-
sis, we believe that the DCVs could visually simulate the interactive nature among water,
solute molecules, and the selectivity of the permeable membrane at the microscopic level.
BackgroundDCV has significantly enriched the ways in which science instruction is delivered (Na-
tional Research Council 2014; Scalise et al. 2011; Yarden and Yarden 2010). One of the
many benefits of DCVs in science instruction is that they are better than static visuali-
zations in serving as conceptual references for complex, dynamic molecular representa-
tions and processes (Marbach-Ad et al. 2008; Smetana and Bell 2012; Savec et al.
2005). Furthermore, recent NRC reports have called for creative ways of incorporating
computer technology including DCV in assessing students’ science understanding and
practices (National Research Council 2014). McElhaney et al. (2015) conducted a meta-
analyses study documenting how dynamic visualization contributes to conceptual
learning and deeper understanding of complicated science topics. They found dynamic
visualization to be most effective in showcasing dynamic processes, e.g., “continuity of
motion” (p. 62), and enhancing learners’ comprehension of target phenomenon (McEl-
haney et al. 2015). They also assessed the use of static and dynamic visualizations in
their analysis and found the latter to be more favorable for inquiry-based and collabora-
tive learning. The merit of dynamic visualization, as summarized in McElhaney et al.’s
article, is most frequently found in effective prompts that tasked learners to contrast
among several components of a phenomenon. Their meta-analysis on the dynamic and
static comparison studies revealed that among the 26 identified articles, only 11 focused
their assessment at the small/particulate level. Our work on the effectiveness of DCVs
at the microscopic level is needed to fill the limited work being conducted.
Ever since the call made by the National Research Council (2014), advancement in in-
corporating DCVs in assessment has been gradually achieved at the classroom level for
formative assessment purposes. For instance, researchers have embedded DCV and as-
sociated assessment items within technology-enhanced curriculum (e.g., Ryoo and Linn
2015; Shen and Linn 2011). Recently, attempts have been made to incorporate DCV in
evidence-centered assessment design, model-based learning, and large-scale state sci-
ence assessment (Quellmalz et al. 2012).
There are at least two major advantages of incorporating DCV in science assessment:
(1) DCVs can provide more concrete contexts to assess the complex/abstract science phe-
nomena (Quellmalz et al. 2012) and (2) the rich information exhibited in DCVs can facili-
tate the assessment of complex learning processes (Quellmalz and Pellegrino 2009).
The effect of incorporating DCV on learners’ conceptual understanding, however, is
contested. That is, the finding in the science-simulation literature review of Scalise et
al. (2011) suggested that 96% of the relevant studies synthesized for secondary school
students’ learning outcomes indicated at least partial learning gains. With the mixed-
result studies considered (i.e., partial no gains and gains reported in the same study in
25.3% articles), there was still 29% reports that indicated partially no learning gains.
Tversky et al.’s (2002) review study also suggested that most of the studies suggested no
Sung et al. Research and Practice in Technology Enhanced Learning (2017) 12:26 Page 4 of 21
apparent advantage of animations. Also, it is difficult to elicit learners’ understanding of
the dynamic nature of scientific phenomenon by means of administering conventional,
text-based, or static visualization assessment. Some studies revealed that proper inte-
gration of DCV during science learning enhanced the student’s conceptual understand-
ing (Ryoo and Linn 2012; Savec et al. 2005); some found either small or no effect with
the inclusion of DCV on performance (Byrne et al. 1999; Höffler and Leutner 2007;
Kim et al. 2007; Tversky et al. 2002), while others only found that the effect was more
obvious under certain conditions (e.g., differential spatial ability (Merchant et al. 2013),
learners with disabilities (Quellmalz et al. 2012)) or enhanced affective attributes that
are not directly related to subject matter performance, such as perceived comprehensi-
bility, interestingness, or motivation (Hwang et al. 2012; Kim et al. 2007). Furthermore,
dynamic visualization and static materials may bring about different learning outcomes,
and some researchers argued that DCVs had no advantages in increasing performance
with recall assessments; however, students’ performance on inference assessment was
typically significantly positive for DCV conditions (e.g., McElhaney et al. 2015).
In light of the mixed and disagreeing findings reporting the effect (or no effect) of
embedded DCVs on students’ conceptual understanding, many of them approached
from the impact of curriculum and instruction perspectives on learning but not the in-
spection of the validity of the assessment instrument or the behavior of the participants
engaged with DCV activities (e.g., Kehoe et al. 2001; McElhaney et al. 2015), we aimed
to develop and validate the assessment instrument that could be used to determine the
effectiveness of DCVs. We adopted a randomized posttest-only control group experi-
ment designed to investigate the effect of incorporating DCVs in an assessment instru-
ment on which students’ performance was examined. We expect students who received
DCVs before they take the osmosis assessment will perform better than those without.
MethodsContext of the study
The research was conducted in a large university in the southeast USA.
The study used a randomized posttest-only control group experiment with a conveni-
ence sample from three classes: biology, physics, and physiology. The students in these
three classes were randomly assigned to two conditions: animation prior to responding
to osmosis survey and animation after responding to osmosis survey.
Participants
Student participants are consisted of 60.8% female and 39.1% male; 30.2% in their
freshman and sophomore year, 64% in their junior and senior year, and 5.8% are fifth
year and beyond; and 89.7% of the respondents use English as their first language and
10.2% reported otherwise.
Assessment instrument
The osmosis survey was constructed by a research team consisting of science content
experts, educational researchers, and psychometricians. The current knowledge assess-
ment was adapted from an earlier one. In the current study, we primarily focused on
Sung et al. Research and Practice in Technology Enhanced Learning (2017) 12:26 Page 5 of 21
the items that especially require students’ deeper understanding of osmosis that con-
nects the molecular level and the macroscopic level.
The present version included 20 multiple-choice items and 13 constructed-response
questions targeting students’ interdisciplinary understanding of osmosis. Table 1 enlists
the five scenarios in the assessment. More details concerning the instrument and item
design can be found in our prior study. (Shen et al. 2014).
The results of our previous survey suggested that students had difficulty in under-
standing the molecular mechanism for solvation and water movement in osmosis (Shen
et al. 2014). Therefore, we developed four short DCVs (total time = 108 s) and incorpo-
rated them in the current survey.
Dynamic computer visualization designDesigning dynamic computer visualization
The DCVs are operationally defined as the computer-based, visual representations
showcasing the dynamic movement and interactions of molecules in the format of ani-
mated video clips. The users can adjust the rate (e.g., forward, pause, reverse) of playing
the DCVs in accordance to the theoretical perspectives (e.g., cognitive load (Chandler
and Sweller 1991)) and multimedia learning (Mayer 2001).
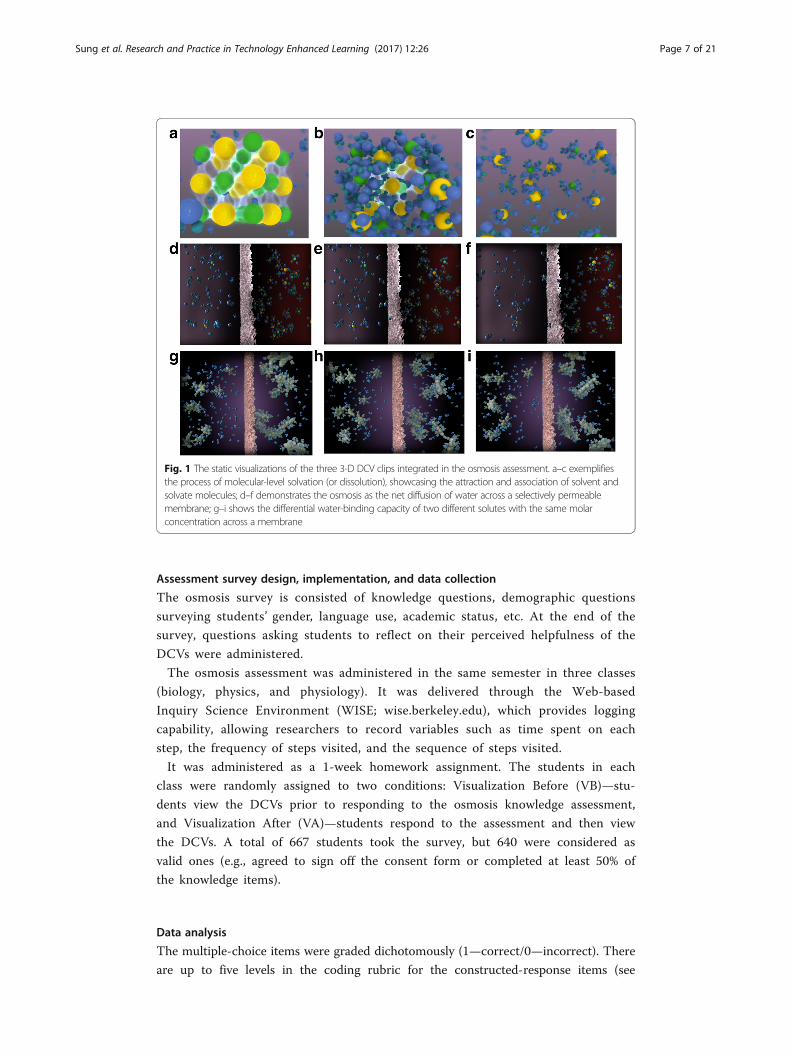
There are four DCVs introduced in the study (see Fig. 1 for the images of the
three 3-D representations made by our team). The first clip (18 s) exemplifies the
process of molecular-level solvation (or dissolution), showcasing the attraction and
association of solvent molecules (e.g., water) with molecules or ions of a solute;
the second clip (49 s) represents the diffusion of the random movement of individ-
ual particles as opposed to the intentional/directional movement of molecules. The
visualization shows that when a dye droplet is added in water, its molecules diffuse
from the region of high concentration of dye to the region of low concentration
and eventually reaches dynamic equilibrium. The third clip (16 s) demonstrates the
osmosis as the net diffusion of water across a selectively permeable membrane.
This visualization shows how osmosis is caused by a solute concentration gradient
and differential solvation capacity to bind water. It creates a concentration gradient of
free water across the membrane. The last visualization (25 s) shows the differential water-
binding capacity of two different solutes with the same molar concentration across a mem-
brane that is only permeable to water. The solute molecules on the right are bigger and can
each bind more water molecules than the ones on the left. This leaves less free water on the
right and creates a concentration gradient of free water molecules across the membrane.
Osmosis still occurs as a result.
Table 1 Scenario of each item sets in the osmosis survey
Item Scenario
Q1.1–1.6 An innovative horizontal tube setup that permits water movement through a membrane
Q2.1–2.9 A U-tube setting that is commonly found in science texts
Q3.1–3.6 Water transportation in trees that is commonly introduced in biology texts
Q4.1–4.5 Fluid relocation in the digestive tract that is commonly introduced in biology texts
Q5.1–5.7 Respiration that involves gas exchange in the lungs that is usually covered in biology texts
Sung et al. Research and Practice in Technology Enhanced Learning (2017) 12:26 Page 6 of 21
Assessment survey design, implementation, and data collection
The osmosis survey is consisted of knowledge questions, demographic questions
surveying students’ gender, language use, academic status, etc. At the end of the
survey, questions asking students to reflect on their perceived helpfulness of the
DCVs were administered.
The osmosis assessment was administered in the same semester in three classes
(biology, physics, and physiology). It was delivered through the Web-based
Inquiry Science Environment (WISE; wise.berkeley.edu), which provides logging
capability, allowing researchers to record variables such as time spent on each
step, the frequency of steps visited, and the sequence of steps visited.
It was administered as a 1-week homework assignment. The students in each
class were randomly assigned to two conditions: Visualization Before (VB)—stu-
dents view the DCVs prior to responding to the osmosis knowledge assessment,
and Visualization After (VA)—students respond to the assessment and then view
the DCVs. A total of 667 students took the survey, but 640 were considered as
valid ones (e.g., agreed to sign off the consent form or completed at least 50% of
the knowledge items).
Data analysis
The multiple-choice items were graded dichotomously (1—correct/0—incorrect). There
are up to five levels in the coding rubric for the constructed-response items (see
Fig. 1 The static visualizations of the three 3-D DCV clips integrated in the osmosis assessment. a–c exemplifiesthe process of molecular-level solvation (or dissolution), showcasing the attraction and association of solvent andsolvate molecules; d–f demonstrates the osmosis as the net diffusion of water across a selectively permeablemembrane; g–i shows the differential water-binding capacity of two different solutes with the same molarconcentration across a membrane
Sung et al. Research and Practice in Technology Enhanced Learning (2017) 12:26 Page 7 of 21
Table 2) (Shen et al. 2014). The inter-rater reliability reached 0.80 after several itera-
tions. Inconsistent coding was resolved during research team meetings.
Item response theory
We applied the Rasch model to analyze the dichotomous data and the Partial Credit
Model (PCM) to analyze polytomous data (i.e., the constructed-response scores) using
the Winsteps 3.0 software (Linacre 2012). In the Rasch model, only item difficulty (b)
and student ability (θ) are considered. In the Rasch model, the probability of the re-
spondent n getting a dichotomous question i right is denoted by the expression:
Pr xn;i ¼ 1jθ; b� � ¼ e θn−bið Þ
1þ e θn−bið Þ
The term (θn − bi) is the log odds or simply called logit. Persons at the same logit
scale have approximately 50% chance of getting the corresponding item(s) correct. Per-
sons positioned at a higher logit scale have greater than 50% chance of responding to
the item right, and vice versa (Glynn 2012). A plot (i.e., Wright map), which provides
information about students’ osmosis understanding (θn) and item difficulty (b) simul-
taneously was constructed. This map is often used to identify the gaps between items
with different difficulty levels. Infit and outfit were inspected in this study. Item infit/
outfit indicates whether students from a high ability group and a low ability group per-
form “normally” as predicted. A large infit value for one item implies that a person’s
ability close to a particular item difficulty level is not consistent with the model’s pre-
diction. A large outfit value for an easy item indicates that a high ability level student
fails to respond to the question correctly, and vice versa. The item parameters, infit/
outfit parameters, and the Wright map were reported.
Welch two-sample t test
A Welch two-sample t test was conducted to evaluate whether students’ performance
on the assessment is different in the two conditions.
Multiple regression
Multiple regression examining what factors contributed to students’ success in solving
the osmosis problems was conducted (see Table 3 for the list of variables). Outliers
(spent over 6000 s on the assessment) were deleted from the multiple regression ana-
lyses. Akaike information criterion (AIC) was used as the criterion to compare model-
fitting results in the model selection algorithm.
Visualize log data
To explore how students in each condition interacted with the assessment, the study
examined log files generated by WISE, which provides a more in-depth analysis on
how students in the two conditions (VA and VB groups) may have navigated through
the activity sequence differently. We selected one representative student from each
condition and analyzed their log data. The first criterion we administered was to select
students who visited the visualization step more than once and also stated that the
visualization was helpful (VB) or could be helpful (VA). We then pulled the individual
logging data along with the scores each one received on the assessment portion and
Sung et al. Research and Practice in Technology Enhanced Learning (2017) 12:26 Page 8 of 21
identified two respondents with comparable scores, one from VA and one from VB.
When respondents interact with the osmosis assessment items, they need to submit
their answers every step and they were not allowed to change their answers after
submission.
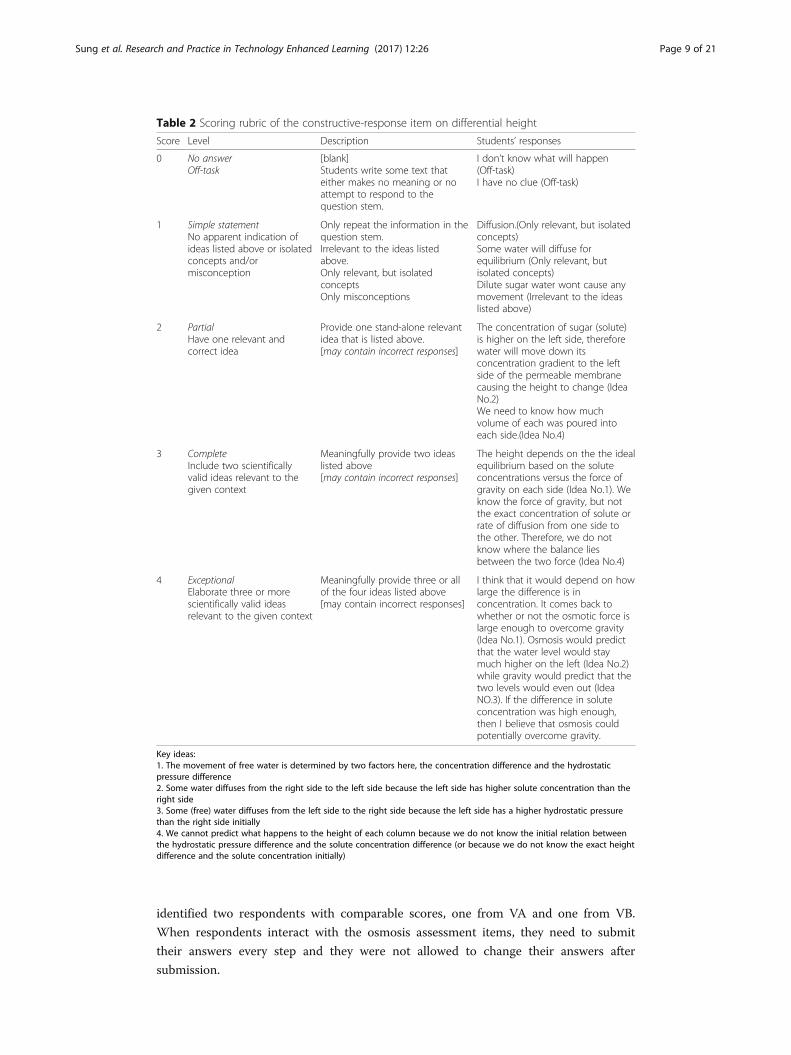
Table 2 Scoring rubric of the constructive-response item on differential height
Score Level Description Students’ responses
0 No answerOff-task
[blank]Students write some text thateither makes no meaning or noattempt to respond to thequestion stem.
I don’t know what will happen(Off-task)I have no clue (Off-task)
1 Simple statementNo apparent indication ofideas listed above or isolatedconcepts and/ormisconception
Only repeat the information in thequestion stem.Irrelevant to the ideas listedabove.Only relevant, but isolatedconceptsOnly misconceptions
Diffusion.(Only relevant, but isolatedconcepts)Some water will diffuse forequilibrium (Only relevant, butisolated concepts)Dilute sugar water wont cause anymovement (Irrelevant to the ideaslisted above)
2 PartialHave one relevant andcorrect idea
Provide one stand-alone relevantidea that is listed above.[may contain incorrect responses]
The concentration of sugar (solute)is higher on the left side, thereforewater will move down itsconcentration gradient to the leftside of the permeable membranecausing the height to change (IdeaNo.2)We need to know how muchvolume of each was poured intoeach side.(Idea No.4)
3 CompleteInclude two scientificallyvalid ideas relevant to thegiven context
Meaningfully provide two ideaslisted above[may contain incorrect responses]
The height depends on the the idealequilibrium based on the soluteconcentrations versus the force ofgravity on each side (Idea No.1). Weknow the force of gravity, but notthe exact concentration of solute orrate of diffusion from one side tothe other. Therefore, we do notknow where the balance liesbetween the two force (Idea No.4)
4 ExceptionalElaborate three or morescientifically valid ideasrelevant to the given context
Meaningfully provide three or allof the four ideas listed above[may contain incorrect responses]
I think that it would depend on howlarge the difference is inconcentration. It comes back towhether or not the osmotic force islarge enough to overcome gravity(Idea No.1). Osmosis would predictthat the water level would staymuch higher on the left (Idea No.2)while gravity would predict that thetwo levels would even out (IdeaNO.3). If the difference in soluteconcentration was high enough,then I believe that osmosis couldpotentially overcome gravity.
Key ideas:1. The movement of free water is determined by two factors here, the concentration difference and the hydrostaticpressure difference2. Some water diffuses from the right side to the left side because the left side has higher solute concentration than theright side3. Some (free) water diffuses from the left side to the right side because the left side has a higher hydrostatic pressurethan the right side initially4. We cannot predict what happens to the height of each column because we do not know the initial relation betweenthe hydrostatic pressure difference and the solute concentration difference (or because we do not know the exact heightdifference and the solute concentration initially)
Sung et al. Research and Practice in Technology Enhanced Learning (2017) 12:26 Page 9 of 21
The log files show how long students interact with each step, the sequence students
follow to visit steps, and the frequency of steps visited. Using the sequence and fre-
quency data from the log files, the study visualized students’ navigation behavior in
both conditions via free library D3.js. The first visualization will depict the overall, cu-
mulative navigation behavior of the respondent from the VA and VB groups, while the
second visualization will illustrate a linear navigation pattern of participants.
Perceived helpfulness
One of the exit questions is a two-tier question that is consisted of an ordinal-format
item eliciting the student’s perceived helpfulness of the animation on their response to
the survey followed by the explanations they provided for the previous Likert question.
For the animation-after-survey group, the question to elicit their perception toward the
helpfulness of the animation was worded slightly different with a multiple-choice
prompt: “How much do you think the visualizations in the previous activity would have
helped you answer some of the survey questions?” also followed by their explanations.
The self-reported Likert-scale item has three levels: not helpful at all, somewhat, and
very much. The variables are listed in Table 4.
Mann-Whitney U test
We analyzed the exit two-tier question inquiring students’ perceptions of the DCVs.
The first part was a Likert-scale item that has three levels: not helpful at all, somewhat,
and very much; the second part was their explanation of why the DCVs (could have)
helped or not. The parenthesis in the prompt was phrased slightly different for
the two groups.
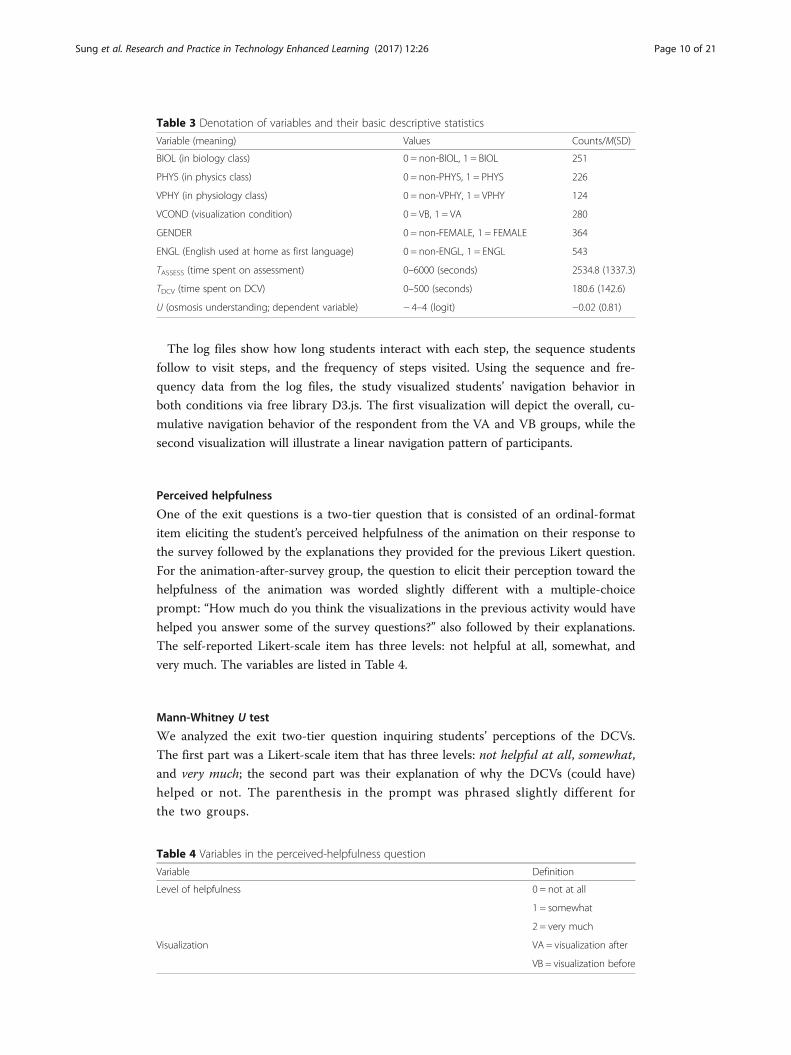
Table 3 Denotation of variables and their basic descriptive statistics
Variable (meaning) Values Counts/M(SD)
BIOL (in biology class) 0 = non-BIOL, 1 = BIOL 251
PHYS (in physics class) 0 = non-PHYS, 1 = PHYS 226
VPHY (in physiology class) 0 = non-VPHY, 1 = VPHY 124
VCOND (visualization condition) 0 = VB, 1 = VA 280
GENDER 0 = non-FEMALE, 1 = FEMALE 364
ENGL (English used at home as first language) 0 = non-ENGL, 1 = ENGL 543
TASSESS (time spent on assessment) 0–6000 (seconds) 2534.8 (1337.3)
TDCV (time spent on DCV) 0–500 (seconds) 180.6 (142.6)
U (osmosis understanding; dependent variable) − 4–4 (logit) −0.02 (0.81)
Table 4 Variables in the perceived-helpfulness question
Variable Definition
Level of helpfulness 0 = not at all
1 = somewhat
2 = very much
Visualization VA = visualization after
VB = visualization before
Sung et al. Research and Practice in Technology Enhanced Learning (2017) 12:26 Page 10 of 21
A Mann-Whiney U test was conducted to evaluate the difference of the Likert-scale
responses between the two conditions. The open-ended responses to the aforemen-
tioned question were reviewed to triangulate with the student’s Likert-scale response
from the VA and VB groups.
Results and DiscussionPsychometrics properties
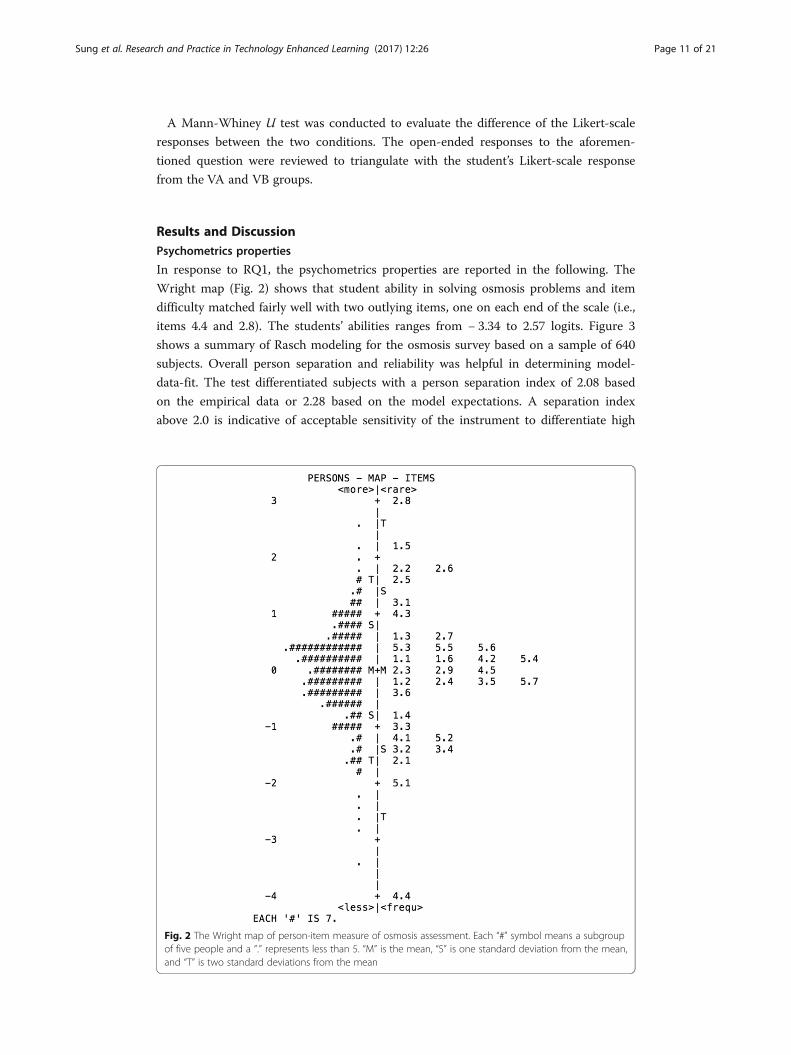
In response to RQ1, the psychometrics properties are reported in the following. The
Wright map (Fig. 2) shows that student ability in solving osmosis problems and item
difficulty matched fairly well with two outlying items, one on each end of the scale (i.e.,
items 4.4 and 2.8). The students’ abilities ranges from − 3.34 to 2.57 logits. Figure 3
shows a summary of Rasch modeling for the osmosis survey based on a sample of 640
subjects. Overall person separation and reliability was helpful in determining model-
data-fit. The test differentiated subjects with a person separation index of 2.08 based
on the empirical data or 2.28 based on the model expectations. A separation index
above 2.0 is indicative of acceptable sensitivity of the instrument to differentiate high
Fig. 2 The Wright map of person-item measure of osmosis assessment. Each “#” symbol means a subgroupof five people and a “.” represents less than 5. “M” is the mean, “S” is one standard deviation from the mean,and “T” is two standard deviations from the mean
Sung et al. Research and Practice in Technology Enhanced Learning (2017) 12:26 Page 11 of 21
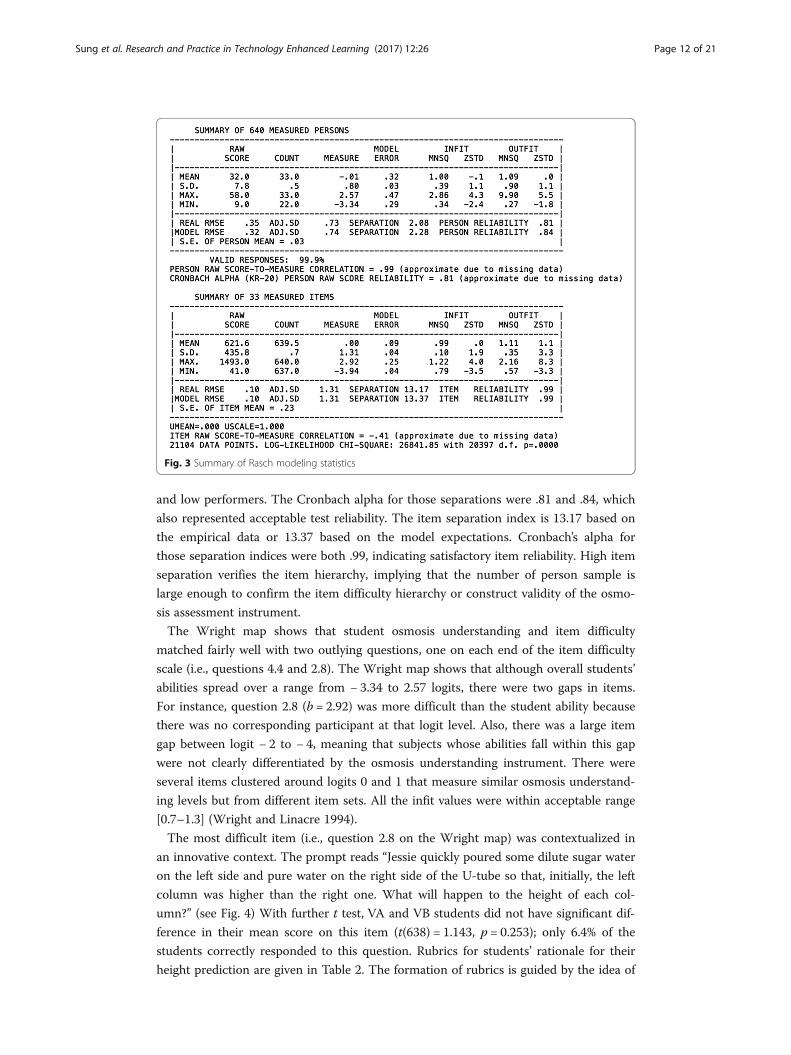
and low performers. The Cronbach alpha for those separations were .81 and .84, which
also represented acceptable test reliability. The item separation index is 13.17 based on
the empirical data or 13.37 based on the model expectations. Cronbach’s alpha for
those separation indices were both .99, indicating satisfactory item reliability. High item
separation verifies the item hierarchy, implying that the number of person sample is
large enough to confirm the item difficulty hierarchy or construct validity of the osmo-
sis assessment instrument.
The Wright map shows that student osmosis understanding and item difficulty
matched fairly well with two outlying questions, one on each end of the item difficulty
scale (i.e., questions 4.4 and 2.8). The Wright map shows that although overall students’
abilities spread over a range from − 3.34 to 2.57 logits, there were two gaps in items.
For instance, question 2.8 (b = 2.92) was more difficult than the student ability because
there was no corresponding participant at that logit level. Also, there was a large item
gap between logit − 2 to − 4, meaning that subjects whose abilities fall within this gap
were not clearly differentiated by the osmosis understanding instrument. There were
several items clustered around logits 0 and 1 that measure similar osmosis understand-
ing levels but from different item sets. All the infit values were within acceptable range
[0.7–1.3] (Wright and Linacre 1994).
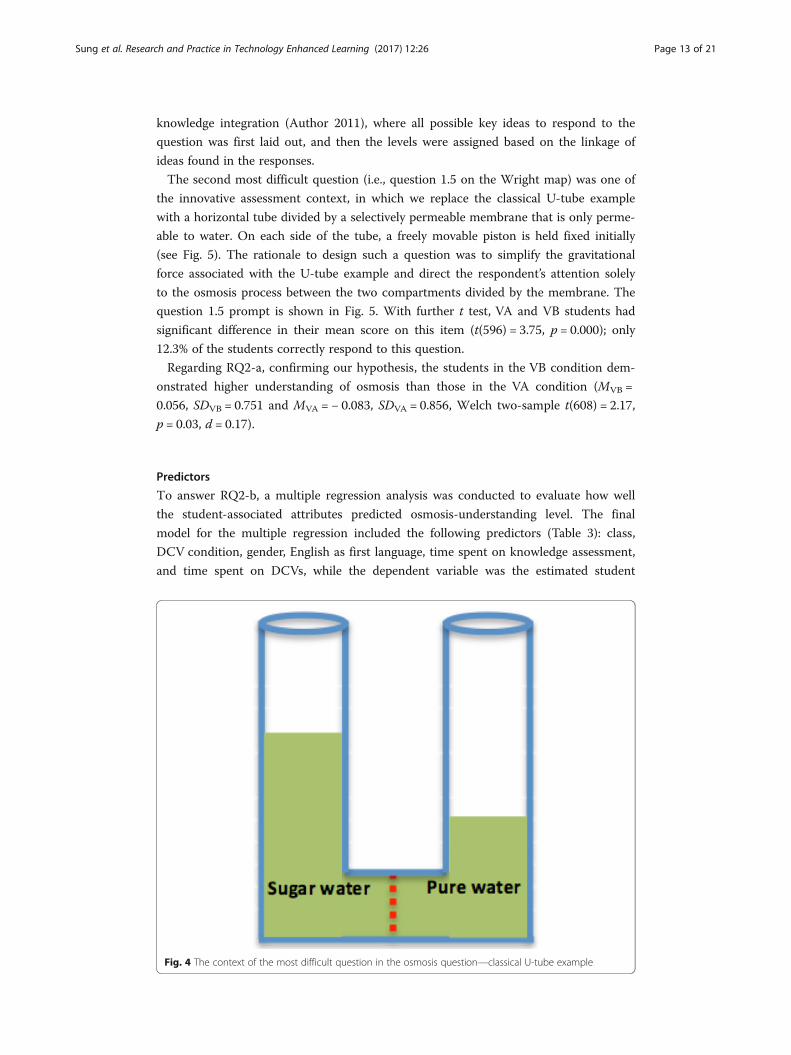
The most difficult item (i.e., question 2.8 on the Wright map) was contextualized in
an innovative context. The prompt reads “Jessie quickly poured some dilute sugar water
on the left side and pure water on the right side of the U-tube so that, initially, the left
column was higher than the right one. What will happen to the height of each col-
umn?” (see Fig. 4) With further t test, VA and VB students did not have significant dif-
ference in their mean score on this item (t(638) = 1.143, p = 0.253); only 6.4% of the
students correctly responded to this question. Rubrics for students’ rationale for their
height prediction are given in Table 2. The formation of rubrics is guided by the idea of
Fig. 3 Summary of Rasch modeling statistics
Sung et al. Research and Practice in Technology Enhanced Learning (2017) 12:26 Page 12 of 21
knowledge integration (Author 2011), where all possible key ideas to respond to the
question was first laid out, and then the levels were assigned based on the linkage of
ideas found in the responses.
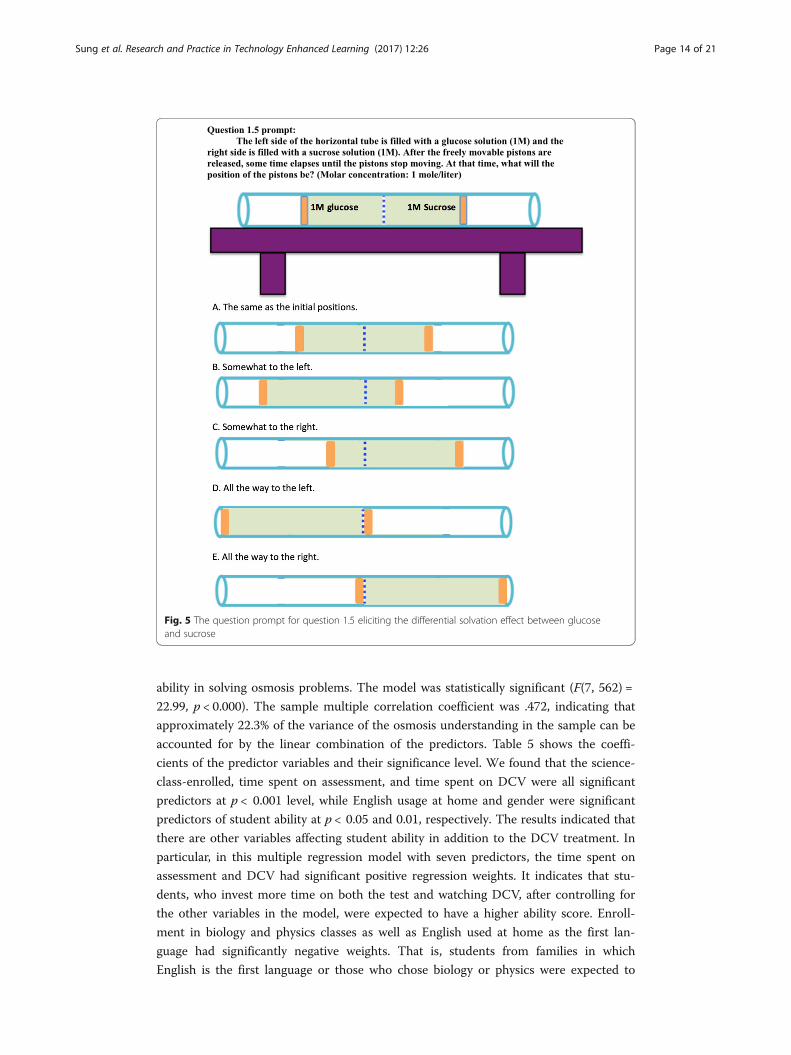
The second most difficult question (i.e., question 1.5 on the Wright map) was one of
the innovative assessment context, in which we replace the classical U-tube example
with a horizontal tube divided by a selectively permeable membrane that is only perme-
able to water. On each side of the tube, a freely movable piston is held fixed initially
(see Fig. 5). The rationale to design such a question was to simplify the gravitational
force associated with the U-tube example and direct the respondent’s attention solely
to the osmosis process between the two compartments divided by the membrane. The
question 1.5 prompt is shown in Fig. 5. With further t test, VA and VB students had
significant difference in their mean score on this item (t(596) = 3.75, p = 0.000); only
12.3% of the students correctly respond to this question.
Regarding RQ2-a, confirming our hypothesis, the students in the VB condition dem-
onstrated higher understanding of osmosis than those in the VA condition (MVB =
0.056, SDVB = 0.751 and MVA = − 0.083, SDVA = 0.856, Welch two-sample t(608) = 2.17,
p = 0.03, d = 0.17).
Predictors
To answer RQ2-b, a multiple regression analysis was conducted to evaluate how well
the student-associated attributes predicted osmosis-understanding level. The final
model for the multiple regression included the following predictors (Table 3): class,
DCV condition, gender, English as first language, time spent on knowledge assessment,
and time spent on DCVs, while the dependent variable was the estimated student
Fig. 4 The context of the most difficult question in the osmosis question—classical U-tube example
Sung et al. Research and Practice in Technology Enhanced Learning (2017) 12:26 Page 13 of 21
ability in solving osmosis problems. The model was statistically significant (F(7, 562) =
22.99, p < 0.000). The sample multiple correlation coefficient was .472, indicating that
approximately 22.3% of the variance of the osmosis understanding in the sample can be
accounted for by the linear combination of the predictors. Table 5 shows the coeffi-
cients of the predictor variables and their significance level. We found that the science-
class-enrolled, time spent on assessment, and time spent on DCV were all significant
predictors at p < 0.001 level, while English usage at home and gender were significant
predictors of student ability at p < 0.05 and 0.01, respectively. The results indicated that
there are other variables affecting student ability in addition to the DCV treatment. In
particular, in this multiple regression model with seven predictors, the time spent on
assessment and DCV had significant positive regression weights. It indicates that stu-
dents, who invest more time on both the test and watching DCV, after controlling for
the other variables in the model, were expected to have a higher ability score. Enroll-
ment in biology and physics classes as well as English used at home as the first lan-
guage had significantly negative weights. That is, students from families in which
English is the first language or those who chose biology or physics were expected to
Fig. 5 The question prompt for question 1.5 eliciting the differential solvation effect between glucoseand sucrose
Sung et al. Research and Practice in Technology Enhanced Learning (2017) 12:26 Page 14 of 21
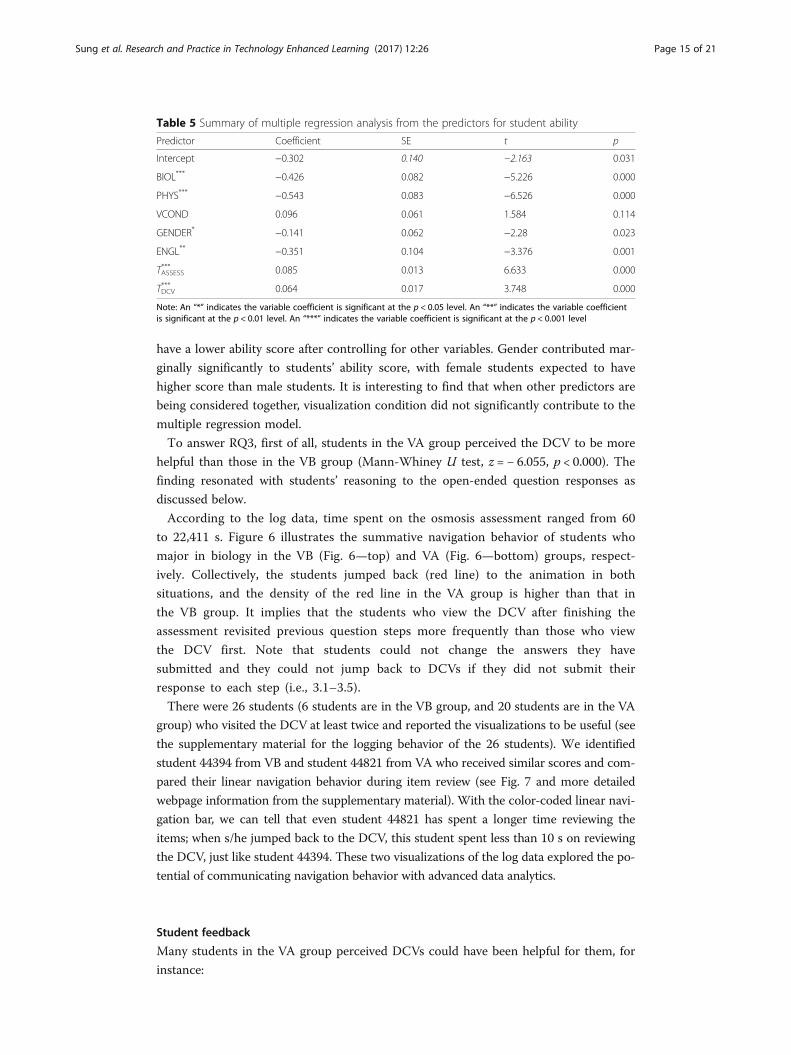
have a lower ability score after controlling for other variables. Gender contributed mar-
ginally significantly to students’ ability score, with female students expected to have
higher score than male students. It is interesting to find that when other predictors are
being considered together, visualization condition did not significantly contribute to the
multiple regression model.
To answer RQ3, first of all, students in the VA group perceived the DCV to be more
helpful than those in the VB group (Mann-Whiney U test, z = − 6.055, p < 0.000). The
finding resonated with students’ reasoning to the open-ended question responses as
discussed below.
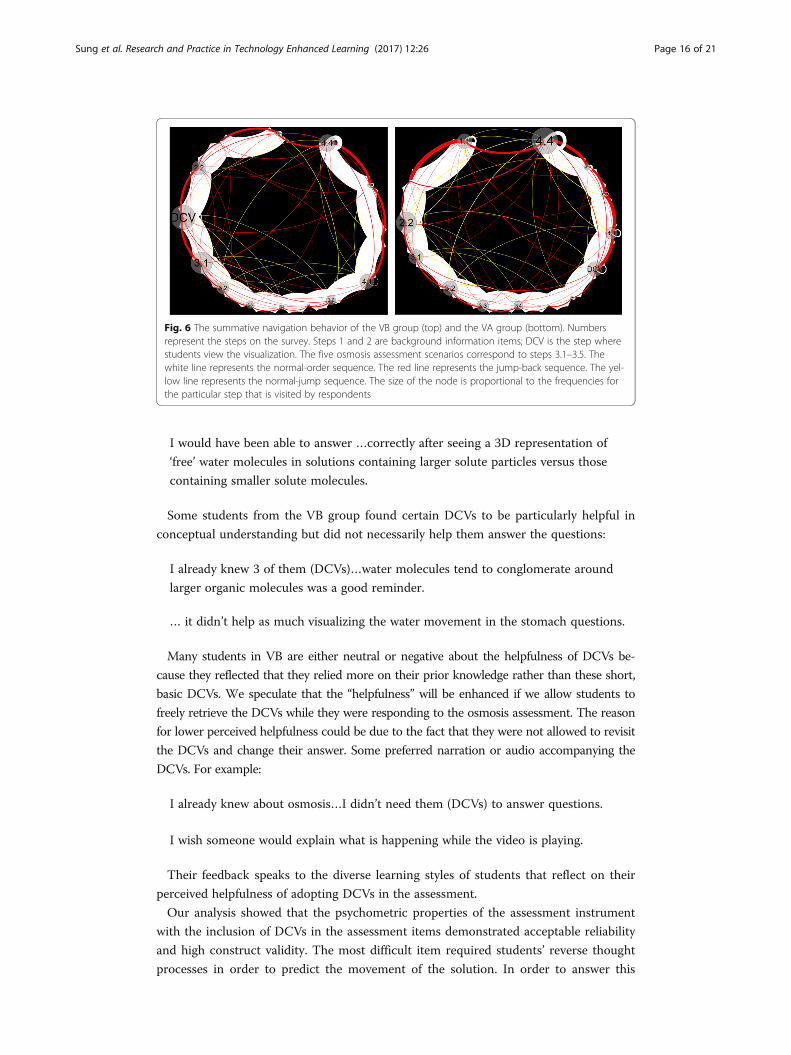
According to the log data, time spent on the osmosis assessment ranged from 60
to 22,411 s. Figure 6 illustrates the summative navigation behavior of students who
major in biology in the VB (Fig. 6—top) and VA (Fig. 6—bottom) groups, respect-
ively. Collectively, the students jumped back (red line) to the animation in both
situations, and the density of the red line in the VA group is higher than that in
the VB group. It implies that the students who view the DCV after finishing the
assessment revisited previous question steps more frequently than those who view
the DCV first. Note that students could not change the answers they have
submitted and they could not jump back to DCVs if they did not submit their
response to each step (i.e., 3.1–3.5).
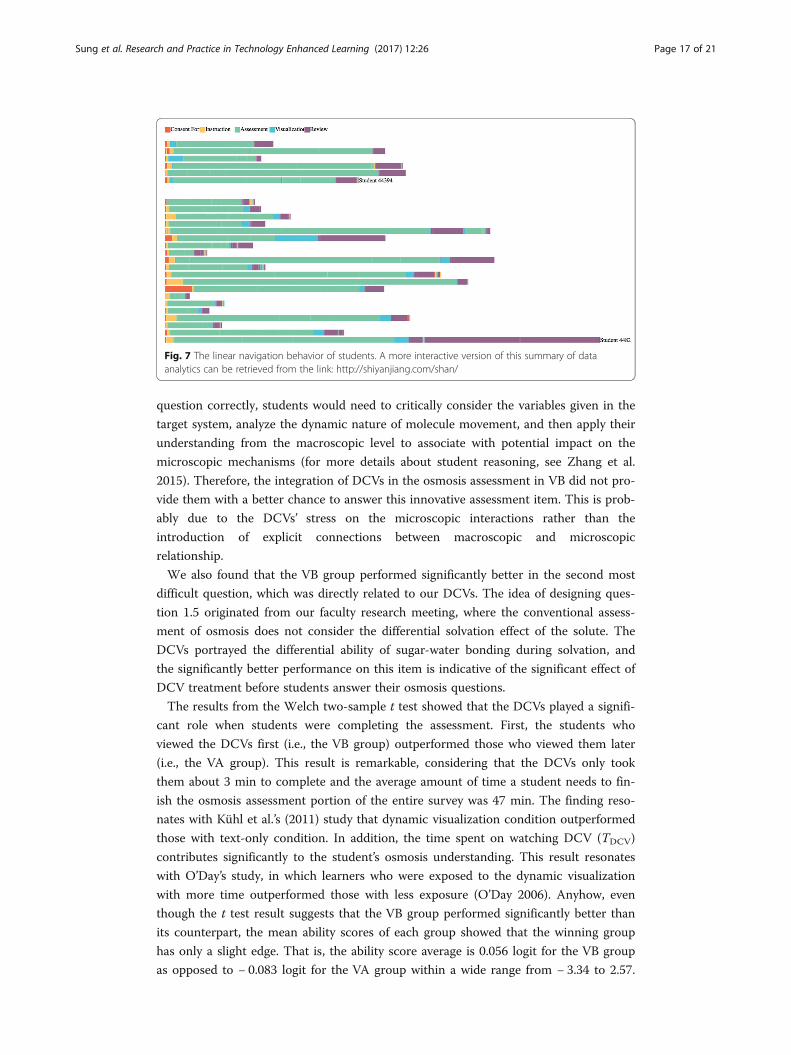
There were 26 students (6 students are in the VB group, and 20 students are in the VA
group) who visited the DCV at least twice and reported the visualizations to be useful (see
the supplementary material for the logging behavior of the 26 students). We identified
student 44394 from VB and student 44821 from VA who received similar scores and com-
pared their linear navigation behavior during item review (see Fig. 7 and more detailed
webpage information from the supplementary material). With the color-coded linear navi-
gation bar, we can tell that even student 44821 has spent a longer time reviewing the
items; when s/he jumped back to the DCV, this student spent less than 10 s on reviewing
the DCV, just like student 44394. These two visualizations of the log data explored the po-
tential of communicating navigation behavior with advanced data analytics.
Student feedback
Many students in the VA group perceived DCVs could have been helpful for them, for
instance:
Table 5 Summary of multiple regression analysis from the predictors for student ability
Predictor Coefficient SE t p
Intercept −0.302 0.140 −2.163 0.031
BIOL*** −0.426 0.082 −5.226 0.000
PHYS*** −0.543 0.083 −6.526 0.000
VCOND 0.096 0.061 1.584 0.114
GENDER* −0.141 0.062 −2.28 0.023
ENGL** −0.351 0.104 −3.376 0.001
TASSESS*** 0.085 0.013 6.633 0.000
TDCV*** 0.064 0.017 3.748 0.000
Note: An “*” indicates the variable coefficient is significant at the p < 0.05 level. An “**” indicates the variable coefficientis significant at the p < 0.01 level. An “***” indicates the variable coefficient is significant at the p < 0.001 level
Sung et al. Research and Practice in Technology Enhanced Learning (2017) 12:26 Page 15 of 21
I would have been able to answer …correctly after seeing a 3D representation of
‘free’ water molecules in solutions containing larger solute particles versus those
containing smaller solute molecules.
Some students from the VB group found certain DCVs to be particularly helpful in
conceptual understanding but did not necessarily help them answer the questions:
I already knew 3 of them (DCVs)…water molecules tend to conglomerate around
larger organic molecules was a good reminder.
… it didn’t help as much visualizing the water movement in the stomach questions.
Many students in VB are either neutral or negative about the helpfulness of DCVs be-
cause they reflected that they relied more on their prior knowledge rather than these short,
basic DCVs. We speculate that the “helpfulness” will be enhanced if we allow students to
freely retrieve the DCVs while they were responding to the osmosis assessment. The reason
for lower perceived helpfulness could be due to the fact that they were not allowed to revisit
the DCVs and change their answer. Some preferred narration or audio accompanying the
DCVs. For example:
I already knew about osmosis…I didn’t need them (DCVs) to answer questions.
I wish someone would explain what is happening while the video is playing.
Their feedback speaks to the diverse learning styles of students that reflect on their
perceived helpfulness of adopting DCVs in the assessment.
Our analysis showed that the psychometric properties of the assessment instrument
with the inclusion of DCVs in the assessment items demonstrated acceptable reliability
and high construct validity. The most difficult item required students’ reverse thought
processes in order to predict the movement of the solution. In order to answer this
Fig. 6 The summative navigation behavior of the VB group (top) and the VA group (bottom). Numbersrepresent the steps on the survey. Steps 1 and 2 are background information items; DCV is the step wherestudents view the visualization. The five osmosis assessment scenarios correspond to steps 3.1–3.5. Thewhite line represents the normal-order sequence. The red line represents the jump-back sequence. The yel-low line represents the normal-jump sequence. The size of the node is proportional to the frequencies forthe particular step that is visited by respondents
Sung et al. Research and Practice in Technology Enhanced Learning (2017) 12:26 Page 16 of 21
question correctly, students would need to critically consider the variables given in the
target system, analyze the dynamic nature of molecule movement, and then apply their
understanding from the macroscopic level to associate with potential impact on the
microscopic mechanisms (for more details about student reasoning, see Zhang et al.
2015). Therefore, the integration of DCVs in the osmosis assessment in VB did not pro-
vide them with a better chance to answer this innovative assessment item. This is prob-
ably due to the DCVs’ stress on the microscopic interactions rather than the
introduction of explicit connections between macroscopic and microscopic
relationship.
We also found that the VB group performed significantly better in the second most
difficult question, which was directly related to our DCVs. The idea of designing ques-
tion 1.5 originated from our faculty research meeting, where the conventional assess-
ment of osmosis does not consider the differential solvation effect of the solute. The
DCVs portrayed the differential ability of sugar-water bonding during solvation, and
the significantly better performance on this item is indicative of the significant effect of
DCV treatment before students answer their osmosis questions.
The results from the Welch two-sample t test showed that the DCVs played a signifi-
cant role when students were completing the assessment. First, the students who
viewed the DCVs first (i.e., the VB group) outperformed those who viewed them later
(i.e., the VA group). This result is remarkable, considering that the DCVs only took
them about 3 min to complete and the average amount of time a student needs to fin-
ish the osmosis assessment portion of the entire survey was 47 min. The finding reso-
nates with Kühl et al.’s (2011) study that dynamic visualization condition outperformed
those with text-only condition. In addition, the time spent on watching DCV (TDCV)
contributes significantly to the student’s osmosis understanding. This result resonates
with O’Day’s study, in which learners who were exposed to the dynamic visualization
with more time outperformed those with less exposure (O’Day 2006). Anyhow, even
though the t test result suggests that the VB group performed significantly better than
its counterpart, the mean ability scores of each group showed that the winning group
has only a slight edge. That is, the ability score average is 0.056 logit for the VB group
as opposed to − 0.083 logit for the VA group within a wide range from − 3.34 to 2.57.
Fig. 7 The linear navigation behavior of students. A more interactive version of this summary of dataanalytics can be retrieved from the link: http://shiyanjiang.com/shan/
Sung et al. Research and Practice in Technology Enhanced Learning (2017) 12:26 Page 17 of 21
That is why when multiple predictors were considered, the different DCV treatment
became a non-significant predictor in the model. We do not expect a wide score gap
between both groups, given that students from the VB group spent only 180.6 s, on
average, watching the animation. However, the results do show the potential of inte-
grating DCVs in science education to enhance learning. And our future work should be
focused on the nature of the impact of DCVs on student performance and how they
could be integrated in an efficient manner. In the conclusion section, how students
from the VB group interact with DCVs will be described.
ConclusionStudents did come back to the DCVs during the assessment for the VB group; however,
counterintuitively, we found the reviewing pattern for the VA group more intriguing
than the usage pattern of DCV for the VB group. Notice that while the VB group
reviewed their response to the assessment, they revisited the visualization section and
then resumed reviewing items. This observation might have explained why the students
in the VA group perceived that DCVs could have been more helpful than those in the
VB group. The result echoed with that from students’ feedback to the open-ended re-
sponse for the VA and VB groups. Many students in the VB group viewed the DCVs
more critically (e.g., design feature) than those in the VA group, which might contribute
to their lower perceived helpfulness score on the Likert-scale item. Sometimes students
came back to DCVs directly from certain assessment items during their review. It sug-
gested that students might be confused about the knowledge component in the
item and realized that the video could provide information related to the item. In
addition, we found that most students who came back to the DCVs did not per-
form well in the assessment. It provides further evidence that the DCVs might
offer additional self-paced learning opportunities for those who were academically
underrepresented in science learning. The low perceived helpfulness from students’
feedback also resonates with that from Tversky and her colleagues’ review study, in
which animated graphics are only beneficial for participants with lower spatial abil-
ity (Tversky et al. 2002).
LimitationsThere are several limitations in this study: (1) The survey was only administered
once to capture the direct impact of DCVs on the performance of osmosis across
two sections; students did not take pre- and posttests to conduct within-group
comparison statistically. (2) There were some constructive feedback on the features
of DCVs, such as the inclusion of audio component, narration over the interaction,
and also the addition of marking the particles on the visualization. (3) The four
DCV clips created by our research team were all embedded in one step on WISE,
so we were not able to determine the correlation of particular navigation behavior
against different features and design purposes of each DCV. (4) Similar to the pre-
vious limitation, the respondents were not able to revisit the DCVs in the midst of
answering the assessment items. It limits the ability for us to capture participants’
intentional navigation behavior in revisiting DCVs in search for useful clues before
moving on to the next question.
Sung et al. Research and Practice in Technology Enhanced Learning (2017) 12:26 Page 18 of 21

Significance of the study and future workAfter iterative validation processes of the assessment instrument on osmosis, the psy-
chometric properties approved the innovative osmosis survey to be valid and reliable.
Educators and other researchers interested in eliciting students’ deeper understanding
of osmosis could administer the osmosis survey to acquire some understanding of
where students stand before teaching the subject matter. They can then engage in cur-
ricular design to specifically address the gaps found in their understanding. Further-
more, we were able to study students’ navigation behavior using current data analytics
tool to decipher the underlying message conveyed from the logging data. The applica-
tion is critical to visualize and communicate with interested audience concerning the
dynamics of participant-DCV interactions.
The findings suggest that the integration of short DCVs has a positive impact on stu-
dents’ performance on the osmosis assessment. The instructors in higher education are
recommended to incorporate DCVs in their (formative) assessments to elicit students’
deeper understanding of microscopic, molecular-level reactions.
Some modification of the features and operational design of embedding DCVs in the
assessment is expected to improve participants’ perceptions toward the helpfulness of
adopting dynamic visualizations in their assessment instrument. Future research on
more in-depth navigation behavior of DCVs could focus on enhancing the planning of
data analytics to grasp more subtle DCV-usage behavior of respondents, especially
when the osmosis assessment is administered via a technology-enhanced environment.
Authors’ contributionsGC performed Welch t-test and multiple regression to help identify the effectiveness of DCV and the contributing pre-dictors to the student ability on responding to the osmosis assessment SJ performed Mann- Whiney U test to deter-mine students' perception toward DCVs. She also assisted visualizing student log data and discuss the navigationbehavior of students when they review items. JS was the director of the research project. He oversees the writingprocess of this research paper. He engaged in the process of assessment generation, validation, theoretical frameworkidentification, and contributed to the review and discussion of the manuscript. SS led the research with assessmentitem design, administration, data collection, Rasch-PCA data analysis, instrument validation, and literature review. Shealso coordinated the findings into conclusions and discussions. All authors read and approved the final manuscript.
Competing interestsThe authors declare that they have no competing interests.
Publisher’s NoteSpringer Nature remains neutral with regard to jurisdictional claims in published maps and institutional affiliations.
Author details1Assistant Professor, Education Department, Spelman College, 350 Spelman Lane, Atlanta, GA 30314, USA. 2AssociateProfessor, Department of Teaching and Learning, University of Miami, 5202 University Drive, Coral Gables, FL 33124,USA. 3Doctoral Student, Department of Teaching and Learning, University of Miami, 5202 University Drive, CoralGables, FL 33124, USA.
Received: 27 November 2017 Accepted: 7 December 2017
ReferencesBrunye, T, Rapp, DN, Taylor, HA (2004). Building mental models of multimedia procedures: Implications for memory
structure and content. In Proceedings of the 26th Annual Meeting of the Cognitive Science Society.Buckley, BC, & Quellmalz, ES (2013). Supporting and assessing complex biology learning with computer-based
simulations and representations. In Multiple representations in biological education, (pp. 247–267). Dordrecht:Springer https://doi.org/10.1007/978-94-007-4192-8_14.
Byrne, MD, Catrambone, R, Stasko, JT. (1999). Evaluating animations as student aids in learning computer algorithms.Computers and Education, 33(4), 253–278 https://doi.org/10.1016/S0360-1315(99)00023-8.
Chandler, P, & Sweller, J. (1991). Cognitive load theory and the format of instruction. Cognition and Instruction, 8(4),293–332 https://doi.org/10.1207/s1532690xci0804_2.
Chiu, JL, & Linn, MC. (2014). Supporting knowledge integration in chemistry with a visualization-enhanced inquiry unit.Journal of Science Education and Technology, 23(1), 37–58 https://doi.org/10.1007/s10956-013-9449-5.
Sung et al. Research and Practice in Technology Enhanced Learning (2017) 12:26 Page 19 of 21
Cook, MP. (2006). Visual representations in science education: the influence of prior knowledge and cognitive loadtheory on instructional design principles. Science Education, 90(6), 1073–1091 https://doi.org/10.1002/sce.20164.
Fisher, KM, Williams, KS, Lineback, JE. (2011). Osmosis and diffusion conceptual assessment. CBE Life Sciences Education,10(4), 418–429 https://doi.org/10.1187/cbe.11-04-0038.
Friedler, Y, Amir, R, Tamir, P. (1987). High school students’ difficulties in understanding osmosis. International Journal ofScience Education, 9(5), 541–551 https://doi.org/10.1080/0950069870090504.
Glynn, SM. (2012). International assessment: a Rasch model and teachers’ evaluation of TIMSS science achievementitems. Journal of Research in Science Teaching, 49(10), 1321–1344.
Hmelo-Silver, CE, & Pfeffer, MG. (2004). Comparing expert and novice understanding of a complex system from theperspective of structures, behaviors, and functions. Cognitive Science, 28, 127–138.
Höffler, TN, & Leutner, D. (2007). Instructional animation versus static pictures: a meta-analysis. Learning and Instruction,17, 722–738 http://doi.org/10.1016/j.learninstruc.2007.09.013.
Hwang, I, Tam, M, Lam, SL, Lam, P. (2012). Review of use of animation as a supplementary learning material ofphysiology content in four academic years. Electronic Journal of E-Learning, 10(4), 368–377.
Jensen, MS, Wilcox, KJ, Hatch, JT. (1996). A computer-assisted instruction unit on diffusion and osmosis with aconceptual change design. Journal of Computers in Mathematics and Science Teaching, 15(1–2), 49–64.
Kehoe, C, Stasko, J, Taylor, A. (2001). Rethinking the evaluation of algorithm animations as learning aids. InternationalJournal of Human-Computer Studies, 54(2), 265–284 https://doi.org/10.1006/ijhc.2000.0409.
Kim, S, Yoon, M, Whang, S-M, Tversky, B, Morrison, J b. (2007). The effect of animation on comprehension and interest.Journal of Computer Assisted Learning, 23(3), 260–270 https://doi.org/10.1111/j.1365-2729.2006.00219.x.
Kramer, EM, & Myers, DR. (2012). Five popular misconceptions about osmosis. American Journal of Physics, 84, 694–699.Kühl, T, Scheiter, K, Gerjets, P, Gemballa, S. (2011). Can differences in learning strategies explain the benefits of learning
from static and dynamic visualizations? Computers & Education, 56(1), 176–187 https://doi.org/10.1016/j.compedu.2010.08.008.
Levy, D. (2013). How dynamic visualization technology can support molecular reasoning. Journal of Science Educationand Technology, 22(5), 702–717 https://doi.org/10.1007/s10956-012-9424-6.
Linacre, JM (2012). Winsteps® Rasch measurement computer program user’s guide. Beaverton: Winsteps.com http://www.winsteps.com/index.htm. Retrieved 14 Feb 2013.
Linn, MC, & Eylon, B-S (2011). Science learning and instruction: taking advantage of technology to promote knowledgeintegration. New York: Routledge.
Marbach-Ad, G, Rotbain, Y, Stavy, R. (2008). Using computer animation and illustration activities to improve high school students’achievement in molecular genetics. Journal of Research in Science Teaching, 45(3), 273–292 https://doi.org/10.1002/tea.20222.
Mayer, RE (2001). Multimedia learning. New York: Cambridge University Press.McElhaney, KW, Chang, H-Y, Chiu, JL, Linn, MC. (2015). Evidence for effective uses of dynamic visualisations in science
curriculum materials. Studies in Science Education, 51(1), 49–85.Meir, E, Perry, J, Stal, D, Maruca, S, Klopfer, E. (2005). How effective are simulated molecular-level experiments for
teaching diffusion and osmosis? Cell Biology Education, 4(3), 235–248 https://doi.org/10.1187/cbe.04-09-0049.Merchant, Z, Goetz, E t, Keeney-Kennicutt, W, Cifuentes, L, Kwok, O, Davis, T j. (2013). Exploring 3-D virtual reality
technology for spatial ability and chemistry achievement. Journal of Computer Assisted Learning, 29(6), 579–590http://doi.org/10.1111/jcal.12018.
National Research Council (2014). Developing assessments for the next generation science standards. Committee ondeveloping assessments of science proficiency in K-12. Board on testing and assessment and board on scienceeducation. In JW Pellegrino, MR Wilson, JA Koenig, AS Beatty (Eds.), Division of Behavioral and Social Sciences andEducation. Washington, DC: The National Academies Press.
National Research Council (NRC) (2012). A framework for K-12 science education: practices, crosscutting concepts, and coreideas. Washington, DC: National Academies Press.
NGSS Lead States (2013). Next generation science standards: for states, by states. Washington: The National AcademiesPress.
O’Day, DH. (2006). Animated cell biology: a quick and easy method for making effective, high-quality teachinganimations. CBE-Life Sciences Education, 5, 255–263.
Odom, AL. (1995). Secondary and college biology students’ misconceptions about diffusion and osmosis. The AmericanBiology Teacher, 57(7), 409–415 https://doi.org/10.2307/4450030.
Odom, AL, & Barrow, LH. (1995). Development and application of a two-tier diagnostic test measuring college biologystudents’ understanding of diffusion and osmosis after a course of instruction. Journal of Research in ScienceTeaching, 32(1), 45–61 https://doi.org/10.1002/tea.3660320106.
Odom, AL, & Barrow, LH. (2007). High school biology students’ knowledge and certainty about diffusion and osmosisconcepts. School Science and Mathematics, 107(3), 94–101 https://doi.org/10.1111/j.1949-8594.2007.tb17775.x.
Pedrosa, M, & Dias, M. (2000). Chemistry textbook approaches to chemical equilibrium and student alternativeconceptions. Chemistry Education Research and Practice, 1 https://doi.org/10.1039/A9RP90024A.
Quellmalz, ES, & Pellegrino, JW. (2009). Technology and testing. Science, 323(5910), 75–79 http://doi.org/10.1126/science.1168046.
Quellmalz, ES, Timms, MJ, Silberglitt, MD, Buckley, BC. (2012). Science assessments for all: Integrating science simulationsinto balanced state science assessment systems. Journal of Research in Science Teaching, 49(3), 363–393 http://doi.org/10.1002/tea.21005.
Rundgren, C-J, & Tibell, LAE. (2010). Critical features of visualizations of transport through the cellmembrane—an empirical study of upper secondary and tertiary students’ meaning-making of a still imageand an animation. International Journal of Science and Mathematics Education, 8(2), 223–246 https://doi.org/10.1007/s10763-009-9171-1.
Ryoo, K, & Bedell, K. (2017). The effects of visualizations on linguistically diverse students’ understanding of energy andmatter in life science. Journal of Research in Science Teaching, 54(10), 1274–1301 https://doi.org/10.1002/tea.21405.
Ryoo, K, & Linn, MC. (2012). Can dynamic visualizations improve middle school students’ understanding of energy inphotosynthesis? Journal of Research in Science Teaching, 49(2), 218–243 http://doi.org/10.1002/tea.21003.
Sung et al. Research and Practice in Technology Enhanced Learning (2017) 12:26 Page 20 of 21
Ryoo, K, & Linn, MC. (2015). Designing and validating assessments of complex thinking in science. Theory Into Practice,0(ja), 0 http://doi.org/10.1080/00405841.2015.1044374.
Sanger, MJ, Brecheisen, DM, Hynek, BM. (2001). Can computer animations affect college biology students’ conceptionsabout diffusion & osmosis? The American Biology Teacher, 63(2), 104–109 https://doi.org/10.2307/4451051.
Savec, VF, Vrtacnik, M, Gilbert, JK (2005). Evaluating the educational value of molecular structure representations. In JKGilbert (Ed.), Visualization in science education, (pp. 269–297). Dordrecht: Springer. https://doi.org/10.1007/1-4020-3613-2_14.
Scalise, K, Timms, M, Moorjani, A, Clark, L, Holtermann, K, Irvin, PS. (2011). Student learning in science simulations:design features that promote learning gains. Journal of Research in Science Teaching, 48(9), 1050–1078 http://doi.org/10.1002/tea.20437.
Shen, J., Liu, O., & Sung, S. (2014). Designing interdisciplinary assessments in sciences for college students: An exampleon osmosis. International Journal of Science Education, 36(11), 1773-1793. doi:10.1080/09500693.2013.879224.
Shen, J., Sung, S., & Zhang, D. (2015). Toward an analytic framework of interdisciplinary reasoning and communication(IRC) processes in science. International Journal of Science Education, 37(17), 2809–2835. https://doi.org/10.1080/09500693.2015.1106026.
Shen, J., & Linn, M. C. (2011). A technology-enhanced unit of modeling static electricity: Integrating scientificexplanations and everyday observations. International Journal of Science Education, 33(12), 1597–1623. https://doi.org/10.1080/09500693.2010.514012.
Smetana, LK, & Bell, RL. (2012). Computer simulations to support science instruction and learning: a critical review ofthe literature. International Journal of Science Education, 34(9), 1337–1370 https://doi.org/10.1080/09500693.2011.605182.
Sung, S., Shen, J., Stanger-Hall, K. F., Wiegert, C., Wan-I Li, Robertson, T., & Brown, S. (2015). Toward InterdisciplinaryPerspectives: Using Osmotic Pressure as an Example for Analyzing Textbook Explanations. Journal of CollegeScience Teaching, 44(4), 76–87.
Tasker, RF, & Dalton, RM. (2006). Research into practice: visualisation of the molecular world using animations. ChemistryEducation Research and Practice, 7, 141–159.
Tversky, B, Morrison, JB, Betrancourt, M. (2002). Animation: can it facilitate? International Journal of Human–ComputerStudies, 57, 247–262.
Wieman, CE, Adams, WK, Perkins, KK. (2008). PhET: simulations that enhance learning. Science, 322(5992), 682–683.Wright, B, & Linacre, JM. (1994). Reasonable mean-square fit values. Rasch Measurement Transactions, 8, 370.Wu, H-C, Yeh, T-K, Chang, C-Y. (2010). The design of an animation-based test system in the area of Earth sciences.
British Journal of Educational Technology, 41(3), E53–E57 https://doi.org/10.1111/j.1467-8535.2009.00977.x.Xie, Q, & Pallant, A (2011). The molecular workbench software: an innovative dynamic modeling tool for nanoscience
education. In MS Khine, IM Saleh (Eds.), Models and modeling: cognitive tools for scientific enquiry, (pp. 121–132).New York: Springer.
Xie, Q, & Tinker, R. (2006). Molecular dynamics simulations of chemical reactions for use in education. Journal ofChemical Education, 83(1), 77 https://doi.org/10.1021/ed083p77.
Yarden, H, & Yarden, A. (2010). Learning using dynamic and static visualizations: students’ comprehension, priorknowledge and conceptual status of a biotechnological method. Research in Science Education, 40(3), 375–402https://doi.org/10.1007/s11165-009-9126-0.
Zhang, D.M., & Shen, J. (2015). Disciplinary foundations for solving interdisciplinary scientific problems. InternationalJournal of Science Education. 37 (15), 2555-2576.
Sung et al. Research and Practice in Technology Enhanced Learning (2017) 12:26 Page 21 of 21