Populations, Communities, and Species Interaction Chapter 3.

HAL Id: hal-02350562https://hal.archives-ouvertes.fr/hal-02350562
Submitted on 26 Oct 2020
HAL is a multi-disciplinary open accessarchive for the deposit and dissemination of sci-entific research documents, whether they are pub-lished or not. The documents may come fromteaching and research institutions in France orabroad, or from public or private research centers.
L’archive ouverte pluridisciplinaire HAL, estdestinée au dépôt et à la diffusion de documentsscientifiques de niveau recherche, publiés ou non,émanant des établissements d’enseignement et derecherche français ou étrangers, des laboratoirespublics ou privés.
Comparing species interaction networks alongenvironmental gradients
Loic Pellissier, Camille Albouy, Jordi Bascompte, Nina Farwig, CatherineGraham, Michel Loreau, Maria Maglianesi, Carlos Melián, Camille Pitteloud,
Tomas Roslin, et al.
To cite this version:Loic Pellissier, Camille Albouy, Jordi Bascompte, Nina Farwig, Catherine Graham, et al.. Comparingspecies interaction networks along environmental gradients. Biological Reviews, Wiley, 2018, 93 (2),pp.785-800. �10.1111/brv.12366�. �hal-02350562�

Biol. Rev. (2018), 93, pp. 785–800. 785doi: 10.1111/brv.12366
Comparing species interaction networks alongenvironmental gradients
Loïc Pellissier1,2,∗,†, Camille Albouy1,2,3,†, Jordi Bascompte4, Nina Farwig5, CatherineGraham2, Michel Loreau6, Maria Alejandra Maglianesi7,8, Carlos J. Melian9, CamillePitteloud1,2, Tomas Roslin10, Rudolf Rohr11, Serguei Saavedra12, Wilfried Thuiller13,Guy Woodward14, Niklaus E. Zimmermann1,2 and Dominique Gravel15
1Landscape Ecology, Institute of Terrestrial Ecosystems, ETH Zurich, Zurich, Switzerland2Swiss Federal Research Institute WSL, 8903 Birmensdorf, Switzerland3IFREMER, unite Ecologie et Modeles pour l’Halieutique, rue de l’Ile d’Yeu, BP21105, 44311 Nantes cedex 3, France4Department of Evolutionary Biology and Environmental Studies, University of Zurich, 8057 Zurich, Switzerland5Conservation Ecology, Faculty of Biology, Philipps-Universitat Marburg, Karl-von-Frisch-Str.8, D-35032 Marburg, Germany6Centre for Biodiversity Theory and Modelling, Theoretical and Experimental Ecology Station, CNRS and Paul Sabatier University, 09200
Moulis, France7Vicerrectoría de Investigacion, Universidad Estatal a Distancia, 2050 San Jose, Costa Rica8Biodiversity and Climate Research Centre (BiK-F) and Senckenberg Gesellschaft fur Naturforschung, 60325 Frankfurt am Main, Germany9Department of Fish Ecology and Evolution, Eawag: Swiss Federal Institute of Aquatic Science and Technology, 6047 Kastanienbaum,
Switzerland10Department of Ecology, Swedish University of Agricultural Sciences, Uppsala, Sweden11Department of Biology – Ecology and Evolution, University of Fribourg, Fribourg, Switzerland12Department of Civil and Environmental Engineering, Massashusets Institute of Technology, 77 Massachusetts Avenue, Cambridge, 02139 MA
U.S.A.13University of Grenoble Alpes, CNRS, LECA (Laboratoire d’Ecologie Alpine), F-38000 Grenoble, France14Department of Life Sciences, Imperial College London, Silwood Park Campus, Berkshire, SL5 7PY, U.K.15Departement de Biologie, Faculte des Sciences, Canada Research Chair in Integrative Ecology, Universite de Sherbrooke, 2500, boulevard de
l’Universite, Sherbrooke, J1K 2R1 Quebec, Canada
ABSTRACT
Knowledge of species composition and their interactions, in the form of interaction networks, is required to understandprocesses shaping their distribution over time and space. As such, comparing ecological networks along environmentalgradients represents a promising new research avenue to understand the organization of life. Variation in the positionand intensity of links within networks along environmental gradients may be driven by turnover in species composition,by variation in species abundances and by abiotic influences on species interactions. While investigating changes inspecies composition has a long tradition, so far only a limited number of studies have examined changes in speciesinteractions between networks, often with differing approaches. Here, we review studies investigating variation innetwork structures along environmental gradients, highlighting how methodological decisions about standardizationcan influence their conclusions. Due to their complexity, variation among ecological networks is frequently studiedusing properties that summarize the distribution or topology of interactions such as number of links, connectance, ormodularity. These properties can either be compared directly or using a procedure of standardization. While measuresof network structure can be directly related to changes along environmental gradients, standardization is frequently usedto facilitate interpretation of variation in network properties by controlling for some co-variables, or via null models. Nullmodels allow comparing the deviation of empirical networks from random expectations and are expected to providea more mechanistic understanding of the factors shaping ecological networks when they are coupled with functionaltraits. As an illustration, we compare approaches to quantify the role of trait matching in driving the structure of
* Address for correspondence (Tel: +41 44 632 32 03; E-mail: [email protected]).† Authors contributed equally to the work.
Biological Reviews 93 (2018) 785–800 © 2017 Cambridge Philosophical Society

786 Loïc Pellissier and others
plant–hummingbird mutualistic networks, i.e. a direct comparison, standardized by null models and hypothesis-basedmetaweb. Overall, our analysis warns against a comparison of studies that rely on distinct forms of standardization, asthey are likely to highlight different signals. Fostering a better understanding of the analytical tools available and thesignal they detect will help produce deeper insights into how and why ecological networks vary along environmentalgradients.
Key words: network, metaweb, motif, rarefaction analysis, null model, environmental gradient, network comparison,network properties.
CONTENTS
I. Introduction . . . . . . . . . . . . . . . . . . . . . . . . . . . . . . . . . . . . . . . . . . . . . . . . . . . . . . . . . . . . . . . . . . . . . . . . . . . . . . . . . . . . . . . . . . . . . . 786II. Selecting the network properties to compare . . . . . . . . . . . . . . . . . . . . . . . . . . . . . . . . . . . . . . . . . . . . . . . . . . . . . . . . . . . . . 788
(1) α-properties . . . . . . . . . . . . . . . . . . . . . . . . . . . . . . . . . . . . . . . . . . . . . . . . . . . . . . . . . . . . . . . . . . . . . . . . . . . . . . . . . . . . . . . . . . 788(2) β-properties . . . . . . . . . . . . . . . . . . . . . . . . . . . . . . . . . . . . . . . . . . . . . . . . . . . . . . . . . . . . . . . . . . . . . . . . . . . . . . . . . . . . . . . . . . 788(3) Motif profiles . . . . . . . . . . . . . . . . . . . . . . . . . . . . . . . . . . . . . . . . . . . . . . . . . . . . . . . . . . . . . . . . . . . . . . . . . . . . . . . . . . . . . . . . . 788
III. Comparing ecological networks along environmental gradients . . . . . . . . . . . . . . . . . . . . . . . . . . . . . . . . . . . . . . . . . . 789(1) Comparing raw network properties . . . . . . . . . . . . . . . . . . . . . . . . . . . . . . . . . . . . . . . . . . . . . . . . . . . . . . . . . . . . . . . . . . 789(2) Residual variation of network properties . . . . . . . . . . . . . . . . . . . . . . . . . . . . . . . . . . . . . . . . . . . . . . . . . . . . . . . . . . . . . 789(3) Rarefaction analysis . . . . . . . . . . . . . . . . . . . . . . . . . . . . . . . . . . . . . . . . . . . . . . . . . . . . . . . . . . . . . . . . . . . . . . . . . . . . . . . . . . 789(4) Null models . . . . . . . . . . . . . . . . . . . . . . . . . . . . . . . . . . . . . . . . . . . . . . . . . . . . . . . . . . . . . . . . . . . . . . . . . . . . . . . . . . . . . . . . . . . 790(5) Comparison to a hypothesis-based metaweb . . . . . . . . . . . . . . . . . . . . . . . . . . . . . . . . . . . . . . . . . . . . . . . . . . . . . . . . . 793(6) Network alignment . . . . . . . . . . . . . . . . . . . . . . . . . . . . . . . . . . . . . . . . . . . . . . . . . . . . . . . . . . . . . . . . . . . . . . . . . . . . . . . . . . . 793(7) Statistical model coupling co-occurrence with interactions . . . . . . . . . . . . . . . . . . . . . . . . . . . . . . . . . . . . . . . . . . . 794
IV. What is the best approach for comparing ecological networks? . . . . . . . . . . . . . . . . . . . . . . . . . . . . . . . . . . . . . . . . . . 794(1) The plant–hummingbird case study . . . . . . . . . . . . . . . . . . . . . . . . . . . . . . . . . . . . . . . . . . . . . . . . . . . . . . . . . . . . . . . . . 795(2) Comparison of plant–hummingbird network properties . . . . . . . . . . . . . . . . . . . . . . . . . . . . . . . . . . . . . . . . . . . . . 795(3) Comparison of trait matching with two null models . . . . . . . . . . . . . . . . . . . . . . . . . . . . . . . . . . . . . . . . . . . . . . . . . . 795(4) The use of hypothesis-based metaweb . . . . . . . . . . . . . . . . . . . . . . . . . . . . . . . . . . . . . . . . . . . . . . . . . . . . . . . . . . . . . . . . 795(5) Conclusions from the plant–hummingbird networks . . . . . . . . . . . . . . . . . . . . . . . . . . . . . . . . . . . . . . . . . . . . . . . . . 796
V. Conclusions . . . . . . . . . . . . . . . . . . . . . . . . . . . . . . . . . . . . . . . . . . . . . . . . . . . . . . . . . . . . . . . . . . . . . . . . . . . . . . . . . . . . . . . . . . . . . . 796VI. Acknowledgements . . . . . . . . . . . . . . . . . . . . . . . . . . . . . . . . . . . . . . . . . . . . . . . . . . . . . . . . . . . . . . . . . . . . . . . . . . . . . . . . . . . . . . . 796
VII. References . . . . . . . . . . . . . . . . . . . . . . . . . . . . . . . . . . . . . . . . . . . . . . . . . . . . . . . . . . . . . . . . . . . . . . . . . . . . . . . . . . . . . . . . . . . . . . . . 797
I. INTRODUCTION
Ecological networks account for both species distributionsand their interactions (Reiss et al., 2009; Schleuning Frund,& García, 2015) and provide an integrated representation ofcommunities. They are, however, often considered as fixedentities isolated from one another, and are usually describedat a single local site or region. Isolated networks are viewedas the result of deterministic ecological constraints (Clauset,Moore & Newman, 2008), such as forbidden links (Jordano,Bascompte & Olesen, 2003), functional composition(Gravel et al., 2016), abundance (Vazquez & Aizen, 2004),morphology (Stang, Klinkhamer & van der Meijden, 2007;Rohr et al., 2010) and phylogeny (Cattin et al., 2004; Vazquez& Aizen, 2004; Brose, Williams & Martinez, 2006; Petcheyet al., 2008; Rohr et al., 2010; Rohr & Bascompte, 2014).Variation of ecological networks in space or time is a noveland exciting approach to the analysis of community turnover.As shown in recent studies (Tylianakis et al., 2008; Kisslinget al., 2012; Kissling & Schleuning, 2015; Schleuning et al.,2015; Tylianakis & Morris, 2017), comparing ecologicalnetworks along environmental gradients can generate new
insights into the relative importance of environmentalfiltering and coexistence mechanisms behind communityassembly. Beyond analysing general properties that areshared among ecological networks (Bascompte et al., 2003),investigations of how networks vary along environmentalgradients have the potential to provide insight into howabiotic conditions shape variation in species interactions.
Community ecology has predominantly focused on thestructure of species assemblages within a single trophic level,such as plants (Weiher, Clarke & Keddy, 1998; Gotzenbergeret al., 2012) or a guild such as bird communities (Diamond& Cody, 1975; Terborgh et al., 1990). The description ofassemblages not only by their co-occurrence but also by theirinteraction has nonetheless a long tradition, as pioneered bythe work of Lindeman (1942), Odum (1956) and Margalef(1963). The idea that species are organized into interactionnetworks was proposed first for terrestrial ecosystems (e.g.plant–herbivore interactions; Elton, 1924) but was laterdeveloped mainly in marine ecosystems, e.g. intertidalmarine organisms (Paine, 1966), mangroves (Odum & Heald,1975) and coral reefs (Polovina, 1984). The development ofthis concept was slower for terrestrial systems and was only
Biological Reviews 93 (2018) 785–800 © 2017 Cambridge Philosophical Society

Networks along environmental gradients 787
recently established as a common approach for studying notjust food webs, but also mutualistic (Pimm, 1991; Memmott,1999; Dunne, Williams & Martinez, 2002; Olesen &Jordano, 2002; Bascompte et al., 2003; ) and host–parasitenetworks (Lafferty et al., 2008). Empirical investigation ofecological networks requires documenting species presences,along with their interactions and environmental variables.Detection of these can be achieved through direct observa-tion (e.g. records of flower visitors; Fabian et al., 2013), useof video-camera systems (Maglianesi et al., 2014; Weinstein,2015), or by indirect methods such as removal experiments(Choler, Michalet & Callaway, 2001), quantification ofgut contents (e.g. Barnes et al., 2008), isotope analyses (e.g.Vander Zanden et al., 1999) or molecular methods (e.g.García-Robledo et al., 2013). To provide the most informa-tive ecological signal, quantification of interactions shouldideally go beyond the simple observation of the presenceor absence of links, and instead estimate the strength of theinteractions through time (e.g. interaction frequency betweenplants for hummingbirds). The documentation of ecologicalinteractions has, however, been very resource-demanding,and only recently have approaches such as molecularbarcoding (Jurado-Rivera et al., 2009; Gonzalez-Varo,Arroyo & Jordano, 2014), automated data collection usingcameras or other technologies (Weinstein, 2015), as wellas data-sharing (Martín Gonzalez et al., 2015; Poisot et al.,2016) facilitated the study of ecological networks across sitesand along environmental gradients (Wirta et al., 2015).
Recent studies comparing the structure of ecologicalnetworks along environmental gradients have suggested thatecological and evolutionary constraints may shape networksdifferently in contrasting environments (Schleuning et al.,2012; Hudson et al., 2013; Layer, Hildrew & Woodward,2013; Morris et al., 2014; O’Gorman et al., 2014; MartínGonzalez et al., 2015; Osorio et al., 2015). These studieshighlighted how specific structural properties such asmodularity, nestedness, or trophic specialization mayvary under the shifting influences of processes such asenvironmental filtering, competition or facilitation (Layeret al., 2010; Schleuning et al., 2012; Martín Gonzalezet al., 2015; Cirtwill & Stouffer, 2016). For example,Martín Gonzalez et al. (2015) showed that specializationin plant–hummingbird interaction networks is positivelycorrelated with warmer temperatures and greater historicaltemperature stability. This can be interpreted as strongercompetition for floral resources in warmer and more stableconditions, where specialization favours species co-existence.
Variation of ecological networks along environmentalgradients may be driven by multiple factors, since theturnover of species and of interactions may be caused byseveral abiotic drivers (Poisot et al., 2012). Our knowledge ofhow and why ecological networks vary along environmentalgradients is still embryonic, despite increased interest in thisfield (Polis, Anderson & Holt, 1997; Warren, 1989; Dalsgaardet al., 2011; Schleuning et al., 2011). Part of this limitationis caused by the dearth of extensive interaction data sets.In addition, new methods are required to quantify recent
networks that contain tens to hundreds of replicated networks(e.g. Krasnov et al., 2004) or originate from reconstructednetworks based on imposed rules (e.g. Albouy et al., 2014).Finally, moving from understanding of ‘how networks vary’to ‘why networks vary’ requires the development of newmethodological approaches providing mechanistic insightsrather than simple pattern detection (Beaumont, 2010;Gravel et al., 2013, 2016).
Species turnover represents the most obvious sourceof variation of ecological networks along environmentalgradients, as interactions between species are primarilyconditioned by their co-occurrence (Gravel et al., 2016).There are many drivers of species co-occurrence, such asenvironmental filtering, ecological interactions, dispersallimitations and historical contingencies (Peres-Neto, 2004;Pottier et al., 2013). Abiotic conditions may also promotethe turnover of interactions for given co-occurrences(Trøjelsgaard et al., 2015). Variation in species abundanceamong sites may influence the frequency and detectability ofinteractions (Pellissier et al., 2013; Bartomeus et al., 2016) asmore-abundant species are more likely to interact (Petchey,Brose & Rall, 2010; Canard et al., 2014). Dominant mor-phologies or functional traits, for instance body size (Shin& Cury, 2001), both involved in trait-matching constraints(Gravel et al., 2013; Albouy et al., 2014; Bartomeus et al.,2016; Hattab et al., 2016), may also vary predictably with theenvironment (Shipley, Vile & Garnier, 2006). As an example,body size is larger in colder than in warmer conditions(Clarke & Warwick, 1999; O’Gorman et al., 2016). Furthercomplicating the picture, co-occurrence is required for aninteraction to occur, but the interactions themselves mayalso affect co-occurrence (Cazelles et al., 2016). For example,competitive interactions can potentially exclude a speciesfrom locations that would have otherwise favourable abioticconditions (le le Roux et al., 2012), or a predator could drivea prey toward an enemy-free location (Wisz et al., 2013).When combined, these lines of evidence suggest that strongenvironmental clines should be associated with significantvariation in the structure of ecological networks.
Comparing communities along environmental gradientshas traditionally been used to gain a better understandingof how shifting ecological conditions shape the distinctstructure of species assemblages, for instance species richness(e.g. Whittaker, Willis & Field, 2001; Macpherson, 2002),functional structure (Cornwell & Ackerly, 2009; Pellissieret al., 2010; de Bello et al., 2013), phylogenetic diversity(Graham et al., 2009; Pellissier et al., 2012) or multipledimensions simultaneously (; Weinstein et al., 2014; Dainese,Leps & de Bello, 2015). Extending the species compositionresearch agenda to ecological networks raises two newquestions: what are the network properties to compare,and how to compare them? The first step in such analysesis to extract summary properties from different networks,such as nestedness (Dalsgaard et al., 2013) or modularity (e.g.Morris et al., 2014), which can be compared directly (Pouilly,Barrera & Rosales, 2006; Fabian et al., 2013), or standardizedto control for potential covariates (Bascompte et al., 2003;
Biological Reviews 93 (2018) 785–800 © 2017 Cambridge Philosophical Society

788 Loïc Pellissier and others
Aizen et al., 2008; Schleuning et al., 2011). Variation innetwork properties among sites is then interpreted in the lightof distinct ecological processes (e.g. matching rules) reflectingdifferent environmental pressures for the coexistence ofspecies in communities (Pimm, 1991; Montoya, Pimm, &Sole, 2006). Bluthgen et al. (2008) argued that raw metrics,uncontrolled for neutrality or sampling effects, may besubstantially flawed resulting in incorrect interpretation ofvariation across networks. Instead, properties describingnetwork structure should be standardized but the mostappropriate method to do so still requires discussion.Here, we review studies which have compared ecologicalnetworks along environmental gradients and present themost commonly applied methods with an emphasis onthe standardization these methods employ. Using variationin plant–hummingbird mutualistic networks along anelevation gradient as a case study, we compare differentmethods and discuss their advantages and limitations, alongwith their ecological interpretation. Our review and casestudy show that the standardization employed can greatlyinfluence the ecological interpretations of network variationalong environmental gradients. We highlight the criticalimportance of methodological decisions, which should bealigned with the ecological hypotheses that are being tested.
II. SELECTING THE NETWORK PROPERTIESTO COMPARE
(1) α-properties
Studies of species diversity typically refer to the mean speciesdiversity of a given site at a local scale as alpha diversity(α-diversity; Whittaker, 1972). By analogy, we here referto α-properties as the characteristics of a local network.Some α-properties are strongly linked to the distribution ofinteractions such as species specialization or vulnerability(Schleuning et al., 2011), while others are related to thetopology of the network, including for example connectance(May, 1972; Jordano, 1987; Beckerman, Petchey & Warren,2006; Santamaria & Rodriguez-Girones, 2007), centrality(Gonzalez et al., 2010), nestedness (Bascompte et al., 2003;Santamaria & Rodriguez-Girones, 2007), or modularity(Dalsgaard et al., 2013). These properties can be directlyextracted from the distribution and structure of nodes andlinks within each local ecological network. Moreover, thestructure of ecological networks can be combined withcomplementary information, for example with phylogenies(Krasnov et al., 2012; Pellissier et al., 2013) or with functionaltraits (Maglianesi et al., 2014) to compute more complexproperties of networks. For example, Rezende et al. (2007)or Rohr & Bascompte (2014) combined phylogenies withecological networks and showed a pervasive phylogeneticsignal in the structure of species interactions. One mayalso use traits to compute more-specific metrics, such asecological matching, when traits of one species shouldcorrespond to a trait syndrome of another to allow the
interaction (Maglianesi et al., 2014; Weinstein & Graham,2017). One major caveat of the computation of multiplenetwork metrics is that they may show a strong degreeof collinearity. Hence, the variation of one metric cannotbe interpreted without either considering the variation ofits correlate (Poisot & Gravel, 2014), building compositevariables using multivariate approaches, or applying a formof standardization.
(2) β-properties
As a complement to the α-properties of ecological networks,β-properties quantify differences between pairs of networksor among multiple networks if a multiple-site dissimilaritymeasure is required to capture better the heterogeneityof sampled habitats and networks (Diserud & Odegaard,2007; Melian et al., 2015). Poisot et al. (2012) proposedquantification of the interactions in common betweenany pair of localities expressed over the total numberof interactions. The total network dissimilarity is thendivided into two components, one attributable to theturnover in species composition and the other to theturnover in interactions (Poisot et al., 2012). The dissimilarityamong ecological networks depends on both the changein the occurrence and the intensity of the interactions(Canard et al., 2014). Using this approach, Trøjelsgaardet al. (2015) found that distant networks are more dissimilarto one another than closer ones, essentially because ofspatial turnover in composition and abundances. As withα-properties, ecological networks can be coupled withspecies characteristics to compute functional β-properties, forexample to quantify whether changes in ecological networksare associated with specific functional or phylogeneticmodules. β-properties can be related to environmentaldifferences among sites using a statistical model (e.g.Mantel test). While intuitive and intimately related to thelong tradition of β-diversity analysis (Legendre, Borcard& Peres-Neto, 2005), this approach is only appropriateto compare ecological networks that share many species,whereas it might prove of limited use along environmentalclines with significant species turnover. Moreover, theproblem of co-varying factors is also relevant when relatingβ-properties to environmental differences among sites.Depending on the question, applying standardization toavoid biased interpretations can be necessary.
(3) Motif profiles
Ecological networks can be decomposed into smaller modulesof interactions, such as omnivory, apparent competition,exploitative competition, and intra-guild predation (Leibold,1995; Chase, 2003). Whenever these modules areoverrepresented in a network, they are generally referredto as ‘motifs’ (Milo et al., 2002). Motifs are hypothesized to bethe building blocks of larger network structures (Bascompte& Melian, 2005; Stouffer et al., 2007). Ecological networkscan thus be described by the combination of all possiblemotifs of a given number of nodes found in a network (e.g.
Biological Reviews 93 (2018) 785–800 © 2017 Cambridge Philosophical Society

Networks along environmental gradients 789
there are 13 distinct possible motifs of three nodes). Thefrequency distribution of the different motifs will then reflectthe signature of the network topology. This approach canpoint out conserved regions of the network, which can be keyto their functioning under distinct environmental conditions(Baker et al., 2015). Motif profiles have been related to certainaspects of community dynamics, such as coexistence andstability (Stouffer & Bascompte, 2011), and have been used tocompare networks over space and time. For example, Bakeret al. (2015) used this approach to investigate the spatial andtemporal turnover of host–parasitoid interaction networksin southern Finland. They found that even though thereis considerable turnover in species composition, the motifprofiles are strongly conserved over spatial and temporalscales, suggesting a consistent network structure. Whilepromising, the rationale of decomposing ecological networksin modules requires further evaluation with empirical data.
III. COMPARING ECOLOGICAL NETWORKSALONG ENVIRONMENTAL GRADIENTS
(1) Comparing raw network properties
Ecological networks can be summarized by structural α- andβ-properties, which include nestedness (Bascompte et al.,2003), modularity (Olesen et al., 2007), and turnover ofinteractions (Poisot et al., 2012). These can be directly relatedto abiotic variables using various statistical approaches. Forinstance, Morris et al. (2014) evaluated whether connectance,modularity and other properties of antagonistic networksshowed a latitudinal trend. After controlling for samplingeffects (species diversity and size of the interactionmatrix), they found no consistent latitudinal patterns in216 quantitative networks of insect parasitoids. Becausemany network properties are intertwined with each other(Winemiller, 1989; Layer et al., 2010), it is essential to controlfor a possible effect of co-variation, such as with speciesrichness or relative abundance within a standardizationprocedure. Bluthgen et al. (2008) warned that the comparisonof raw metrics may be substantially flawed, because ofcollinearity between network properties or due to underlyingvariation in species abundance or species richness (see Morriset al., 2014). The same limitation applies to high-dimensionalproperties of network structures involving complementarysources of information such as traits and phylogenies (Rohr& Bascompte, 2014). For example, a direct comparison ofthe phylogenetic signal (e.g. through a correlation betweenphylogenetic distances and interactions) among networksonly evaluates whether interactions are associated with thephylogenetic distance among species (Aizen et al., 2016).Nevertheless, this direct comparison does not evaluatewhether the same lineages interact with each other, noridentify the underlying ecological mechanism. A directcomparison of metrics is therefore expected to provideprimarily a description of how different aspects of networkstructures vary along environmental gradients, but is less
likely able to answer why they do so. Moreover, due tocollinearity among metrics describing ecological networks,a direct comparison generally fails to disentangle theindependent variation of a given property.
(2) Residual variation of network properties
The simplest approach to control for the co-variation ofnetwork properties is to use a linear regression to remove itand focus on the residuals thereof (e.g. Devoto, Medan &Montaldo, 2005; Tylianakis, Tscharntke & Lewis, 2007;Dalsgaard et al., 2013; Trøjelsgaard et al., 2013; Morriset al., 2014). For example, connectance is a commonmetric for describing network complexity, but it is stronglycorrelated with species richness (Winemiller, 1990; Havens,1992; Martinez, 1992), which constrains the potentialarrangements of links (Poisot & Gravel, 2014). Quantifyingthe residual variation in connectance among sites that isindependent of species richness provides a better measureof the degree of species association in an ecological network(Dunne et al., 2002; Olesen & Jordano, 2002). In the situationof multiple collinear variables, structural equation models orpath analyses are useful tools for disentangling the relativecorrelations of collinear variables along environmentalgradients (Thebault & Fontaine, 2010). The study of residualvariation provides the means to measure the variation ofthe property of ecological networks along environmentalgradients independently of other co-variables. Although itstill does not necessarily identify the underlying mechanisms,it allows us to quantify more precisely the variation of interestamong ecological networks.
(3) Rarefaction analysis
Rarefaction techniques provide a way to compare ecologicalnetworks that differ in either sampling effort or communitycomplexity across sites (Olesen et al., 2011; Albrecht et al.,2014; Morris et al., 2014). In community ecology, rarefactioncurves allow comparison between the observed or expectedspecies richness in a relatively poorly sampled communitywith the expected species richness of a more extensivelysampled community for an equivalent sampling effort,thereby removing confounding sampling effort effects(Simberloff, 1978; Gotelli & Colwell, 2001). In the contextof ecological networks, rarefaction analyses allow thecomparison of networks that differ in sampling effort,complexity, or species richness. Species and their associatedinteractions can be randomly removed from the mostspecies-rich network to match the richness level of thespecies-poor network to which it is being compared. Thisoperation can be repeated multiple times to obtain a statisticaldistribution of rarefied network properties (Albrecht et al.,2014). The value of the property for the species-poor networkcan be compared to the distribution of the rarefied one.In Fig. 1, we illustrate this approach using 10 parasiticfood webs in agricultural landscapes (Fabian et al., 2013).Fig. 1 indicates that there is a positive correlation betweendifference in connectance and difference in the configuration
Biological Reviews 93 (2018) 785–800 © 2017 Cambridge Philosophical Society

790 Loïc Pellissier and others
Fig. 1. Comparison of connectance of 10 hymenopteran food webs from Fabian et al. (2013) using the rarefaction method thatremoves species and links randomly. (A) Relation between ecological distance and difference in connectance between sites. Theecological distance between sites was expressed as the Euclidean distance between the percentage cover by six landscape elementson the different sites: (i) agricultural fields; (ii) extensive meadows, gardens, orchards and hedges; (iii) forest; (iv) wildflower strips; (v)water bodies and (vi) urban areas (roads and houses). Red dots on the graph identify the only three pairs of networks that showeda significant difference in connectance when values were compared after rarefaction. The red line is a local polynomial regressionfitted with a confidence interval of 95% (shaded blue). (B) The observed connectance of the smallest network (red dot; 20 species)compared with the distribution of rarefied connectance with 10 iterations from a richer species network (38 species). In this example,the two measures of connectance are not different.
of the agricultural landscape among sites, which is, however,confounded by underlying variation in species richness.When accounting for differences in species richness usinga rarefaction approach, only three pairs of sites at similarrichness level showed significant differences in connectance.The overall gradient in connectance needs to be robustto differences in species richness before conclusions can bedrawn about apparent underlying differences in connectanceper site.
(4) Null models
Null models are useful for evaluating whether a specificstructural property may be the result of chance alone in theabsence of any particular ecological constraint (Gotelli &Graves, 1996; Gotelli, 2001). This approach has been usedwidely in spatial community ecology to evaluate whethercommunity structure, such as the distribution of abundanceor functional dispersion, differs from random sampling ofthe regional species pool (Gotzenberger et al., 2012). Nullmodels are also applied to the analysis of ecological networks(Bascompte et al., 2003; Ollerton et al., 2007) and alongenvironmental gradients (see Table 1). Here, the value of thenetwork property of interest is contrasted to expected valuesfrom the null models, where the links within each networkare randomized. The randomization might be constrained,e.g. by fixing the species’ relative abundances. Bluthgen et al.(2008) showed that the deviation of network properties fromnull expectations varies according to the relative abundance
of the species. If partners associate randomly, species aremore likely to interact with common than with rare partners.Since species abundances and frequencies are known toco-vary with environmental gradients (Lomolino, 2001), anull model accounting for the abundance or frequency ofspecies provides a more relevant baseline to highlight changesin species interactions along the gradient (Schleuning et al.,2012; Sebastian-Gonzalez et al., 2015).
Null models have also been used to evaluate the roleof functional traits in structuring ecological networks. Traitmatching between mutualistic or antagonistic partners iscompared to the values expected when the association ofspecies with their traits is randomized. Null models havebeen used for the evaluation, for example, of whether thefunctional matching of interactions is stricter than expectedunder random associations (Fig. 2B). The standard effect size(SES) – the difference of the observation relative to the nulldistribution – is related to environmental gradients using astatistical model (Schleuning et al., 2012). As emphasized byde Bello et al. (2013), null models are not ‘magic wands’,and a linear dependence between the SES and the originalraw metric is frequently observed. Similarly, it is not knownwhether standardized measures generated by null modelscan be properly compared across networks with differentdimensions. The architecture of a null model requirescareful evaluation (e.g. using simulated data) to understandclearly whether the confounding effects are attenuated asanticipated.
Biological Reviews 93 (2018) 785–800 © 2017 Cambridge Philosophical Society

Networks along environmental gradients 791
Tab
le1.
Publ
icat
ions
whe
rem
utua
listic
oran
tago
nist
icec
olog
ical
netw
orks
wer
eco
mpa
red
alon
gen
viro
nmen
talg
radi
ents
,tog
ethe
rw
ithth
esu
mm
ary
netw
ork
prop
erty
cons
ider
ed,t
heen
viro
nmen
talg
radi
ent,
and
the
stan
dard
izat
ion
appr
oach
used
.Com
pari
ngec
olog
ical
netw
orks
alon
gen
viro
nmen
talg
radi
ents
isan
emer
ging
field
;mos
tof
the
25st
udie
slis
ted
here
use
eith
era
resi
dual
anal
ysis
ornu
llm
odel
sto
stan
dard
ize
the
com
pari
son.
Net
wor
kty
pePr
oper
tyE
colo
gica
lgra
dien
tM
etho
dR
efer
ence
Titl
e
Ant
agon
istic
Spec
ies
rich
ness
,tro
phic
com
posi
tion
Ele
vatio
nC
ompa
ring
raw
prop
ertie
sPo
uilly
etal
.(2
006)
Cha
nges
ofta
xono
mic
and
trop
hic
stru
ctur
eof
fish
asse
mbl
ages
alon
gan
envi
ronm
enta
lgra
dien
tin
the
Upp
erB
eni
wat
ersh
ed(B
oliv
ia)
Mut
ualis
ticSp
ecia
lizat
ion
Lat
itude
,pas
tand
cont
empo
rary
clim
ate,
plan
tdiv
ersi
tyN
ullm
odel
Schl
euni
nget
al.(2
012)
Spec
ializ
atio
nof
mut
ualis
ticin
tera
ctio
nne
twor
ksto
war
dstr
opic
alla
titud
esA
ntag
onis
ticR
ates
ofpa
rasi
tism
,lin
kage
dens
ity,g
ener
ality
,vu
lner
abili
ty,e
venn
ess,
conn
ecta
nce,
com
part
men
tdi
vers
ity
Hab
itatm
odifi
catio
nA
ddin
ga
stat
istic
alco
fact
orT
ylia
naki
set
al.(2
007)
Hab
itatm
odifi
catio
nal
ters
the
stru
ctur
eof
trop
ical
host
–pa
rasi
toid
food
web
s
Mut
ualis
ticSp
ecia
lizat
ion,
conn
ecta
nce,
num
ber
ofin
tera
ctio
nsPr
ecip
itatio
n,el
evat
ion
Add
ing
ast
atis
tical
cofa
ctor
Dev
oto
etal
.(2
005)
Patt
erns
ofin
tera
ctio
nbe
twee
npl
ants
and
polli
nato
rsal
ong
anen
viro
nmen
tal
grad
ient
Mut
ualis
ticC
onne
ctan
ce,n
este
dnes
s,de
gree
ofdi
stri
butio
n,m
odul
arity
Ele
vatio
nN
ullm
odel
Ram
os-J
ilibe
rto
etal
.(2
010)
Top
olog
ical
chan
geof
And
ean
plan
t–po
llina
tor
netw
orks
alon
gan
altit
udin
algr
adie
ntM
utua
listic
Mod
ular
ityan
dne
sted
ness
His
tori
cala
ndco
ntem
pora
rycl
imat
ech
ange
Com
pari
ngra
wpr
oper
ties
Dal
sgaa
rdet
al.(2
013)
His
tori
calc
limat
ech
ange
influ
ence
sm
odul
arity
and
nest
edne
ssof
polli
natio
nne
twor
ksM
utua
listic
Mod
ular
ityan
dne
sted
ness
Lat
itude
,ele
vatio
n,te
mpe
ratu
re,
prec
ipita
tion
Nul
lmod
elT
røje
lsgaa
rdet
al.(2
013)
Mac
roec
olog
yof
polli
natio
nne
twor
ks
Mut
ualis
ticSp
ecia
lizat
ion
Ele
vatio
n,hi
stor
ical
clim
ate
chan
ge(v
eloc
ity),
cont
empo
rary
clim
ate
chan
ge(p
reci
pita
tion,
tem
pera
ture
),sp
ecie
sric
hnes
sand
seas
onal
ity
Nul
lmod
elD
alsg
aard
etal
.(2
011)
Spec
ializ
atio
nin
plan
t–hu
mm
ingb
ird
netw
orks
isas
soci
ated
with
spec
ies
rich
ness
,con
tem
pora
rypr
ecip
itatio
nan
dqu
ater
nary
clim
ate-
chan
geve
loci
ty
Mut
ualis
ticM
odul
arity
and
nest
edne
ssL
atitu
de,c
limat
e,to
pogr
aphy
,hu
man
impa
ctN
ullm
odel
Seba
stia
n-G
onza
lez
etal
.(2
015)
Mac
roec
olog
ical
tren
dsin
nest
edne
ssan
dm
odul
arity
ofse
ed-d
ispe
rsal
netw
orks
:hu
man
impa
ctm
atte
rsA
ntag
onis
ticT
roph
icle
vela
ndco
ntri
butio
nof
bent
hic
carb
onto
diet
Insh
ore–
offs
hore
Com
pari
ngra
wpr
oper
ties
Kop
pet
al.(2
015)
Reo
rgan
izat
ion
ofa
mar
ine
trop
hic
netw
ork
alon
gan
insh
ore–
offs
hore
grad
ient
due
tost
rong
erpe
lagi
c–be
nthi
cco
uplin
gin
coas
tala
reas
Ant
agon
istic
&m
utua
listic
Mod
ular
ityan
dne
sted
ness
Tem
pera
ture
,pre
cipi
tatio
nA
ddin
ga
stat
istic
alco
fact
orW
elti
&Jo
ern
(201
5)St
ruct
ure
oftr
ophi
can
dm
utua
listic
netw
orks
acro
ssbr
oad
envi
ronm
enta
lgr
adie
nts
Ant
agon
istic
Tro
phic
leve
ls,co
nnec
tanc
e,ge
nera
lity,
vuln
erab
ility
Est
uari
ne–
cost
alN
iche
mod
elV
inag
re&
Cos
ta(2
014)
Est
uari
ne–
coas
talg
radi
enti
nfo
od-w
ebne
twor
kst
ruct
ure
and
prop
ertie
sA
ntag
onis
ticL
inka
gede
nsity
,con
nect
ance
,ge
nera
lity,
vuln
erab
ility
,m
odul
arity
,spe
cial
izat
ion
Lat
itude
Com
pari
ngra
wpr
oper
ties
Mor
ris
etal
.(2
014)
Ant
agon
istic
inte
ract
ion
netw
orks
are
stru
ctur
edin
depe
nden
tlyof
latit
ude
and
host
guild
Ant
agon
istic
Gen
eral
ity,v
ulne
rabi
lity,
conn
ecta
nce,
inte
ract
ion
even
ness
Ele
vatio
nA
ddin
ga
stat
istic
alco
fact
orM
auns
elle
tal
.(2
015)
Cha
nges
inho
st–
para
sito
idfo
odw
ebst
ruct
ure
with
elev
atio
n
Biological Reviews 93 (2018) 785–800 © 2017 Cambridge Philosophical Society

792 Loïc Pellissier and others
Tab
le1.
Con
tinue
d
Net
wor
kty
pePr
oper
tyE
colo
gica
lgra
dien
tM
etho
dR
efer
ence
Titl
e
Mut
ualis
ticN
umbe
rof
com
part
men
ts,
mod
ular
ity,n
umbe
rof
mod
ules
,nes
tedn
ess,
conn
ecta
nce,
polli
nato
r:pl
ant
ratio
,rob
ustn
ess
Inva
sion
stat
usR
aref
actio
nan
alys
isA
lbre
chte
tal
.(2
014)
Con
sequ
ence
sof
plan
tinv
asio
nson
com
part
men
taliz
atio
nan
dsp
ecie
s’ro
lesi
npl
ant–
polli
nato
rne
twor
ks
Ant
agon
istic
Spec
ies
com
posi
tion
and
spec
ies
inte
ract
ion
Tem
pera
ture
,iso
ther
mal
ity,
prec
ipita
tion,
diur
nalr
ange
Bet
a-di
vers
ityPo
isot
etal
.(2
016)
Hos
ts,p
aras
ites,
and
thei
rin
tera
ctio
nsre
spon
dto
diffe
rent
clim
atic
vari
able
sA
ntag
onis
ticH
erbi
vore
and
pred
ator
biom
ass,
and
herb
ivor
eco
mpo
sitio
nPr
oduc
tivity
Com
pari
ngra
wpr
oper
ties
Cha
se(2
003)
Stro
ngan
dw
eak
trop
hic
casc
ades
alon
ga
prod
uctiv
itygr
adie
ntA
ntag
onis
ticPh
enot
ypic
and
ecol
ogic
alsp
ecia
lizat
ion
Ele
vatio
nC
ompa
ring
raw
prop
ertie
sM
aglia
nesi
etal
.(2
014)
The
role
ofm
orph
olog
ical
trai
ts(i.
e.ph
enot
ypic
spec
ializ
atio
n)fo
rec
olog
ical
spec
ializ
atio
nin
plan
t–hu
mm
ingb
ird
netw
orks
inth
ree
type
sof
Neo
trop
ical
fore
sts
atdi
ffere
ntel
evat
ions
Ant
agon
istic
Mea
nsp
ecie
sri
chne
ss,t
otal
com
mun
ityab
unda
nce,
func
tiona
lgro
upab
unda
nce,
extin
ctio
nfr
eque
ncy,
and
tem
pora
lvar
iabi
lity
inab
unda
nce
Lat
itude
Com
pari
ngra
wpr
oper
ties
Tuc
k&
Rom
anuk
(201
2)R
obus
tnes
sto
ther
mal
vari
abili
tydi
ffers
alon
ga
latit
udin
algr
adie
ntin
zoop
lank
ton
com
mun
ities
Ant
agon
istic
Lin
k,ch
ain,
omni
vory
prop
ertie
sA
ltitu
de(r
iver
grad
ient
)C
ompa
ring
raw
prop
ertie
sR
oman
uket
al.(2
006)
The
stru
ctur
eof
food
web
sal
ong
rive
rne
twor
ksA
ntag
onis
ticT
roph
icgr
oups
,lin
kage
dens
ity,
conn
ecta
nce,
gene
ralit
y,vu
lner
abili
ty,t
roph
icpa
thle
ngth
Hum
anim
pact
Com
pari
ngra
wpr
oper
ties
Col
letal
.(2
011)
Food
-web
stru
ctur
eof
seag
rass
com
mun
ities
acro
ssdi
ffere
ntsp
atia
lsca
les
and
hum
anim
pact
s
Ant
agon
istic
Spec
ializ
atio
nL
atitu
deN
ullm
odel
Dal
sgaa
rdet
al.(2
017)
Opp
osed
latit
udin
alpa
tter
nsof
netw
ork-
deri
ved
and
diet
ary
spec
ializ
atio
nin
avia
npl
ant–
frug
ivor
ein
tera
ctio
nsy
stem
sM
utua
listic
Spec
ializ
atio
nL
atitu
deN
ullm
odel
Pauw
&St
anw
ay(2
015)
Unr
ival
led
spec
ializ
atio
nin
apo
llina
tion
netw
ork
from
Sout
hA
fric
are
veal
sth
atsp
ecia
lizat
ion
incr
ease
sw
ithla
titud
eon
lyin
the
Sout
hern
Hem
isph
ere
Ant
agon
istic
Mas
srat
iosb
etw
een
trop
hic
leve
lsL
atitu
deC
ompa
ring
raw
prop
ertie
sR
omer
oet
al.(2
016)
Food
-web
stru
ctur
esh
aped
byha
bita
tsiz
ean
dcl
imat
eac
ross
ala
titud
inal
grad
ient
Ant
agon
istic
Vul
nera
bilit
y,ge
nera
lity,
link
dens
ity,i
nter
actio
ndi
vers
ity,
com
part
men
tdiv
ersi
ty
Lan
dsca
peco
mpo
sitio
nC
ompa
ring
raw
prop
ertie
sFa
bian
etal
.(2
013)
Impo
rtan
ceof
land
scap
ean
dsp
atia
lst
ruct
ure
for
hym
enop
tera
n-ba
sed
food
web
sin
anag
ro-e
cosy
stem
Biological Reviews 93 (2018) 785–800 © 2017 Cambridge Philosophical Society
Networks along environmental gradients 793
Fig. 2. Methods to compare ecological networks illustratedfor the case study of plant–hummingbird mutualistic networksalong an elevation gradient in Costa Rica: wet forest (50 m;10◦26′N, 84◦01′W), pre-montane forest (1000 m; 10◦16′N,84◦05′W), and lower montane wet forest (2000 m; 10◦11′N,84◦07′W). For further details about the study site, seeMaglianesi et al. (2014). (A) Connectance and functionalmismatch (measured as the mean absolute difference betweenbill and flower corolla length) versus elevation. (B) Observedfunctional matching compared to two null models: randomized999 times within each local network (grey) and the niche modelof species interaction (orange; Williams & Martinez, 2000). Theblack line represents the median, the upper and lower limits ofthe box are the first and third quartile, respectively, and thewhiskers represent 1.5 times the distance between the first andthird quartiles. (C) Correlation between the observed interactionfrequencies and those expected from a metaweb assuming thehighest frequency of interaction for species with matching billand corolla standardized length.
(5) Comparison to a hypothesis-based metaweb
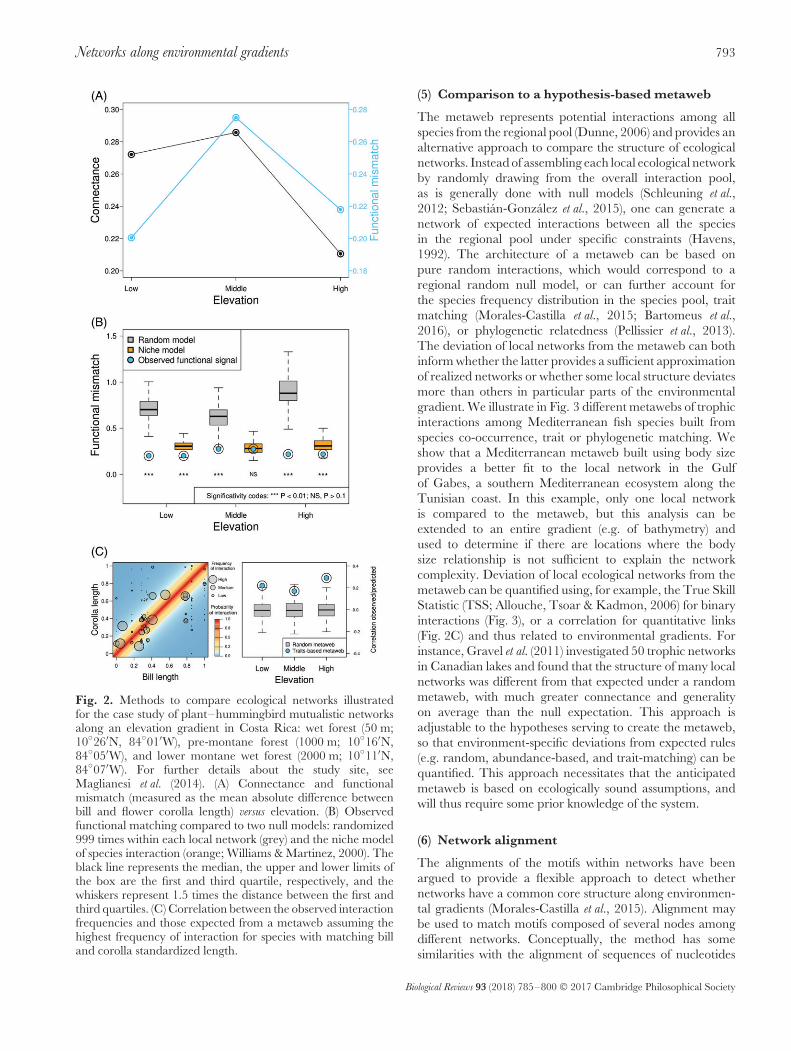
The metaweb represents potential interactions among allspecies from the regional pool (Dunne, 2006) and provides analternative approach to compare the structure of ecologicalnetworks. Instead of assembling each local ecological networkby randomly drawing from the overall interaction pool,as is generally done with null models (Schleuning et al.,2012; Sebastian-Gonzalez et al., 2015), one can generate anetwork of expected interactions between all the speciesin the regional pool under specific constraints (Havens,1992). The architecture of a metaweb can be based onpure random interactions, which would correspond to aregional random null model, or can further account forthe species frequency distribution in the species pool, traitmatching (Morales-Castilla et al., 2015; Bartomeus et al.,2016), or phylogenetic relatedness (Pellissier et al., 2013).The deviation of local networks from the metaweb can bothinform whether the latter provides a sufficient approximationof realized networks or whether some local structure deviatesmore than others in particular parts of the environmentalgradient. We illustrate in Fig. 3 different metawebs of trophicinteractions among Mediterranean fish species built fromspecies co-occurrence, trait or phylogenetic matching. Weshow that a Mediterranean metaweb built using body sizeprovides a better fit to the local network in the Gulfof Gabes, a southern Mediterranean ecosystem along theTunisian coast. In this example, only one local networkis compared to the metaweb, but this analysis can beextended to an entire gradient (e.g. of bathymetry) andused to determine if there are locations where the bodysize relationship is not sufficient to explain the networkcomplexity. Deviation of local ecological networks from themetaweb can be quantified using, for example, the True SkillStatistic (TSS; Allouche, Tsoar & Kadmon, 2006) for binaryinteractions (Fig. 3), or a correlation for quantitative links(Fig. 2C) and thus related to environmental gradients. Forinstance, Gravel et al. (2011) investigated 50 trophic networksin Canadian lakes and found that the structure of many localnetworks was different from that expected under a randommetaweb, with much greater connectance and generalityon average than the null expectation. This approach isadjustable to the hypotheses serving to create the metaweb,so that environment-specific deviations from expected rules(e.g. random, abundance-based, and trait-matching) can bequantified. This approach necessitates that the anticipatedmetaweb is based on ecologically sound assumptions, andwill thus require some prior knowledge of the system.
(6) Network alignment
The alignments of the motifs within networks have beenargued to provide a flexible approach to detect whethernetworks have a common core structure along environmen-tal gradients (Morales-Castilla et al., 2015). Alignment maybe used to match motifs composed of several nodes amongdifferent networks. Conceptually, the method has somesimilarities with the alignment of sequences of nucleotides
Biological Reviews 93 (2018) 785–800 © 2017 Cambridge Philosophical Society
794 Loïc Pellissier and others
(A) (B) (C)
Fig. 3. Hypothesis-based metaweb of fish from the Mediterranean Sea. Upper images show three contrasting hypothesis-basedmetawebs, based on (A) body size data from Barnes et al. (2008), (B) habitat preferences (e.g. benthic, pelagic; Albouy et al., 2015) and(C) phylogenetic distance between groups of co-occurring species based on the phylogeny of Mediterranean fish in Meynard et al.(2012). Lower images show metaweb expectations compared to the observed food web for the Gulf of Gabes on the Tunisian coast(Hattab et al., 2016). The grey colour on the graph represents the observed values, blue represents the expected values according tothe hypothesis, and brown is the match between the expected and observed values. The body size hypothesis showed the strongestassociation to the observed Gabes food web with the highest True Skill Statistic (TSS) values (TSSsize = 0.55, TSShabitat = 0.5,TSSphylo = 0.44). This comparison can be applied to any food web across the Mediterranean Sea.
performed to compute phylogenies, as it needs to maximizethe motif match among networks using a cost function. Thecost function could be simple (e.g. by looking at the fractionof matched interactions for each pair of nodes) or use afiner description of the topology. For instance, Stouffer et al.(2012) computed the motif profile for each node, i.e. thefrequency at which a node belongs to a set of motifs – alsocalled species role – and computed the average correlationbetween the profiles of pairs of nodes. This approach can beextended to evaluate the recurrence of common motifs acrossnetworks in distinct environments and can identify whichconserved regions of the network are key to its functioning(Baker et al., 2015). This approach enables us to quantifythe similarity of the topology between very different pairs ofecological networks, even those with no species in common,such as between marine and terrestrial systems. However, itstill requires further development to become a standard toolfor network comparison along environmental gradients.
(7) Statistical model coupling co-occurrence withinteractions
The dissimilarity among ecological networks along environ-mental gradients can be decomposed using a set of statisticalmodels for species distributions and their interactions (Gravelet al., 2016). Models of co-occurrence or co-variation inabundance, so called joint species distribution models, have
been developed over the last decade (Pollock et al., 2014;Warton et al., 2015; Ovaskainen et al., 2017). These jointspecies distribution models predict species distributions basedon environmental and spatial variables and allow sharing ofinformation on species distribution and thereby improve theestimation of parameters. Statistical models might not onlyintegrate co-occurrence, but also the interactions that linkspecies to each other to account better for the way abiotic andbiotic factors interact with each other to shape species assem-blages along environmental gradients (Cazelles et al., 2016).For instance, Gravel et al. (2016) combined a co-occurrencemodel with a trait-matching model, both interacting withclimatic variations, to understand more mechanistically thedrivers of interaction turnover in plant–herbivore networks.The main limitation of this approach, however, is that itrequires a large amount of replicated records of interactionsalong environmental gradients for calibration and toperform a suitable evaluation of the model parameters,including the interaction between abiotic and biotic effects.
IV. WHAT IS THE BEST APPROACH FORCOMPARING ECOLOGICAL NETWORKS?
Studies comparing ecological networks along environmentalgradients are relatively scarce in contrast to more traditional
Biological Reviews 93 (2018) 785–800 © 2017 Cambridge Philosophical Society

Networks along environmental gradients 795
community analyses looking at species richness or functionaltraits within a single trophic level. We reviewed 25studies (Table 1) that compared ecological networks alonga variety of gradients, including elevation (Devoto et al.,2005; Ramos-Jiliberto et al., 2010; Maunsell et al., 2015)and latitude (Sebastian-Gonzalez et al., 2015). This limitednumber of studies contrasts with the hundreds of publicationsin community ecology (Gotzenberger et al., 2012). Theuse of residual correlations and null models were themost common approaches to standardize and compareecological networks along environmental gradients. Onlyone study used a metaweb (Gravel et al., 2011) or a fullspecies co-occurrence–interaction coupled model (Gravelet al., 2016) to evaluate the role of the abiotic environmentin shaping ecological networks. Moreover, most studiescompared summary properties based on the distribution oflinks and network topologies along environmental gradients,and generally did not include functional traits. Researchersinvestigating the structure of ecological networks alonggradients should agree on the most appropriate approach(es)given a data set, and ponder the nature of the variation – andits ecological interpretation – that is quantified.
(1) The plant–hummingbird case study
Here, we compare direct and standardized quantificationof the structure of ecological networks using a dataset of plant–hummingbird mutualistic interactions alongan elevation gradient in Costa Rica. Maglianesi et al.(2014) recorded plant visitation by hummingbirds overa year at three different elevations in Costa Ricaand constructed quantitative networks of interactionfrequencies. Observations of interactions between plant andhummingbird species in the understorey were carried outusing videotaping of flowers. Tracked individual plantswere randomly selected for each species at each studysite. To record visits of hummingbirds to individualplants, unattended cameras were fixed 10 m from openflowers for periods of 120 min between 06:00 and 14:00 h.Morphological traits for hummingbirds and plants weremeasured, including bill length and corolla length, whichare expected to drive interactions in this type of network(Maglianesi et al., 2014).
(2) Comparison of plant–hummingbird networkproperties
We compared the connectance along elevation to exemplifythe direct use of a summary metric. We found thatconnectance decreased with elevation (Fig. 2A), while speciesrichness was constant (low elevation network 28 species;medium elevation network 26 species; high elevationnetwork 28 species). Connectance is a topological measure,representing the ratio of realized links over potential links.Even though they present the same species richness, theconfiguration of the three networks is different (e.g. 7bird species and 21 plant species at low elevation; 9 birdspecies and 19 plant species at high elevation). The shape
of the interaction matrices (lines × columns) constrains thenumber of potential links and the connectance within eachnetwork. The variation in connectance may be due toenvironmental filtering acting on species co-occurrence or achange in how species interact, but a direct comparison ofconnectance provides limited information on those processes.We therefore combined ecological networks with speciesfunctional traits and evaluated the role of trait matching inconstraining these interactions. We quantified the absolutemean difference between species bill and corolla length foreach observed interaction. This unstandardized measure offunctional mismatch was lowest for the low elevation sites,peaked at the middle elevation site and was low again inthe highest elevation site (Fig. 2A). Using a direct approach,it remains unclear whether the trait-matching constraintchanges over the gradient, or is driven by underlying changesin species functional traits in the species pool.
(3) Comparison of trait matching with two nullmodels
We next compared observed trait matching to two differentnull expectations, a model where the frequencies ofinteractions were randomized within each network and theniche model of food-web structure (Williams & Martinez,2000). Compared to the random null model, all theobserved trait matches were significantly lower than random,suggesting that the observed matching cannot be generatedby a random distribution of the interactions within eachnetwork (Fig. 2B). The use of the niche model as a nullhypothesis, as in Dunne, Williams & Martinez (2004),provides more conservative results, with the middle-elevationsite not different from the null model. These results suggestthat the partitioning of interactions between hummingbirdsand plants along a directional niche axis (defined with acentroid and a range) is sufficient to explain the structure ofthe middle-elevation site, while the other methods suggesta more complex structure. In these cases, the centroid andrange of the empirical networks are not random, and showmore pronounced niche partitioning due to traits. Hence,the selection of the appropriate null model, either straightrandomization (Schleuning et al., 2012), or the niche model(Dunne et al., 2004), should be explicitly justified and itshypothesis clearly established.
(4) The use of hypothesis-based metaweb
We built hypothesis-based metawebs to which localecological networks can be compared. We constructeda metaweb assuming perfect matching between bill andflower length (Maglianesi et al., 2014). With this hypothesis,interactions are expected to be more frequent near the 1:1line of a matrix, in which hummingbird bill and plant corollaare ordered by size. The middle-elevation site is slightly lower,but all sites conform moderately well to the metaweb-basedhypothesis of functional matching, with the highest elevationshowing the best match (Fig. 2C). For comparison, wegenerated a set of 999 random metawebs and extracted
Biological Reviews 93 (2018) 785–800 © 2017 Cambridge Philosophical Society

796 Loïc Pellissier and others
from each three local webs. We tested whether similar levelsof correlation between the observed and modelled interactionarose from random regional metawebs. As found with therandomization performed within each network using thenull-model approach, the correlation from a subset of thefunctional metaweb was higher than from a subset of arandom regional metaweb. This indicates that all threenetworks are more consistent with functional matching thanrandom assembly.
(5) Conclusions from the plant–hummingbirdnetworks
Together, the direct (Fig. 2A, B) and the standardizedapproaches (Fig. 2C) provide different insights into howand why the structure of plant–hummingbird ecologicalnetworks varies along this elevation gradient. Scoringof sites in terms of intensity of matching differed in adirect comparison of the matching values (mean differencebetween species bill and corolla length in mm: low = 0.2,middle = 0.27, high = 0.22; Fig. 2A), the random null model(SES: low = −4.37, middle = −3.9, high = −3.5; Fig. 2B),the niche model (SES: low = −2.58, middle = −1.28,high = −2.9; Fig. 2B) and after a standardization with ametaweb (correlation to the functional metaweb: low = 0.22,middle = 0.17, high = 0.29; Fig. 2C). While the SES of thenull model decreased with increasing elevation, the rankingof SES for the niche model showed a different order,with the greatest value in the high-elevation site. Finally,the highest elevation site also provided a better matchfor the hypothesis of trait matching as evidenced by themetaweb comparison. Although the plant–hummingbirdcase provides a first caution regarding the importanceof methodological choice in a comparison of ecologicalnetworks, evaluating a greater variety of networks (e.g.antagonistic) across different environmental gradients andwith different methods is needed. Our illustration calls for acareful selection of appropriate methods according to priorhypotheses, since the selection of the method will essentiallydetermine the variation being analysed.
V. CONCLUSIONS
(1) There is a limited number of investigations of ecologicalnetwork variation along environmental gradients becauseof the difficulty of quantifying interactions among species.Nevertheless, we expect that the rise of molecular techniqueswill allow better and faster quantification of ecologicalnetworks (Pompanon et al., 2012; Roslin & Majaneva, 2016;Vacher et al., 2016), allowing more spatial replication alongenvironmental gradients. Moreover, the use of automatedrecording systems (Weinstein, 2015; Bohan et al., 2017) isalso expected to expedite the collection of interaction datacompared with manual techniques.
(2) Species information such as functional traits should becollected together with interactions in order to reach a good
ecological understanding of why ecological networks varyalong gradients. Alternatively, trait data might be gatheredfrom available databases in isolation from the interaction,but the resulting analyses would not be able to highlightintraspecific co-variation between phenotypic traits andnetwork structure along environmental gradients. When traitdata are unavailable, a comparison of ecological networksalong environmental gradients is limited to approaches thatdo not rely on functional traits (e.g. Dalsgaard et al., 2013;Sebastian-Gonzalez et al., 2015), but that might provide morelimited ecological inferences.
(3) Several approaches have been used to compareecological networks either by analysing raw propertiesor using forms of standardization. Our review and casestudy suggest that different approaches are not directlycomparable, and that this precludes, for the present,any meta-analysis of network variation along multiplegradients. Beyond analytical results, we call for furtherefforts to facilitate the exchange of raw data of speciesinteraction networks along environmental gradients [e.g.MANGAL (Poisot et al., 2016), ‘Interactionweb’ or ‘Webof Life’]. Finally, studies comparing different approachesusing empirical (e.g. bipartite antagonistic or mutualisticnetworks, food webs) or simulated data sets and discussingmethodological bias are critical to provide guidance to selectan appropriate methodology when comparing ecologicalnetworks.
(4) We stress the need to agree on the mostappropriate methodology to compare ecological networksalong environmental gradients – on the one hand, whenonly data on network structure are available, and on theother when functional traits are also available. It is unlikelythat one methodology can be used to answer all possiblequestions and future research should focus on understandinglinks between the different methodologies and the questionsthat they may answer.
VI. ACKNOWLEDGEMENTS
We thank the CUSO, who financed a workshop inSwitzerland, and Laure Gallien and Damaris Zurell,who organised a workshop in Germany. This study wasfinanced by the National Swiss Fund for research (SNSF)project ‘‘Lif3web’’, n◦162604. M.L. was supported by theTULIP Laboratory of Excellence (ANR-10-LABX-41). W.T.acknowledges support from the ANR GlobNets project(ANR-16-CE02-0009). G.W. acknowledges support fromNERC (NE/M020843/1). N.E.Z. acknowledges supportfrom SNSF (grants 31003A_149508 and 310030L_170059).J.B. was supported by a European Research Council’sAdvanced Grant. M.A.M. acknowledges financial supportfrom Consejo Nacional para Investigaciones Científicasy Tecnologicas and Ministerio de Ciencia y Tecnología,Universidad Estatal a Distancia, Organization for TropicalStudies, German Academic Exchange Service and theresearch-funding program ‘LOEWE-Landes-Offensive zur
Biological Reviews 93 (2018) 785–800 © 2017 Cambridge Philosophical Society
Networks along environmental gradients 797
Entwicklung Wissenschaftlich-o.. konomischer Exzellenz’’of Hesse’s Ministry of Higher Education, Research, andthe Arts.
VII. REFERENCES
Aizen, M. A., Gleiser, G., Sabatino, M., Gilarranz, L. J., Bascompte, J. &Verdu, M. (2016). The phylogenetic structure of plant-pollinator networks increaseswith habitat size and isolation. Ecology Letters 19, 29–36.
Aizen, M. A., Morales, C. L., Morales, J. M., Goulson, D. & Nowakowski, M.(2008). Invasive mutualists erode native pollination webs. PLoS Biology 6, e31.
Albouy, C., Lasram, F. B. R., Velez, L., Guilhaumon, F., Meynard, C.N., Boyer, S., Benestan, L., Mouquet, N., Douzery, E., Aznar, R.,Troussellier, M., Somot, S., Leprieur, F., Le Loc’’h, F. & Mouillot,D. (2015). FishMed: traits, phylogeny, current and projected species distribution ofMediterranean fishes, and environmental data. Ecology 96, 2312–2313.
Albouy, C., Velez, L., Coll, M., Colloca, F., Le Loc’h, F., Mouillot, D. &Gravel, D. (2014). From projected species distribution to food-web structure underclimate change. Global Change Biology 20, 730–741.
Albrecht, M., Padron, B., Bartomeus, I. & Traveset, A. (2014). Consequencesof plant invasions on compartmentalization and species ’ roles in plant–pollinatornetworks. Proceedings of the Royal Society of London Series B 281. https://doi.org/10.1098/rspb.2014.0773.
Allouche, O., Tsoar, A. & Kadmon, R. J. (2006). Assessing the accuracy of speciesdistribution models: prevalence, kappa and the true skill statistic (TSS). Journal of
Applied Ecology 43, 1223–1232.Baker, N. J., Kaartinen, R., Roslin, T. & Stouffer, D. B. (2015). Species’ roles in
food webs show fidelity across a highly variable oak forest. Ecography 38, 130–139.Barnes, C., Bethea, D. M., Brodeur, R. D., Spitz, J., Ridoux, V., Pusineri, C.,
Chase, B. C., Hunsicker, M. E., Juanes, F., Kellermann, A., Lancaster, J.,Menard, F., Bard, F. X., Munk, P., Pinnegar, J. K., et al. (2008). Predator andprey body size in marine food webs. Ecology 89, 881–881.
Bartomeus, I., Gravel, D., Tylianakis, J. M., Aizen, M. A., Dickie, I. A. &Bernard-Verdier, M. (2016). A common framework for identifying linkage rulesacross different types of interactions. Functional Ecology 30, 1894–1903.
Bascompte, J., Jordano, P., Melian, C. J. & Olesen, J. M. (2003). The nestedassembly of plant-animal mutualistic networks. Proceedings of the National Academy of
Sciences of the United States of America 100, 9383–9387.Bascompte, J. & Melian, C. J. (2005). Simple trophic modules for complex food
webs. Ecology 86, 2868–2873.Beaumont, M. A. (2010). Approximate Bayesian computation in evolution and
ecology. Annual Review of Ecology, Evolution, and Systematics 41, 379–406.Beckerman, A. P., Petchey, O. L. & Warren, P. H. (2006). Foraging biology
predicts food web complexity. Proceedings of the National Academy of Sciences of the United
States of America 103, 13745–13749.de Bello, F., Lavorel, S., Lavergne, S., Albert, C. H., Boulangeat, I.,
Mazel, F. & Thuiller, W. (2013). Hierarchical effects of environmental filterson the functional structure of plant communities: a case study in the French Alps.Ecography 36, 393–402.
Bluthgen, N., Frund, J., Vazquez, D. P. & Menzel, F. (2008). What dointeraction network metrics tell us about specialization and biological traits. Ecology
89, 3387–3399.Bohan, D. A., Vacher, C., Tamaddoni-Nezhad, A., Raybould, A., Dumbrell,
A. J. & Woodward, G. (2017). Next-generation global biomonitoring: large-scale,automated reconstruction of ecological networks. Trends in Ecology & Evolution 32,477–487.
Brose, U., Williams, R. J. & Martinez, N. D. (2006). Allometric scaling enhancesstability in complex food webs. Ecology Letters 9, 1228–1236.
Canard, E. F., Mouquet, N., Mouillot, D., Stanko, M., Miklisova, D. &Gravel, D. (2014). Empirical evaluation of neutral interactions in host-parasitenetworks. The American Naturalist 183, 468–479.
Cattin, M. F., Bersier, L. F., Banasek-Richter, C., Baltensperger, R. &Gabriel, J. P. (2004). Phylogenetic constraints and adaptation explain food-webstructure. Nature 427, 835–839.
Cazelles, K., Araujo, M. B., Mouquet, N. & Gravel, D. (2016). A theory forspecies co-occurrence in interaction networks. Theoretical Ecology 9, 39–48.
Chase, J. M. (2003). Strong and weak trophic cascades along a productivity gradient.Oikos 101, 187–195.
Choler, P., Michalet, R. & Callaway, R. M. (2001). Facilitation and competitionon gradients in apline plant communities. Ecology 82, 3295–3308.
Cirtwill, A. R. & Stouffer, D. B. (2016). Knowledge of predator-prey interactionsimproves predictions of immigration and extinction in island biogeography. Global
Ecology and Biogeography 25, 900–911.
Clarke, K. R. & Warwick, R. M. (1999). The taxonomic distinctness measure ofbiodiversity: weighting of step lengths between hierarchical levels. Marine Ecology–
Progress Series 184, 21–29.Clauset, A., Moore, C. & Newman, M. E. J. (2008). Hierarchical structure and the
prediction of missing links in networks. Nature 453, 98–101.Coll, M., Schmidt, A., Romanuk, T., Lotze, H. K. & Osman, R. (2011). Food-web
structure of seagrass communities across different spatial scales and human impacts.PLoS ONE 6, e22591.
Cornwell, W. K. & Ackerly, D. D. (2009). Community assembly and shifts in planttrait distributions across an environmental gradient in coastal California. Ecological
Monographs 79, 109–126.Dainese, M., Leps, J. & de Bello, F. (2015). Different effects of elevation, habitat
fragmentation and grazing management on the functional, phylogenetic andtaxonomic structure of mountain grasslands. Perspectives in Plant Ecology, Evolution
and Systematics 17, 44–53.Dalsgaard, B., Magard, E., Fjeldsa, J., Martín Gonzalez, A. M., Rahbek, C.,
Olesen, J. M., Ollerton, J., Alarcon, R., Cardoso Araujo, A., Cotton,P. A., Lara, C., Machado, C. G., Sazima, I., Sazima, M., Timmermann, A.,Watts, S., et al. (2011). Specialization in plant-hummingbird networks is associatedwith species richness, contemporary precipitation and quaternary climate-changevelocity. PLoS ONE 6, e25891.
Dalsgaard, B., Schleuning, M., Maruyama, P. K., Dehling, D. M., Sonne,J., Vizentin-Bugoni, J., Zanata, T. B., Fjeldsa, J., Bohning-Gaese, K. &Rahbek, C. (2017). Opposed latitudinal patterns of network-derived and dietaryspecialization in avian plant-frugivore interaction systems. Ecography 40, 001–007.https://doi.org/10.1111/ecog.02604.
Dalsgaard, B., Trøjelsgaard, K., Martín Gonzalez, A. M., Nogues-Bravo,D., Ollerton, J., Petanidou, T., Sandel, B., Schleuning, M., Wang, Z.,Rahbek, C., Sutherland, W. J., Svenning, J.-C. & Olesen, J. M. (2013).Historical climate-change influences modularity and nestedness of pollinationnetworks. Ecography 36, 1331–1340.
Devoto, M., Medan, D. & Montaldo, N. H. (2005). Patterns of interaction betweenplants and pollinators along an environmental gradient. Oikos 109, 461–472.
Diamond, J. M. & Cody, M. L. (1975). Assembly of species community. In Ecology And
Evolution of Communities (Volume , eds M. L. Cody and J. Diamond), pp. 342–344.Belknap, Cambridge.
Diserud, O. H. & Odegaard, F. (2007). A multiple-site similarity measure. Biology
Letters 3, 20–22.Dunne, J. A. (2006). The network structure of food webs. In Ecological Networks: Linking
Structure to Dynamics in Food Webs, pp. 27–92. Oxford University Press, New York,USA.
Dunne, J. A., Williams, R. J. & Martinez, N. D. (2002). Food-web structure andnetwork theory: The role of connectance and size. Proceedings of the National Academy
of Sciences of the United States of America 99, 12917–12922.Dunne, J. A., Williams, R. J. & Martinez, N. D. (2004). Network structure and
robustness of marine food webs. Marine Ecology – Progress Series 273, 291–302.Elton, C. S. (1924). Periodic fluctuations in the numbers of animals: their causes and
effects. British Journal of Experimental Biology 2, 119–163.Fabian, Y., Sandau, N., Bruggisser, O. T., Aebi, A., Kehrli, P., Rohr, R. P.,
Naisbit, R. E. & Bersier, L.-F. (2013). The importance of landscape and spatialstructure for hymenopteran-based food webs in an agro-ecosystem. Journal of Animal
Ecology 82, 1203–1214.García-Robledo, C., Erickson, D. L., Staines, C. L., Erwin, T. L. & Kress,
W. J. (2013). Tropical plant–herbivore networks: reconstructing species interactionsusing DNA barcodes. PLoS ONE 8, e52967.
Gonzalez, M. A., Roger, A., Courtois, E. A., Jabot, F., Norden, N., Paine,C. E. T., Baraloto, C., Thebaud, C. & Chave, J. (2010). Shifts in speciesand phylogenetic diversity between sapling and tree communities indicate negativedensity dependence in a lowland rain forest. Journal of Ecology 98, 137–146.
Gonzalez-Varo, J. P., Arroyo, J. M. & Jordano, P. (2014). Who dispersed theseeds? The use of DNA barcoding in frugivory and seed dispersal studies. Methods in
Ecology and Evolution 5, 806–814.Gotelli, N. J. (2001). A Primer of Ecology, Third Edition (Sinauer Associates, Inc.,
Sunderland.Gotelli, N. J. & Colwell, R. K. (2001). Quantifying biodiversity: procedures and
pitfalls in the measurement and comparison of species richness. Ecology Letters 4,379–391.
Gotelli, N. J. & Graves, G. R. (1996). Null Models in Ecology. Smithsonian InstitutionPress, Washington.
Gotzenberger, L., de Bello, F., Brathen, K. A., Davison, J., Dubuis, A.,Guisan, A., Leps, J., Lindborg, R., Moora, M., Partel, M., Pellissier, L.,Pottier, J., Vittoz, P., Zobel, K. & Zobel, M. (2012). Ecological assemblyrules in plant communities-approaches, patterns and prospects. Biological Reviews 87,111–127.
Graham, C. H., Parra, J. L., Rahbek, C. & McGuire, J. A. (2009). Phylogeneticstructure in tropical hummingbird communities. Proceedings of the National Academy of
Sciences of the United States of America 106, 19673–19678.
Biological Reviews 93 (2018) 785–800 © 2017 Cambridge Philosophical Society

798 Loïc Pellissier and others
Gravel, D., Baiser, B., Dune, J. A., Kopelke, J.-P., Martinez, N. D., Nyman,T., Poisot, T., Stouffer, D. B., Tylianakis, J. M., Wood, S. A. & Roslin, T.(2016). Bringing Elton and Grinnell together: a quantitative framework to representthe biogeography of ecological interaction networks. bioRxiv. https://doi.org/10.1101/055558.
Gravel, D., Massol, F., Canard, E., Mouillot, D. & Mouquet, N. (2011).Trophic theory of island biogeography. Ecology Letters 14, 1010–1016.
Gravel, D., Poisot, T., Albouy, C., Velez, L. & Mouillot, D. (2013). Inferringfood web structure from predator-prey body size relationships. Methods in Ecology and
Evolution 4, 1083–1090.Hattab, T., Leprieur, F., Ben Rais Lasram, F., Gravel, D., Loc’h, F. L. &
Albouy, C. (2016). Forecasting fine-scale changes in the food-web structure ofcoastal marine communities under climate change. Ecography 39, 1227–1237.
Havens, K. (1992). Scale and structure in natural food webs. Science 257, 1107–1109.Hudson, L. N., Emerson, R., Jenkins, G. B., Layer, K., Ledger, M. E., Pichler,
D. E., Thompson, M. S. A., O’Gorman, E. J., Woodward, G. & Reuman, D. C.(2013). Cheddar: analysis and visualisation of ecological communities in R. Methods
in Ecology and Evolution 4, 99–104.Jordano, P. (1987). Patterns of mutualistic interactions in pollination and seed
dispersal: connectance, dependence asymmetries, and coevolution. The American
Naturalist 129, 657–677.Jordano, P., Bascompte, J. & Olesen, J. M. (2003). Invariant properties in
coevolutionary networks of plant-animal interactions. Ecology Letters 6, 69–81.Jurado-Rivera, J. A., Vogler, A. P., Reid, C. A. M., Petitpierre, E. &
Gomez-Zurita, J. (2009). DNA barcoding insect–host plant associations. Proceedings
of the Royal Society of London Series B: Biological Sciences 276, 639–648.Kissling, W. D., Dormann, C. F., Groeneveld, J., Hickler, T., Kuhn, I.,
McInerny, G. J., Montoya, J. M., Romermann, C., Schiffers, K., Schurr,F. M., Singer, A., Svenning, J. C., Zimmermann, N. E. & O’Hara, R. B.(2012). Towards novel approaches to modelling biotic interactions in multispeciesassemblages at large spatial extents. Journal of Biogeography 39, 2163–2178.
Kissling, W. D. & Schleuning, M. (2015). Multispecies interactions across trophiclevels at macroscales: retrospective and future directions. Ecography 38, 346–357.
Kopp, D., Lefebvre, S., Cachera, M., Villanueva, M. C. & Ernande, B. (2015).Reorganization of a marine trophic network along an inshore–offshore gradientdue to stronger pelagic–benthic coupling in coastal areas. Progress in Oceanography
130, 157–171.Krasnov, B. R., Fortuna, M. A., Mouillot, D., Khokhlova, I. S., Shenbrot,
G. I. & Poulin, R. (2012). Phylogenetic signal in module composition and speciesconnectivity in compartmentalized host-parasite networks. American Naturalist 179,501–511.
Krasnov, B. R., Mouillot, D., Shenbrot, G. I., Khokhlova, I. S. & Poulin,R. (2004). Geographical variation in host specificity of fleas (Siphonaptera) parasiticon small mammals: the influence of phylogeny and local environmental conditions.Ecography 27, 787–797.
Lafferty, K. D., Allesina, S., Arim, M., Briggs, C. J., De Leo, G., Dobson, A. P.,Dunne, J. A., Johnson, P. T. J., Kuris, A. M., Marcogliese, D. J., Martinez,N. D., Memmott, J., Marquet, P. A., McLaughlin, J. P., Mordecai, E. A.,Pascual, M., Poulin, R. & Thieltges, D. W. (2008). Parasites in food webs: theultimate missing links. Ecology Letters 11, 533–546.
Layer, K., Hildrew, A., Monteith, D. & Woodward, G. (2010). Long-termvariation in the littoral food web of an acidified mountain lake. Global Change Biology
16, 3133–3143.Layer, K., Hildrew, A. G. & Woodward, G. (2013). Grazing and detritivory in 20
stream food webs across a broad pH gradient. Oecologia 171, 459–471.Legendre, P., Borcard, D. & Peres-Neto, P. R. (2005). Analyzing beta
diversity: Partitioning the spatial variation of community composition data. Ecological
Monographs 75, 435–450.Leibold, M. A. (1995). The niche concept revisited: mechanistic models and
community context. Ecology 76, 1371–1382.Lindeman, R. L. (1942). The trophic-dynamic aspect of ecology. Ecology 23, 399–417.Lomolino, M. V. (2001). Elevation gradients of species-density: historical and
prospective views. Global Ecology and Biogeography 10, 3–13.Macpherson, E. (2002). Large-scale species-richness gradients in the Atlantic Ocean.
Proceedings of the Royal Society of London Series B: Biological Sciences 269, 1715–1720.Maglianesi, M. A., Bluthgen, N., Bohning-Gaese, K. & Schleuning,
M. (2014). Morphological traits determine specialization and resource use inplant–hummingbird networks in the neotropics. Ecology 95, 3325–3334.
Margalef, R. (1963). On certain unifying principles in Ecology. The American Naturalist
97, 357–374.Martín Gonzalez, A. M., Dalsgaard, B., Nogues-Bravo, D., Graham, C.
H., Schleuning, M., Maruyama, P. K., Abrahamczyk, S., Alarcon, R.,Araujo, A. C., Araujo, F. P., Azevedo, d., Severino, M., Baquero, A. C.,Cotton, P. A., Ingversen, T. T., Kohler, G., et al. (2015). The macroecologyof phylogenetically structured hummingbird-plant networks. Global Ecology and
Biogeography 24, 1212–1224.Martinez, N. D. (1992). Constant connectance in community food webs. The American
Naturalist 139, 1208–1218.
Maunsell, S. C., Kitching, R. L., Burwell, C. J. & Morris, R. J. (2015). Changesin host-parasitoid food web structure with elevation. Journal of Animal Ecology 84,353–363.
May, R. M. (1972). Will a large complex system be stable? Nature 238, 413–414.Melian, C. J., Krivan, V., Altermatt, F., Stary, P., Pellissier, L. & De
Laender, F. (2015). Dispersal dynamics in food webs. The American Naturalist 185,157–168.
Memmott, J. (1999). The structure of a plant-pollinator food web. Ecology Letters 2,276–280.
Meynard, C. N., Mouillot, D., Mouquet, N. & Douzery, E. J. P. (2012). Aphylogenetic perspective on the evolution of Mediterranean teleost fishes. PLoS ONE
7, e36443.Milo, R., Shen-Orr, S., Itzkovitz, S., Kashtan, N., Chklovskii, D. & Alon,
U. (2002). Network motifs: simple building blocks of complex networks. Science 298,824–827.
Montoya, J. M., Pimm, S. L. & Sole, R. V. (2006). Ecological networks and theirfragility. Nature 442, 259–264.
Morales-Castilla, I., Matias, M. G., Gravel, D. & Araujo, M. B. (2015).Inferring biotic interactions from proxies. Trends in Ecology & Evolution 30, 347–356.
Morris, R. J., Gripenberg, S., Lewis, O. T. & Roslin, T. (2014). Antagonisticinteraction networks are structured independently of latitude and host guild. Ecology
Letters 17, 340–349.O’Gorman, E. J., Benstead, J. P., Cross, W. F., Friberg, N., Hood, J. M.,
Johnson, P. W., Sigurdsson, B. D. & Woodward, G. (2014). Climate changeand geothermal ecosystems: natural laboratories, sentinel systems, and future refugia.Global Change Biology 20, 3291–3299.
O’Gorman, E. J., Olafsson, O. P., Demars, B. O. L., Friberg, N., Guðbergsson,G., Hannesdottir, E. R., Jackson, M. C., Johansson, L. S., McLaughlin,O. B., Olafsson, J. S., Woodward, G. & Gíslason, G. M. (2016). Temperatureeffects on fish production across a natural thermal gradient. Global Change Biology 22,3206–3220.
Odum, H. (1956). Primary production in flowing waters. Limnology and Oceanography 1,102–117.
Odum, W. & Heald, E. (1975). Mangrove forests and aquatic productivity. In Coupling
of Land and Water Systems (Volume , ed. A. D. Hasler), pp. 129–136. Springer,Heidelberg.
Olesen, J. M., Bascompte, J., Dupont, Y. L. & Jordano, P. (2007). The modularityof pollination networks. Proceedings of the National Academy of Sciences of the United States
of America 104, 19891–19896.Olesen, J. M. & Jordano, P. (2002). Geographic patterns in plant-pollinator
mutualistic networks. Ecology 83, 2416–2424.Olesen, J. M., Stefanescu, C., Traveset, A., Amarasekare, P. & Chase, J.
(2011). Strong, long-term temporal dynamics of an ecological network. PLoS ONE
6, e26455.Ollerton, J., McCollin, D., Fautin, D. G. & Allen, G. R. (2007). Finding
NEMO: nestedness engendered by mutualistic organization in anemonefish andtheir hosts. Proceedings of the Royal Society of London Series B: Biological Sciences 274,591–598.
Osorio, S., Arnan, X., Bassols, E., Vicens, N. & Bosch, J. (2015). Local andlandscape effects in a host–parasitoid interaction network along a forest–croplandgradient. Ecological Applications 25, 1869–1879.
Ovaskainen, O., Tikhonov, G., Norberg, A., Guillaume Blanchet, F., Duan,L., Dunson, D., Roslin, T. & Abrego, N. (2017). How to make more out ofcommunity data? A conceptual framework and its implementation as models andsoftware. Ecology Letters 20, 561–576.
Paine, R. T. (1966). Food web complexity and species diversity. The American Naturalist
100, 65–75.Pauw, A. & Stanway, R. (2015). Unrivalled specialization in a pollination network
from South Africa reveals that specialization increases with latitude only in theSouthern Hemisphere. Journal of Biogeography 42, 652–661.
Pellissier, L., Fiedler, K., Ndribe, C., Dubuis, A., Pradervand, J.-N.,Guisan, A. & Rasmann, S. (2012). Shifts in species richness, herbivorespecialization, and plant resistance along elevation gradients. Ecology and Evolution 2,1818–1825.
Pellissier, L., Fournier, B., Guisan, A. & Vittoz, P. (2010). Plant traits co-varywith altitude in grasslands and forests in the European Alps. Plant Ecology 211,351–365.
Pellissier, L., Rohr, R. P., Ndiribe, C., Pradervand, J.-N., Salamin,N., Guisan, A. & Wisz, M. (2013). Combining food web and speciesdistribution models for improved community projections. Ecology and Evolution 3,4572–4583.
Peres-Neto, P. R. (2004). Patterns in the co-occurrence of fish species in streams:the role of site suitability, morphology and phylogeny versus species interactions.Oecologia 140, 352–360.
Petchey, O. L., Brose, U. & Rall, B. C. (2010). Predicting the effects of temperatureon food web connectance. Philosophical Transaction of the Royal Society B-Biological Sciences
365, 2081–2091.
Biological Reviews 93 (2018) 785–800 © 2017 Cambridge Philosophical Society

Networks along environmental gradients 799
Petchey, O. L., Eklof, A., Borrvall, C. & Ebenman, B. (2008). Trophically uniquespecies are vulnerable to cascading extinction. American Naturalist 171, 568–579.
Pimm, S. L. (1991). The balance of nature? Ecological issues in the conservation of species and
communities. University of Chicago Press, Chicago, USA.Poisot, T., Baiser, B., Dunne, J. A., Kefi, S., Massol, F., Mouquet, N.,
Romanuk, T. N., Stouffer, D. B., Wood, S. A. & Gravel, D. (2016).Mangal – making ecological network analysis simple. Ecography 39, 384–390.
Poisot, T., Canard, E., Mouillot, D., Mouquet, N. & Gravel, D. (2012). Thedissimilarity of species interaction networks. Ecology Letters 15, 1353–1361.
Poisot, T. & Gravel, D. (2014). When is an ecological network complex?Connectance drives degree distribution and emerging network properties. PeerJ
2, e251.Polis, G. A., Anderson, W. B. & Holt, R. D. (1997). Toward an integration of
landscape and food web ecology: the dynamics of spatially subsidized food webs.Annual Review of Ecology and Systematics 28, 289–316.
Pollock, L. J., Tingley, R., Morris, W. K., Golding, N., O’Hara, R. B., Parris,K. M., Vesk, P. A. & McCarthy, M. A. (2014). Understanding co-occurrence bymodelling species simultaneously with a Joint Species Distribution Model (JSDM).Methods in Ecology and Evolution 5, 397–406.
Polovina, J. J. (1984). Coral reefs model of a coral reef ecosystem. Coral Reefs 3, 1–11.Pompanon, F., Deagle, B. E., Symondson, W. O. C., Brown, D. S., Jarman, S. N.
& Taberlet, P. (2012). Who is eating what: diet assessment using next generationsequencing. Molecular Ecology 21, 1931–1950.
Pottier, J., Dubuis, A., Pellissier, L., Maiorano, L., Rossier, L., Randin, C.F., Vittoz, P. & Guisan, A. (2013). The accuracy of plant assemblage predictionfrom species distribution models varies along environmental gradients. Global Ecology
and Biogeography 22, 52–63.Pouilly, M., Barrera, S. & Rosales, C. (2006). Changes of taxonomic and trophic
structure of fish assemblages along an environmental gradient in the Upper Beniwatershed (Bolivia). Journal of Fish Biology 68, 137–156.
Ramos-Jiliberto, R., Domínguez, D., Espinoza, C., Lopez, G., Valdovinos,F. S., Bustamante, R. O. & Medel, R. (2010). Topological change of Andeanplant–pollinator networks along an altitudinal gradient. Ecological Complexity 7,86–90.
Reiss, J., Bridle, J. R., Montoya, J. M. & Woodward, G. J. (2009). Emerginghorizons in biodiversity and ecosystem functioning research. Trends in Ecology &
Evolution 24, 505–514.Rezende, E. L., Lavabre, J. E., Guimaraes, P. R., Jordano, P. & Bascompte,
J. (2007). Non-random coextinctions in phylogenetically structured mutualisticnetworks. Nature 448, 925–928.
Rohr, R. P. & Bascompte, J. (2014). Components of phylogenetic signal inantagonistic and mutualistic networks. The American Naturalist 184, 556–564.
Rohr, R. P., Scherer, H., Kehrli, P., Mazza, C. & Bersier, L.-F. (2010). Modelingfood webs: exploring unexplained structure using latent traits. American Naturalist 176,170–177.
Romanuk, T. N., Jackson, L. J., Post, J. R., McCauley, E. & Martinez,N. D. (2006). The structure of food webs along river networks. Ecography 29,3–10.
Romero, G. Q., Piccoli, G. C. O., de Omena, P. M. & Goncalves-Souza, T.(2016). Food web structure shaped by habitat size and climate across a latitudinalgradient. Ecology 97, 2705–2715.
Roslin, T. & Majaneva, S. (2016). The use of DNA barcodes in food webconstruction – terrestrial and aquatic ecologists unite! Genome 59. https://doi.org/10.1139/gen-2015-0229.
le Roux, P. C., Virtanen, R., Heikkinen, R. K. & Luoto, M. (2012). Bioticinteractions affect the elevational ranges of high-latitude plant species. Ecography 35,1048–1056.
Santamaria, L. & Rodriguez-Girones, M. A. (2007). Linkage rules forplant-pollinator networks: trait complementarity or exploitation barriers? PLoS
Biology 5, 354–362.Schleuning, M., Bluthgen, N., Florchinger, M., Braun, J., Schaefer,
H. M. & Bohning-Gaese, K. (2011). Specialization and interaction strengthin a tropical plant–frugivore network differ among forest strata. Ecology 92,26–36.
Schleuning, M., Frund, J. & García, D. (2015). Predicting ecosystem functionsfrom biodiversity and mutualistic networks: an extension of trait-based concepts toplant-animal interactions. Ecography 38, 380–392.
Schleuning, M., Frund, J., Klein, A.-M., Abrahamczyk, S., Alarcon,R., Albrecht, M., Andersson, G. K. S., Bazarian, S., Bohning-Gaese,K., Bommarco, R., Dalsgaard, B., Dehling, D. M., Gotlieb, A.,Hagen, M., Hickler, T., et al. (2012). Specialization of mutualisticinteraction networks decreases toward tropical latitudes. Current Biology 22,1925–1931.
Sebastian-Gonzalez, E., Dalsgaard, B., Sandel, B. & Guimaraes, P. R. (2015).Macroecological trends in nestedness and modularity of seed-dispersal networks:human impact matters. Global Ecology and Biogeography 24, 293–303.
Shin, Y. J. & Cury, P. (2001). Exploring fish community dynamics throughsize-dependent trophic interactions using a spatialized individual-based model.Aquatic Living Resources 14, 65–80.
Shipley, B., Vile, D. & Garnier, E. (2006). From plant traits to plant communities:a statistical mechanistic approach to biodiversity. Science 314, 812–814.
Simberloff, D. (1978). Use of rarefaction and related methods in ecology. In Biological
Data in Water Pollution Assessment: Quantitative and Statistical Analyses, pp. 150–165.ASTM International, West Conshohocken.
Stang, M., Klinkhamer, P. G. L. & van der Meijden, E. (2007). Asymmetricspecialization and extinction risk in plant–flower visitor webs: a matter ofmorphology or abundance? Oecologia 151, 442–453.
Stouffer, D. B. & Bascompte, J. (2011). Compartmentalization increases food-webpersistence. Proceedings of the National Academy of Sciences of the United States of America
108, 3648–3652.Stouffer, D. B., Camacho, J., Jiang, W. & Nunes Amaral, L. A. (2007). Evidence
for the existence of a robust pattern of prey selection in food webs. Proceedings of the
Royal Society of London Series B: Biological Sciences 274, 1931–1940.Stouffer, D. B., Sales-Pardo, M., Sirer, M. I. & Bascompte, J.
(2012). Evolutionary conservation of species’ roles in food webs. Science 335,1489–1492.
Terborgh, J., Robinson, S. K., Parker, T. A., Munn, C. A. & Pierpont, N.(1990). Structure and organization of an amazonian forest bird community. Ecological
Monographs 60, 213–238.Thebault, E. & Fontaine, C. (2010). Stability of ecological communities and the
architecture of mutualistic and trophic networks. Science 329, 853–856.Trøjelsgaard, K., Baez, M., Espadaler, X., Nogales, M., Oromí, P., Roche, F.
L. & Olesen, J. M. (2013). Island biogeography of mutualistic interaction networks.Journal of Biogeography 40, 2020–2031.
Trøjelsgaard, K., Jordano, P., Carstensen, D. W., Olesen, J. M.,Hillebrand, H., Orme, C., Ricklefs, R. E., Whittaker, R. J.,Fernandez-Palacios, J. M., Anderson, M. J., Tscharntke, T., Whittaker,R. H., Nekola, J. C., White, P. S., Poisot, T., et al. (2015). Geographicalvariation in mutualistic networks: similarity, turnover and partner fidelity. Proceedings
of the Royal Society of London Series B: Biological Sciences 282, 192–211.Tuck, C. & Romanuk, T. N. (2012). Robustness to thermal variability differs
along a latitudinal gradient in zooplankton communities. Global Change Biology 18,1597–1608.
Tylianakis, J. M., Didham, R. K., Bascompte, J. & Wardle, D. A. (2008).Global change and species interactions in terrestrial ecosystems. Ecology Letters 11,1351–1363.
Tylianakis, J. M. & Morris, R. J. (2017). Ecological networks across environmentalgradients. Annual Review of Ecology, Evolution, and Systematics 48. https://doi.org/annurev-ecolsys-110316-022821.
Tylianakis, J. M., Tscharntke, T. & Lewis, O. T. (2007). Habitatmodification alters the structure of tropical host–parasitoid food webs. Nature 445,202–205.
Vacher, C., Tamaddoni-Nezhad, A., Kamenova, S., Peyrard, N., Moalic, Y.,Sabbadin, R., Schwaller, L., Chiquet, J., Smith, M. A., Vallance, J., Fievet,V. & Jakuschkin, B. (2016). Learning ecological networks from next-generationsequencing data. Advances in Ecological Research 54, 1–39.
Vander Zanden, M. J., Shuter, B. J., Rasmussen, J. B. & Lester, N. (1999).Patterns of food chain length in lakes: a stable isotope study. American Naturalist 154,406–416.
Vazquez, D. P. & Aizen, M. A. (2004). Asymetric specialization: a pervasive featureof plant–pollinator interactions. Ecology 85, 1251–1257.
Vinagre, C. & Costa, M. (2014). Estuarine-coastal gradient in food web networkstructure and properties. Marine Ecology Progress Series 503, 11–21.
Warren, P. H. (1989). Spatial and temporal variation in the structure of a freshwaterfood web. Oikos 55, 299–311.
Warton, D. I., Blanchet, F. G., O’Hara, R. B., Ovaskainen, O., Taskinen,S., Walker, S. C. & Hui, F. K. C. (2015). So many variables: joint modeling incommunity ecology. Trends in Ecology & Evolution 30, 766–779.
Weiher, E., Clarke, G. D. P. & Keddy, P. A. (1998). Community assemblyrules, morphological dispersion, and the coexistence of plant species. Oikos
81, 309.Weinstein, B. G. (2015). MotionMeerkat: integrating motion video detection and
ecological monitoring. Methods in Ecology and Evolution 6, 357–362.Weinstein, B. G. & Graham, C. H. (2017). Persistent bill and corolla matching
despite shifting temporal resources in tropical hummingbird-plant interactions.Ecology Letters 20, 326–335.
Weinstein, B. G., Tinoco, B., Parra, J. L., Brown, L. M., McGuire, J. A.,Stiles, F. G. & Graham, C. H. (2014). Taxonomic, phylogenetic, and traitbeta diversity in South American hummingbirds. The American Naturalist 184,211–224.
Welti, E. A. R. & Joern, A. (2015). Structure of trophic and mutualistic networksacross broad environmental gradients. Ecology and Evolution 5, 326–334.
Biological Reviews 93 (2018) 785–800 © 2017 Cambridge Philosophical Society
800 Loïc Pellissier and others
Whittaker, R. H. (1972). Evolution and measurement of species diversity. Taxon 21,213–251.
Whittaker, R. J., Willis, K. J. & Field, R. (2001). Scale and species richness:towards a general, hierarchical theory of species diversity. Journal of Biogeography 28,453–470.
Williams, R. J. & Martinez, N. D. (2000). Simple rules yield complex food webs.Nature 404, 180–183.
Winemiller, K. O. (1989). Must connectance decrease with species richness. American
Naturalist 134, 960–968.Winemiller, K. O. (1990). Spatial and temporal variation in tropical fish trophic
networks. Ecological Monographs 60, 331–367.
Wirta, H. K., Vesterinen, E. J., Hamback, P. A., Weingartner, E.,Rasmussen, C., Reneerkens, J., Schmidt, N. M., Gilg, O. & Roslin, T.(2015). Exposing the structure of an Arctic food web. Ecology and Evolution 5,3842–3856.
Wisz, M. S., Pottier, J., Kissling, W. D., Pellissier, L., Lenoir, J., Damgaard,C. F., Dormann, C. F., Forchhammer, M. C., Grytnes, J. A., Guisan,A., Heikkinen, R. K., Hoye, T. T., Kuehn, I., Luoto, M., Maiorano, L.,et al. (2013). The role of biotic interactions in shaping distributions and realisedassemblages of species: implications for species distribution modelling. Biological
Reviews of the Cambridge Philosophical Society 88, 15–30.
(Received 17 May 2017; revised 17 August 2017; accepted 18 August 2017; published online 22 September 2017)
Biological Reviews 93 (2018) 785–800 © 2017 Cambridge Philosophical Society