
Comparing Solid Waste Management in the World’s...
16
Comparing Solid Waste Management in the World’s Cities Ljiljana Rodic, Wageningen University, Wageningen, Netherlands Anne Scheinberg, WASTE, Gouda, Netherlands David C. Wilson, Imperial College, London, UK Contact: L. Rodic, T +31 317 48 33 44, E [email protected] EXECUTIVE SUMMARY This paper is based on work carried out to prepare UN-Habitat’s Third Global Report on Water and Sanitation in the World’s Cities – ‘Solid Waste Management in the World’s Cities’, which was launched at the 5 th World Urban Forum in Rio on the 23 rd of March 2010. This book is designed to fill a gap in the literature and knowledge base regarding solid waste management in low-, middle- and high-income countries, and to provide new data with a fresh perspective. The analytical framework is based on Integrated Sustainable Waste Management (ISWM) that distinguishes technical components, sustainability aspects, and (both formal and informal) actors in the system. Case studies from 20 cities on six continents provide up-to-date and comparable data that are used to inform investigation into the topics of waste policy, technology, good and bad practice, management, financing, and governance, with the focus on processes and sustainability. The book reveals common elements and develops a new, ‘smart’ lens for viewing a solid waste management system. At the same time, the ISWM framework has the goal to encourage a different kind of thinking and support every city to develop its own individual solution that is appropriate to its specific history, economy, demography and culture and to its institutional, environmental and financial resources. A central tenet is that there is no one right answer that can be applied to all cities and all situations, thus challenging the notion that a city in a developing country striving to improve its waste services can simply copy a working system from a particular city in a developed country. A major constraint in comparing SWM systems in different cities is the lack of consistent global solid waste and recycling system benchmarks – not even the most common indicator, cost per tonne, is available in most cities. The most basic kinds of information are collected in very different ways in different cities, if indeed they are collected and recorded at all. In this context, the book is a building block towards a new standard method for data collection and analysis, as well as an international database that rests on about 300 data points. These data points include a number of quantitative benchmarks that can be applied to cities in low-, middle- and high-income countries to produce benchmarks and derive smart indicators, as well as a complete waste mass balance presented by a process flow diagram. The data can be used to profile a city and produce both a baseline document and a needs assessment for future intervention, thus allowing comparison between cities and supporting better understanding of the processes and driving forces that affect them all. The paper abounds in examples from the 20 cities to illustrate comparative analysis that is possible when consistent and comparable data are available and concludes with some key messages arising from the work.
Transcript of Comparing Solid Waste Management in the World’s...
Comparing Solid Waste Management in the World’s Cities
Ljiljana Rodic, Wageningen University, Wageningen, Netherlands
Anne Scheinberg, WASTE, Gouda, Netherlands David C. Wilson, Imperial College, London, UK
Contact: L. Rodic, T +31 317 48 33 44, E [email protected] EXECUTIVE SUMMARY This paper is based on work carried out to prepare UN-Habitat’s Third Global Report on Water and Sanitation in the World’s Cities – ‘Solid Waste Management in the World’s Cities’, which was launched at the 5th World Urban Forum in Rio on the 23rd of March 2010. This book is designed to fill a gap in the literature and knowledge base regarding solid waste management in low-, middle- and high-income countries, and to provide new data with a fresh perspective. The analytical framework is based on Integrated Sustainable Waste Management (ISWM) that distinguishes technical components, sustainability aspects, and (both formal and informal) actors in the system. Case studies from 20 cities on six continents provide up-to-date and comparable data that are used to inform investigation into the topics of waste policy, technology, good and bad practice, management, financing, and governance, with the focus on processes and sustainability. The book reveals common elements and develops a new, ‘smart’ lens for viewing a solid waste management system. At the same time, the ISWM framework has the goal to encourage a different kind of thinking and support every city to develop its own individual solution that is appropriate to its specific history, economy, demography and culture and to its institutional, environmental and financial resources. A central tenet is that there is no one right answer that can be applied to all cities and all situations, thus challenging the notion that a city in a developing country striving to improve its waste services can simply copy a working system from a particular city in a developed country. A major constraint in comparing SWM systems in different cities is the lack of consistent global solid waste and recycling system benchmarks – not even the most common indicator, cost per tonne, is available in most cities. The most basic kinds of information are collected in very different ways in different cities, if indeed they are collected and recorded at all. In this context, the book is a building block towards a new standard method for data collection and analysis, as well as an international database that rests on about 300 data points. These data points include a number of quantitative benchmarks that can be applied to cities in low-, middle- and high-income countries to produce benchmarks and derive smart indicators, as well as a complete waste mass balance presented by a process flow diagram. The data can be used to profile a city and produce both a baseline document and a needs assessment for future intervention, thus allowing comparison between cities and supporting better understanding of the processes and driving forces that affect them all. The paper abounds in examples from the 20 cities to illustrate comparative analysis that is possible when consistent and comparable data are available and concludes with some key messages arising from the work.

INTRODUCTION UN-Habitat Global Report series This paper is based on work carried out to prepare UN-Habitat’s Third Global Report on Water and Sanitation in the World’s Cities – ‘Solid Waste Management in the World’s Cities’, which was launched at the 5th World Urban Forum in Rio on the 23rd of March 2010. This book is the product of a combined effort of more than 35 professionals in solid waste from economically developing, transitional, and developed countries, many of whom are connected through the CWG (Collaborative Working Group on Solid Waste Management in Low- and Middle-Income Countries, http://www.cwgnet.net/), a global community of practice. The project was co-ordinated by WASTE, Gouda, the Netherlands, an institute-type NGO that specialises in multi-country research and development programmes, which are made possible by their wide network of partners and local experts. Integrated sustainable waste management (ISWM) instead of waste engineering The book is based on the concept of Integrated sustainable (solid) waste management – ISWM (Van de Klundert and Anschutz, 2001) that distinguishes three dimensions in analysis of solid waste management and recycling systems: technological components, sustainability aspects (social, institutional, political, financial, economic, environmental and technical) and stakeholders (also called actors) present at certain location. When the current modernisation process started in developed countries in the 1970s, ‘modern waste management’ was largely defined in engineering terms – a technical problem with a technical solution. Gradually, as many city authorities will confirm from their own experience, the world community learnt that no technology can solve the problems related to economic and social sustainability of waste management solutions. If the costs of day-to-day operations are not recovered, if the citizens are not interested or willing or simply cannot afford to pay, the system will not be able to sustain itself over a longer period of time, regardless of access to grants and loans for capital investments from the central government or international financing agencies. ‘Better’ technology cannot solve this kind of problems. If the municipal authorities do not have adequate knowledge and capacity to monitor the performance of a private service provider, if the collection system in place is not in accordance with citizens’ needs and preferences, if the measures are imposed rather than discussed and negotiated with the system users, then, the system will not be embedded and sustained by the society and will not perform as designed. The use of more advanced technology cannot resolve these kinds of issues either. Even in efforts to increase the effectiveness of strictly technological components in a system, the answer is not necessarily more technology. For example, while a large compactor lorry will significantly decrease the volume of waste that mainly consists of packaging in industrialised countries such as Denmark or Australia, it will do little good for public health and street cleanliness by squeezing wet, mainly organic waste of Asian mega-cities such as Delhi or Dhaka. Similarly, a state-of-the-art landfill will make only a minor contribution to the public health in an African capital if the streets are still littered and heaps of uncollected waste abound. THE PROCESS Developing and using the methodology In producing this book we sought to distil the essence of the combined experiences accrued by team members over the past 40 years. That alone would have produced a valuable book, but we had even higher ambitions. So, we took up the challenge of looking into the present situation in 20 cities around the world, as a kind of ‘reality check’ for all the

insights and knowledge we hold as a team. For each city we designated a person – the city profiler – who works or has worked in the city and knows its situation well. That person became the liaison to the city authorities and other stakeholders who provided data and information from their own records and experiences, and was responsible for organising the information, cross-checking it and reconciling discrepancies, as well as for specialised analysis. The city profilers come from different professional backgrounds, including consultants, scientific researchers, public servants, and advocacy NGO workers. The variety of their inputs and perspectives enriched the book. At the same time, establishing shared language, definitions and metrics within the team was essential in ensuring meaningful comparison among cities. Benchmarking of waste management services is far from being a straightforward exercise, even within a single small country with uniform regulations, governance system, culture, level of development, and climatic conditions, as 12 year benchmarking experience in the Netherlands confirms (Mvulirwenande & Rodic, 2010). In order to make comparison possible among vastly different cities from all over the world, we prepared a detailed methodology that took several hundreds of hours of discussions to design and over 40 pages of instructions to describe. In addition to the complete, detailed city profile, we developed a smaller presentation of roughly 15-20 pages per city that was designed to present key indicators and key narratives about the waste management policies and practices in the city in a form that was accessible to readers. We had also intended to establish a web-based database using ‘survey monkey’ software, where each city profiler could enter the data on his/her city online. This however turned out to be a bridge too far in this project, for two related reasons. First, it turned out that few cities had readily available data on the issues we asked in the format we asked. Second, a tabular presentation of numbers would do injustice to the cities’ full stories, leaving out important contextual information that could not be included in the web-based database within the timeframe of the project. The process was guided and supported by intensive communication among team members, including two expert group meetings, visits by individual team members to WASTE, Gouda, thousands of emails, Skype and telephone conversations, as well as a few last-minute final-check text messages across the world. The initial team meeting was held in Gouda, in May 2009, and focused on framing the book and making decisions on approach, structure, and the cities themselves. The second was convened in Cairo in October 2009 to share and discuss initial results and resolve some dilemmas. Selection of cities In parallel to the development of the profiling methodology, we established criteria for selection of the cities to be included in the project. Two sets of criteria were established and applied for city selection – one for the entire group of cities and one for individual cities. The entire group of cities is compiled with the following criteria in mind:
- Representing a range of sizes, from mega-city to small regional city; - Representing a range of geographic, climatic, economic and political conditions; - Mostly cities from low- and middle-income countries, with several from Africa; - At least one city from each continent. This implied including (for the first time in a
global comparison) cities from high-, middle- and low-income countries. Individual cities are selected according to the following criteria:
- The city gives a good illustration of one or more of the main topics of the book; - The city administration and other stakeholders are willing to participate, prepare the
materials and provide information;
- The stakeholders are willing to share both good and not-so-good practices; - The team includes or has access to a person or an organisation that would take the
role and the responsibility of working with city officials and other stakeholders, collecting the data and making the city profile.
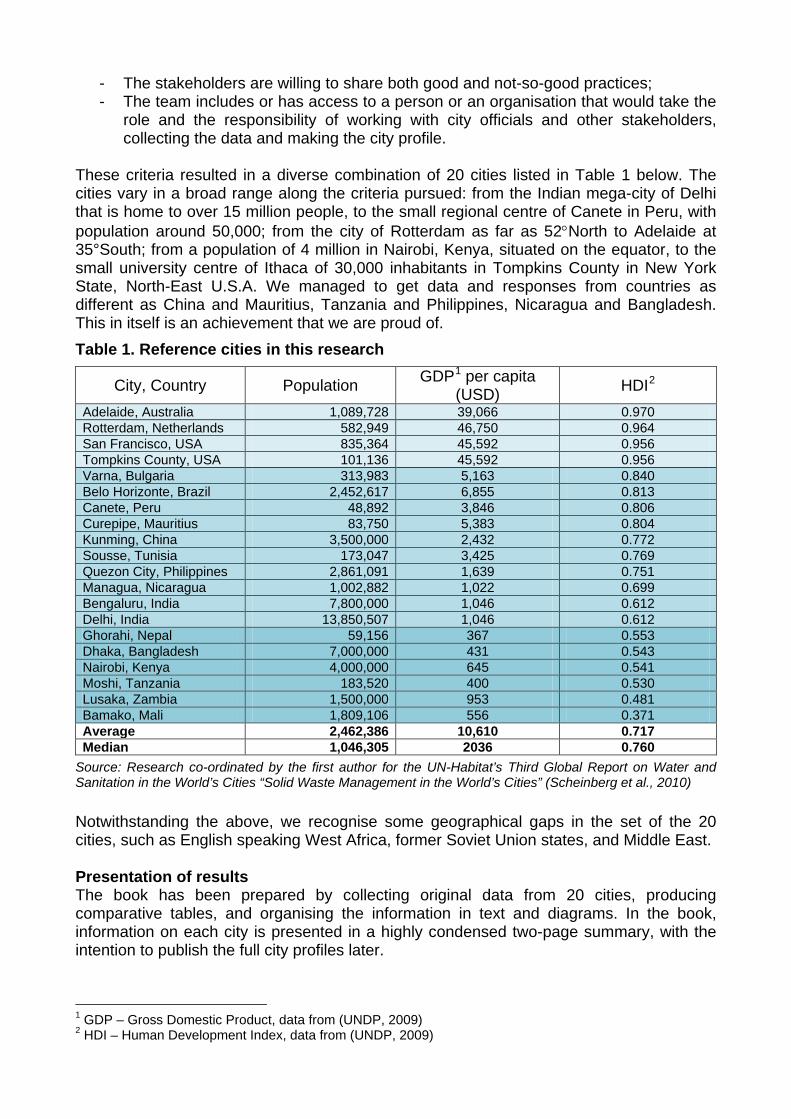
These criteria resulted in a diverse combination of 20 cities listed in Table 1 below. The cities vary in a broad range along the criteria pursued: from the Indian mega-city of Delhi that is home to over 15 million people, to the small regional centre of Canete in Peru, with population around 50,000; from the city of Rotterdam as far as 52°North to Adelaide at 35°South; from a population of 4 million in Nairobi, Kenya, situated on the equator, to the small university centre of Ithaca of 30,000 inhabitants in Tompkins County in New York State, North-East U.S.A. We managed to get data and responses from countries as different as China and Mauritius, Tanzania and Philippines, Nicaragua and Bangladesh. This in itself is an achievement that we are proud of. Table 1. Reference cities in this research
City, Country Population GDP1HDI per capita
(USD) 2
Adelaide, Australia
1,089,728 39,066 0.970
Rotterdam, Netherlands 582,949 46,750 0.964 San Francisco, USA 835,364 45,592 0.956 Tompkins County, USA 101,136 45,592 0.956 Varna, Bulgaria 313,983 5,163 0.840 Belo Horizonte, Brazil 2,452,617 6,855 0.813 Canete, Peru 48,892 3,846 0.806 Curepipe, Mauritius 83,750 5,383 0.804 Kunming, China 3,500,000 2,432 0.772 Sousse, Tunisia 173,047 3,425 0.769 Quezon City, Philippines 2,861,091 1,639 0.751 Managua, Nicaragua 1,002,882 1,022 0.699 Bengaluru, India 7,800,000 1,046 0.612 Delhi, India 13,850,507 1,046 0.612 Ghorahi, Nepal 59,156 367 0.553 Dhaka, Bangladesh 7,000,000 431 0.543 Nairobi, Kenya 4,000,000 645 0.541 Moshi, Tanzania 183,520 400 0.530 Lusaka, Zambia 1,500,000 953 0.481 Bamako, Mali 1,809,106 556 0.371 Average 2,462,386 10,610 0.717 Median 1,046,305 2036 0.760
Source: Research co-ordinated by the first author for the UN-Habitat’s Third Global Report on Water and Sanitation in the World’s Cities “Solid Waste Management in the World’s Cities” (Scheinberg et al., 2010) Notwithstanding the above, we recognise some geographical gaps in the set of the 20 cities, such as English speaking West Africa, former Soviet Union states, and Middle East. Presentation of results The book has been prepared by collecting original data from 20 cities, producing comparative tables, and organising the information in text and diagrams. In the book, information on each city is presented in a highly condensed two-page summary, with the intention to publish the full city profiles later.
1 GDP – Gross Domestic Product, data from (UNDP, 2009) 2 HDI – Human Development Index, data from (UNDP, 2009)

We asked the same questions in each city regardless of its geography, level of economic development, or characteristics of its local culture. Additionally, we probed behind the numbers to understand the context and accommodate for the differences in meaning that were bound to exist among the cities. Already in 1962, Riggs proposed his ‘Sala’ model as a way to capture the specific and quite unique features of public administration in countries that find themselves stretched between Western modernism and local traditional societies. The benefits of involving an international team for the validity of conclusions were particularly evident in this aspect. Process flow diagram In this research, the process flow diagram (PFD) approach has proven its merits in communicating information, as presented in Figure 1 below. A PFD gives the total picture of a solid waste system at a glance, as it depicts the process steps and the movement of waste material streams between them. This implies several distinct advantages: all the waste streams are accounted for, losses are exposed, system boundaries are clearly denoted, no activities are forgotten, final destinations of waste materials are explicit, and the place and contributions of all stakeholders are visible. In addition, a PFD shows interfaces between various waste handlers in the system, thus demarcating points for possible interventions by the authorities in charge. A PFD is an especially useful tool for representing complex solid waste systems that are characterised by services provided in parallel by competing service providers, or by a high degree of mixing of formal and informal sectors, and mixing of public and private service providers. For example, a PFD enables accurate representation of situations in which waste is officially destined and reaches the disposal site but is picked there by waste pickers and returned to the city for recycling, as is the case in many reference cities. A table would include this amount either under disposal or under recycling. Including the amount under recycling as the final destination would result in losing the information that this waste actually first travelled to the disposal site, i.e., it received handling and transport, incurred costs and required time and organisation. Trying to keep this information by including this amount under both disposal and recycling would affect the mass balance, as this amount would be calculated twice. Similar problem arises with representation of waste amounts in illegal dumps spread all over the city that are regularly being cleaned and waste transported to the official disposal site, as is the case in Belo Horizonte and Managua. By inserting this amount only once, e.g. under controlled disposal, important information about the city cleanliness is lost. Inserting it under both illegal dumping and controlled disposal, this amount appears twice in the mass balance. A PFD does not have this problem – it presents both amounts and direction of flows as appropriate. THE CITY PROFILE Based on the dimensions of the ISWM framework, we structured the analysis of the cities’ waste management and recycling systems around the following questions:
- WHY? → Development drivers (driving forces) and modernisation stage - WHAT? → System components of waste collection, disposal and resource recovery - HOW? → Delivery strategies of good governance - SOMETHING SPECIAL? → Good and bad practices, special features, priorities
The city profile starts from the city’s geographic and demographic context, and continues to describe the development of the system and its stage in the process of modernisation. Then, technical components and governance issues are discussed in detail. Finally, a few selected features are illuminated that constitute global good practice, priorities for Improvement are proposed, and problematic areas are identified.

Figure 1: Process Flow Diagram – Managua, Nicaragua Source: Olley, J., IJgosse, J. and Rudin, V. (2010) Managua city profile for the UN-Habitat’s Third Global Report on Water and Sanitation in the World’s Cities “Solid Waste Management in the World’s Cities” DEVELOPMENT DRIVERS AND MODERNISATION STAGE As the driving forces (drivers) that govern cities’ policies and practices in solid waste handling are indicative of their stage of modernisation, we sought to identify the drivers that determine the current situation in our 20 cities (Wilson, 2007). We distinguish a baseline position, in which resource value is the main driving force for solid waste related activities. Society is largely resource constrained and, consequently, end-of-life products and materials have a positive value. In such a society, wastage is minimised, products are repaired and reused, organic matter returned back to the land. However, as cities grow, wastes accumulate in the streets and water courses, posing acute health risks. In this stage, public health becomes a major concern and a driving force in shifting the focus to waste collection – getting waste out from under foot. If and when environmental concerns become prominent in public and political attention (as was the case in industrialised countries in 1960s and 1970s), environmental protection becomes another major driver for solid waste policies. This results in development and application of various engineering control measures for reduction of negative environmental impacts of waste disposal. However, these technologies are costly, so, ironically, once they are installed, most city policies seek to minimise the amounts that require disposal. This, in combination with growing concerns about depletion of natural resources, serve to create a renewed focus on resource management in the form of recycling, and more recently on prevention and reuse, as evident from the latest EU Directive on waste (EC, 2008) and large scale research by Defra, UK (Cox et al., 2010). In this stage, the driver is resource value again, but now in a mature waste system where the other drivers have already been addressed.

While it is true that most cities go through a progression of drivers, this research has confirmed earlier findings that the stages of modernisation need not necessarily take place in the same order or may take place in parallel (Scheinberg, 2003; Spaargaren et al., 2005). Each city has a unique path, with its own sequence and overlap of development stages, in accordance with local characteristics and priorities. Contributing factors range from the prominence of individual governance aspects such as strong commitment of local authorities, to the presence and influence of international financing agencies. Among the cities listed in Table 1 above, the situation in Bamako, Mali, the country with the lowest HDI, still tends to be dominated by the pre-modern resource value, particularly that of organic waste, as the main driver. On the other end of the spectrum, in Adelaide, Australia, the country with the highest HDI, the current waste management system is shaped by resource value in a highly modern, mature system, as expressed by their ‘zero waste’ policies. In the ‘modernised mixtures’ prevalent in most other cities, all three stages take place in parallel. Concerted efforts are put to organise adequate waste collection services beyond the city business district, dumpsites are being upgraded to higher standards or new landfills are constructed from scratch, while at the same time material recovery policies are being actively implemented. This mixture of strategies and technologies can be seen in mega-cities such as Delhi and Bengaluru, large cities such as Belo Horizonte and Lusaka, as well as small towns such as Canete, Peru, and Ghorahi, Nepal. COMPONENTS OF THE PHYSICAL SYSTEM Waste quantities and composition As one of the first steps in addressing waste management and recycling systems in reference cities, we defined municipal waste to include: household waste, institutional (office), commercial (shops, markets), small businesses, street cleansing and maintenance of public spaces. In addition to these streams, we also asked about special healthcare waste, as hospitals and other healthcare facilities are usually situated within cities. Most reference cities share this definition. The only exceptions are Adelaide and Belo Horizonte, which both include industrial construction and demolition waste in their official definition of municipal waste. This is important to know when comparing amounts of waste generated in the cities. While most cities keep records for municipal waste separate from those for industrial waste, Adelaide combines information on industrial and commercial municipal waste into one stream, thus making it difficult to compare with other cities. This research found that information on proper waste generation is seldom available – the generation data are frequently confused with what is registered or estimated as being collected by the formal waste management system, which is unlikely to capture all waste generated in the city. Poor information on waste composition and lack of documentation of existing private sector (formal and informal) recycling activities frequently result in inflated estimates of the amount of waste requiring disposal. When a city is investing in new infrastructure, this brings with it a real danger of over-capitalisation – building large facilities for waste streams that are not there. Collection Waste collection is one of the most visible urban services. Here, we were mainly interested in two indicators: waste collection coverage and availability of vehicles and equipment. Although these two indicators are correlated, we found it important to enquire about both of them, as the former reflects the interests of system users, while the later is primarily important for service providers.

Coverage represents the percentage of total households served, reported separately for slum, low-, middle-, high-income city areas and total city. As presented in Table 2 below, cities in high-income countries and former socialist countries such as China and Bulgaria reach a complete 100% coverage. The cities in low-income countries with GDP under 1,000 USD per capita, including Lusaka, Ghorahi, Dhaka, Bamako, Moshi, and Nairobi, are still struggling to provide adequate waste collection and street sweeping services to their citizens. In their efforts they are partnering with diverse stakeholders, ranging from the private sector (which is often not interested), community based organisations (CBOs), and the informal sector and their associations, with varying success. As far as availability of vehicles and equipment is concerned, we also asked how they have been acquired. Waste management systems in low-income countries have often failed due to use of imported vehicles and equipment (often purchased or donated by donor-funded projects or public private partnerships, PPPs), for which spare parts and servicing facilities are not locally available. It is not uncommon that half a city’s collection fleet is out of service awaiting parts, as is the case in regional centre of Moshi, Tanzania, where all vehicles were donated except for one 15-year old lorry. Also typical is the case of Managua, Nicaragua, where 28 donated compactor lorries have proven to be very costly to operate and maintain, in a city with already faltering waste collection services that collect only 65% of the waste, resulting in over 230 illegal waste dumps around the city. Disposal The findings regarding waste disposal in 20 reference cities encompass the entire range of possibilities, including uncontrolled open dumping in Bamako and controlled dumping at officially recognised dumpsites (developed over time and now used in absence of a better alternative) such as Dandora in Nairobi, Pampa Arena in Canete, and La Chureca in Managua. Another possibility, cities such as Quezon City and Dhaka have upgraded their enormous dumpsites, in different contexts and for different reasons. Improvements at Payatas dumpsite of Metro Manila situated in Quezon City, Philippines, are a direct result of policies and actions taken following the collapse of Payatas in 2000, which resulted in the deaths of 300 waste pickers. Upgrading of the Matuail dumpsite of Dhaka was carried out as a part of a long-standing partnership between Dhaka City Corporation (DCC) and Japan International Co-operation Agency (JICA). In Moshi, Tanzania, due to financial constraints, the upgrade level achieved at the new disposal site at Kaloleni is mainly in terms of operation practices – expressed as 3Cs: Confine, Compact, Cover – rather than engineering controls installed. Nonetheless, this is an important step away from indiscriminate open dumping, and towards adequate environmental protection. Other cities have constructed or are in the process of constructing engineered landfills for their needs. Rotterdam is the only reference city that incinerates all of its waste destined for disposal (i.e., excluding waste that is recycled). Kunming is heading in this direction: it currently incinerates about 37% of its waste and landfills the rest. Furthermore, the incinerated proportion will increase in the near future, with a new incinerator under construction. According to the latest news, Delhi is about to join them with its Timarpur-Okhla incinerator, in a much disputed project being supported by the Clean Development Mechanism (CDM). At the other end of the spectrum, the Philippines banned incineration of municipal waste by its Clean Air Act (Republic Act 8749) of 1999. Resource recovery Rotterdam and Kunming are the only two reference cities that recover energy from their municipal waste. All other reference cities focus on material recovery.
As presented in Table 2 below, the highest material recovery rates have been identified in the cities where resource value is the main driver governing current developments in solid waste management. In Bamako, Mali, as in much of West Africa, raw organic waste is sold to grain farmers (céréaliculteurs) while partly decomposed organic waste (called fumure, or terreau) is sold to maraîchers, the vegetable farmers in the floodplain of the Niger River. In itself, this traditional system of nutrient recovery would constitute a global good practice for others to learn from, were it not for the fact that the waste nowadays contains plastic waste, posing acute health risks to the cows that eat it. At the other end of the modernisation range, the U.S. cities of San Francisco and Ithaca in Tompkins County, and the Australian city of Adelaide are reaching similarly high recovery rates, in the region of 55 to 70%. This is due to their strong commitment to ‘zero waste’ policies and accompanying schemes for separate collection of organic waste and recyclables, which have in part developed as a way to divert waste from costly disposal at local state-of-the-art landfills. Problems – amounting to a crisis – with severe lack of disposal capacities have accelerated adoption and implementation of Zero Waste Resource Management policies in Quezon City as a part of Metro Manila, the Philippines. In some of the reference cities resource management is still a completely separate set of activities, institutions, actors and economic relations, and has virtually no relationship to the municipal solid waste system.3
Kunming, China, is an illustrative example: the existing – thriving – material recycling is a separate system that functions, as any commodity trade does, dependent upon and influential in the global market. In a populous country like China, resources management has always been considered as one of the most important economic activities. Therefore, recycling is under the Ministry of Commerce whereas municipal solid waste management is under the Ministry of Housing and Urban-Rural Development (widely known as the Ministry of Construction).
The research has found that municipal organic waste is a heavily underutilised resource. While the organic fraction constitutes 60-80% by weight of municipal waste in most reference cities (Wilson et al., 2010), there have been only modest initiatives to recover its value. This can be due to the lack of a market for compost, which takes focused effort and time to develop, by building urban-rural linkages and by educating potential users and buyers about compost’s beneficial properties. The initiative by local professionals in WasteConcern, Dhaka, is a noteworthy exception: they managed to attract Dutch investors and obtain support from CDM, organise collection of organic waste from households and vegetable markets, and establish a community-based composting plant. In order to ensure sustainability of the system, they assist communities in marketing the product. In addition to the questions regarding activities and amounts, we also enquired about stakeholders involved in material recovery. These questions discover important contribution of informal sector in many of the reference cities. Active systems of informal sector and micro-enterprise recycling, reuse and repair, existing in developing and transitional country cities often achieve high recovery rates in the order of 30%, comparable to those in industrialised countries (Wilson et al., 2010). In addition to their contribution to resource conservation, informal recycling also contributes by removing large quantities of waste that would otherwise need to be collected and disposed of by the formal service provider, thereby avoiding costs for the city. In fact, such informal recycling activities have been shown to save the city perhaps 20% or even more of its waste management budget. The authorities in Belo Horizonte, New Delhi, Quezon City, Canete
3 This situation is quite comparable to that in many European and American cities in the early 20th century.

and others are recognising the potential of collaboration with the existing informal recycling systems to further increase current recycling rates, to reduce costs to the city of managing the residual wastes, and protect and develop people’s livelihoods. As one of the first steps, they are legitimising and actively involving informal primary collectors of recyclables. Table 2. Waste management and recycling system components in reference cities
City, Country
Drivers for development Public health Environmental protection Resource value
Coverage of waste
collection and sweeping (%)
Controlled disposal/
incineration of total
disposed/ incinerated
(%)
State-of-the-art landfilling/ incineration of
total disposed/
incinerated (%)
Materials recovered by formal sector
(%)
Materials recovered by
informal sector
(%)
Adelaide, Australia 100 100 100 54 0 Rotterdam, Netherlands 100 100 100 30 0 San Francisco, USA 100 100 100 72 0 Tompkins County, USA 100 100 100 61 0 Varna, Bulgaria 100 100 100 2 26 Belo Horizonte, Brazil 95 100 100 0.1 6.9 Canete, Peru 73 81 0 1 11 Curepipe, Mauritius 100 100 100 NA NA Kunming, China 100 100 100 38 NA Sousse, Tunisia 99 100 100 0 6 Quezon City, Philippines 99 100 0* 8 31 Managua, Nicaragua 82 100 0 3 15 Bengaluru, India 70 78 78 10 15 Delhi, India 90 100 0 7 27 Ghorahi, Nepal 46 100 100 2 9 Dhaka, Bangladesh 55 90 60 0 18 Nairobi, Kenya 65 65 0 NA NA Moshi, Tanzania 61 78 0* 0 18 Lusaka, Zambia 45 100 100 4 2 Bamako, Mali 57 0 0 0 85 Average 82 90 62 16 15 Median 93 100 100 4 11
* Quezon City and Moshi have upgraded disposal sites with some measures of environmental protection. Source: Research co-ordinated by the first author for the UN-Habitat’s Third Global Report on Water and Sanitation in the World’s Cities “Solid Waste Management in the World’s Cities” (Scheinberg et al., 2010) GOVERNANCE Poor governance is a major reason why cities’ solid waste and other urban systems fail. In examining governance aspects, we focused on inclusivity of users and service providers, financial sustainability, and the strength of the institutional framework. Inclusivity This section begins by identifying the stakeholders. Far from being trivial, this research step helps to avoid one of the most common failures in attempts to introduce sustainable changes and modernise waste management systems: failing to understand how the system is already working. We then focused on issues of equity between the system users in receiving a fair and adequate service and having a say in its planning and evaluation; and equity among service providers – large and small, formal and informal – in terms of a fair share of economic opportunities for providing the service or valorising materials. The

assessment of inclusivity is based on a composite score from a set of qualitative indicators allowing a ‘yes’ for present and a ‘no’ for an absent feature in the system (Table 3 below). Inclusivity and equity of service users comprises three distinct elements, namely (a) waste collection coverage, (b) consultation and involvement of users in decision-making on policy, planning and siting of facilities, and (c) formal procedures for measuring customer satisfaction and effective feedback mechanisms between service users and service providers. While the citizens in industrialised countries as well as former socialist countries such as China and Bulgaria receive waste collection services irrespective of their social status, waste collection services in mega-cities such as Nairobi, Delhi and Dhaka do not necessarily extend to peri-urban and slum areas. Cities like Belo Horizonte and Quezon City are well on the way to the goal of 100% coverage, thus including slum areas. We see that several reference cities have active citizens’ platforms. In Moshi, Tanzania, the stakeholders’ platform has been active since 1999 in defining priorities and planning. In Bamako, Mali, in accordance with the general trend of decentralisation, starting in 2000, stakeholder platforms have been established in each of the six Communes in the city to enhance communication, exchange, and a participatory approach to planning and operations of solid waste services. In Ghorahi, Nepal, the municipality has formed a committee involving all key stakeholders, headed by a local person, to regularly monitor and contribute to sound management of the local modern landfill. In some cases, in the face of authorities’ failure to provide services to a burgeoning urban population, individual citizens, so-called ‘champions’, took the initiative to address the immediate problem of primary waste collection in their neighbourhood, as was the case in Dhaka, Bangladesh. The authorities actually embraced such initiatives and replicated the experiences in other parts of the city. In Bengaluru, India, prominent citizens joined forces with the city authorities to upgrade waste collection and prepared plans for future development. Inclusivity of service providers represents the degree to which both formal and informal, private or community-based service providers and waste recyclers are allowed equitable access to the system. We are well aware of the opposing views on informal activities. Though, the realities in a wide range of cities and towns cannot be refuted: informal-sector service providers are responsible for a significant percentage of waste collection. In Lusaka, Zambia, for example, the informal sector provides more than 30% of all collection coverage. In addition, as discussed above, informal sector recyclers remove materials from the city and thereby in effect extend the use period of disposal facilities and save money in waste collection, transport, and disposal. Local advocacy NGOs such as Chintan Environmental Research and Action Group in Delhi and operational CBOs such as WasteConcern in Dhaka are taking lead in working with authorities to acknowledge and build upon the existing informal activities in their cities. Recognition of informal recyclers is particularly intensified in Latin America, with integration of the informal sector into the formal system in Brazil since early 1990s, Latin American waste pickers’ conferences since 2003, and the 2009 court case wherein the Constitutional Court of Colombia ruled in favour of waste pickers, guaranteeing their customary rights to access, sort and recycle waste and their legitimacy to compete in the waste recycling business. Financial sustainability Evaluation of a solid waste management system’s financial viability is much more complicated than that of a commercial business. Firstly, rather than being a single service, solid waste management is a structured set of components, including collection, transport, resource recovery, processing, and disposal, each of which may be provided by a separate actor in the system. Secondly, solid waste management is a merit good – a good

(service) deemed so important that the law requires that it is provided for the benefit of the entire society, regardless of the interest of the market to supply it or the users’ ability (or willingness) to pay for it. This means that the role of government remains very strong, either in provision or regulation of the services. Thirdly, as it is practically impossible to exclude non-payers, the service is prone to ‘free-rider’ behaviour. Due to this combination of reasons, cost recovery from paying users – though considered important – is not the central feature of financial management in most of our reference cities. Actually, the costs of the system are being recovered from a combination of sources, including: budgets allocated from the central government, donor loans, franchise fees, property taxes, waste service fees, and sale of municipal land and equipment. As SWM budget per capita constitutes significant proportion of household’s income (as much as 0.60% in low-income countries), financial capacities and affordability are key issues. Table 3. Governance features in reference cities
City, country Inclusivity Financial sustainability
Institutional coherence
Degree of user inclusivity
Degree of service provider
inclusivity
Population using and paying for
collection (%)
Degree of coherence
Adelaide, Australia HIGH HIGH 100 HIGH Rotterdam, Netherlands HIGH LOW 100 HIGH San Francisco, USA HIGH LOW 100 HIGH Tompkins County, USA HIGH MEDIUM 95 HIGH Varna, Bulgaria LOW LOW 100 HIGH Belo Horizonte, Brazil HIGH HIGH 85 HIGH Canete, Peru MEDIUM HIGH 40 HIGH Curepipe, Mauritius LOW LOW 0* HIGH Kunming, China MEDIUM MEDIUM 50 HIGH Sousse, Tunisia LOW LOW 50 (est.) MEDIUM Quezon City, Philippines MEDIUM MEDIUM 20 HIGH Managua, Nicaragua MEDIUM LOW 10 MEDIUM Bengaluru, India MEDIUM MEDIUM 40 MEDIUM Delhi, India HIGH MEDIUM 0 LOW Ghorahi, Nepal MEDIUM LOW 0 MEDIUM Dhaka, Bangladesh MEDIUM MEDIUM 80 HIGH Nairobi, Kenya MEDIUM HIGH 45 LOW Moshi, Tanzania MEDIUM LOW 35 MEDIUM Lusaka, Zambia MEDIUM MEDIUM 100 MEDIUM Bamako, Mali MEDIUM MEDIUM 95 LOW Average 57 Median MEDIUM MEDIUM 50 HIGH
* Payment through the central tax. Source: Research co-ordinated by the first author for the UN-Habitat’s Third Global Report on Water and Sanitation in the World’s Cities “Solid Waste Management in the World’s Cities” (Scheinberg et al., 2010) Each city has its own approach to financing and cost recovery, within its unique context. Rotterdam is one of the exceptions where the users’ fee is actually calculated based on the real costs incurred. While deliberately keeping the fee low, Belo Horizonte is dedicated to provide 100% coverage and get all users to pay. Kunming, Bengaluru and Managua also keep the fee low but do not apply punitive measures for non-payers even though the payment rate is low at 40-50%. Moshi, Tanzania, and Curepipe, Mauritius, have cross-subsidising – poor people do not pay. In Ghorahi, Nepal, no waste fee is charged to the households.

The benefits of environmentally sound waste disposal are not obvious to most system users, except those living close to the dumpsite. Therefore, investments in landfill technology and full cost recovery from user fees are more likely in high-income countries. Middle- and low- income country cities largely struggle to finance environmentally sound waste disposal, even in mega-cities such as Delhi, where economies of scale would increase system efficiency. Clearly, trying to ensure several million USD investments is much less of a challenge in a country with an annual GDP per capita of 45,000 USD than in a country with a GDP per capita of 1,000 USD. Kunming is an example of a city where waste disposal has been addressed within national development plans. Among the reference cities in low-income countries, Dhaka and Lusaka have benefited from donor interest from development agencies of Japan (JICA) and Denmark (Danida) respectively, in financing their engineered landfills. As a special case, and an example of global good practice, the authorities in the town of Ghorahi, Nepal, understood the merits of landfill design by function, as opposed to design by technical specifications copied from abroad, and commissioned initial investigations by the National Department of Mines and Geology, which identified an appropriate site with thick deposits of natural, undisturbed clay to function as landfill bottom liner and thus provide adequate level of environmental protection (Rodic, 2002). In addition to the capital investment needed for the landfill construction, financing of operation and transportation costs is essential, as these may be prohibitively high for potential distant disposal sites, as is the case in Bamako. Recycling as a commodity trade is financed, as any other business, from sales revenues. This is the case with metals and high-grade paper, which combined constitute about 15% of municipal waste in the reference cities. Other materials may be technically recyclable but they often cost more to recycle than they are worth in the marketplace. Therefore, it is difficult to develop a sound business case without government interventions (either in the form of subsidies or market development). Arguably, much more material would be profitable to recover if the products were designed bearing in mind their next stage following use, where disassembly of parts and separation of ingredient materials would enable material recovery. The current strategic policy orientation towards prevention and reuse may be instrumental in prompting a change towards more reuse- and recycling-friendly product design. Institutional framework The strength and transparency of an institutional framework are essential to good governance in solid waste. Within ISWM, transparency and clarity of management structures, lines of accountability, contracting procedures, budgets, cost recovery and corruption, as well as labour practices are particularly examined. In order to assess institutional coherence, we defined two relatively unusual data points relating to the organisational chart and the budget respectively. One data point asks how high in the organisational chart it is necessary to go to find a management position responsible for all solid waste and recycling functions. Similarly, we looked at how many budgets contribute to various aspects of solid waste management, and what percentage of all budgeted costs is concentrated under the largest of these budget lines. In the reference cities, we have found examples of strong political commitment and leadership showing tangible results, but also weak and disinterested institutions with accompanying poor performance of the system. The current solid waste management system in Belo Horizonte is the product of a gradual learning process in urban and environment management initiated a century ago, combined with the contemporary efforts to provide services to all citizens, including those in slum areas (favelas). In Quezon City, solid waste management came together as a comprehensive programme within the
mayor’s vision to create a ‘quality community’ for city residents. Strong central planning and determined implementation, combined with privatisation of street sweeping services and incineration, have resulted in reliable, robust and modern waste services in Kunming, despite inadequate cost recovery from the fees. Ghorahi, Nepal, has demonstrated that financial constraints can be overcome by committed leadership in combination with genuine participatory approach. As a small town in one of the lowest-GDP countries, Ghorahi has managed to construct and operate a modern landfill with no foreign financing. In contrast, in Managua, inadequate collection services can be ascribed to fragmentation of various solid waste functions with little central coordination, weak governance and lack of political commitment, as well as lack of financial resources. Despite a number of studies aimed at modernising solid waste management in Managua, which were carried out in the last 15 years and financed by the international donors, the city still has no disposal alternative to open dumping. This situation is expected to change in the coming period since Managua is currently involved in projects with UN-Habitat and the Spanish Development Agency AECID to address the issue of waste disposal. The situation in Nairobi is equally dire regarding both inadequate waste collection beyond the City Business District and open dumping. With reports of previous donor-funded studies on the shelf, city authorities have not succeeded in ensuring support from the international community to address SWM services and the underlying governance issues in the city. THE GOOD, THE BAD AND THE SPECIAL Under this heading we are interested in the unusual features of systems (good or bad) and the priorities for improvement in the near future. In addition to the examples presented throughout this paper, some of the most interesting cases are presented here. Moshi, a city of 185,000 inhabitants, has the official title of the cleanest city in Tanzania for several years in a row. Moshi's cleanliness is partly attributed to the cleanliness culture of the local Chaga and Pare tribes. While they may have low or middle level of income, they have a high interest in education, business and cleanliness. Members of these tribes also feel responsible for the common good to the extent that they frequently confront anyone littering the streets of Moshi. Kunming has an excellent waste collection system based on over 120 small transfer stations spread throughout the city, connecting non-motorised primary collection by tricycles with high-tech secondary collection by compaction lorries. Rather than being intimidated by sophisticated engineering features of modern landfills, authorities and citizen groups in Ghorahi involved national experts to identify a site with favourable geological characteristics and subsequently managed to mobilise funds to construct landfill, one of the only three in Nepal. Lusaka is an example of an African capital caught in the middle of ‘modernised mixtures’, committed to reconcile the old and the new, traditional and modern approaches in their waste management. The city deploys various options to ensure waste collection services, endeavours to regulate prevalent informal activities, while at the same time using and operating a modern landfill for waste disposal. Similarly, but on a much smaller scale, Canete, Peru, shows leadership to do what it can under institutional and financial constraints, while at the same time integrating informal pickers into the system. San Francisco was in the cohort of North American cities that, as early adopters of modernisation in the 1980s, were the first to show that recycling rates above 50% were

possible, and is still going strong on ‘zero waste’ policies and practices, such as their recent commissioning of a waste characterisation study to establish the recycling potential of their remaining mixed waste streams. Adelaide and South Australia have demonstrated a high level of political commitment and willingness to ‘stick their neck out’ to support and enact zero waste legislation and implement it by putting in place appropriate institutional structures, organisational capacity and financing mechanisms. This includes creation of Office of Zero Waste in 2003 and innovative financing – from the ‘waste depot levy’ that is charged to all landfilled waste. CONCLUSION From this research that we conducted for the UN-Habitat Third Global Report, it is clear that, collectively, we have made much progress in solid waste management and recycling over the last 40 years. While solid waste management is a challenge in many cities, and it can pose public health and environmental risks, and even precipitate into political ‘crisis’ if it is neglected, it can also be a display of strong leadership and commitment to sustainable practices and equity of citizens, under all kinds of circumstances. The stories from our 20 reference cities show that it is possible to make progress in tackling solid waste management despite legitimate constraints. To that end, cities deploy a wide variety of ideas to overcome obstacles, some of which are very innovative, some of which draw upon tradition; some are firmly embedded in local culture and habits, some aim at changing habits and attitudes. There are no ‘one size fits all’ solutions – any successful approach needs to address all three physical system components and all three features of good governance. The methodology used in this research to profile cities’ waste systems can be used to produce both a baseline document and a needs assessment for future intervention. This enables cities to identify the next steps in their development as a function of where they are now and where they wish to be. A reliable approach is to be open, critical and creative: starting from the existing strengths of the city and building upon them; involving all stakeholders to jointly design locally tuned models. Learning from each other in a community of practice provides an opportunity to ‘pick and mix’, adopt and adapt the solutions that will work in a particular local situation. If any common features can be identified amidst all the diversity of ideas and approaches, then they are: taking responsibility and taking action, joining forces with the existing actors, and consideration of local needs and priorities. ACKNOWLEDGEMENTS The authors wish to thank UN-Habitat, and in particular Graham Alabaster, for their initiative and financing for this project. We also wish to thank the more than 100 officials and professionals, formal and informal, in the 20 reference cities who shared their time, insights, knowledge and experience with our research team. Without their generous co-operation, this research would not have been possible. If, in turn, our results can contribute to their work towards sustainable policies and practices in solid waste management and recycling in their cities, our mission is accomplished.

REFERENCES Cox, J., Giorgi, S., Sharp, V., Strange, K., Wilson, D.C. & Blakey, N. (2010) Household waste prevention – a review of evidence. Waste Management & Research 28, pp. 193-219. EC (2008) Directive 2008/98/EC of the European Parliament and of the Council of 19 November 2008 on waste and repealing certain Directives. (http://eur-lex.europa.eu/) Mvulirwenande, S. & Rodic, L. (2010) Benchmarking in Dutch municipal solid waste management. In preparation. Riggs, F. (1962) An Ecological Approach: The ‘Sala’ Model. In: Heady, F. and Stokes, S. (Eds.) Papers in Comparative Public Administration, University of Michigan Institute for Public Administration, Ann Arbor Rodic, L. (2002) Risk assessment as a basis for selection of appropriate landfill technology. International Solid Waste Association (ISWA) Congress 2002, Appropriate environmental and solid waste management and technologies for developing countries, Istanbul, Turkey, July 2002 Spaargaren, G., Oosterveer, P., Van Buuren, J. and Mol, A.P.J. (2005) Mixed Modernities: towards viable urban environmental infrastructure development in east Africa. Position paper. Wageningen University. Scheinberg, A. (2003) ‘The Proof of the Pudding: Urban Recycling in North America as a Process of Ecological Modernisation,’ Environmental Politics 12(4), pp. 49-75. Scheinberg, A., Wilson, D.C. & Rodic, L. (2010) Solid Waste Management in the World’s Cities. Third edition in UN-Habitat’s State of Water and Sanitation in the World’s Cities Series. Published by Earthscan for UN-Habitat, March 2010. Van de Klundert, A. & Anschütz, J. (2001) Integrated Sustainable Waste Management - the Concept. WASTE, Gouda. Wilson, D.C. (2007) Development drivers for waste management. Waste Management & Research 25, pp. 198-207. Wilson, D.C., Rodic, L., Scheinberg, A. & Alabaster, G. (2010) Comparative analysis of solid waste management in cities around the world. In: Proceedings Waste 2010: Waste and Resource Management – Putting Strategy into Practice. Stratford-upon-Avon, Warwickshire, England, 28-29 September 2010


![Comparing Metamodel Methods of Adaptive Basis Function ...propellant grain design and burnback simulation using ... [20] Study of grain burnback and ... [36] Solid rocket motor internal](https://static.fdocuments.net/doc/165x107/60deb1c7f33f5d2dbf25a625/comparing-metamodel-methods-of-adaptive-basis-function-propellant-grain-design.jpg)
