High resolution satellite imagery for spatial data acquisition

COMPARING HYPERSPECTRAL AND MULTISPECTRAL IMAGERY FOR LAND CLASSIFICATION OF THE LOWER DON RIVER, TORONTO
by
Lisa-jen Ferrato
A major research paper presented to Ryerson University
in partial fulfilment of the requirements for the degree of Master of Spatial Analysis
in the Program of Spatial Analysis
Toronto, Ontario, Canada
© Lisa-jen Ferrato 2012

ii
Authors Declaration
I hereby declare that I am the sole author of this major research paper. This is a true copy
of the major research paper, including any required final revisions, as accepted by my
examiners.
I authorize Ryerson University to lend this research paper to other institutions or
individuals for the purpose of scholarly research.
I further authorize Ryerson University to reproduce this major research paper by
photocopying or by other means, in total or in part, at the request of other institutions or
individuals for the purpose of scholarly research.
I understand that my major research paper may be made electronically available to the
public.

iii
Abstract
Urban greenspace is important for the health of cities. Up-to-date databases and
information are vital to maintain and record growth in cities. Despite detailed mapping of
urban land cover through high resolution imagery, medium resolution data should not be
ignored. During the last decade, advances in spaceborne hyperspectral sensors have
proven to be beneficial over multispectral sensors for land cover monitoring due to their
increased spectral resolution. The objective of this research was to compare Earth
Observing-1 (EO-1) Hyperion hyperspectral data to Landsat 5 Thematic Mapper (TM)
and Satellite Probatoire d’Observation de la Terre (SPOT) 5 multispectral data for land
cover classification in a dense urban landscape. For comparative analysis, aerial
orthorectified imagery provided by the Toronto and Region Conservation Authority
(TRCA) was used as a ground truth method for accuracy assessment. This study utilized
conventional and segmented principal components (CPCA and SPCA) for data
compression on the Hyperion imagery, and used principal components analysis (PCA) as
a visual enhancement technique for multispectral imagery. Image processing including
the generation of the normalized difference vegetation index (NDVI), and mean texture
was also performed for both Landsat and SPOT sensors. An unsupervised ISODATA
classification was generated on all images to produce a land cover classification map for
a portion of the Lower Don River in Toronto, Ontario, Canada. Experiments conducted in
this research demonstrated that hyperspectral imagery produced a higher overall accuracy
(5-6% better) than multispectral data with the same resolution for defining vegetation
cover. However, SPOT generated greater accuracy results than Landsat and Hyperion for
vegetation classes.

iv
Acknowledgements
I would like to express great thanks to Dr. K. Wayne Forsythe who provided me with the
hyperspectral data, and whose highly constructive comments helped improve the quality
of my paper significantly. I would also like to acknowledge and kindly thank Chris
Greene for his support and useful suggestions regarding hyperspectral data compression
and principal component concepts. Many thanks to the GIS team at the Toronto and
Region Conservation Authority for providing the aerial orthorectified imagery and
watershed layers. I would like to greatly thank my family and friends for their never-
ending support and encouragement throughout my writing, especially Adriana for her
considerable understanding and revisions of my paper.

v
Table of Contents
Authors Declaration ........................................................................................................ ii
Abstract ......................................................................................................................... iii
Acknowledgements ....................................................................................................... iv
Table of Contents ............................................................................................................v
List of Tables................................................................................................................ vii
List of Figures ............................................................................................................. viii
List of Acronyms ........................................................................................................... ix
CHAPTER 1: Introduction ..............................................................................................1
1.1 Image resolution ................................................................................................................ 2
1.2 Spectral reflectance of land features................................................................................... 3
1.3 Land cover and land use classification ............................................................................... 4
1.4 Multispectral vs. hyperspectral .......................................................................................... 5
1.5 Research objectives ........................................................................................................... 5
1.6 Study area ......................................................................................................................... 6
CHAPTER 2: Literature Review ......................................................................................8
2.1 Remote sensing and land classification .............................................................................. 8
2.2 Differences between hyperspectral and multispectral data .................................................. 8
2.3 Data analysis with multiple sensors ................................................................................. 10
2.4 Applications of multispectral and/or hyperspectral remote sensing in land resources ........ 11
2.5 Data Compression using Principal Components (PC) ....................................................... 16
CHAPTER 3: Data and Methodology ............................................................................ 19
3.1 Data collection ................................................................................................................ 19
3.2 Image acquisition ............................................................................................................ 20
3.3 Hyperion data pre-processing .......................................................................................... 21
3.4 Good Band Selection for the EO-1 Hyperion Dataset ....................................................... 21
3.5 Methodology ................................................................................................................... 23
3.6 Image Enhancement Techniques for Analysis .................................................................. 28
3.6.1 The Normalized Difference Vegetation Index ................................................................ 28
3.6.2 Principal Component Analysis ...................................................................................... 28
3.6.3 Texture and False Colour Composites .......................................................................... 30

vi
3.7 Classification Mapping: Aggregated Classes ................................................................... 33
3.8 Unsupervised classification ............................................................................................. 34
3.9 Accuracy assessment ....................................................................................................... 36
CHAPTER 4: Results & Discussion .............................................................................. 38
4.1.1 Aggregated Results and Discussion .............................................................................. 42
CHAPTER 5: Conclusion .............................................................................................. 50
5.1 Limitations ...................................................................................................................... 51
References ..................................................................................................................... 54

vii
List of Tables
Table 3-1: Hyperspectral and multispectral data characteristics....................…......……19
Table 3-2: Sensor image data………………………………………………………...….21
Table 4-1: Confusion matrix of classification results…………………………………...39
Table 4-2: Accuracy results for comparison…………………………………………….43
Table 4-3: Area of aggregated classes…………………….…………………………….47

viii
List of Figures
Figure 1-1: Lower Don River study area………...…….…………………….……........7
Figure 2-1: Data cube……………………………………………………………….….11
Figure 3-1: Methodology workflow…………………………………………………...22
Figure 3-2: Principal components for conventional Hyperion………………………....24
Figure 3-3: Principal components for segmented Hyperion VNIR.......….……….…...25
Figure 3-4: Principal components for segmented Hyperion SW1 and SW2……….......26
Figure 3-5: The normalized difference vegetation index……..……………………..….28
Figure 3-6: Principal component two………………………………………………...…30
Figure 3-7: Mean texture measure…………………………………………….……..…32
Figure 3-8: False colour composites (NIR, Red, Green)……..……………………..….33
Figure 3-9: Aerial orthorectified imagery…………………………………………..…..37
Figure 4-1: Aggregated results………………………………………………………....41
Figure 4-2: Aggregated results for the Don River subsets…………………………..…48
Figure 4-3: Differences between each sensor from CPCA……………………….……49

ix
List of Acronyms CPCA – Conventional PCA/Hyperion EMS – Electromagnetic Spectrum GIS – Geographic Information System HSI – Hyperspectral Imaging ISODATA - Iterative self-organizing data analysis NDVI – Normalized Difference Vegetation Index NIR – Near Infrared PCIDSK – PCI Geomatica Database file PCA – Principal Components Analysis SPCA – Segmented PCA/Hyperion SPOT – Satellite Probatoire d’Observation de la Terre SWIR – Short wave infrared TM – Thematic Mapper TRCA – Toronto and Region Conservation Authority USGS – United States Geologic Survey UTM – Universal Transverse Mercator VIS – Vegetation, Impervious areas, soil VNIR – Visible and the Near Infrared

1
CHAPTER 1: Introduction
Urban greenspace has been most valued for its positive effect on air and water
quality, the urban heat island effect and ecosystem health. It also allows for rainfall to
soak into the ground leading to a decrease in flood events (Arnold and Gibbons, 1996;
Banzhaf and Hofer, 2008; Heiden et al., 2012). The spatial distribution of greenspace
within dense cities is important for urban planning, sustainable development, as well as
an increase in the quality of urban life for surrounding residents. This is important
because urban greenspace including individual street trees, public parks, edges of roads,
public or private gardens and green infrastructure helps to sustain the quality of urban life
and reduces street noise (Ahem, 2007; Davies et al., 2008; Zhou and Rana, 2012).
Therefore, the value of greenspace is not necessarily expressed in a monetary term, but a
concern for establishing urban social-environmental worth (Cairns, 2006; Paquot, 2005;
Zhou and Rana, 2012). Therefore, working towards conservation within densely
populated areas is essential. Identifying where these areas are located is important, prior
to any efforts being made to protect them.
Since urban green is significant to the health of cities, databases and information
are used to keep and record land cover and land use in cities. The Toronto and Region
Conservation Authority (TRCA) is a large organization that supports sustainable
development in the city. The TRCA manages all nine watersheds and various
conservation areas in the Greater Toronto Area (GTA). An important component of their
contribution includes land use classification. The TRCA’s involvement in conservation is
important because the use of satellite imagery allows for the update and storage of
historical information on land types. Therefore, prior to analysing patterns and trends

2
such as vegetation change and urban development, it is important to first identify earth
surface features from land classification analyses. In this study, by examining land
classification accuracies of hyperspectral and multispectral imagery, organizations such
as the TRCA can benefit from using new sensor technology for preparation of thematic
maps. In summary, spaceborne sensors with high spectral resolutions are ideal for land
cover extraction in dense urban areas (Heidens et al., 2012; Jung et al., 2005). This study
specifically, is important because it tests multispectral and hyperspectral sensors for
classifying land cover.
1.1 Image resolution
There are four types of resolutions in remote sensing including radiometric,
temporal, spatial and spectral. Radiometric resolution is the sensors ability to distinguish
the differences of intensity in an image, while temporal resolution is the repeat time for a
sensor to pass over a geographic region. The most significant components of remotely
sensed images are the spectral and spatial resolutions. These resolutions represent the
geometric makeup of each pixel and relationship to surrounding neighbourhood pixels in
a scene or image. Ultimately, the spatial and spectral resolutions are what set
hyperspectral and multispectral imagery apart. Spatial resolution refers to the sharpness
level of spatial detail shown in an image (Jensen, 2007; Purkis and Klemas, 2011). It is
the measure of the smallest object on the ground set by the sensor representing a single
picture element (pixel) in the image. As a result, distance is associated with pixel size
describing the side length of a pixel. Thus, the finer spatial resolution is associated with a
smaller distance (i.e. 30m by 30m) making it easier for one to define features in a scene.

3
Spectral resolution represents a particular range in wavelength of the
electromagnetic spectrum (EMS) including the number and width of spectral bands
measured by the sensor (Purkis and Klemas, 2011). If the sensor captures a small number
of wide bands, it has a low spectral resolution. In contrast, if the sensor captures a large
amount of narrow bands, the greater the spectral resolution. The advantage of a higher
spectral resolution is for interpreters to distinguish between features in an image. The
greater/finer detail in a scene, the more likely unique characteristics are to be defined
(Jensen, 2007). Based on spectral responses, hyperspectral imagery captures more narrow
bands than multispectral in the same portion of the EMS.
1.2 Spectral reflectance of land features
Energy from the sun that reaches the earth’s atmosphere and surface is reflected,
transmitted or absorbed. The suns position in the sky, time of year, and the terrain on the
ground are equally important to the characteristics of features and interaction between
these phenomena. Earth surface materials have unique interactions with the atmosphere;
hence, the spectral reflectance curve of each feature is affected differently (Jensen, 2007).
For example, the spectral reflectance of vegetation varies over different portions of the
EMS (Purkis and Klemas, 2011). First, in the visible spectrum, vegetation reflectance and
transmittance are small due to a plants ability to greatly absorb chlorophyll (Jensen,
2007). Second, vegetation in the high near infrared (NIR) portion is a strong reflectance
that enables great detection of healthy foliage. Third, in the short wave region, moisture
in vegetation can be detected because the absorption is strong for water.

4
1.3 Land cover and land use classification
Land classification is important because it aims to identify and label each pixel in
an image to define land cover types. This is followed by pixels being accurately
classified, inaccurately classified or unclassified (Purkis and Klemas, 2011). There are
two main classification types: supervised and unsupervised. Supervised classification
excerpts quantitative information of known training sites by the user in an image while
unsupervised classification does not require known areas in an image (Jensen, 2007).
Each method results in determining the number and spatial distribution of spectral classes
through cluster analysis.
Accurate land cover classification and mapping is important for planning,
influencing management and decision making for policy. The ability of satellite imagery
is significant for the identification of urban forest and health of vegetation at large scales.
Ultimately, to predict the global environment using increased spectral resolution and
environmental conditions detected from sensor technology, land cover detection can be
analyzed and associated with the parameters of human impacts on Earth (Arnold and
Gibbons, 1996; Banzhaf and Hofer, 2008). For data integration and analysis, modelling
and map production, spaceborne technology enhances the ability to find ideal solutions to
environmental problems. Flood events in a city are an example of an environmental
problem; a realistic solution is to plant trees that will reduce the impact of excessive
rainfall. Urban landscapes are composed of various materials which make them spectrally
complex in satellite imagery. A variety of ground features close together make land
identification challenging, and therefore new sensor technology with a higher number of
spectral bands such as hyperspectral satellites is crucial for greater analyses.

5
1.4 Multispectral vs. hyperspectral
Monitoring land cover using satellite sensors such as Landsat and SPOT has been
predominant in ecological applications since the 1970s (Pignatti et al., 2009).
Considerable advances in remote sensing technology are driven by environmental issues
rapidly arising at regional scales. There is lack of literature on the subject of spaceborne
hyperspectral imagery comparison and the assessment of land cover information,
specifically in urban areas. By comparing hyperspectral and multispectral imagery,
accurate vegetation mapping is possible, especially at dense urban scales (Liew et al.,
2002). The spectral resolution is the main factor that distinguishes hyperspectral imagery
from multispectral imagery (Barry et al., 2001). Hyperspectral sensors contain bands with
narrow wavelengths while multispectral sensors contain bands with broad wavelengths.
The advantage of using hyperspectral data over multispectral data is the ability to define
surface features with a higher spectral resolution. A complete list of spaceborne
hyperspectral satellites currently in orbit and set to launch is found in Buckingham and
Staenz (2008).
1.5 Research objectives
The objective of this research is to compare hyperspectral imagery to
multispectral imagery for classifying urban greenspace surrounding Toronto’s Lower
Don River. The goal of this study is to make use of Earth Observing-1 (EO-1) Hyperion,
Landsat 5 Thematic Mapper (TM), and Satellite Probatoire d’Observation de la Terre
(SPOT) 5 for comparing land cover and land use information as well as to examine which
sensor is best for defining vegetation. To achieve these objectives, data analyses will be
performed by:

6
• deriving the normalized difference vegetation index (NDVI) and mean texture
from original sensor bands for image classification. NDVI and mean texture as
well as principal component analysis (PCA) will also be used for visual
interpretation;
• producing a conventional and segmented principal component analysis (CPCA
and SPCA) on the hyperspectral image as a data compression method; and
• utilizing aerial orthorectified imagery as a ground reference method for accuracy
assessment while comparing all three sensors.
1.6 Study area
The study area is the Lower Don River and Toronto’s waterfront (Figure 1-1).
The Don River is the most urbanized watershed in Canada (TRCA, 2012). Loss of natural
areas threatens the Don’s watershed health. Significant wetlands are disappearing, and
only 7.2% of forested land remains in the Don River watershed (TRCA, 2012). It is
affected by its industrial past which makes it a significant area for studying the health of
vegetation cover. Today, the Don River watershed consists of 360 square kilometres of
land throughout Toronto. A large portion of this area is urbanized development (with
over 800,000 residents) which puts stress on the land (TRCA, 2012). The Don River
watershed has nine sub-basins. This research will contribute significantly to the
assessment of land cover classification and through its use of hyperspectral imagery. In a
previous study, Forsythe (2003) used multispectral data fusion techniques to examine
residential development over time for the City of Toronto. Ultimately, by using imagery
from SPOT 5, Landsat 5 TM and EO-1 Hyperion, this study addresses the gap in

7
literature by incorporating hyperspectral data for assessing land classification in a dense
urban watershed.
Figure 3-1: Lower Don River Study Area

8
CHAPTER 2: Literature Review 2.1 Remote sensing and land classification
Remotely sensed data are regularly used for monitoring and assessing land
features across large spatial scales and replacing traditional data collection methods,
which involve time and cost-intensive ground surveys (Heiden et al., 2012; Pignatti et al.,
2009). Classification and mapping of land cover is necessary for sustainable management
in growing urban cities, and land cover information extracted using digital and visual
image processing is an important approach used to make decisions for such planning
endeavours. There are two types of sensors used in this study and discussed throughout
this chapter, including optical-mechanical systems, such as the Landsat 5 TM
multispectral sensor; and the linear area array system, such as the SPOT 5 multispectral
sensor; and the EO-1 Hyperion hyperspectral sensor, also referred to as an imaging
spectrometer (Jensen, 2007).
2.2 Differences between hyperspectral and multispectral data
Multispectral satellite remote sensing technologies have been commonly used for
remotely sensed classification of vegetation since the early 1960s (Govender et al., 2008;
Jensen, 2007). In a single observation, multispectral sensors generate three to six spectral
bands of data that range from the visible to NIR of the EMS (Jensen, 2007). This small
window of spectral bands is a primary disadvantage to multispectral sensors. During the
last decade, advances in imaging spectrometers have begun to fill the gap in multispectral
sensor limitations providing better performance in object detection, classification, and
identification of earth features (Heiden et al., 2012; Pignatti et al., 2009; Purkis and
Kemis, 2011). Hyperspectral sensors commonly collect more than 200 spectral bands that
range from the visible to short wave infrared (SWIR) section of the EMS; they provide

9
extensive analyses of earth surface features that would be limited with coarser
bandwidths collected by multispectral data. Hyperspectral sensors not only produce
detailed spectral data consisting of hundreds of bands in a single collection, linear area
arrays are also used, which improves image geometry and radiometry allowing longer
instaneous field of view (IFOV) detection and resulting in a more precise reading of an
objects radiant flux as it passes over a given landscape (Jensen, 2007). Thus, these
advantages have led to recent scholarly and governmental explorations of classification
and mapping for land cover and vegetation with the application of hyperspectral imagery
(HSI) (Heiden et al., 2012; Jung et al., 2005).
Ultimately, hyperspectral images have advantages over multispectral images.
Peijun et al. (2010) demonstrated the benefits of EO-1 Hyperion compared to Landsat
TM imagery, and suggest that image spectrometry is more effective when examining
urban impervious surfaces. In relation to the advantages of HSI, the unmixing method
using linear spectral mixture analysis (LSMA) with hard classification (identifying land
classes as impervious surfaces) methods provides greater accuracy (Peijun et al., 2010).
When both HSI and multispectral imagery (MSI) are used in classification, such as
including different data analysis techniques, accuracy assessment is made easier due to
the integration of a higher number of spectral bands and techniques to define earth
features. Figure 2-1 shows the differences of multispectral and hyperspectral data in three
dimensional space.

10
Figure 4-1: 3D data cube
2.3 Data analysis with multiple sensors
Data analysis in remote sensing sometimes involves the integration of
information from two or more sensors in order to examine a common theme. In their
study, Kruse et al. (2003) compared the performance of the spaceborne Hyperion sensor
and the airborne visible/infrared imaging spectrometer (AVIRIS) sensor for mineralogy
mapping. By integrating medium spatial resolution multispectral and hyperspectral data
with aerial orthorectified imagery, land feature identification is improved due to the
higher spectral and spatial resolution combined (Kruse et al., 2003; Smith 2003). This
way, more than six spectral bands are used for better definition of earth surface features.
According to recent literature, accurate land cover mapping is best when high
spatial resolution data are used (Petropoulos et al., 2012; Pignatti et al., 2008; Smith,
2003; Yang et al., 2010). However, there is a gap in literature that compares high spatial
resolution to high spectral resolution when discriminating land types. Govender et al.
Hyperion
SPOT5 LS5TM
Images are acquired simultaneously in many narrow, registered spectral bands

11
(2008) used the Hyperion hyperspectral sensor and the multispectral Proba CHRIS
(Compact High Resolution Imaging Spectrometer) sensor and found an overall accuracy
of 98%. The authors compared different classification techniques to determine the best
accuracy results by verifying the spatial distribution of vegetation classification to true
colour images. Various studies have investigated the ability of integrating Hyperion data
with other image data (Pu and Gong, 2004; Thenkabaul, 2004; Galvao et al., 2005;
Giardino et al., 2007). Ultimately, by analyzing different data processing technology,
information in an image can be extracted more accurately.
2.4 Applications of multispectral and/or hyperspectral remote sensing in land resources
Multispectral satellite sensors have been commercially available since the first
Landsat satellite was sent into orbit in 1972 (Jensen, 2007). Since the launch of Landsat
1, several sensors have been sent into space with varying spatial and spectral resolutions
including the French SPOT 1 satellite that was sent into space in 1986 (European Space
Agency, 2012). It was not until 1984 that the Landsat 5 sensor was launched, and in 2002
the SPOT 5 sensor was sent into space (Jensen, 2007). Since the launch of these sensors,
various applications and analyses of earth have been undertaken.
In recent studies, SPOT 5 has proven suitable for crop identification, area
estimation (Yang et al., 2011) and regional studies of tree canopy-cover patterns (Boggs,
2010). Yang et al. (2011) evaluated the overall accuracy results (91%) of the SPOT 5
sensor alone with a maximum likelihood classification technique; however, their study
does not analyze different sensor data, which may influence accuracy results for
identifying crop types. In contrast, studies that include image enhancement techniques
along with other sensors, have proven to be effective (Boggs, 2010; Peijun et al., 2010;

12
Pignatti et al., 2009). Boggs (2010) analyzed the ability of the NDVI technique for
mapping tree canopy clusters while integrating Quickbird and SPOT 5 imagery and found
that by combining these two sensors, regional studies of tree canopy patterns increase
accuracy results by ten per cent (85-95%). The two studies previously mentioned are
related due to both studies investigating detailed classification of crops and tree canopy
while using SPOT 5 imagery.
A major theme in published literature is the use of high spatial resolution data
used as reference information to test the performance of hyperspectral and multispectral
medium spatial resolution sensor data for accuracy mapping of various land
classifications (Peijun et al., 2010; Yang and Everitt, 2010; Winjanarto and Amhar,
2010). Yang and Everitt (2010) suggest that by combining aerial photography with
hyperspectral and multispectral data, monitoring and mapping infestations of broom
snakeweed in the western United States increases overall accuracy results for
classification maps of 95%. Similarly, Peijun et al. (2010) found that using high
resolution Quickbird imagery as a ground reference produced an overall accuracy of
approaching 87% in their study.
Within the last decade, hyperspectral remote sensing has gained awareness in
research and analysis. Currently, with spaceborne sensors such as the EO-1 Hyperion,
hyperspectral data collection is rapidly expanding to applied satellite sensor research
studies. Applications including water management, agriculture and ecological monitoring
have advanced with the aid of hyperspectral imagery (Govender et al., 2007; Pignatti et
al., 2009). The importance of using imaging spectrometry lies in the spectral resolution
rather than spatial resolution compared to multispectral imagery.

13
Hyperspectral data can be used for analyzing various terrestrial applications.
Griffin et al. (2005) provide three examples for analyzing EO-1 Hyperion data in
different applications including cloud-cover analysis, coastal water feature extraction,
and terrestrial analysis applications. Classification of different terrain types, including
soil moisture, vegetation chlorophyll, and plant liquid water, was observed to define
several agricultural fields. Through this research, they suggest that hyperspectral data
offer value when using selected or full spectral bands (Griffin et al, 2005). Ultimately,
HSI is versatile when extracting data such as band thresholds, ratios, and differences of
earth features for object definition.
Applications in vegetation studies have been conducted by integrating multiple
sensors. Recent applications for integrating both multispectral and hyperspectral sensor
types involve vegetation classification at larger scales. Van de Voorde et al. (2008)
compared the unmixing mapping potential at the pixel level of Hyperion with that of
Landsat 7 Enhanced Thematic Mapper Plus (ETM+), and stressed that to classify urban
vegetation at a spatially detailed level, linear spectral unmixing attains sufficient accuracy
in Brussels, Belgium. In contrast, Wijanarto and Amhar (2010) used the combination of
Hyperion and the Moderate Resolution Imaging Spectroradiometer (MODIS) to conduct
tropical biodiversity mapping in Bogor Botanical Gardens in Indonesia to address the
need of a tropical spectra library, while at the same time suggesting that band selection is
most significant for defining features. Souza et al. (2010) conducted a more detailed
study using 18 narrowband Hyperion data for canopy cover in the Brazilian Savannah.
The authors found that physical parameters of different vegetation species, including
grassland and savannah to tall semi-deciduous forest, largely correlated with Hyperion

14
vegetation indices such as the NDVI, therefore comparing Hyperion spectral bands and
biophysical parameters together. In similar research conducted by Pu et al (2008) in
California, USA, three different sensors including Hyperion, Advanced Land Imager
(ALI) and Landsat 7 ETM were used to map forest crown closure and the leaf area index
(LAI) for comparative analyses. The study found that Hyperion outperforms all sensors
due to its high spectral resolution.
An emerging application in urban environmental studies is to compare the ability
of Hyperion sensor data to other satellite sensors, mainly ones that are multispectral
including airborne sensors (Goodenough et al., 2003; Walsh et al., 2008). Hyperspectral
remote sensing has become common in urban environments to monitor the urban
influence on impervious surfaces (Van der Linden et al., 2009; Weng et al., 2008; Lu and
Weng, 2006). At a regional level, Peijun et al. (2010) analyzed Hyperion and Landsat 5
TM data for urban impervious surface extraction and compared it to Quickbird images as
referencing earth features for assessing the accuracy for each sensor in Xuzhou City,
China. In their study, Heiden et al. (2011) describe an urban structure type (UST)
application to assess ecological state in urban planning for Munich, Germany. The
findings demonstrate the hyperspectral sensors ability to derive urban land cover for
complex analyses of large dense areas and updating surface material databases for use in
urban development. Chang et al. (2011) present a challenging analysis where they
develop techniques to perform an unsupervised linear spectral mixing analysis (ULSMA)
to determine the number of signatures in an image. This study located spectral signatures
used to unmix data; this is complex compared to supervised linear spectral mixing
analysis (SLSMA) because the target signatures are unknown rather than a priori. Jung et

15
al. (2005) examined hyperspectral imagery and its detection of vegetation in an urban
landscape and found that when discriminating different types of vegetation, the SWIR
bands are most reliable. They attempted to detect the effect of vegetation on micro-scale
environmental problems among build-up conditions.
Successful applications for defining vegetation at medium spatial resolution by
incorporating spectral unmixing techniques are seen in various studies (Liew et al., 2002;
Peijun et al., 2010; Petrou and Foschi, 1999; Pignatti et al., 2009; Ridd, 1995; Settle and
Drake, 1993; Van de Voorde et al., 2008). These studies have shown that ULSMA is an
effective way to map land surface and vegetation where it uses fractions of land cover to
define in each pixel. By characterizing urban environments through LSMA, the
Vegetation-Impervious-Soil (VIS) model is widely used in urban landscapes (Van de
Voorde et al., 2008). The VIS model is useful because it represents three physical
components of urban environment including vegetation, impervious areas and soil (VIS).
If these three components could be clearly signified as endmembers in space, fractions
extracted from unmixing a dense area would enable pixels to be placed in the VIS model.
Van de Voorde et al. (2008) found that unmixing pixels using LSMA provides greater
accuracy then hard classification methods while using linear modelling portions of
impervious surfaces for each sensor compared. They suggest that the use of the VIS
model is important when extracting impervious areas from dense cities. The potential
analysis of urban form and features on the ground for medium resolution satellite
imagery can therefore be analyzed with the VIS model.

16
2.5 Data Compression using Principal Components (PC)
Use of hyperspectral imaging (HSI) potentially gives researchers (Datt et al.,
2003; Khurshid et al., 2006; Tsai et al., 2007) the advantage to accomplish complex
analyses that are often difficult with multispectral imaging. One advantage of HSI is
maintaining a greater amount of spectral bands to define land cover in dense urban
regions. Nevertheless, hyperspectral sensors compared to multispectral sensors may
cause new difficulties in data processing and analysis that could hinder the success of
certain research endeavours. One of the difficulties of handling hyperspectral datasets is
the size of data that requires more attention due to its high data dimensionality and
redundancy (Khurshid et al., 2006; Tsai et al., 2007). These concerns alone may result in
low accuracies when classifying land features. Ultimately, hyperspectral analysis
involves crucial attention to data compression. By not compressing hyperspectral data
and only selecting a few bands for analysis, the continuity of spectral data and the sensors
full capacity would not be considered.
Reducing dimensionality in a large dataset while maintaining the data and their
complexity is the best tactic. An example of a developed algorithm for such data handling
includes maximum noise fraction (MNF) proposed by Green et al. (1988). Ultimately,
this data compression approach specifically considers the large amount of data in HSI
while maintaining useful information to redevelop a dataset with as few bands as possible
which ideally represent most of the important data and, as a result, reduce dimensionality
of data (Small, 2001).
Another approach to reduce data dimensionality for large datasets is PCA. Studies
often use PCA for visualization interpretation purposes such as feature extraction for

17
reducing data dimensionality and defining classes when performing classification
(Kaarna et al., 2006; Liew et al., 2002; Myint et al., 2011; Sanchez-Hernandex et al.,
2007). However, greater research and usability of PCA for data compression is not as
common in literature. Nevertheless, Cheriyadat and Bruce (2003) used airborne
hyperspectral data and found that data compression is effective, but ineffective for
supervised classification where areas of known features are defined. They argued that
PCA does not necessarily retain the important feature characteristics in higher order
principal components where crucial information may be present in a lower order
component and can therefore be eliminated for analysis. In this study, each PC was
closely examined to include the best results for classification.
For more effective extraction of vegetation over complex study areas, segmented
principal components analysis (SPCA) has been applied to enhance conventional
principal components analysis (CPCA) methods (Datt et al., 2003; Kaarna et al., 2006).
Since vegetation contains diverse structure types, the characteristics, including absorption
and reflectance across different portions of wavelengths, also differ (Bell and Baranoskie,
2004). If PCA were to be generated for each range of the spectrum (VNIR, SW1 and 2)
the significant information is better maintained for each separate portion rather than
CPCA which is generated across an entire spectrum (Tsai et al., 2007). Ideally, a SPCA
should produce greater accuracy results for classification purposes.
In summary, recent research has shown that greater accuracy results are produced
when analyzing hyperspectral data in combination with multispectral data for identifying
various land cover in complex landscapes (Barry et al., 2001; Koch et al., 2005; Liew et
al., 2002; Peijun et al., 2010; Pignatti et al., 2008; Wijanarto and Amhar, 2010). This

18
research will compare the three sensors for mapping and classification of vegetation
health in urban areas using hyperspectral and multispectral data.

19
CHAPTER 3: Data and Methodology 3.1 Data collection
Hyperion is a hyperspectral satellite aboard the EO-1 spaceborne platform
covering the spectral range of 450-2600 nanometres (nm) consisting of 220 bands at a
spatial resolution of 30 metres (Jarecke and Yokoyama, 2000; USGS, 2011). This push-
broom imaging spectrometer satellite was launched in November, 2000 by NASA for the
purpose of studying terrestrial vegetation (Griffin et al., 2005) and to establish the
viability and performance of advanced sensors for the Landsat series (USGS, 2011). In
contrast, multispectral sensors contain broad spectral bands ranging from the blue, green,
red, NIR, mid-infrared (MIR) and far-infrared (FIR) of the EMS for Landsat 5 TM and
green to the MIR and the SWIR for SPOT 5. The imagery used for this study were
obtained from the US Geological Survey’s Earth Explorer (http://earthexplorer.usgs.gov/)
server and the GeoBase Canada (http://www.geobase.ca/) server, which were
preprocessed at level one radiance, systematic and terrain corrected (See Table 3-1). All
three images were subset to conform to the Hyperion dataset and within the boundaries of
the Lower Don River watershed as well as the Toronto waterfront.
Ultimately, this study utilizes three different satellite images including Landsat 5
TM, EO-1 Hyperion and SPOT 5 from July 17th in 2008, August 1st, August 11th in 2007
respectively. Table 3-2 shows a complete list of the data and will be further explained.
The multispectral data from both sensors were subset based on data available from
Hyperion. Aerial orthorectified imagery provided by the TRCA was used as a ground
reference for accuracy assessment of the study area. This research attempts to perform a

20
land cover classification using hyperspectral and multispectral data over the Lower Don
River at Toronto’s harbour front.
Table 3-1: Hyperspectral and multispectral data characteristics
Parameters Multispectral Multispectral Hyperspectral WRS - 2 Projection SPOT 4 LS5TM EO-1 Hyperion
Spectral Range 500-1750 nm 400-2400 nm 400-2600 nm (10 nm ea.)
Spatial Resolution 20 nm 30 m 30 m Swath Width 60 km 185 km 7.5 km Acquisition Date August 1st, 2007 July 17th, 2008 August 11th, 2007 Number of Bands 4 6 & Thermal 220 Bands used 1-4 1-5, 7 14-55, 135-163, & 191-212
The NDVI, PCA and mean texture image processing techniques were performed
on each image scene to evaluate certain spectral characteristics for vegetation health in a
complex urban landscape as well as to achieve dimensionality reduction. An
unsupervised classification and iterative self-organizing data analysis (ISODATA)
classification were performed to examine the difference in spectral classes for land cover.
Classification was only performed on those bands in common with Landsat and SPOT;
the effect of the SWIR band on classification results was examined. The data collected
for this study included the three sensors that were based on their medium resolution and
no cost availability.
3.2 Image acquisition The image time of acquisition presented in Table 3-1 shows different dates for
each sensor. It is inevitable that freely available data from three separate sensors are
acquired at a different date and time, and with minimal cloud coverage. The EO-1
Hyperion image acquired on August 11th, 2007 is the only image available for this sensor,
thus, the Landsat 5 TM and SPOT 5 images had to be as closely matched as possible in

21
acquisition dates. Various multispectral images were examined, and the two considered
in this study have the less than 10% cloud coverage. Although the SPOT sensor is within
days (August 1st, 2007) of the Hyperion sensor, the closest available data for Landsat 5
TM is unfortunately acquired almost an entire year after (July 17th, 2008). Although not
much change can occur in a large city within a span of a year, this time difference may
affect results of this particular study. For example, underdeveloped land for commercial
purposes may be developed within a year.
3.3 Hyperion data pre-processing
Data preparation for hyperspectral imagery was necessary. Image rectification,
also known as geometric correction was conducted on Hyperion by using PCI Geomatica
OrthoEngine’s generic satellite model by collecting eighteen ground control points
(GCPs) in reference to the Landsat 5 TM imagery. An overall root mean square (RMS)
error of 0.59 was achieved as less than one is a necessity. Prior to analysis, all three
images were projected to the North American Datum 1983 universal transverse Mercator
(UTM) Zone 17 North projection and visually inspected for alignment. For the reason
that multispectral sensors have few and wide band widths, the Hyperion band selection
involved carefully choosing spectral responses that resemble those of Landsat and SPOT
in the VNIR and SWIR regions.
3.4 Good Band Selection for the EO-1 Hyperion Dataset
This section briefly describes the pre-processing methods applied for good band
selection of Hyperion imagery. Level one terrain corrected data was converted into PCI
Geomatica format files (.pix). ‘Bad’ band selection was performed first, non-calibrated
bands according to Petropulos et al. (2012), Pu et al. (2008), Wijanarto and Amhar

22
(2010), Carter et al. (2009) and Jarecke et al. (2001) were removed including bands 1-7,
58-78, 225-242; these bands were also visually reviewed. According to the USGS (2011)
198 calibrated bands cover 426 to 2395 nm of the EMS. Second, water absorption bands
including 120-132, 165-182, 185-187, 221-224 were eliminated to reduce the influence of
atmospheric scatter, and water vapour absorption that are caused by mixed gasses
(Petropoulos et al., 2012). Third, bands visually identified as vertical stripes were
eliminated including 8-13, 56-57, 79-83, 97-102, 119, 133-134, 152-153, 164, 183-184,
188-190, 213-220. Images containing vertical stripes are a result of faults with push-
broom based sensors and usually removed after visual inspection (Petropoulos et al.,
2012; Pu et al., 2008; Wijanarto and Amhar, 2010). Atmospheric correction was not
conducted because the images are already terrain corrected and according to Petropoulos
et al. (2012) it is not necessary in a single observation. The Hyperion wavelength (nm)
ranges were then compared to Landsat 5 TM and SPOT 5 and reduced from 122 to 93
Hyperion bands (correlated between each of the sensors wavelength portions) and used
for analysis. The Hyperion bands selected to correlate with the two multispectral sensors
were chosen based on Carter’s et al. (2009) study and are shown in Table 3-2.
Table 3-2: Sensor image data
EMS LS5TM WL(nm) SPOT5 WL (nm) Hyperion WL (nm) Correlated nm) Visible 1 450-520 n/a n/a 14
488-926
488-520 Visible 2 520-600 1 500-590 21 520-590 Visible 3 630-690 2 610-680 31 630-680 NIR 4 760-900 3 780-890 48 780-890 SWIR 1 5 1550-1750 4 1580-1750 150 1488-1790 1580-1750 SWIR 2 7 2080-2350 n/a n/a 206 1972-2365 2080-2350
23
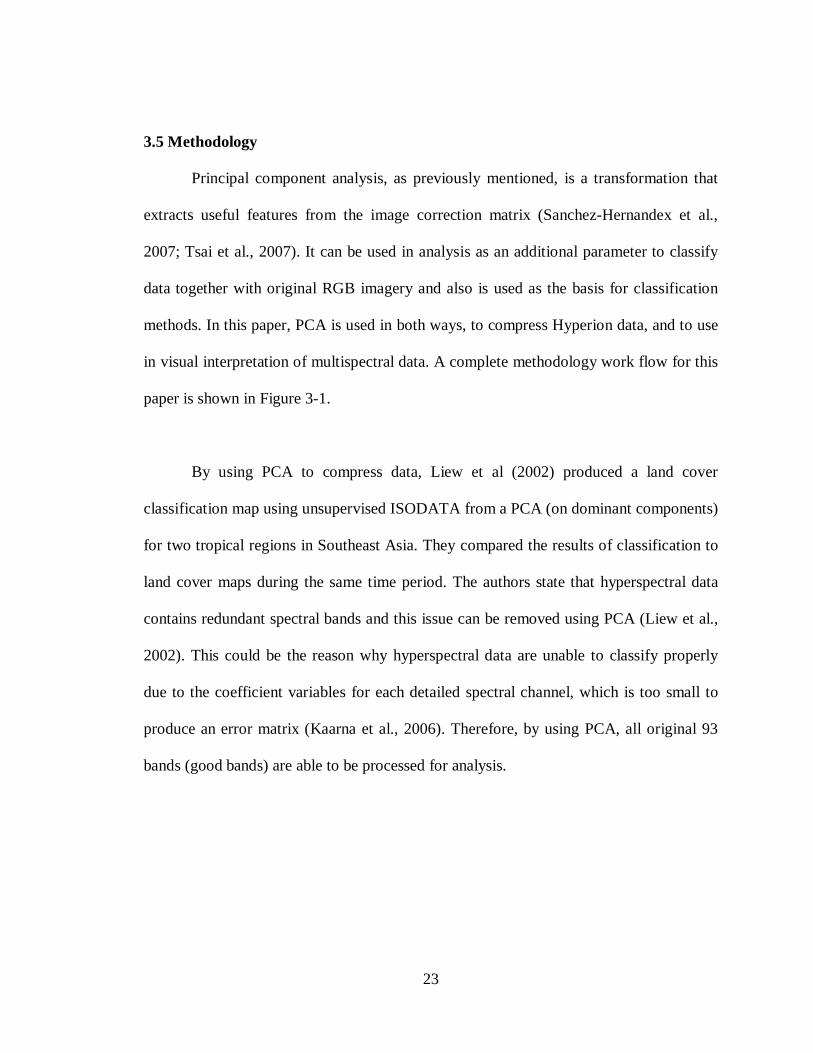
3.5 Methodology
Principal component analysis, as previously mentioned, is a transformation that
extracts useful features from the image correction matrix (Sanchez-Hernandex et al.,
2007; Tsai et al., 2007). It can be used in analysis as an additional parameter to classify
data together with original RGB imagery and also is used as the basis for classification
methods. In this paper, PCA is used in both ways, to compress Hyperion data, and to use
in visual interpretation of multispectral data. A complete methodology work flow for this
paper is shown in Figure 3-1.
By using PCA to compress data, Liew et al (2002) produced a land cover
classification map using unsupervised ISODATA from a PCA (on dominant components)
for two tropical regions in Southeast Asia. They compared the results of classification to
land cover maps during the same time period. The authors state that hyperspectral data
contains redundant spectral bands and this issue can be removed using PCA (Liew et al.,
2002). This could be the reason why hyperspectral data are unable to classify properly
due to the coefficient variables for each detailed spectral channel, which is too small to
produce an error matrix (Kaarna et al., 2006). Therefore, by using PCA, all original 93
bands (good bands) are able to be processed for analysis.

24
Figure 5-1: Methodology workflow
Figure 3-2 shows the PCs generated from conventional Hyperion. There are five
PCs generated because of the large amount of spectral bands to be compressed.
According to Tsai et al. (2007), even though the first three PCs contain the most
information with fewer bands, there may be a PC in lower order that contains important
information when using hyperspectral imagery. In addition to the CPC data compression
method, a PCA segmentation was performed which separated the VNIR (PCs 1-3 and 5)
and SW1 (PCs 1-2) and SW2 (PC 1) for defining land cover from land use (See Figure 3-
3 and Figure 3-4). Based on the eigenvalues and the PCs that visually looked unaffected
by stripes, these PCs were combined to generate an additional classification for Hyperion.
In contrast, the PCA 2 was chosen by visual inspection of the images that contained the
least image distortion for the multispectral images.

25
Figure 3-2: PCs 1-5 (a–e) for conventional Hyperion.

26
Figure 3-3: Principal components for segmented Hyperion, VNIR (a–d).

27
Figure 3-4: Principal components for segmented Hyperion, SW1 (PCs a-b), SW2 (PC c)
The aim of this analysis was to distinguish vegetation from non-vegetation in
complex urban environments. To achieve this objective, the algorithm for PCA used as a
feature extraction and data compression method (in order to compare both multispectral
and hyperspectral data) must be able to define vegetation characteristics and effective
variations among trees and open green space for classification.

28
3.6 Image Enhancement Techniques for Analysis
3.6.1 The Normalized Difference Vegetation Index
There are various image analysis processes that can be applied to data for greater
feature analysis and extraction. The NDVI is a widely used image ratio for monitoring
vegetation conditions that is based upon the fact that healthy plants and biomass that
absorb visible light and reflect NIR (Jensen, 2007; Purkis and Klemas, 2011). Therefore,
NDVI measures the amount of biomass in an image and is represented by diverging
shades of black and white in PCI Geomatica that signify a higher level of vegetation. In
this study, the NDVI should provide a more accurate definition between vegetation and
built areas in the Don River Valley (Figure 3-5). Forsythe (2003) distinguished classes by
incorporating the NDVI analyses for urban change detection. Thus, one method for
processing data includes integrating NDVI.
3.6.2 Principal Component Analysis
PCA is often used in remote sensing to reduce the dimensionality of spatial
features in an image. As previously mentioned, there are two valuable reasons why this
method is used, first, to compress data, and second, to extract features for classification
(Jensen, 2007). Cheriyadat and Bruce (2003) argue that PCA should not be used for
supervised classification on hyperspectral data due to poor feature extraction and
dimensionality reduction. In contrast, Tsai et al. (2006) suggest that spectrally SPCA is
the best method for defining specific plant species with Hyperion hyperspectral imagery
centred on spectral appearances of vegetation over different wavelength regions that
resulted in an overall accuracy of 86% as opposed to CPCA of 66%.

29
Figure 3-5: The normalized difference vegetation index for Hyperion (a) Landsat 5 TM (b) and SPOT 5 (c).
Liew et al. (2002) performed a land cover classification of tropical region and
forest cover surrounding urban areas in Singapore using an unsupervised ISODATA
classification and PCA with VNIR bands. Both Liew et al. (2002) and Wijanarto and
Amhar (2010) found that the spectra data of VNIR bands far exceeded the performance
ability of the SWIR for forest cover. However, Jung et al. (2005) suggests that SWIR are
the most efficient bands to examine the differences in vegetation. Liew et al. (2002)
suggest that further improvement of classifying data would be to incorporate the SWIR

30
bands instead of just the VNIR bands used in their study. As previously mentioned, PCA
is used in this study as a data compression method for Hyperion data only, while PCA 2
is used as a visual interpretive method for defining features in Landsat 5 TM and SPOT 5
imagery (Figure 3-6).
Figure 3-6: Principal component 2 for Landsat 5 TM (a) and SPOT 5 (b).
3.6.3 Texture and False Colour Composites
Texture is a measure of the amount of graininess in an image searching for areas
that have the same roughness characteristic (Jensen, 2007; Purkis and Klemas, 2011). An
example for using texture includes distinguishing between barren ground and open green

31
areas. Texture is important in defining areas to improve classification accuracy.
Furthermore, texture is a simple related measure that is extracted from a certain sized
window set by the user, and then added to the original image dataset prior to
classification (Jensen, 2007; Forsythe and Waters, 2006; Purkis and Klemas, 2011).
There are different texture measures including homogeneity, contrast,
dissimilarity and mean texture (Forsythe and Waters, 2006; Purkis and Klemas, 2011).
Mean image texture is used in this research and is a simple texture description of the grey
levels in the texture window used for each image pixel (Jensen, 2007). Forsythe and
Waters (2006) examine different texture measures for the expanding City of Calgary,
Alberta. They found that by implementing a 3x3 window, it produced greater results than
a 7x7 window due to the finer detail that was highlighted within densely urban areas.
Therefore, in this study, mean texture (Figure 3-7) with a 3x3 window size is used.
Another image enhancement technique for determining spectral clusters involved the
false colour composites. These composites were challenging at first to analyze visually as
opposed to referring to a true colour composite. As previously mentioned, false colour
composites are beneficial for understanding vegetated areas of interest in the NIR and red
regions of the spectrum. (See Figure 3-8).

32
Figure 3-7: Mean texture measure for conventional Hyperion (a) segmented Hyperion (b) Landsat 5 TM (c) and SPOT 5 (d).

33
Figure 3-8: False colour composites (NIR, Red, Green) for Hyperion (a) segmented Hyperion (b) Landsat 5 TM (c) and SPOT 5 (d). 3.7 Classification Mapping: Aggregated Classes
In this research, classification labelling was considered. The classes used are
derived from the Level I classification system from Anderson et al. (1976). Due to this
paper’s study area and the spatial resolutions of 20 to 30 metres, five classes were used
including tree canopy, open green, barren ground, water body, and urban surfaces. Due
to the objective of this research for examining urban green, the urban surfaces include
white tops of industrial buildings, parking lots, roads and rows of houses and roof tops of

34
commercial buildings. The open green class includes parks, golf courses, and fields. In
addition, Peijun et al (2010) used the VIS model proposed by Ridd (1995) where
vegetation, impervious surfaces and soil are to be examined in areas of increased
densities. This idea was also considered when creating the classes for this study,
however, the vegetation class was further divided and a water body class was added due
to the study area containing large amounts of open spaces, water bodies, and trees along
the Don River. In addition, there are significant areas of barren ground that needed to be
classified separately.
3.8 Unsupervised classification Many studies have used hyper/multispectral imagery for extracting land cover
information using an unsupervised classification (Cheng et al., 2011; Liew et al., 2002;
Yuan and Niu, 2007). An unsupervised classification is used for all images and the
produced imaging techniques. When using the unsupervised classification approach, the
entire image is analyzed with unknown training data (Jensen, 2007). Clusters of data can
then be identified in association to pixel values. The interative self-organizing data
analysis (ISODATA) algorithm was used to categorize the spectral clusters from the three
images. This algorithm has been used in vegetation studies for comparing Hyperion
hyperspectral data to Landsat 7 ETM+ data over Yunnan province in China for land
classification (Yuan and Niu, 2007). In this study, 100 output spectral clusters (with 20
iterations) were generated. The algorithm identified between 60 and 64 output clusters.
The generated clusters were assigned to one of the five land cover classes.
Thus, the ISODATA method is used consisting of the user specifying the number
of clusters that may be within the image (Yang, 2007). The computer then assigns

35
coordinates to each cluster within the section and every pixel is allocated to its suitable
clusters (Rees, 2001). In other words, the ISODATA algorithm group’s pixels with
similar intensity values within all of the different layers in a classification to ultimately
match spectral classes with the information classes of interest.
By using both hyperspectral and multispectral satellite remote sensing data,
Govender et al. (2008) compared the classification of distinct vegetation classes using
different classifying techniques. They found that by using a supervised classification
process, maximum likelihood and Mahalanobis distance provided the best accuracy
results. The authors found that the classification and mapping of different tree species
depends on hyperspectral and multispectral to produce different degrees of accuracy and
are strongly affected by seasonal changes in vegetation from winter to summer. The study
also found that multispectral images detected genus level classification compared to
hyperspectral that provided greater detail of genus and species level classification
therefore suggesting that finer spectral resolution using a unique set of spectral bands can
substantially improve vegetation classification and hyperspectral data should be used
together with multispectral data for defining different vegetation classes accurately
(Govender et al, 2008). Related studies involving forestry and agriculture have
incorporated supervised classification methods (Pignatti et al., 2009; Wijanarto and
Amhar, 2010). It is apparent in the previously mentioned literature that the supervised
method for classifying objects is more suitable for rural studies where landscapes are less
complex.

36
3.9 Accuracy assessment
Classification accuracy is a necessary component in land cover/use classification
because it analyzes the difference between the classified data in a study compared to the
original reference data (Foody, 2002; Jensen, 2007; Thenkabail et al., 2004). It is
expected to accomplish an accuracy that reflects true land cover. This study assessed the
accuracy of classification for each of the three images which created an error matrix and
calculated user’s accuracy (percentage of pixels classified correctly on the ground), and
producer’s accuracy (percentage of given class that is correctly identified on an image),
and overall accuracy (Smith et al., 2003; Thenkabail et al., 2004). The kappa coefficient
of agreement for each classification was generated from the error matrix.
In this study, the post classification accuracy assessment demonstrates an overall
percentage of the aggregated classes (tree canopy, open green, barren ground, water
body, and urban areas) in association to the aerial orthorectified imagery (See Figure 3-
9). First however, in order to proceed with accuracy assessment, Geographic Information
Systems (GIS) was used to generate three hundred random sample points to be compared
to across the three classified images and the aerial orthorectified image. The random
point’s shapefile was generated and the pixels from Hyperion were extracted; the Raster
to Point tool was used to limit the amount of mixed pixels in the imagery. This procedure
was done to eliminate the potential of bias results for mixels (mixed pixels). The random
sample points were created in ArcGIS so that consistency was upheld for comparing the
three images together and against the aerial orthorectified image. Therefore, the accuracy
points will fall within the centroid of the pixel, rather than a stratified point potentially
skewing the aggregation by falling on the edge of a pixel with, for example, 10% water

37
and 90% vegetation. Although these points may be slightly off-centre with SPOT 5 data
due to the finer spatial resolution, the accuracy should not alter drastically.
Figure 3-9: Aerial orthorectified imagery for ground reference for accuracy measure. Source: Orthophoto: Fall 2007, First Base Solutions Inc. provided by the TRCA.

38
CHAPTER 4: Results & Discussion
The overall classification accuracy for the five classes in each image ranged from
64% to 69%. The Hyperion unsupervised classification with CPCA had an overall
accuracy of 65.33% and a Kappa value of 0.48, which indicated that agreement in the
error matrix was largely greater than chance. Hyperion’s SPCA resulted in a 64.00%
overall accuracy. The Landsat 5 TM and the SPOT 5 unsupervised classification had an
overall accuracy of 65.00% and 68.67% respectively. By comparing the three
classification accuracies, the hyperspectral classification with CPCA slightly
outperformed the SPCA and Landsat 5 TM multispectral classification, however, SPOT 5
produced the best classification for this study. A complete table of accuracy statistics is
presented in Table 4-1.
The overall accuracy suggested by Foody and Mathur (2006) is greater than 80%
as a threshold to superior classification. However, an overall accuracy threshold was not
the significance of this research for comparative analysis between each sensor for
indicating vegetation. Tsai et al. (2007) found in their study that CPCA produced an
overall accuracy of 66%. Accuracy assessments were used to determine which sensor
generated the best classification results by incorporating the same random sample points
across the images in comparison with the aerial orthorectified image as a ground
reference, and included the NDVI and mean texture. In other words, the classification of
the land cover and land use classes with the same coordinates of accuracy were verified
by visually interpreting the land cover and land use in the aerial orthorectified image. The
different dates of the satellite imagery and the aerial orthorectified image were taken into
consideration.

39
Table 4-1: Confusion matrices of classification results from each sensor Reference Data
Conventional Hyperion
Tree Canopy
Open Green
Water Body
B. Ground
Urban Areas
Totals UA
Tree Canopy 46 15 0 1 19 81 0.57
Open Green 15 24 0 0 16 55 0.44
Classification Water Body 1 1 18 0 0 20 0.9 data B. Ground 0 0 0 2 3 5 0.4
Urban Areas 16 13 0 4 106 139 0.76
Totals 78 53 18 7 144 300
PA 0.59 0.45 1 0.29 0.74 Overall accuracy = 0.65 Kappa = 0.48
Reference Data
Segmented Hyperion
Tree Canopy
Open Green
Water Body
B. Ground
Urban Areas
Totals UA
Tree Canopy 48 16 0 0 16 80 0.6
Open Green 12 24 0 1 19 56 0.43
Classification Water Body 1 1 18 0 0 20 0.9 data B. Ground 4 3 0 2 9 18 0.11
Urban Areas 13 9 0 4 100 126 0.79
Totals 78 53 18 7 144 300
PA 0.62 0.45 1 0.29 0.69 Overall accuracy = 0.64 Kappa = 0.48
Reference Data
Landsat 5 TM
Tree Canopy
Open Green
Water Body
B. Ground
Urban Areas
Totals UA
Tree Canopy 44 13 0 0 16 73 0.6
Open Green 13 20 0 0 6 39 0.51
Classification Water Body 0 0 18 0 0 18 1 data B.Ground 0 2 0 2 11 15 0.13
Urban Areas 21 18 0 5 111 155 0.72
Totals 78 53 18 7 144 300
PA 0.56 0.38 1 0.29 0.77 Overall accuracy = 0.65 Kappa = 0.48
Reference Data
SPOT 5 Tree Canopy
Open Green
Water Body
B. Ground
Urban Areas
Totals UA
Tree Canopy 58 15 0 0 25 98 0.59
Open Green 8 26 0 0 12 46 0.57
Classification Water Body 1 0 18 0 0 19 0.95 data B.Ground 0 4 0 2 5 11 0.18
Urban Areas 11 8 0 5 102 126 0.81
Totals 78 53 18 7 144 300
PA 0.74 0.49 1 0.29 0.71 Overall accuracy = 0.68 Kappa = 0.54

40
Results show that among the three sensors, tree canopy was highly misclassified
as urban areas. The segmented Hyperion additionally misclassified tree canopy for open
green. These results may be produced from neighbourhoods that are mostly made up of
urban surfaces and contain tree cover, the spectral reflectance’s may be mixed when
wavelengths penetrate through the tree crown and hit the surface of a road or house that
reflects back for that particular area. This can also be explained for the classification of
open green which was mixed with urban areas and mostly tree canopy. In addition,
urban areas were predominantly mixed with tree canopy and with segmented Hyperion;
urban areas were mixed with open green areas. Barren ground is mostly misclassified as
urban areas; this could be from buildings containing white roof tops which have similar
reflectance to bare soils. Water bodies were correctly classified, with one or two mixed
pixels for tree canopy and open areas possibly due to high moisture content in the peak
summer months for Hyperion.
The SPCA (four PCs in the VNIR, two in the SW1, and one in the SW2)
maintained the best results compared to CPCA. Figure 4-1 displays the two classified
images for SPCA and CPCA as well as the multispectral sensors. Moreover, there were
more pixels classified as urban areas instead of water bodies and a greater number of
tree canopy pixels classified as urban areas with the SPCA methodology. This could be
explained by the shadows having similar reflectance characteristics as water in the
downtown. By examining CPCA, the highest amount of pixels misclassified were urban
areas mixed with tree canopy. Older residential areas (urban areas), as previously
mentioned, being misinterpreted as residential tree cover may cause these two classes to
be mixed.

41
Figure 4-1: Aggregated results for conventional Hyperion (a) segmented Hyperion (b) Landsat 5 TM (c) and SPOT 5 (d).

42
4.1.1 Aggregated Results and Discussion
Further experiments should be conducted to assess the accuracy with greater PCA
segments for each range of the EMS. Tsai et al. (2007) suggest that the greater number of
SPCAs does not increase accuracy, instead, greater segments in each portion of the
spectrum increase accuracy. In this study, the reason for low accuracy may be caused by
the atmospheric affects not being properly corrected. As shown in Figure 3-2 (e), the fifth
PC is a result of conventional Hyperion’s data spectral ‘smile’ effect which does not
represent reflectance anomalies of features (Datt et al., 2003). Tsai et al. (2007) argue that
data in the short wave range with longer wavelengths may be noisy and cause poor data
results. Taking this into account, the noisy PC bands were eliminated for classification
when performing the spectrally SPCA to generate higher overall accuracy; however, in
this study, this method resulted in a moderate overall accuracy amongst the three
satellites. A table of accuracy results organized by classes for each sensor is shown in
Table 4-2.
Although literature suggests that SPCA should produce greater accuracy results
over CPCA (Bell and Baranoskie, 2004; Tsai et al., 2007), this study found the opposite.
It was found that SPCA did not have the expected results for classification as a whole,
however, it is essential to note that conventional Hyperion and segmented Hyperion
methods did outperform the Landsat 5 TM sensor for vegetation differences (for tree
canopy and open green spaces). The resulting higher accuracy obtained using Hyperion
data proves that spectral analysis is a significant component for applying classification to
an urban setting (between 5-6% better). Although SPOT 5 mostly outperformed the other
two sensors, this can be explained by the difference in spatial resolution, as SPOT 5

43
image pixels have higher spatial resolution. By examining urban areas, Hyperion did
outperform SPOT 5 for barren ground with a user’s accuracy of 40% and a Kappa of
0.39 and also produced a greater Kappa of 0.46 for tree canopy.
Table 4-2: Accuracy results for comparison organized by classes and the highest values (highlighted boxes indicate the highest values).
Image classification is a successful method used to define land cover in complex
landscapes (Govender et al., 2008; Peijun et al., 2010; Yang and Everitt, 2010). The
aggregated classification results for Landsat and SPOT were derived using NDVI, PCA
2, and mean texture (See Figures 3-5, 3-6, and 3-7). Hyperion aggregated classes were
also derived from these parameters with exception that the original five principal
components were used to perform classification as a form of data compression for
assessing CPCA and selected principal components for SPCA.
Class Producer's User's Kappa
Sensor Accuracy Accuracy Statistic Tree Canopy Hyperion 58.97% 56.79% 0.42 Segmented 61.54% 60.00% 0.46 LS5TM 56.41% 60.27% 0.46 SPOT5 74.36% 59.18% 0.45 Open Green
Hyperion 45.28% 43.64% 0.32 Segmented 45.28% 42.86% 0.31 LS5TM 37.74% 51.28% 0.41 SPOT5 49.06% 56.52% 0.47 Water Body
Hyperion 100.00% 90.00% 0.89 Segmented 100.00% 90.00% 0.89 LS5TM 100.00% 100.00% 1.00 SPOT5 100.00% 94.74% 0.94 B.Ground
Hyperion 28.57% 40.00% 0.39 Segmented 28.57% 11.11% 0.09 LS5TM 28.57% 13.33% 0.11 SPOT5 28.57% 18.18% 0.16 Urban Areas
Hyperion 73.61% 76.26% 0.54 Segmented 69.44% 79.37% 0.60 LS5TM 77.08% 71.61% 0.45 SPOT5 70.83% 80.95% 0.63

44
By applying image enhancement techniques such as the NDVI, principal
components and texture, there is a greater possibility for class separability. Amongst the
three sensors, mean texture clearly defined urban areas along the Harbourfront from
barren groundsurfaces that may have similar spectral reflectance. Although texture did
not effectively differentiate between urban areas and open green, mean texture was
useful for defining tree canopy from water bodies, for example in the Don River Valley.
PCA 2 became useful for effectively outlining open green spaces including fields, parks
and golf courses. The NDVI effectively defined open green spaces from urban areas and
vegetation from water bodies. This enhancement was also useful for greater separability
between vegetation and roads around the Don Valley Parkway. Vegetation is in a lighter
and brighter tone therefore, it has the ability to distinguish between urban surfaces with
higher reflectance from white roofs (which are displayed dark). Full accuracy statistics
are presented in Table 4-1.
In the aggregated images (Figure 4-1), it is visually apparent that some of the land
classes are misclassified in Downtown Toronto (southwest corner of image). Since there
is low reflectance of light caused by building shadow, these pixels are severely mixed
with the water body class (most evidently with the Spot and Hyperion sensors). In the
conventional and segmented Hyperion tree canopy and open green are misrepresented by
water bodies, however, the accuracy results may not include the mixed pixels in the
downtown area possibly because an accuracy point does not fall on these pixels.
Furthermore, on the Don Valley Parkway towards highway 404, urban areas are mixed
with water bodies. Landsat imagery was able to outline the spectral reflectance in the
downtown as urban areas better than the other sensors. Ultimately, the results of the

45
aggregated classes of the Hyperion and Spot sensors embody clear definition of
vegetation/urban green space compared to the Landsat sensor of approximately 6-14 %
greater foliage.
The aerial orthorectified imagery was used to assess how well the classification
system worked for hyperspectral and multispectral data. Peijun et al. (2010) used
Quickbird images as a ground reference in Xuzhou City, China and found that the EO-1
Hyperion hyperspectral image is more efficient than Landsat 5 TM multispectral imagery
for extracting vegetated areas. Thus, by comparing medium spatial resolution data to
finer spatial resolution aerial orthorectified imagery provided by the TRCA, land
classification can be accurately measured (see Figure 3-9 for aerial orthorectified image).
Figure 4-2 shows the resulting class differences between the four images. It is
found that both CPCA and SPCA Hyperion outline vegetation, specifically tree canopies,
greater than Landsat and are almost as detailed as SPOT classification. This is especially
evident for areas around Sunnybrook Park and surrounding the Withrow Park residential
area. It is evident that there are areas of mixed pixels with the Landsat and Hyperion
imagery for the vegetated classes. In addition, in Figure 4-2 a, it is evident that Landsat
detected barren ground and water bodies greater than the other sensors. However, this
does not necessarily represent true land cover and could contain mixed pixels. In Figure
4-2 b, conventional and segmented Hyperion, and SPOT detect water body pixels in the
Don River, where Landsat is unable to determine this area as having water. Figure 4-3
shows the differences between conventional PCA and the three remaining images (SPCA,
Landsat 5 TM, and SPOT 5). These results define the change and no change of all classes

46
(tree canopy, open green, barren ground, water bodies and urban surfaces) between the
hyperspectral and multispectral images.
Further comparative analysis was conducted in ArcGIS by extracting the area of
classes in each image. It was found that conventional Hyperion contained the largest area
of tree canopy with approximately 41 square kilometres compared to segmented
Hyperion (roughly 39 km2), SPOT (roughly 35 km2) and Landsat holding the lowest
amount of tree canopy coverage at around 25 square kilometres. These area measures are
similar to open green coverage and can be seen Table 4-3.
The percentages of each class were calculated in ArcGIS for comparison. It is
interesting that although segmented Hyperion is known to produce better results than
conventional Hyperion (Tsai, et al., 2007), the coverage in Table 4-3 does not show this
for the classes (with exception of barren ground displaying 4% greater coverage). Table
4-3 also shows that the SPOT sensor identified 30% of the image as tree canopy,
compared to Landsat with the lowest percentage of tree canopy (22%). Additionally,
conventional Hyperion (25%) and segmented Hyperion (23%) detected tree canopy cover
greater than Landsat. For open green spaces, Hyperion and SPOT satellites maintained
approximately the same amount between 16-17% coverage while Landsat identified only
11% of open green space. In relation to these figures, Landsat identified 4-12% more
urban coverage than Hyperion and SPOT satellites. These figures therefore confirm that
higher spectral and spatial resolution sensors can outperform sensors with less spectral
resolution and coarser spatial resolution.

47
Table 4-3: Area of aggregated classes
Tree Canopy
Open Green
Water Body
B. Ground
Urban Areas Total
C. Hyperion Pixel Count 45821 30989 10915 2020 96266 186011
Area km2 41.24 27.89 9.82 1.82 86.64 167.41 Percentage 24.63 16.66 5.87 1.09 51.75 100.00 S. Hyperion
Pixel Count 42954 29225 11053 9594 93185 186011 Area km2 38.66 26.30 9.45 8.63 83.87 167.41 Percentage 23.09 15.71 5.94 5.16 50.10 100.00 Landsat 5
Pixel Count 28500 14577 7688 6388 73776 130929 Area km2 25.65 13.12 6.92 5.75 66.40 117.84 Percentage 21.77 11.13 5.87 4.88 56.35 100.00 SPOT 5
Pixel Count 87925 49949 18983 7483 130260 294600 Area km2 35.17 19.98 7.59 2.99 52.10 117.84 Percentage 29.85 16.95 6.44 2.54 44.22 100.00

48
Figure 4-2: Aggregated results for the Don River and Sunnybrook Park area (a) and Evergreen Brickworks area, Rosedale and Withrow Park (b).

49
Figure 4-3: Differences between each sensor from CPCA and all five classes. Results for the Don River and Sunnybrook Park area (a) and Evergreen Brickworks area, Rosedale and Withrow Park (b).

50
CHAPTER 5: Conclusion
Hyperspectral remote sensing technology exhibits the capacity for vegetation
definition. This major research paper presents a comparative analysis between
hyperspectral and multispectral imagery for mapping land cover in the City of Toronto,
Ontario, Canada that surrounds the Lower Don River. This study performed spectrally
SPCA and CPCA on Hyperion imagery in order to compare classification of vegetation
with Landsat 5 TM and SPOT 5 data. In addition, aerial orthorectified imagery as a
ground reference was used for accuracy measure. After comparing the results from
Hyperion, TM and SPOT data, it was found that HSI is slightly more effective than
multispectral imaging with the same spatial resolution for tree canopy and open green
space extraction. Nevertheless, SPOT had the highest overall accuracy among all sensors
in this study. For two of the vegetation classes (tree canopy and open green), it is
significant to note that Hyperion, both conventional and segmented, outperformed
Landsat 5 TM by approximately 5-6% overall accuracy. Nevertheless, SPOT generated
greater accuracy results among Landsat and Hyperion for the vegetated classes.
Ultimately, unsupervised land cover classification with ISODATA was performed
using data from three separate sensors. Moreover, band ratios or spectral indices are
commonly derived from imagery to enhance certain features to differentiate between
various vegetation types mixed in with other land uses (Govender et al., 2007). Particular
data enhancement methods include NDVI to define healthy vegetation and PCA to
determine non vegetated and vegetated areas. These indices and methods are used as a
separability technique to classify vegetation across large land areas. Image classification
is a successful method used to define land cover in complex landscapes (Peijun et al.,

51
2010). This research found that, data analysis of hyperspectral imagery has the potential
for improving classification accuracies of land cover and land use over multispectral
imagery with the same resolution. Classification error occurred mostly in classes such as
bare earth, water bodies and urban areas, with low separability values.
5.1 Limitations
This research was limited by data constraints. Data for the EO-1 Hyperion is
restricted to one date (August 1st, 2007), and limited to a portion of the Lower Don River.
Due to this data constraint of one available image and narrow extent, sub-watershed
change detection could not be analyzed. In addition, because only one Hyperion image
was available, the Landsat and SPOT imagery had to be matched to the temporal
resolution of Hyperion. However, imagery was not available for the specific date. The
closest date to Hyperion and SPOT for Landsat was one year later in 2008. Also, there
are missing data at the mouth of the Don River where the Keating channel is located in
the Hyperion imagery. Moreover, SPOT 5 spatial resolution of 20 metres was not
resampled to match the 30 metre spatial resolution of Hyperion and Landsat which could
have affected accuracy results.
Data compression of hyperspectral imagery was a challenge because PCI
Geomatica and ENVI are unable to process data for classification due to the software’s
threshold of processing no more than sixteen channels at one time. This affects the data
because the purpose is to measure accuracy across a large data set with detailed spectral
bands. Although parameters for output data can be set to 32 bit-real file storage,
hyperspectral data cannot be processed. This is why the literature (Datt et al., 2003;
Small, 2001; Tsai et al., 2007) suggests certain data compression algorithms that allow a

52
large dataset to be condensed, thus redirected the scope of the study. Tsai et al. (2007)
argue that poor results for vegetation classification can be explained by the inconsistency
among vegetation and non-vegetation pixels if PCA is performed on an entire
hyperspectral dataset. To avoid this from occurring, the authors suggest that non-
vegetated pixels be masked out from the PCA process. By masking vegetated areas,
better results could be generated for defining tree species because the PC’s consider the
variance across entire classes and focus on useful data for separating vegetation.
Therefore, discrimination among plant species only, will produce better overall accuracy
instead of comparing what is vegetation and what is not. This is useful for detailed
studies where targeting different plant species is the purpose (Tsai et al., 2007).
The predefined features by the user formulated during classification affect the
user’s ability to identify validation points. This was avoided by using aerial orthorectified
imagery from the same year to determine the classes for each accuracy point. However,
depending on the satellite imagery, this could still be affected. The fixed accuracy points
were used to reduce bias, but there is still bias because each sensor captured the image on
a different date. In addition, interpretative error at initial classification is possible and
could be the reason for classification errors once validation points were developed.
Nevertheless, low accuracy is expected because the three images are compared to an
aerial orthorectified image, which is higher resolution. The aerial orthorectified image
acts as ground truth, the only difficulty is that it is on a later date in the fall than the three
sensors in the summer. If images were acquired the same day and time, then accuracies
would be even more comparable.

53
Since urban green is significant for the quality of urban life, databases and
information are even more important to keep and record in cities. Further work is to
explore other more effective data compression and classification methods to increase
classification accuracy. Although comparing hyperspectral and multispectral data for land
cover classification with various data analyses was beneficial for measuring spectral
separability at medium resolution, further research could be conducted on detailed
analysis of Hyperion spectral bands such as spectral unmixing. By unmixing the pixels in
an image, a more detailed study for mapping health of tree species along the Don River
Valley can be examined.

54
References
Ahem, J. 2007. Green infrastructure for cities: The spatial dimension. In Novotny, V. and Brown, P. (Eds), Cities of the Future: Towards Integrated Sustainable Water and Landscape, IWA Publishing, London, pp: 267-283
Anderson, J.R., Hardy, E.E, Roach, J.T., and Witmer, R.E. 1976. A Land Use and Land
Cover Classification System for Use With Remote Sensor Data. Geological Survey Professional Paper 964. United States Government Printing Office, Washington.
Arnold, C.L., and Gibbons, C.J. 1996. Impervious surface coverage: The emergence of a key urban environmental indicator. Journal of the American Planning Association. Vol. 62, No. 2, pp: 243-258
Banzhaf, E., and Hofer, R. 2008. Monitoring urban structure types as spatial indicators with CIR aerial photographs for a more effective urban environmental management. IEEE Journal of Selected Topics in Applied Earth Observations and Remote Sensing. Vol.1, No. 2, pp: 129-139
Barry, P. Seqal, C., and Carman, S. 2001. EO-1 Hyperion science Data User’s Guide. TRW Space, Defense and Information Systems. Vol. 01, No. 077 pp: 1-65
Bell, I.E., and Baranoskie, G.V.G., 2004. Reducing the dimensionality of plant spectral
database. IEEE Transactions on Geoscience and Remote Sensing. Vol. 42, pp: 570-576
Boggs, G.S. 2010. Assessment of SPOT 5 and Quickbird Remotely Sensed Imagery for
Mapping Tree Cover in Savannas. International Journal of Applied Earth Observation and Geoinformation. Vol. 12, pp. 217-224
Buckingham, R., and Staenz, K. 2008. Review of current and planned civilian space hyperspectral sensors for EO. Canadian Journal of Remote Sensing. Vol. 34, pp: 187-197
Cairns, R. D. 2006. On accounting for sustainable development and accounting for the environment.Resources Policy. Vol. 31, pp: 211-216
Carter, G.A., Lucas, K.L., Blossom, G.A., Lassitter, C.L., Holiday, D.M., Mooneyhan, D.S., Fastring, D.R., Holcombe, T.R., and Griffith, J.A. 2009. Remote sensing and mapping of Tamarisk along the Colorado River, USA: A comparative use of summer-acquired Hyperion, Thematic Mapper and Quickbird data. Remote Sensing. Vol. 1, pp: 318-329

55
Chang, C-I., Jiao, X., Wu, C-C., Du, E.Y., Chen, H-M. 2011. Component analysis-based unsupervised linear spectral mixture analysis for hyperspectral imagery. IEEE Transactions on Geoscience and Remote Sensing. Vol.49, No. 11, pp: 4123-4137
Cheriyadat, A., and Bruce, L.M. 2003. Why Principal Component Analysis Is Not an Appropriate Feature Extraction Method for Hyperspectral Data. Proc. 2003 IEEE Geoscience and Remote Sensing Symposium, pp. 3420-3422
Datt, B., McVicar, T.R., Van Niel, T.G., Jupp, D.L.B., and Pearlman, J.S. 2003.
Preprocessing EO-1 Hyperion hyperspectral data to support the application of agricultural indexes. IEEE Transaction on Geoscience and Remote Sensing, Vol. 41, No.6, pp:1246-1259
Davies, R.G., Barbosa, O., Fuller, R.A., Tratalos, J., Burke, N., Lewis, D., Warren, P.H., and Gaston, K.J. 2008. City-wide relationships between green spaces, urban land use and topography. Urban Ecosystem. Vol. 11, No. 3, pp: 269-287
European Space Agency. 2012. SPOT. Eduspace. Retrieved Aug 9th, 2012, from:
http://www.esa.int/esaMI/Eduspace_EN/SEMIW04Z2OF_0.html Foody, G.M. 2002. Status of land cover accuracy assessment. Remote Sensing of
Environment. Vol. 80, pp: 185-201
Foody, G.M., and Mathur, A. 2006. The use of training sets containing mixed pixels for accurate hard image classification: Training on mixed spectral responses for classification by SVM. Remote Sensing of the Environment. Vol.103., pp:179-189
Forsythe, K.W. 2003. Monitoring “Megacity” Urban Development Pansharpened Landsat 7 Results for Toronto, Ontario, Canada. In: Jürgens, C. (Ed.) The International Archives of the Photogrammetry, Remote Sensing and Spatial Information Sciences (CD-ROM), Vol. XXXIV-7/W9. Proceedings of the 4th International Symposium Remote Sensing of Urban Areas (URS 2003). June 27-29, 2003. Regensburg, GERMANY. pp. 60-65. ISSN 1682-1777
Forsythe, K.W. and Waters N.M. 2006. The Utilization of Image Texture Measures in
Urban Change Detection. Photogrammetrie-Fernerkundung-Geoinformation PFG 4/2006, pp. 287-296
Galvao, L.S, Formaggio, A.R., and Tisot, D.A. 2005. Discrimination of sugarcane varieties in South Eastern Brazil with EO-1 Hyperion data. Remote Sens. Environ. 94 523-534
Giardino, C., Brando, V. E., Dekker, A.G., Strombeck, N., and Candiani, G. 2007.
Assessment of water quality in Lake Garda (Italy) using Hyperion. Remote Sensing of Environment, Vol. 109, pp:183-195

56
Goodenough, G., Dyk, A., Niemann, K.O., Pearlman, J.S., Chen, H., Han, T., et al. 2003.
Processing Hyperion and ALI for forest classification. IEEE Transaction on Geoscience and Remote Sensing. Vol. 41, No. 6, pp:1321-1331
Govender, M., Chetty, K., and Bulcock, H. 2007. A Review of Hyperspectral Remote Sensing and its Application in Vegetation and Water Resource Studies. Water SA Vol. 33, pp: 145-151
Govender, M., Chetty, K., Naiken, V., and Bulcock, H. 2008. A comparison of satellite hyperspectral and muyltispectral remote sensing imagery for improved classification and mapping of vegetation. Water SA. Vol. 34, No. 2, pp: 147-154
Green, A.A., Berman, M., Switzer, P. and Craig, M.D. 1988. A transformation for ordering multispectral data in terms of image quality with implications for noise removal. IEEE Transactions on Geoscience and Remote Sensing. Vol. 26, pp:64-74
Griffin, M.K., Hsu, S.M., Burke, H.K., Orloff, S.M., and Upham, C.A. 2005. Examples
of EO-1 Hyperion Data Analysis. Lincoln Laboratory Journal. Vol. 15, No. 2, pp. 271-297
Heiden, U., Heldens, W., Roessner, S., Segl, K., Esch, T., and Mueller, A. 2012. Urban structure type characterization using hyperspectral remote sensing and height information. Landscape and Urban Planning. Vol. 105, pp: 361-375
Jarecke, P., Barry, P., and Pearlman, J. 2001. Aggregation of Hyperion hyperspectral
spectral bands into Landsat-&ETM+ spectral bands. IEEE, pp: 2822-2824
Jarecke, J., and Yokoyama, K. 2000. Radiometric Calibration of the Hyperion Imaging Spectrometer Instrument from Primary Standards to End-to-End Calibration. Proc. of SPIE. Vol. 4135, pp: 254-263
Jensen, J.R. 2007. Introductory to Digital Image Processing: A Remote Sensing Perspective. Prentice Hall Series in Geographic Information Science.
Jung, A., Kardevan, P., and Tokei, L. 2005. Detection of urban effect on vegetation in a less built-up Hungarian city by hyperspectral remote sensing. Physics and Chemistry of the Earth. Vol. 30, pp: 255-259
Kaarna, A., Toivanen, P., and Keranen, P. 2006. Compression and classification methods for hyperspectral images. Pattern Recognition Policy. Vol. 31, pp: 211-216
Khurshid, K.S., Staenz, K., Sun, L., Neville, R., White, H.P., and Bannari, A. 2006. Preprocessing of EO-1 Hyperion data. Canadian Journal of Remote Sensing. Vol. 32, pp: 145-163

57
Koch, M., Inzana, J., and El Baz, F. 2005. Applications of Hyperion hyperspectral and
aster multispectral data in characterizing vegetation for water resource studies in arid lands. Geol. Remote Sensing. Salt Lake City Annual Meeting. Paper No. 44-5
Kruse, F.A., Boardman, J. W., and Huntington, J.F. 2003. Comparison of airborne hypersectral data and EO-1 Hyperion for mineral mapping. IEEE Transaction on Geoscience and Remote Sensing. Vol. 41, No. 6, pp: 1388-1400
Liew, S. C., Change, C. W., and Lim, K.H. 2002. Hyperspectral Land Cover
Classification of EO-1 Hyperion Data by Principal Component Analysis And Pixel Unmixing. Centre for Remote Sensing, Imaging and Processing, National University of Sinagpore, pp. 3111-3113
Lu, D.S., and Weng, Q.H. 2006. Use of impervious surface in urban land-use classification. Remote Sensing of Environment. Vol. 102, pp:146-160
Myint, S.W., Gober, P., Braxel, A., Grossman-Clarke, S., and Weng, Qihao. 2011. Per-
pixel vs. object-based classification of urban land cover extraction using high spatial imagery. Remote Sensing of the Environment. Vol.115, pp: 1145-1161
Paquot, T. 2005. City and nature, a missed opportunity? Diogens, Sage Publications. Vol.
52, No. 3, pp: 65-74 PCI Inc. 2010. PCI Help Menu. Richmond Hill, Ontario, Canada. Peijun, D., Junshi, X., Wen, C., and Xiaoling, W. 2010. Extraction of urban impervious
surface from hyperspectral remote sensing image. IEEE. Pp: 1-5
Petropoulos, G.P., Arvanitis, K., and Sigrimis, N. 2012. Hyperion hyperspectral imagery analysis combined with machine learning classifiers for land use/cover mapping. Expert Systems with Applications. Vol. 39, pp: 3800-3809
Petrou, M., and Foschi, P.G. 1999. Confidence in linear spectral unmixing of single pixels. IEEE Transactions of Geoscience and Remote Sensing. Vol. 37, No. 1, pp: 624-326
Pignatti, S., Cavalli, R.M., Cuomo, V., Fusilli, L., Pascucci, S., Poscolieri, M., and Santini, F. 2009. Evaluating Hyperion Capability for Land Cover Mapping in a Fragmented Ecosystem: Pollino National Park, Italy. Remote Sensing of Environment. Vol. 113, pp. 622-634
Pu, R., Gong, P., and Yu, Q. 2008. Comparative analysis of EO-1 ALI and Hyperion, and Landsat ETM+ data for mapping forest crown closure and leaf area index. Sensors. Vol. 8, pp: 3744-3766

58
Pu, R., and Gong, P., 2004. Wavelet transform applied to EO-1 hyperspectral data for forest LAI and crown closure mapping. Remote Sensing of Environment. Vol. 91, No.2, pp: 212-224
Purkis, S.J., and Klemas, V.V. 2011. Remote Sensing and Global Environmental Change. Wiley-Blackwell ltd., pp. 1-367
Ridd, M.K., 1995. Exploring a V-I-S (vegetation-impervious surface-soil) model for urban ecosystem analysis through remote sensing: comparative anatomy for cities. International Journal of Remote Sensing. Vol. 16, No. 12, pp: 2165-2185
Sanchez-Hernandez, C., Boyd, D.S, and Foody, G.M. 2007. One-class classification for mapping a specific land-cover class: SVDD classification of Fenland. IEEE Transactions on Geoscience and Remote Sensing. Vol. 45, No. 4, pp: 1061-1073
Small, C. 2001. Estimateion of urban vegetation abundance by spectral mixture analysis. International Journal of Remote Sensing. Vol. 22, pp: 1305-1334
Settle, J.J., and Drake, N.A. 1993. Linear mixing and estimation of ground cover proportions. International Journal of Remote Sensing. Vol. 14, No. 6, pp: 1159-1177
Shaban, M.A., and Dikshit, O.O. 2001. Improvement of classification in urban areas by the use of textural features: the case study of Lucknow City, Uttar Pradesh. International journal of remote sensing. Vol. 22. No. 4., pp. 565-593
Smith, J.H., Stehman, S.V., Wickham, J.D., and Yang, L. 2003. Effects of landscape characteristics on land-cover class accuracy. Remote Sensing of Environment. Vol. 84, pp:342-349
Souza, A.A., Galvao, L.S., and Santos, J.R. 2010. Relationships between Hyperion-
derived vegetation indices, biophysical parameters, and elevation data in a Brazilian savannah environment. Journal of Remote Sensing. Vol. 1, No. 1, pp. 55-64
Thenkabail, S.P., Enclona, E.A., Ashton, M., and Van Der Meer, B. 2004. Accuracy assessments of hyperspectral waveband performance for vegetation analysis applications. Remote Sensing of Environment. Vol. 91, No. 3-4, ppL 354-376
Toronto and Region Conservation Authority (TRCA). 2012. Retrieved on April 22, 2012. From http://www.trca.on.ca/the-living-city/watersheds/don-river/

59
Tsai, F., Lin, E-K., and Yoshino, K. 2007. Spectrally segmented principal component analysis of hyperspectral imagery for mapping invasive plant species. International Journal of Remote Sensing. Vol. 28, No. 5, pp: 1023-1039
USGS. 2011. Earth Observing-1 (EO-1). US Geological Survey. Retrieved: Aug, 10th,
2012. From: http://eo1.usgs.gov/ Van der Linden, S., and Hostert, P. 2009. The influence of urban structures on
impervious surface maps from airborne hyperspectral data. Remote Sensing of Environment. Vol. 11, No. 113, pp: 2298-2305
Van de Voorde, T., Vlaeminck, J., and Canters, F. 2008. Comparing different approaches for mapping urban vegetation cover from Landsat ETM + data: A case study on Brussels. Sensors. Vol. 8, pp: 3880-3902
Walsh, S.J., McCleary, A.L., Mena, C.F., Shao, Y., Tuttle, J.P., Gonzalex, A. et al. 2008. Quickbird and Hyperion data analysis of an invasive plant species in the Galapagos Islands of Ecuador: Implications for control and land use management. Remote Sensing of Environment. Vol. 112, No. 5, pp: 1927-1941
Weng, Q., Hu, X., and Lu, D. 2008. Extracting impervious surfaces from medium spatial resolution multispectral and hyperspectral imagery: A comparison. International Journal of Remote Sensing. Vol. 29, No. 11, 3209-3232
Wijanarto, A., and Amhar, F. 2010. Tropical biodiversity mapping from hyperion image Bogor Indonesia. Technical Commission VII Symposium 2010.
Yang, X. 2007. Integrating remote sensing, GIS and spatial modelling for sustainable urban growth management. In Mesev, V. Mastering GIS: Technology, Applications and Management: Integration of GIS and Remote Sensing (pp:1-291). West Sussex, England: John Wiley & Sons Ltd.
Yang, C., Everitt, J.H., and Murden, D. 2010. Comparison of hyperspectral imagery with aerial photography and multispectral imagery for mapping broom snakeweed. International Journal of Remote Sensing. Vol. 31, No. 20, pp. 5423-5438
Yang, C., Everitt, J.H., and Murden, D. 2011. Evaluating High Resolution SPOT 5 Satellite Imagery for Crop Identification. Computers and Electronics in Agriculture. Vol. 75, pp. 347-354
Yuan, J., Niu, Z. 2007. Classification Using EO-1 Hyperion Hyperspectral and ETM+
Data. IEEE Computer Society. From the Fourth International Conference on Fuzzy Systems and Knowledge Discovery.

60
Zhou, X., and Rana, M. P. 2012. Social benefits of urban green space: A conceptual framework of valuation and accessibility measurements. International Journal of Management of Environmental Quality. Vol.23, No. 2, pp: 173-189