
Comparing Oklahoma City Home Health Care to Tulsa Options (SlideShare)
DATA BRIEF OCTOBER 2019
Comparing Health Insurance Reform Options: From “Building on the ACA” to Single Payer
Linda J. Blumberg, John Holahan, Matthew Buettgens, Anuj Gangopadhyaya, Bowen Garrett, Adele Shartzer, Michael Simpson, Robin Wang, Melissa M. Favreault, and Diane Arnos
The Affordable Care Act (ACA) has substantially reduced the number of uninsured Americans, increased access to care, reduced uncompensated care for hospitals and other providers, and largely eliminated discrimination against the sick in private health insurance markets. Still, significant problems remain: 30 million people in the United States remain uninsured, while many others are underinsured — meaning they lack adequate financial protection against high health care costs.
While many people have experienced lower costs after getting coverage through the ACA, others have found that premiums and cost-sharing requirements are still too high to participate. Following a Supreme Court decision that made Medicaid expansion optional for states, many poor adults in the 17 states that have yet to expand the program have been left without any financial assistance for coverage. Additional policy changes made by the Trump administration and Congress since early 2017 have created new problems and exacerbated others.
During the 2020 presidential election season, plans for addressing these and other shortcomings will be central to candidates’ campaigns and a focus of presidential debates. A uniform framework that compares coverage and cost implications of different proposals will help policymakers and citizens make more objective, thoughtful comparisons of the advantages and disadvantages of different policy options.
In this report, we analyze eight health care reform packages intended to address shortcomings of the current health insurance system. We estimate their potential effects on health insurance coverage and spending by government, households, and employers. The packages represent an amalgam of ideas developed by policymakers, presidential candidates, and policy experts. Some would make fundamental changes to the structure of the U.S. health insurance system, while others would build on the existing system. Because new bills are regularly introduced and details of existing bills are likely to change, our work focuses on reform approaches rather than particular pieces of legislation.

commonwealthfund.org Data Brief, October 2019
Comparing Health Insurance Reform Options: From “Building on the ACA” to Single Payer 2
The reforms we feature run along a continuum from less to more comprehensive in their coverage and impact on government costs. They range from a set of incremental improvements to the ACA to a single-payer plan similar to some “Medicare for All” proposals. For a brief summary of our methods, see “How We Conducted This Study” below. For those seeking additional background on our methods as well as additional findings and discussion, see the full version of this report here.
The first six reform packages build on one another; the last two are alternative approaches to a single-payer health system.
Reforms that build on the ACA:
1. ACA Enhanced I: Improves the ACA’s current premium and cost-sharing subsidies and adds a reinsurance program for the individual market to protect insurers against very high claims.
2. ACA Enhanced II: In addition to the above reforms, this package includes restoration of the ACA’s individual mandate penalty and reversal of the Trump administration’s expansion of short-term, limited-duration plans.
3. ACA Enhanced III: This package builds on Reform 2 by closing the Medicaid eligibility gap for adults with very low incomes in states that have not expanded their Medicaid program. It also introduces a limited autoenrollment mechanism for most people receiving benefits from the Temporary Assistance for Needy Families (TANF) or Supplemental Nutrition Assistance Program (SNAP) programs.
4. ACA Enhanced IV: Adds to the reforms in #3 a public plan option and/or a capping of the provider payment rates in private nongroup insurance plans.
5. Universal Coverage I: The first reform plan to achieve universal coverage, this builds on #4 by enabling workers to opt for subsidized nongroup coverage instead of their employer’s insurance plan and introducing a mechanism through which all legal U.S. residents are deemed insured. This reform features a public option in the nongroup market.
6. Universal Coverage II: Adds to #5 by boosting premium and cost-sharing subsidies further.
Single-payer plans:
7. Single Payer “Lite”: A single-payer plan that covers all people legally residing in the U.S. and includes all the ACA’s “essential health benefits.”1 There is cost-sharing for individuals pegged to income (consistent with those in reforms 1–5) but no premiums. There is no private insurance option.
8. Single Payer Enhanced: This plan covers all U.S. residents, including undocumented immigrants, and features a broader set of benefits than Single Payer “Lite,” including adult dental, vision, and hearing care as a well as a home- and community-based long-term services and supports benefit. In addition, there are no cost-sharing requirements. There is no private insurance option.

commonwealthfund.org Data Brief, October 2019
Comparing Health Insurance Reform Options: From “Building on the ACA” to Single Payer 3
HIGHLIGHTS IN BRIEF
• Each reform option improves the affordability of health insurance considerably through lower premiums and cost-sharing and broader public program eligibility. Reductions in consumer costs are greatest in the single-payer plans. But as affordability increases, the taxes necessary to finance the reforms would increase as well.
• Reaching true universal coverage requires either an autoenrollment mechanism for those not voluntarily enrolling in insurance or a single-payer system that enrolls the entire population in a single plan.
• Employer coverage falls as the generosity of assistance in the individual market increases. The single-payer options eliminate employer coverage (and other private insurance) altogether.
• In general, federal spending increases as subsidized coverage becomes more generous and more people enroll. However, the individual mandate, reinsurance, and cost-containment strategies like the introduction of a public plan option, can also lower the federal funds necessary to finance reform.
• If the employer insurance system remains largely intact, universal or near-universal coverage can be achieved with reasonably moderate increases in federal spending.
• Under our Single Payer “Lite” reform (#7), total national spending on health care falls relative to current law. But under the more expansive Single Payer Enhanced reform (#8), national health spending increases, because the costs of additional coverage, greater benefits (more services and no household cost-sharing), and coverage of 11 million undocumented immigrants exceed the savings from lower provider payment rates and administrative costs.
THE REFORMS: PROJECTED IMPACTS
Below we present our estimated changes in health insurance coverage, federal government spending, and total national health spending (combined costs to employers, households, government, and uncompensated care delivered by health care providers) under each reform option, compared to current law. In addition, we show the increase in federal revenues needed to finance each reform after netting out any additional income tax revenues that result from reductions in employer-based insurance and corresponding wage increases.2 For ease of comparison, all estimates are based on reforms as if they are fully phased in and in equilibrium in 2020 — meaning that the number of providers has grown to meet the new demand for services and that households and employers have completely adjusted their coverage decisions in response to policy changes.
The components of all of the reforms simulated are summarized in the table on page 14. In addition, descriptions accompany the analytic findings for each reform package.
commonwealthfund.org Data Brief, October 2019
Comparing Health Insurance Reform Options: From “Building on the ACA” to Single Payer 4
Source: Linda J. Blumberg et al., Comparing Health Insurance Reform Options: From “Building on the ACA” to Single Payer(Commonwealth Fund and Urban Institute, Oct. 2019).
Coverage and Changes in Spending Compared to Current Law, 2020
32.2
28.2
2.4
1.9
0
5
10
15
20
25
30
35
40
Current law Reform 1
Number without minimum essential coverage
Reform 1
* Increase in federal revenue needed to finance reform, net of additional income tax receipts resulting from reduced employer spending on health insurance passed back to workers as wage increases.
Data: Urban Institute analysis.
$25.7 $25.6
$7.8$0
$10
$20
$30
$40
$50
$60
$70
$80
$90
$100
Increase infederal
spending
Additionalfederal revenue
needed*
Change innational health
spending
Billions of dollarsMillions of people
34.6
30.0
Short-term, limited-duration plans
Uninsured
* Increase in federal revenue needed to finance reform, net of additional income tax receipts resulting from reduced employer spending on health insurance passed back to workers as wage increases.
Data: Urban Institute analysis.
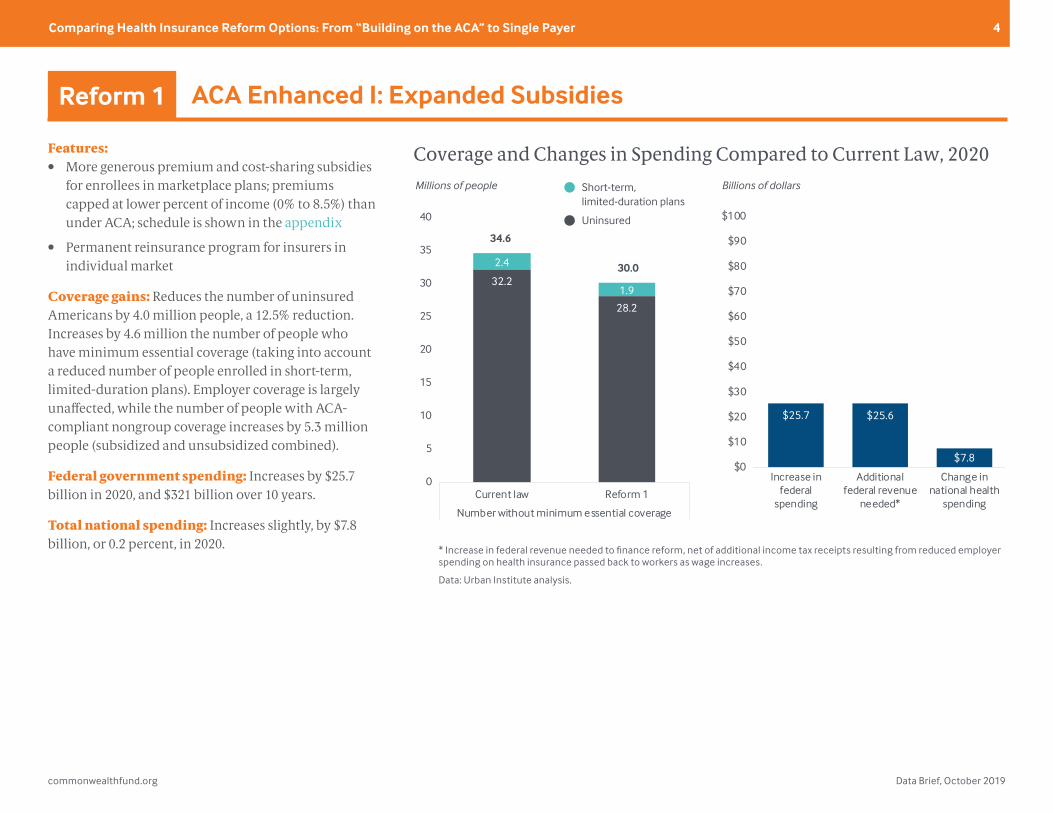
Features:• More generous premium and cost-sharing subsidies
for enrollees in marketplace plans; premiums capped at lower percent of income (0% to 8.5%) than under ACA; schedule is shown in the appendix
• Permanent reinsurance program for insurers in individual market
Coverage gains: Reduces the number of uninsured Americans by 4.0 million people, a 12.5% reduction. Increases by 4.6 million the number of people who have minimum essential coverage (taking into account a reduced number of people enrolled in short-term, limited-duration plans). Employer coverage is largely unaffected, while the number of people with ACA-compliant nongroup coverage increases by 5.3 million people (subsidized and unsubsidized combined).
Federal government spending: Increases by $25.7 billion in 2020, and $321 billion over 10 years.
Total national spending: Increases slightly, by $7.8 billion, or 0.2 percent, in 2020.
ACA Enhanced I: Expanded SubsidiesReform 1

commonwealthfund.org Data Brief, October 2019
Comparing Health Insurance Reform Options: From “Building on the ACA” to Single Payer 5
Features:• More generous premium and cost-sharing subsidies
for enrollees in marketplace plans; premiums capped at lower percent of income (0% to 8.5%) than under ACA; schedule is shown in the appendix
• Permanent reinsurance program for insurers in individual market
• Restored individual mandate
• Prohibition on short-term, limited-duration plans
Additions to Reform 1: Restores nationwide individual mandate. Reverses Trump administration’s expansion of short-term, limited-duration plans that don’t have to comply with ACA rules.
Coverage gains: Expands number of people who have coverage that meets the ACA’s minimum standards by 6.3 million, an additional 1.7 million people compared to Reform 1. The number of uninsured falls by just under 4 million people. The effect of the mandate on the number of uninsured is reduced somewhat, because some of the people losing their short-term plans would not enroll in other coverage. Of the 2.4 million people with short-term plans under current law, 1.2 million get marketplace coverage (including those attracted by the additional subsidies provided in Reform 1), around 500,000 gain employer-sponsored coverage, and about 700,000 become uninsured.
Federal government spending: Federal costs increase slightly less under Reform 2 than under Reform 1: $24.5 billion in 2020, and $307 billion over 10 years. This happens because as the risk pool in the marketplaces improves because of reinstatement of the individual mandate, premiums decrease; with lower premiums, federal subsidy costs decrease.
Total national spending: As with Reform 1, national health spending increases very little.
ACA Enhanced II: Restored MandateReform 2
Source: Linda J. Blumberg et al., Comparing Health Insurance Reform Options: From “Building on the ACA” to Single Payer(Commonwealth Fund and Urban Institute, Oct. 2019).
Coverage and Changes in Spending Compared to Current Law, 2020
32.2
28.3
2.4
0
5
10
15
20
25
30
35
40
Current law Reform 2
Number without minimum essential coverage
Reform 2
* Increase in federal revenue needed to finance reform, net of additional income tax receipts resulting from reduced employer spending on health insurance passed back to workers as wage increases.
Data: Urban Institute analysis.
$24.5 $24.3
$7.0$0
$10
$20
$30
$40
$50
$60
$70
$80
$90
$100
Increase infederal
spending
Additionalfederal revenue
needed*
Change innational health
spending
Billions of dollarsMillions of people
34.6
28.3
Short-term, limited-duration plans
Uninsured
* Increase in federal revenue needed to finance reform, net of additional income tax receipts resulting from reduced employer spending on health insurance passed back to workers as wage increases.
Data: Urban Institute analysis.
commonwealthfund.org Data Brief, October 2019
Comparing Health Insurance Reform Options: From “Building on the ACA” to Single Payer 6
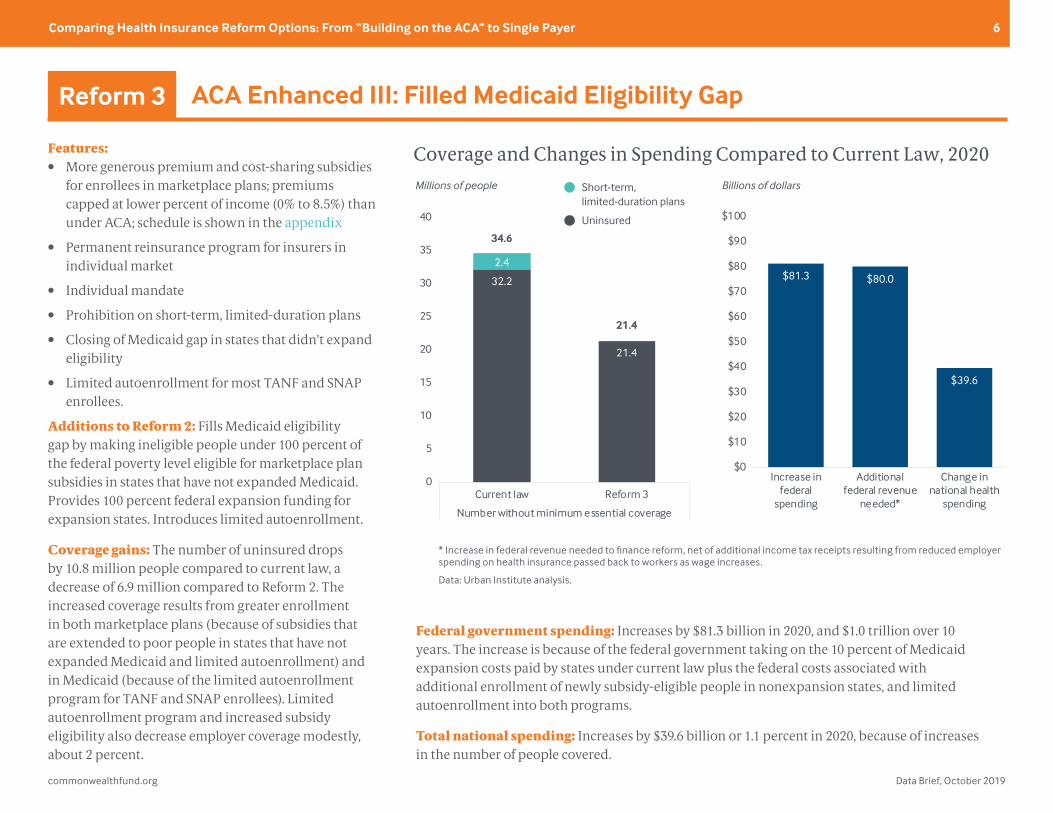
Features:• More generous premium and cost-sharing subsidies
for enrollees in marketplace plans; premiums capped at lower percent of income (0% to 8.5%) than under ACA; schedule is shown in the appendix
• Permanent reinsurance program for insurers in individual market
• Individual mandate
• Prohibition on short-term, limited-duration plans
• Closing of Medicaid gap in states that didn’t expand eligibility
• Limited autoenrollment for most TANF and SNAP enrollees.
Additions to Reform 2: Fills Medicaid eligibility gap by making ineligible people under 100 percent of the federal poverty level eligible for marketplace plan subsidies in states that have not expanded Medicaid. Provides 100 percent federal expansion funding for expansion states. Introduces limited autoenrollment.
Coverage gains: The number of uninsured drops by 10.8 million people compared to current law, a decrease of 6.9 million compared to Reform 2. The increased coverage results from greater enrollment in both marketplace plans (because of subsidies that are extended to poor people in states that have not expanded Medicaid and limited autoenrollment) and in Medicaid (because of the limited autoenrollment program for TANF and SNAP enrollees). Limited autoenrollment program and increased subsidy eligibility also decrease employer coverage modestly, about 2 percent.
Federal government spending: Increases by $81.3 billion in 2020, and $1.0 trillion over 10 years. The increase is because of the federal government taking on the 10 percent of Medicaid expansion costs paid by states under current law plus the federal costs associated with additional enrollment of newly subsidy-eligible people in nonexpansion states, and limited autoenrollment into both programs.
Total national spending: Increases by $39.6 billion or 1.1 percent in 2020, because of increases in the number of people covered.
ACA Enhanced III: Filled Medicaid Eligibility GapReform 3
Source: Linda J. Blumberg et al., Comparing Health Insurance Reform Options: From “Building on the ACA” to Single Payer(Commonwealth Fund and Urban Institute, Oct. 2019).
Coverage and Changes in Spending Compared to Current Law, 2020
32.2
21.4
2.4
0
5
10
15
20
25
30
35
40
Current law Reform 3
Number without minimum essential coverage
Reform 3
* Increase in federal revenue needed to finance reform, net of additional income tax receipts resulting from reduced employer spending on health insurance passed back to workers as wage increases.
Data: Urban Institute analysis.
$81.3 $80.0
$39.6
$0
$10
$20
$30
$40
$50
$60
$70
$80
$90
$100
Increase infederal
spending
Additionalfederal revenue
needed*
Change innational health
spending
Billions of dollarsMillions of people
34.6
21.4
Short-term, limited-duration plans
Uninsured
* Increase in federal revenue needed to finance reform, net of additional income tax receipts resulting from reduced employer spending on health insurance passed back to workers as wage increases.
Data: Urban Institute analysis.
commonwealthfund.org Data Brief, October 2019
Comparing Health Insurance Reform Options: From “Building on the ACA” to Single Payer 7
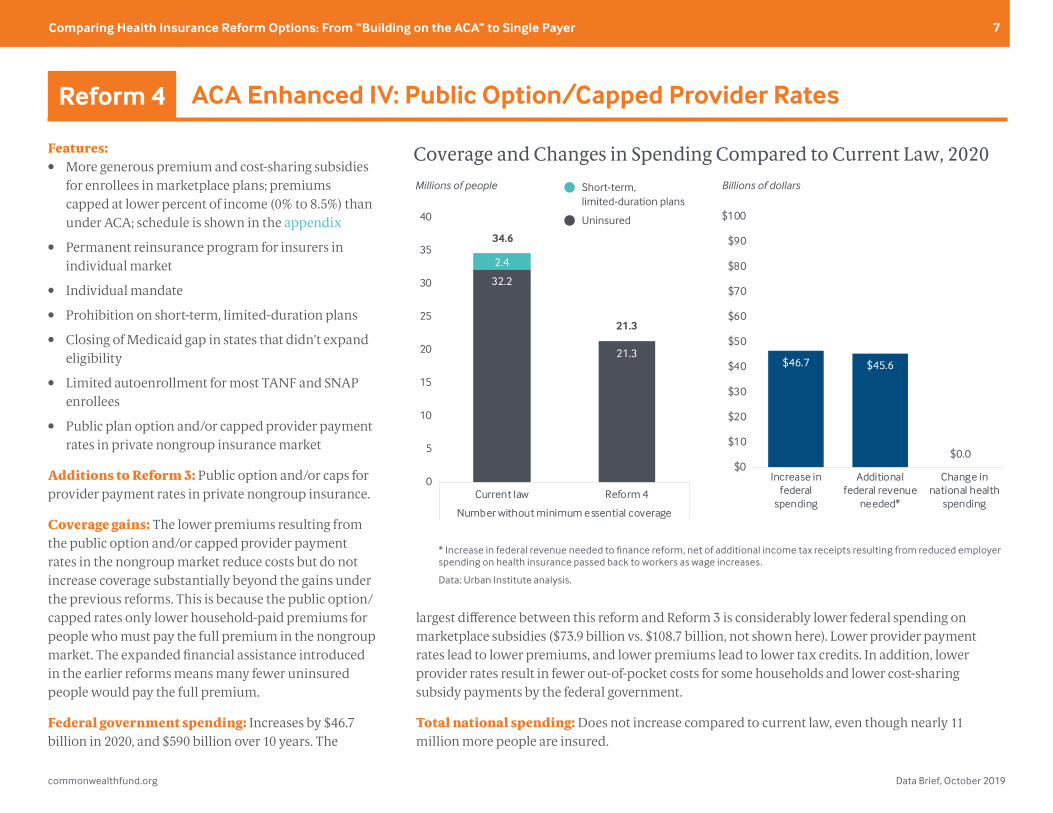
Features:• More generous premium and cost-sharing subsidies
for enrollees in marketplace plans; premiums capped at lower percent of income (0% to 8.5%) than under ACA; schedule is shown in the appendix
• Permanent reinsurance program for insurers in individual market
• Individual mandate
• Prohibition on short-term, limited-duration plans
• Closing of Medicaid gap in states that didn’t expand eligibility
• Limited autoenrollment for most TANF and SNAP enrollees
• Public plan option and/or capped provider payment rates in private nongroup insurance market
Additions to Reform 3: Public option and/or caps for provider payment rates in private nongroup insurance.
Coverage gains: The lower premiums resulting from the public option and/or capped provider payment rates in the nongroup market reduce costs but do not increase coverage substantially beyond the gains under the previous reforms. This is because the public option/capped rates only lower household-paid premiums for people who must pay the full premium in the nongroup market. The expanded financial assistance introduced in the earlier reforms means many fewer uninsured people would pay the full premium.
Federal government spending: Increases by $46.7 billion in 2020, and $590 billion over 10 years. The
largest difference between this reform and Reform 3 is considerably lower federal spending on marketplace subsidies ($73.9 billion vs. $108.7 billion, not shown here). Lower provider payment rates lead to lower premiums, and lower premiums lead to lower tax credits. In addition, lower provider rates result in fewer out-of-pocket costs for some households and lower cost-sharing subsidy payments by the federal government.
Total national spending: Does not increase compared to current law, even though nearly 11 million more people are insured.
ACA Enhanced IV: Public Option/Capped Provider RatesReform 4
Source: Linda J. Blumberg et al., Comparing Health Insurance Reform Options: From “Building on the ACA” to Single Payer(Commonwealth Fund and Urban Institute, Oct. 2019).
Coverage and Changes in Spending Compared to Current Law, 2020
32.2
21.3
2.4
0
5
10
15
20
25
30
35
40
Current law Reform 4
Number without minimum essential coverage
Reform 4
* Increase in federal revenue needed to finance reform, net of additional income tax receipts resulting from reduced employer spending on health insurance passed back to workers as wage increases.
Data: Urban Institute analysis.
$46.7 $45.6
$0.0$0
$10
$20
$30
$40
$50
$60
$70
$80
$90
$100
Increase infederal
spending
Additionalfederal revenue
needed*
Change innational health
spending
Billions of dollarsMillions of people
34.6
21.3
$0.0
Short-term, limited-duration plans
Uninsured
* Increase in federal revenue needed to finance reform, net of additional income tax receipts resulting from reduced employer spending on health insurance passed back to workers as wage increases.
Data: Urban Institute analysis.
commonwealthfund.org Data Brief, October 2019
Comparing Health Insurance Reform Options: From “Building on the ACA” to Single Payer 8
Features:• More generous premium and cost-sharing subsidies for
enrollees in marketplace plans; premiums capped at lower percent of income (0% to 8.5%) than under ACA; schedule is shown in the appendix
• Permanent reinsurance program for insurers in individual market
• Prohibition on short-term, limited-duration plans• Closing of Medicaid gap in states that didn’t expand
eligibility• Limited autoenrollment for most TANF and SNAP
enrollees• Nongroup public option, possibly combined with
capped provider payment rates for other nongroup insurers
• Elimination of employer insurance “firewall”: workers can opt for subsidized nongroup plan instead of their employer’s plan
• Continuous autoenrollment with retroactive enforcement3
Additions to Reform 4: Mechanism for deeming all legal U.S. residents insured and removal of employer-sponsored insurance offer firewall. Requires public option in nongroup market.
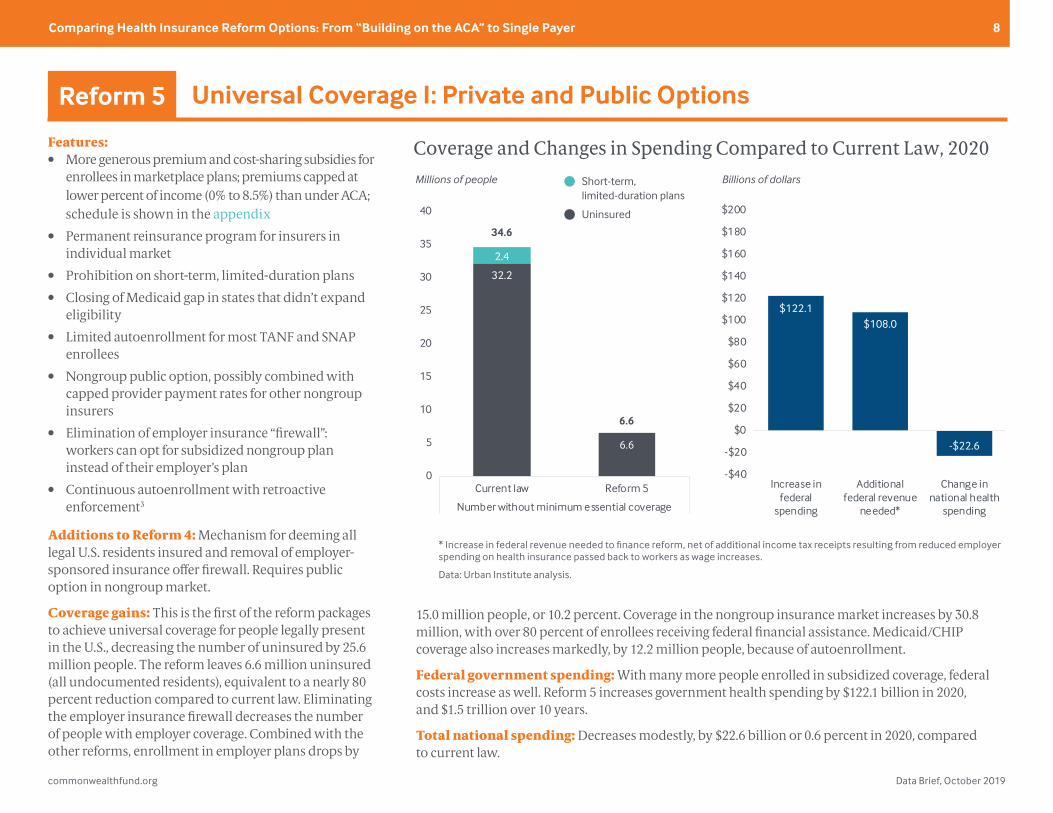
Coverage gains: This is the first of the reform packages to achieve universal coverage for people legally present in the U.S., decreasing the number of uninsured by 25.6 million people. The reform leaves 6.6 million uninsured (all undocumented residents), equivalent to a nearly 80 percent reduction compared to current law. Eliminating the employer insurance firewall decreases the number of people with employer coverage. Combined with the other reforms, enrollment in employer plans drops by
15.0 million people, or 10.2 percent. Coverage in the nongroup insurance market increases by 30.8 million, with over 80 percent of enrollees receiving federal financial assistance. Medicaid/CHIP coverage also increases markedly, by 12.2 million people, because of autoenrollment.
Federal government spending: With many more people enrolled in subsidized coverage, federal costs increase as well. Reform 5 increases government health spending by $122.1 billion in 2020, and $1.5 trillion over 10 years.
Total national spending: Decreases modestly, by $22.6 billion or 0.6 percent in 2020, compared to current law.
Universal Coverage I: Private and Public OptionsReform 5
Source: Linda J. Blumberg et al., Comparing Health Insurance Reform Options: From “Building on the ACA” to Single Payer(Commonwealth Fund and Urban Institute, Oct. 2019).
Coverage and Changes in Spending Compared to Current Law, 2020
32.2
6.6
2.4
0
5
10
15
20
25
30
35
40
Current law Reform 5
Number without minimum essential coverage
Reform 5
* Increase in federal revenue needed to finance reform, net of additional income tax receipts resulting from reduced employer spending on health insurance passed back to workers as wage increases.
Data: Urban Institute analysis.
$122.1$108.0
-$22.6
-$40
-$20
$0
$20
$40
$60
$80
$100
$120
$140
$160
$180
$200
Increase infederal
spending
Additionalfederal revenue
needed*
Change innational health
spending
Billions of dollarsMillions of people
34.6
6.6
Short-term, limited-duration plans
Uninsured
* Increase in federal revenue needed to finance reform, net of additional income tax receipts resulting from reduced employer spending on health insurance passed back to workers as wage increases.
Data: Urban Institute analysis.

commonwealthfund.org Data Brief, October 2019
Comparing Health Insurance Reform Options: From “Building on the ACA” to Single Payer 9
Features:• Even more generous premium and cost-sharing
subsidies for enrollees in marketplace plans; premiums capped at lower percent of income (0% to 8.0%) than under ACA or reforms 1–5; schedule is shown in the appendix
• Permanent reinsurance program for insurers in individual market
• Prohibition on short-term, limited-duration plans
• Closing of Medicaid gap in states that didn’t expand eligibility
• Limited autoenrollment for most TANF and SNAP enrollees
• Nongroup public option, possibly combined with capped provider payment rates for other nongroup insurers
• Elimination of employer insurance “firewall”: workers can opt for subsidized nongroup plan instead of their employer’s plan
• Continuous autoenrollment with retroactive enforcement
Additions to Reform 5: More generous premium and cost-sharing subsidies.
Coverage gains: Overall levels of insurance coverage under Reform 6 are the same as under Reform 5; both include the autoenrollment provisions for all legally present U.S. residents. As a result, the number of uninsured is 6.6 million, all undocumented immigrants. However, the further enhanced nongroup
market subsidies in Reform 6 compared to Reform 5 mean approximately 800,000 fewer people enroll in employer-based coverage.
Federal government spending: Because of the more generous subsidies, federal health care spending is $161.8 billion higher in 2020 compared to current law, and $2.0 trillion higher over 10 years.
Total national spending: Decreases modestly compared to current law, less than 1 percent.
Universal Coverage II: Enhanced SubsidiesReform 6
Source: Linda J. Blumberg et al., Comparing Health Insurance Reform Options: From “Building on the ACA” to Single Payer(Commonwealth Fund and Urban Institute, Oct. 2019).
Coverage and Changes in Spending Compared to Current Law, 2020
32.2
6.6
2.4
0
5
10
15
20
25
30
35
40
Current law Reform 6
Number without minimum essential coverage
Reform 6
* Increase in federal revenue needed to finance reform, net of additional income tax receipts resulting from reduced employer spending on health insurance passed back to workers as wage increases.
Data: Urban Institute analysis.
$161.8
$146.7
-$19.1
-$40
-$20
$0
$20
$40
$60
$80
$100
$120
$140
$160
$180
$200
Increase infederal
spending
Additionalfederal revenue
needed*
Change innational health
spending
Millions of people
34.6
6.6
Billions of dollarsShort-term, limited-duration plans
Uninsured
* Increase in federal revenue needed to finance reform, net of additional income tax receipts resulting from reduced employer spending on health insurance passed back to workers as wage increases.
Data: Urban Institute analysis.
commonwealthfund.org Data Brief, October 2019
Comparing Health Insurance Reform Options: From “Building on the ACA” to Single Payer 10
Features:• Single-payer system covering ACA essential health
benefits
• No premiums
• Income-related cost-sharing (consistent with reforms 1–5); schedule is shown in the appendix
• Coverage of all legally present U.S. residents
• Private insurance prohibited
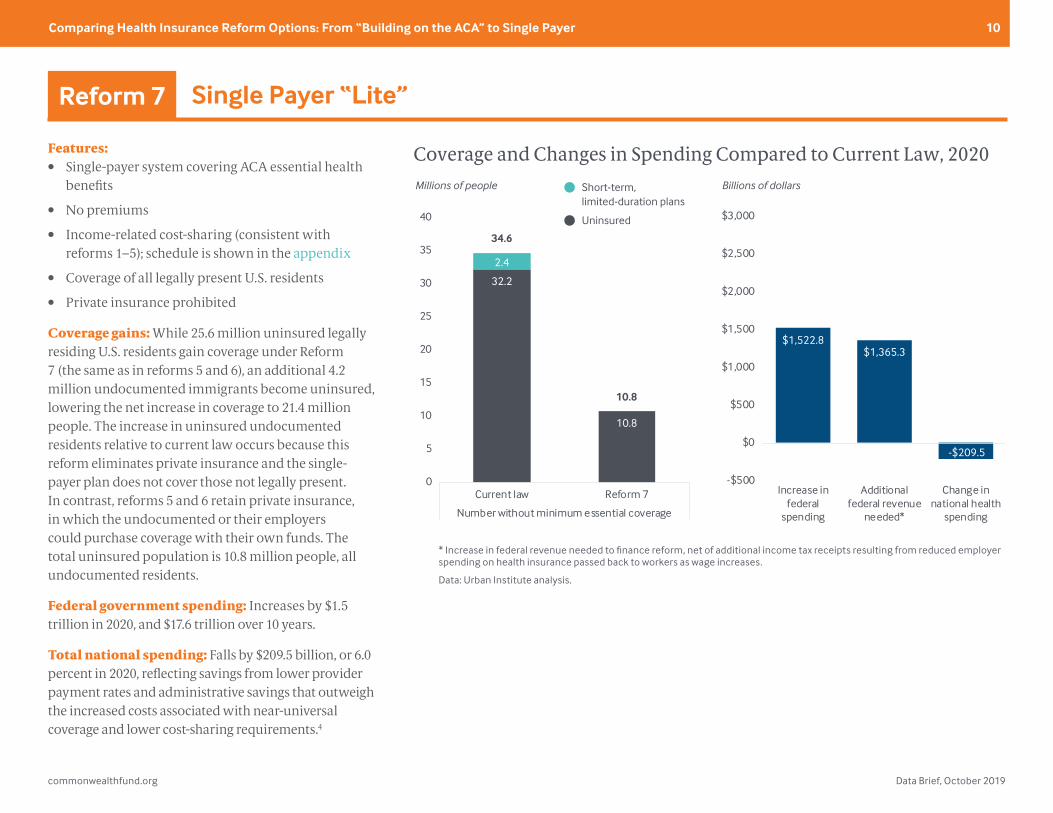
Coverage gains: While 25.6 million uninsured legally residing U.S. residents gain coverage under Reform 7 (the same as in reforms 5 and 6), an additional 4.2 million undocumented immigrants become uninsured, lowering the net increase in coverage to 21.4 million people. The increase in uninsured undocumented residents relative to current law occurs because this reform eliminates private insurance and the single-payer plan does not cover those not legally present. In contrast, reforms 5 and 6 retain private insurance, in which the undocumented or their employers could purchase coverage with their own funds. The total uninsured population is 10.8 million people, all undocumented residents.
Federal government spending: Increases by $1.5 trillion in 2020, and $17.6 trillion over 10 years.
Total national spending: Falls by $209.5 billion, or 6.0 percent in 2020, reflecting savings from lower provider payment rates and administrative savings that outweigh the increased costs associated with near-universal coverage and lower cost-sharing requirements.4
Single Payer “Lite”Reform 7
Source: Linda J. Blumberg et al., Comparing Health Insurance Reform Options: From “Building on the ACA” to Single Payer(Commonwealth Fund and Urban Institute, Oct. 2019).
Coverage and Changes in Spending Compared to Current Law, 2020
32.2
10.8
2.4
0
5
10
15
20
25
30
35
40
Current law Reform 7
Number without minimum essential coverage
Reform 7
* Increase in federal revenue needed to finance reform, net of additional income tax receipts resulting from reduced employer spending on health insurance passed back to workers as wage increases.
Data: Urban Institute analysis.
$1,522.8$1,365.3
-$209.5
-$500
$0
$500
$1,000
$1,500
$2,000
$2,500
$3,000
Increase infederal
spending
Additionalfederal revenue
needed*
Change innational health
spending
Millions of people
34.6
10.8
Billions of dollarsShort-term, limited-duration plans
Uninsured
* Increase in federal revenue needed to finance reform, net of additional income tax receipts resulting from reduced employer spending on health insurance passed back to workers as wage increases.
Data: Urban Institute analysis.
commonwealthfund.org Data Brief, October 2019
Comparing Health Insurance Reform Options: From “Building on the ACA” to Single Payer 11
Features:• Government plan with broad benefits, including
adult dental, vision, hearing, and new home- and community-based long-term services and supports
• No premiums or cost-sharing
• Includes all U.S. residents
• Private insurance prohibited
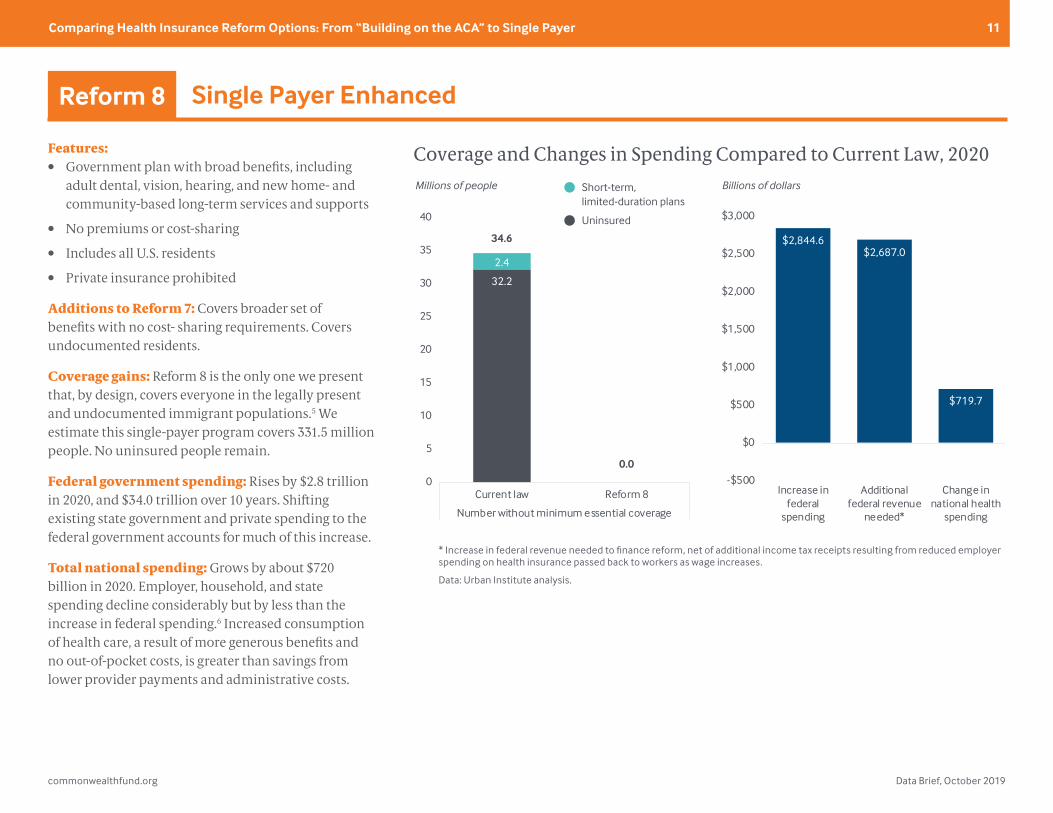
Additions to Reform 7: Covers broader set of benefits with no cost- sharing requirements. Covers undocumented residents.
Coverage gains: Reform 8 is the only one we present that, by design, covers everyone in the legally present and undocumented immigrant populations.5 We estimate this single-payer program covers 331.5 million people. No uninsured people remain.
Federal government spending: Rises by $2.8 trillion in 2020, and $34.0 trillion over 10 years. Shifting existing state government and private spending to the federal government accounts for much of this increase.
Total national spending: Grows by about $720 billion in 2020. Employer, household, and state spending decline considerably but by less than the increase in federal spending.6 Increased consumption of health care, a result of more generous benefits and no out-of-pocket costs, is greater than savings from lower provider payments and administrative costs.
Single Payer EnhancedReform 8
Source: Linda J. Blumberg et al., Comparing Health Insurance Reform Options: From “Building on the ACA” to Single Payer(Commonwealth Fund and Urban Institute, Oct. 2019).
Coverage and Changes in Spending Compared to Current Law, 2020
32.2
0.0
2.4
0
5
10
15
20
25
30
35
40
Current law Reform 8
Number without minimum essential coverage
Reform 8
* Increase in federal revenue needed to finance reform, net of additional income tax receipts resulting from reduced employer spending on health insurance passed back to workers as wage increases.
Data: Urban Institute analysis.
$2,844.6$2,687.0
$719.7
-$500
$0
$500
$1,000
$1,500
$2,000
$2,500
$3,000
Increase infederal
spending
Additionalfederal revenue
needed*
Change innational health
spending
Millions of people
34.6
0.0
Billions of dollarsShort-term, limited-duration plans
Uninsured
* Increase in federal revenue needed to finance reform, net of additional income tax receipts resulting from reduced employer spending on health insurance passed back to workers as wage increases.
Data: Urban Institute analysis.
commonwealthfund.org Data Brief, October 2019
Comparing Health Insurance Reform Options: From “Building on the ACA” to Single Payer 12
DISCUSSION
We raise five issues that we believe are particularly important to consider when designing health insurance system reforms.
1. Levels of provider payment rates. Many of the reforms being discussed today revolve around at least some regulation of the payment rates for health care providers (for example, our reforms 4 through 8). Today, payments to hospitals and physicians vary considerably across services, provider types, insurers, individual providers, and geographic areas. How much and how fast provider payment rates can be reduced without affecting access and quality of care is unknown. The more people enrolled in rate-regulated coverage, the greater the implications of where the payment levels are set.
2. Phase-in period. Our estimates assume immediate full implementation of each set of reforms. As reforms increase in breadth, the necessary phase-in period lengthens. The first years of a reform’s implementation may be focused on creating new systems related to eligibility and enrollment and developing new payment systems and regulations, lowering total costs in the budget window. We assume for this analysis that provider supply will, over time, expand to meet the increased demand for services. Therefore, we have not estimated constraints on the supply of medical services. However, the expansion of supply for particular services may take longer than for others, particularly under the single-payer plan in Reform 8. Thus, in the short run, national health spending could be somewhat lower than what we estimate, but that would also mean that promised improvements in access to care would not occur uniformly. Finally, the larger the population enrolled in coverage with lower, regulated provider payment rates, the more important it will be to phase in lower reimbursement
levels over time in order to minimize disruption in the health care delivery system. This approach would increase costs over the phase-in period.
3. Effects on employer health care spending and wages. We estimate reductions in health care spending by employers for each set of reforms. These reductions increase as we move from incremental to more ambitious reform approaches. A substantial body of economic research indicates that reductions in employer spending on health care is passed back, over time, to workers in the form of higher wages.7 Thus, in equilibrium, employers will spend significantly less on health care under some of the reforms we present, but they are unlikely to experience considerable overall savings or improvements in profitability.
4. Effects on household spending. Depending on the reform approach and income level, households see considerable savings in health care costs, with the greatest savings under the incremental approaches accruing to lower- and middle-income families. Health care savings are very large across the board under the single-payer plans. However, households will face higher taxes with any of these reforms, and these taxes are not accounted for here.
5. Effects on total national health spending. These estimates demonstrate that it is possible to design a set of insurance reforms that achieves universal coverage for the legally present U.S. population without increasing total national health spending. Reforms 5 and 6 do this through mechanisms that maintain sizable private insurance markets, while Reform 7 (Single Payer “Lite”) relies entirely on a government insurance program. The more expansive Single Payer Enhanced option (#8) differs markedly on this measure, however.
commonwealthfund.org Data Brief, October 2019
Comparing Health Insurance Reform Options: From “Building on the ACA” to Single Payer 13
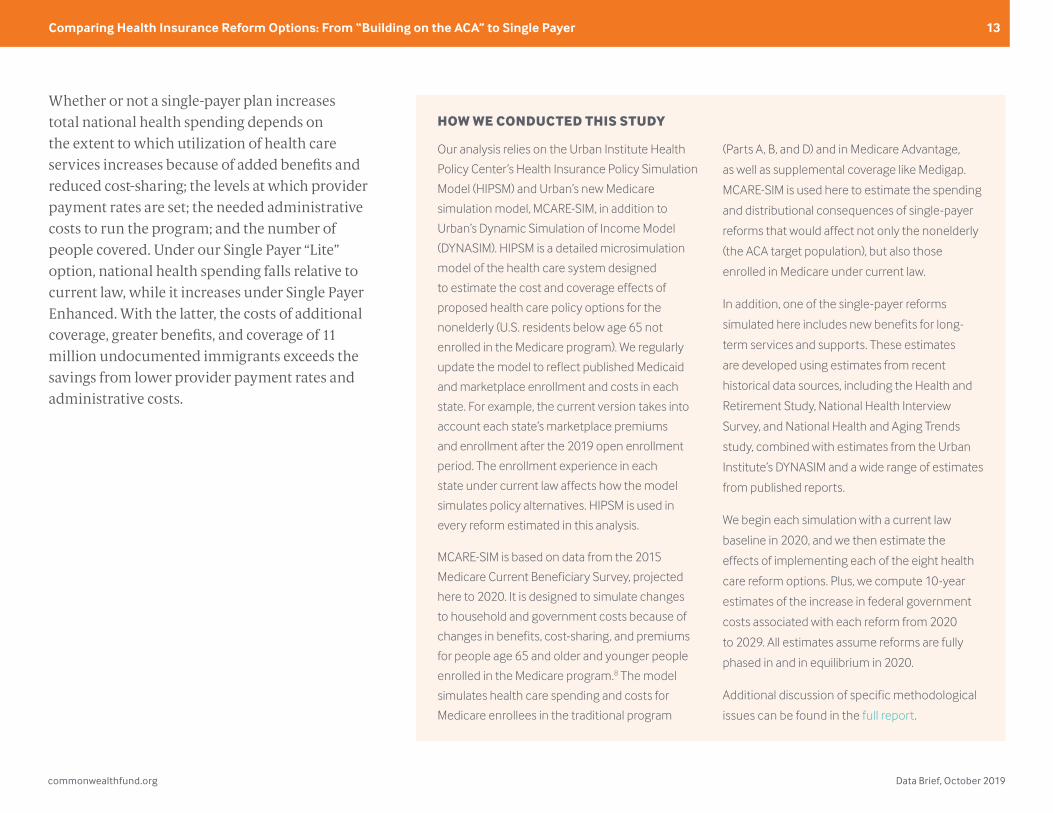
Whether or not a single-payer plan increases total national health spending depends on the extent to which utilization of health care services increases because of added benefits and reduced cost-sharing; the levels at which provider payment rates are set; the needed administrative costs to run the program; and the number of people covered. Under our Single Payer “Lite” option, national health spending falls relative to current law, while it increases under Single Payer Enhanced. With the latter, the costs of additional coverage, greater benefits, and coverage of 11 million undocumented immigrants exceeds the savings from lower provider payment rates and administrative costs.
HOW WE CONDUCTED THIS STUDY
Our analysis relies on the Urban Institute Health
Policy Center’s Health Insurance Policy Simulation
Model (HIPSM) and Urban’s new Medicare
simulation model, MCARE-SIM, in addition to
Urban’s Dynamic Simulation of Income Model
(DYNASIM). HIPSM is a detailed microsimulation
model of the health care system designed
to estimate the cost and coverage effects of
proposed health care policy options for the
nonelderly (U.S. residents below age 65 not
enrolled in the Medicare program). We regularly
update the model to reflect published Medicaid
and marketplace enrollment and costs in each
state. For example, the current version takes into
account each state’s marketplace premiums
and enrollment after the 2019 open enrollment
period. The enrollment experience in each
state under current law affects how the model
simulates policy alternatives. HIPSM is used in
every reform estimated in this analysis.
MCARE-SIM is based on data from the 2015
Medicare Current Beneficiary Survey, projected
here to 2020. It is designed to simulate changes
to household and government costs because of
changes in benefits, cost-sharing, and premiums
for people age 65 and older and younger people
enrolled in the Medicare program.8 The model
simulates health care spending and costs for
Medicare enrollees in the traditional program
(Parts A, B, and D) and in Medicare Advantage,
as well as supplemental coverage like Medigap.
MCARE-SIM is used here to estimate the spending
and distributional consequences of single-payer
reforms that would affect not only the nonelderly
(the ACA target population), but also those
enrolled in Medicare under current law.
In addition, one of the single-payer reforms
simulated here includes new benefits for long-
term services and supports. These estimates
are developed using estimates from recent
historical data sources, including the Health and
Retirement Study, National Health Interview
Survey, and National Health and Aging Trends
study, combined with estimates from the Urban
Institute’s DYNASIM and a wide range of estimates
from published reports.
We begin each simulation with a current law
baseline in 2020, and we then estimate the
effects of implementing each of the eight health
care reform options. Plus, we compute 10-year
estimates of the increase in federal government
costs associated with each reform from 2020
to 2029. All estimates assume reforms are fully
phased in and in equilibrium in 2020.
Additional discussion of specific methodological
issues can be found in the full report.

commonwealthfund.org Data Brief, October 2019
Comparing Health Insurance Reform Options: From “Building on the ACA” to Single Payer 14
Eight Health Reform Options: Summary of Features
Reform 1: ACA Enhanced I
Reform 2: ACA Enhanced II
Reform 3: ACA Enhanced III
Reform 4: ACA Enhanced IV
Reform 5: Universal Coverage I
Reform 6: Universal Coverage II
Reform 7: Single Payer “Lite”
Reform 8: Single Payer Enhanced
Reduced household premiums? ACA marketplace premiums capped at lower percent of income, ranging from 0% to 8.5% caps for those at 400% FPL or higher unless otherwise indicated
Yes Yes Yes Yes YesYes; 0% to 8% of
income for those at 600% FPL or higher
No premium, regardless of income in new government plan
No premium, regardless of income in new government plan
Lower cost-sharing? Premium tax credits tied to marketplace premium with 80% actuarial value; additional subsidies for households up to 400% FPL unless otherwise indicated
Yes Yes Yes Yes Yes Yes; up to 500% FPL YesNo cost-sharing,
regardless of income
Minimum benefit package? Nongroup market coverage Includes ACA’s essential health benefits unless otherwise indicated
Yes Yes Yes Yes Yes YesYes, for everyone in new
government plan
All medically necessary care, including long-term
services and supports, dental, vision, hearing
Reinsurance? Permanent $10 billion a year program helps nongroup insurers pay high-cost claims
Yes Yes Yes Yes Yes Yes Not applicable; no private insurersNot applicable;
no private insurance
Penalties for remaining uninsured?No, except in
states with own laws
Yes; restores ACA penalties
Yes; restores ACA penalties
Yes; restores ACA penalties
No; all legally present residents enrolled
through continuous autoenrollment with retroactive
enforcement
No; all legally present residents enrolled
through continuous autoenrollment with
retroactive enforcement
No; all legally present residents enrolled in government plan
No; all U.S. residents enrolled in
government plan
Expanded access to short-term, limited-duration plans?
Yes; current lawNo; returns to
2016 rulesNo; returns to
2016 rulesNo; returns to
2016 rulesNo; all enrolled in
compliant coverageNo; all enrolled in
compliant coverageNo; all enrolled in government plan
No; all enrolled in government plan
Limits on provider payment rates? No No No
Yes, in nongroup market; public plan pays competitive
market rates and/or private nongroup
plans capped at same rates in and
out of network
Yes, in nongroup market; public plan pays competitive market rates and private nongroup
plans capped at same rates both in and out of network. Reform features public plan
option.
Yes; in nongroup market; public plan pays competitive
market rates and private nongroup plans capped
at same rates both in and out of network.
Reform features public plan option.
Yes; everyone (except undocumented immigrants) is enrolled in single government
insurance plan that pays providers close to Medicare rates*
Yes; everyone is enrolled in single government
insurance plan that pays providers close to Medicare
rates*
Eliminates Medicaid eligibility gap? Federal government pays 100% of cost of Medicaid expansion; lowers threshold for marketplace subsidies to just above Medicaid eligibility in nonexpansion states
No No Yes Yes Yes Yes
Yes; all enrollees, regardless of income, are enrolled in the same
government insurance plan with no premiums. Low-income
people (including those otherwise Medicaid-eligible) receive
additional cost-sharing subsidies.
Yes; all U.S. residents, regardless of income,
are enrolled in the same government insurance plan with no premiums or cost-
sharing requirements
Those offered employer coverage excluded from marketplace subsidies?
Yes; current law Yes; current law Yes; current law Yes; current law No NoNo; employer-based insurance
prohibitedNo; employer-based insurance prohibited
Leads to universal coverage? No No No NoFor legally present
residents onlyFor legally present
residents onlyFor legally present residents only Yes
Employers face penalty for not insuring workers? Current law: some firms with more than 50 workers do
Yes Yes Yes Yes No No No No
Notes: ACA = Affordable Care Act; FPL = federal poverty level; SNAP = Supplemental Nutrition Assistance Program; TANF = Temporary Assistance for Needy Families. * Provider payment rates under single-payer options are set at traditional Medicare rates for physicians and at hospital costs (Medicare rates plus 15%) for hospitals. Nongroup public option coverage is set to approximate Medicare rates by estimating premiums in each rating area as if there were at least five competing insurers and modestly competitive provider markets. See the methodology appendix for additional detail.
Data: Urban Institute analysis.

commonwealthfund.org Data Brief, October 2019
Comparing Health Insurance Reform Options: From “Building on the ACA” to Single Payer 15
NOTES
1. The 10 are: ambulatory patient services; emergency services; hospitalization; maternity and newborn care; mental health and substance use disorder services, including behavioral health treatment; prescription drugs; rehabilitative and habilitative services and devices; laboratory services; preventive and wellness services and chronic disease management; and pediatric services, including oral and vision care.
2. Consistent with the economic literature, we assume that decreases in employer spending on health insurance premiums for active workers (i.e., not retirees) are passed back to the firms’ workers in the form of increased wages. Since employer contributions to health insurance are not taxable as income but wages are, this shift in the form of compensation increases income tax revenue in equilibrium.
3. Any eligible person seeking coverage from a health care provider during the year who had not yet actively enrolled in insurance would be considered enrolled in the public option. For more information, see Linda J. Blumberg et al., The Healthy America Program, An Update and Additional Options (Robert Wood Johnson Foundation and Urban Institute, Sept. 2019), p. 7.
4. We assume administrative costs in a single-payer option (reforms 7 and 8) would amount to approximately 6 percent of claims costs. However, in the full report we also present sensitivity analyses on the costs if the administrative percentage were 3 percent instead. See the full report and methodology appendix for additional discussion on this issue.
5. However, this difference introduces some additional uncertainty into the estimates, which we discuss in the full report.
6. The remaining household and state spending under Reform 8 is attributable to the nursing home care benefit in the Medicaid program. Reform 8 introduces a new home and community-based long-term services and supports benefit but leaves the current law Medicaid nursing home benefit in place.
7. Jonathan Gruber, “Chapter 12 – Health Insurance and the Labor Market,” in Handbook of Health Economics, Vol. 1, Part A (Elsevier, 2000), pp. 645–706.
8. Bowen Garrett et al., A Unified Cost-Sharing Design for Medicare: Effects on Beneficiary and Program Spending (Urban Institute, July 2019).
commonwealthfund.org Data Brief, October 2019
Comparing Health Insurance Reform Options: From “Building on the ACA” to Single Payer 16
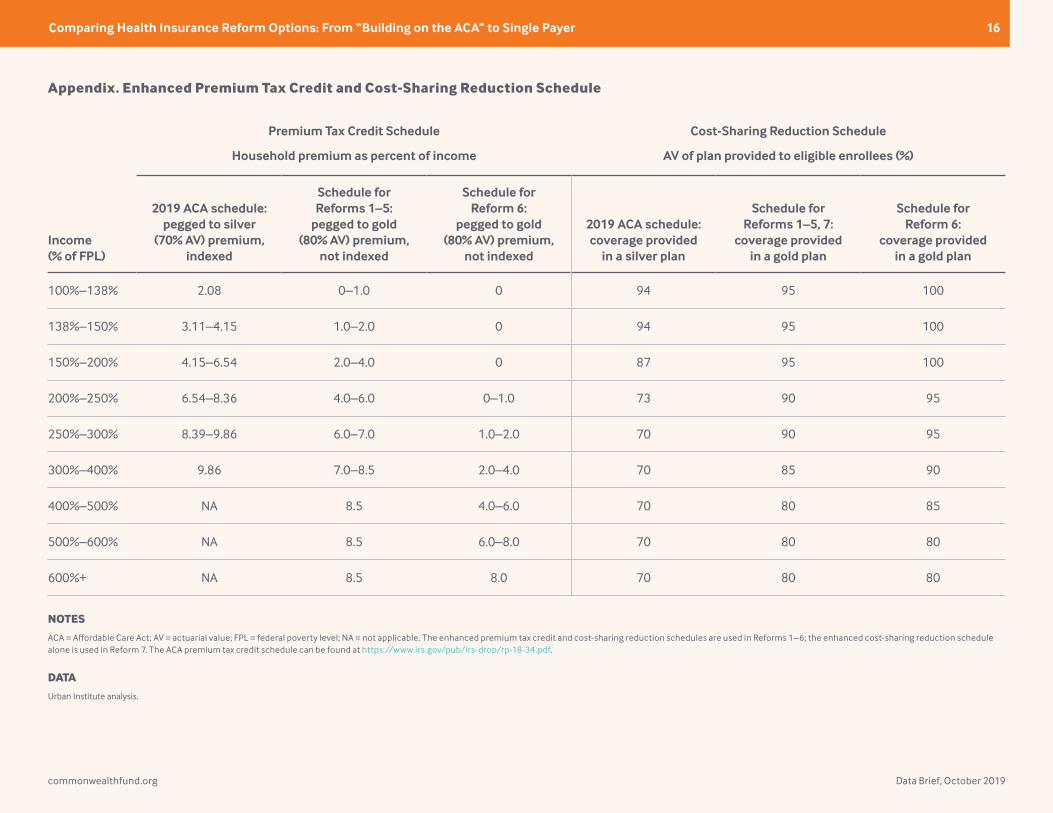
Appendix. Enhanced Premium Tax Credit and Cost-Sharing Reduction Schedule
Premium Tax Credit Schedule Cost-Sharing Reduction Schedule
Household premium as percent of income AV of plan provided to eligible enrollees (%)
Income (% of FPL)
2019 ACA schedule: pegged to silver
(70% AV) premium, indexed
Schedule for Reforms 1–5:
pegged to gold (80% AV) premium,
not indexed
Schedule for Reform 6:
pegged to gold (80% AV) premium,
not indexed
2019 ACA schedule: coverage provided
in a silver plan
Schedule for Reforms 1–5, 7:
coverage provided in a gold plan
Schedule for Reform 6:
coverage provided in a gold plan
100%–138% 2.08 0–1.0 0 94 95 100
138%–150% 3.11–4.15 1.0–2.0 0 94 95 100
150%–200% 4.15–6.54 2.0–4.0 0 87 95 100
200%–250% 6.54–8.36 4.0–6.0 0–1.0 73 90 95
250%–300% 8.39–9.86 6.0–7.0 1.0–2.0 70 90 95
300%–400% 9.86 7.0–8.5 2.0–4.0 70 85 90
400%–500% NA 8.5 4.0–6.0 70 80 85
500%–600% NA 8.5 6.0–8.0 70 80 80
600%+ NA 8.5 8.0 70 80 80
NOTES
ACA = Affordable Care Act; AV = actuarial value; FPL = federal poverty level; NA = not applicable. The enhanced premium tax credit and cost-sharing reduction schedules are used in Reforms 1–6; the enhanced cost-sharing reduction schedule alone is used in Reform 7. The ACA premium tax credit schedule can be found at https://www.irs.gov/pub/irs-drop/rp-18-34.pdf.
DATA
Urban Institute analysis.

commonwealthfund.org Data Brief, October 2019
Comparing Health Insurance Reform Options: From “Building on the ACA” to Single Payer 17
ABOUT THE AUTHORS
Linda J. Blumberg, Ph.D., is an institute fellow in the Health Policy Center at the Urban Institute. She is an expert on private health insurance (employer and nongroup), health care financing, and health system reform. Her recent work includes extensive research related to the Affordable Care Act (ACA); in particular, providing technical assistance to states, tracking policy decision-making and implementation at the state and federal levels, and interpreting and analyzing the implications of particular policies. Dr. Blumberg frequently testifies before Congress and is quoted in major media outlets on health reform topics. She serves on the Cancer Policy Institute’s advisory board and has served on the Health Affairs editorial board. From 1993 through 1994, she was a health policy adviser to the Clinton administration during its health care reform effort, and she was a 1996 Commonwealth Fund Ian Axford Fellow in Public Policy. Dr. Blumberg received her Ph.D. in economics from the University of Michigan.
John Holahan, Ph.D., is an institute fellow in the Health Policy Center at the Urban Institute, where he previously served as director for more than 30 years. His recent work focuses on health reform, the uninsured, and health expenditure growth, developing proposals for health system reform. Dr. Holahan examines the coverage, costs, and economic impact of the Affordable Care Act (ACA), including the costs of Medicaid expansion as well as the macroeconomic effects of the law. He also has conducted significant work on Medicaid and Medicare reform, including analyses on the recent growth in Medicaid expenditures, implications of block grants and swap proposals on states and the federal government, and the effect of state decisions to expand Medicaid in the ACA on federal and state spending. Dr. Holahan received his Ph.D. in economics from Georgetown University.
Matthew Buettgens, Ph.D., is a senior fellow in the Health Policy Center at the Urban Institute, where he is the mathematician leading the development of Urban’s Health Insurance Policy Simulation Model
(HIPSM). HIPSM has been used to provide technical assistance for health reform implementation in Massachusetts, Missouri, New York, Virginia, and Washington, as well as to the federal government. His research topics have included the costs and savings of health reform for both federal and state governments, state-by-state analysis of changes in health insurance coverage and the remaining uninsured, the effect of reform on employers, the role of the individual mandate, the affordability of coverage under health insurance exchanges, and the implications of age rating for the affordability of coverage. Dr. Buettgens received a Ph.D. in mathematics from the State University of New York at Buffalo.
Anuj Gangopadhyaya, Ph.D., is a research associate in the Health Policy Center at the Urban Institute and a lead analyst for Urban’s MCARE-SIM model. His recent relevant work investigates the impact of the Affordable Care Act on near-elderly coverage, access, and well-being. His primary research assesses links between health and human capital. Dr. Gangopadhyaya received his Ph.D. in economics from the University of Illinois at Chicago.
Bowen Garrett, Ph.D., is a senior fellow in the Health Policy Center at the Urban Institute. His work focuses on health reform and health policy topics, with recent research examining the labor market effects of the Affordable Care Act, the design of Medicare’s payment systems for postacute care, and the effects of a unified cost-sharing design for Medicare. He leads the development of MCARE-SIM and has conducted numerous studies of the likely effects of alternative reform proposals. Previously, he was chief economist of the Center for U.S. Health System Reform and McKinsey Advanced Health Analytics at McKinsey & Company. He is a research associate with the Info-Metrics Institute at American University. Dr. Garrett received his Ph.D. in economics from Columbia University and was a postdoctoral research fellow in the Robert Wood Johnson Foundation’s Scholars in Health Policy Research Program.

commonwealthfund.org Data Brief, October 2019
Comparing Health Insurance Reform Options: From “Building on the ACA” to Single Payer 18
Adele Shartzer, Ph.D., is a research associate in the Health Policy Center at the Urban Institute. Her work focuses on health coverage including Medicare, Medicaid, and the uninsured, as well as health care access and use, primarily using quantitative analysis of survey data. Dr. Shartzer has also worked on developing the MCARE-SIM model, evaluating the impact of the Affordable Care Act on private insurance markets, and health care delivery system reform. Before joining Urban, she was a program analyst with the Office of the Assistant Secretary for Planning and Evaluation at the U.S. Department of Health and Human Services. Dr. Shartzer earned her Ph.D. in health services research from the Bloomberg School of Public Health at Johns Hopkins University.
Michael Simpson is a principal research associate in the Health Policy Center at the Urban Institute, with 25 years of experience developing economic models and using survey and administrative data. His current work focuses on using Urban’s Health Insurance Policy Simulation Model to project health insurance coverage and spending both in the baseline and under policy alternatives. Before joining Urban, Mr. Simpson developed the Congressional Budget Office’s long-term dynamic microsimulation model, analyzed numerous policy reform proposals, investigated differences between various projections of Social Security finances and benefits, quantified the importance of Monte Carlo variation in model results, and created multiple methods to demonstrate uncertainty in projections.
Robin Wang, M.P.A., is a research analyst in the Health Policy Center at the Urban Institute, where he helps develop Urban’s Health Insurance Policy Simulation Model. The model provides technical assistance for health reform implementation in Massachusetts, Missouri, New York, Virginia, and Washington, as well as to the federal government. Previously, Mr. Wang researched health policy, long-term care insurance
schemes, and pay for success models and had professional engagements with the U.K. House of Commons, the European Parliament, and U.S. Senator’s constituency office. He received his M.P.A. from the London School of Economics and Political Science.
Melissa M. Favreault, Ph.D., is a senior fellow in the Income and Benefits Policy Center at the Urban Institute, where her work focuses on the economic well-being and health status of older Americans and people with disabilities. She studies social insurance and social assistance programs and has written extensively about Medicaid, Medicare, Social Security, and Supplemental Security Income, evaluating how well these programs serve Americans today and how various policy changes and ongoing economic and demographic trends could alter outcomes for future generations. Dr. Favreault has published her research in Demography, Health Affairs, Health Services Research, and the Journal of Gerontology: Social Sciences, and coedited the book Social Security and the Family: Addressing Unmet Needs in an Underfunded System. She serves on the board of the International Microsimulation Association. Dr. Favreault earned her M.A. and Ph.D. in sociology from Cornell University.
Diane Arnos is a research assistant in the Health Policy Center at the Urban Institute. Before joining Urban, she interned at the Massachusetts General Hospital Center for Global Health and volunteered as a case manager with the AIDS Action Committee of Massachusetts. Ms. Arnos graduated magna cum laude from Tufts University with degrees in biology and community health, receiving highest honors for her senior thesis in community health, which focused on the role of homelessness and gender in indicators of substance use disorder severity.
Editorial support was provided by Christopher Hollander.

commonwealthfund.org Data Brief, October 2019
Comparing Health Insurance Reform Options: From “Building on the ACA” to Single Payer 19
ACKNOWLEDGMENTS
This report was funded by the Commonwealth Fund. We are grateful to them and to all our funders, who make it possible for Urban to advance its mission.
The views expressed are those of the authors and should not be attributed to the Urban Institute, its trustees, or its funders. Funders do not determine research findings of the insights and recommendations of Urban experts. Further information on the Urban Institute’s funding principles is available here.
The authors are grateful for comments and suggestions from Sherry Glied and Robert Reishchauer and for research assistance from Caroline Elmendorf and Erik Wengle.
ABOUT THE URBAN INSTITUTE
The nonprofit Urban Institute is a leading research organization dedicated to developing evidence-based insights that improve people’s lives and strengthen communities. For 50 years, Urban has been the trusted source for rigorous analysis of complex social and economic issues; strategic advice to policymakers, philanthropists, and practitioners; and new, promising ideas that expand opportunities for all. Our work inspires effective decisions that advance fairness and enhance the well-being of people and places.
For more information about this brief, please contact: Linda J. Blumberg, Ph.D.Institute Fellow, Health Policy CenterUrban Institutelblumbergurban.org

About the Commonwealth FundThe mission of the Commonwealth Fund is to promote a high-performing health care system that achieves better access, improved quality, and greater efficiency, particularly for society’s most vulnerable, including low-income people, the uninsured, and people of color. Support for this research was provided by the Commonwealth Fund. The views presented here are those of the authors and not necessarily those of the Commonwealth Fund or its directors, officers, or staff.