Comparing Child-focused Sustainable Development Goals ... · Comparing Child-focused Sustainable...
74
1 Comparing Child-focused Sustainable Development Goals (SDGs) in High-income Countries: Indicator Development and Overview Dominic Richardson, Zlata Brukauf, Emilia Toczydlowska, Yekaterina Chzhen Office of Research - Innocenti Working Paper WP-2017-08 | June 2017
Transcript of Comparing Child-focused Sustainable Development Goals ... · Comparing Child-focused Sustainable...

1
Comparing Child-focused
Sustainable Development Goals (SDGs)
in High-income Countries: Indicator
Development and Overview
Dominic Richardson, Zlata Brukauf,
Emilia Toczydlowska, Yekaterina Chzhen
Office of Research - Innocenti Working Paper
WP-2017-08 | June 2017
2
INNOCENTI WORKING PAPERS
UNICEF Office of Research Working Papers are intended to disseminate initial research contributions within the programme of work, addressing social, economic and institutional aspects of the realization of the human rights of children.
The findings, interpretations and conclusions expressed in this paper are those of the authors and do not necessarily reflect the policies or views of UNICEF.
This paper has been peer reviewed both externally and within UNICEF.
The text has not been edited to official publications standards and UNICEF accepts no responsibility for errors.
Extracts from this publication may be freely reproduced with due acknowledgement. Requests to utilize larger portions or the full publication should be addressed to the Communication Unit at: [email protected].
For readers wishing to cite this document, we suggest the following form:
Richardson, D., Brukauf, Z., Toczydlowska, E. and Chzhen, Y. Comparing Child-focused Sustainable Development Goals (SDGs) in High-income Countries: Indicator Development and Overview, Innocenti Working Paper 2017-08, UNICEF Office of Research, Florence.
© 2017 United Nations Children’s Fund (UNICEF)
eISSN: 2520-6796

3
THE UNICEF OFFICE OF RESEARCH – INNOCENTI
The Office of Research – Innocenti is UNICEF’s dedicated research centre. It undertakes research on emerging or current issues in order to inform the strategic directions, policies and programmes of UNICEF and its partners, shape global debates on child rights and development, and inform the global research and policy agenda for all children, and particularly for the most vulnerable.
Publications produced by the Office are contributions to a global debate on children and may not necessarily reflect UNICEF policies or approaches. The views expressed are those of the authors.
The Office of Research – Innocenti receives financial support from the Government of Italy, while funding for specific projects is also provided by other governments, international institutions and private sources, including UNICEF National Committees.
For further information and to download or order this and other publications, please visit the website at www.unicef-irc.org.
Correspondence should be addressed to:UNICEF Office of Research - InnocentiPiazza SS. Annunziata, 1250122 Florence, ItalyTel: (+39) 055 20 330Fax: (+39) 055 2033 [email protected]: @UNICEFInnocentifacebook.com/UnicefOfficeofResearchInnocenti

4
COMPARING CHILD-FOCUSED SUSTAINABLE DEVELOPMENT GOALS (SDGS) IN HIGH-INCOME COUNTRIES: INDICATOR DEVELOPMENT AND OVERVIEW
Dominic Richardson, Zlata Brukauf, Emilia Toczydlowska, Yekaterina Chzhen.
Corresponding authors is: [email protected]
Abstract: The new Sustainable Development Goals (SDGs) and the 2030 Agenda for Sustainable Development aim to build on the achievements made under the UN Millennium Development Goals (MDGs) by broadening their scope and building upon a consultative process. The MDGs contributed to substantial social progress in eight key areas: poverty; education; gender equality; child mortality; maternal health; disease; the environment; and global partnership. The SDGs not only include a greater number of development goals than the MDGs, but are also global in focus, including advanced economies for the first time. This paper draws attention to the main challenges the 2030 Agenda presents for rich countries, by highlighting a set of critical child specific indicators, evaluating countries’ progress towards meeting the Goals, and highlighting gaps in existing data. The paper will inform UNICEFs Report Card 14, Building the Future: Children and the Sustainable Development Goals in Rich Countries.
Keywords: Report Card 14; Sustainable Development Goals; SDGs and children; League Table; Poverty; Deprivation; Nutrition; Hunger; Health; Education; Gender equality; Reduced inequalities; Responsible consumption and production; Sustainable cities; Peaceful societies.
Author affiliations: Dominic Richardson is Senior Education Specialist at the UNICEF Office of Research - Innocenti. Zlata Bruckauf and Emilia Toczydlowska are consultants in Social and Economic Policy at the UNICEF Office of Research – Innocenti. Yekaterina Chzhen is a Social and Economic Policy Specialist at the UNICEF Office of Research – Innocenti.
Acknowledgements: The authors would like to thank Sarah Cook, Goran Holmqvist, and Jose Cuesta from the Office of Research - Innocenti, for their helpful comments on drafts and during early presentations of the concept and results. The authors would also like to thank external reviewers from the Innocenti Report Card 14 Advisory Board including: Romina Boarini (OECD Statistics Directorate); Dorothy Currie (St. Andrews University, HBSC Network); Dave Gordon (University of Bristol); Bergsteinn Jónsson (Executive Director, UNICEF Iceland); Eric Marlier (Luxembourg Institute of Socio-Economic Research); Susan Nicolai (Development Progress Project, Overseas Development Institute); Kate Pickett (University of York, United Kingdom); Tom Slaymaker (Data and Analytics, UNICEF New York); and Jan Vandemoortele (Independent Adviser); as well as Emeritus Prof. Jonathan Bradshaw, for helpful comments on an earlier version of this paper.

5
TABLE OF CONTENTS
1. INTRODUCTION .............................................................................................................................. 6
1.1 Children in the SDG framework: Why focus on children in rich countries? ........................ 6
1.2 How this work complements existing UNICEF data work to support the SDG process ..... 8
1.3 Organization of this paper ....................................................................................................... 9
2. MAIN MESSAGES ........................................................................................................................... 9
2.1 Key messages ........................................................................................................................... 9
2.2 Summary table: League table of SDG measures ................................................................... 9
3. MEASURING CHILD-FOCUSED SDGS IN HIGH-INCOME COUNTRIES ................................... 12
3.1 Criteria behind the selection of the goals and indicators selected in this paper .............. 12
3.2 What are the main measurement issues? ............................................................................ 13
3.3 An overview of indicators: age coverage, child-centeredness and policy relevance ....... 14
4. EVIDENCE ON CHILD-FOCUSED SDGS IN HIGH-INCOME COUNTRIES .................................. 18
4.1 Goal 1: End poverty in all its forms ....................................................................................... 18
4.2 Goal 2: Ending hunger, achieving food security and improved nutrition .......................... 23
4.3 Goal 3: Ensure healthy lives and promote well-being ......................................................... 28
4.4 Goal 4: Ensure inclusive education and equitable quality education for all ...................... 34
4.5 Goal 5: Achieve gender equality, and empower girls .......................................................... 40
4.6 Goal 8: Promote sustained, inclusive economic growth ..................................................... 43
4.7 Goal 10: Reduce inequality within and among countries ................................................... 46
4.8 Goal 11: Making cities inclusive, safe and resilient ............................................................. 51
4.9 Goal 12: Ensure sustainable production and consumption ................................................ 54
4.10 Goal 16: Promote peaceful and inclusive societies for sustainable development .......... 56
5. WHERE NEXT FOR CHILD-FOCUSED SDG MEASUREMENT IN HIGH-INCOME COUNTRIES? ................................................................................................................................. 60
5.1 Children in High-income countries and the SDGs: Priority recommendations ................. 60
REFERENCES ..................................................................................................................................... 62
DATA SOURCES ................................................................................................................................ 71
ANNEX I: GOAL COMPOSITES AND THE LEAGUE TABLE: DATA SOURCES, METHODS ......... 72

6
Comparing Child-focused Sustainable Development Goals (SDGs) in High-income Countries: Indicator Development and Overview
Innocenti Working Paper 2017-08
1. INTRODUCTION
The 2030 Agenda for sustainable development is the most ambitious global agreement for achieving social progress to date. Building on the achievements made under the Millennium Development Goals (MDGs), the Sustainable Development Goals (SDGs) cover more social dimensions and are universal in scope. The universality principle of the 2030 Agenda means that social progress goals and targets have been set for all countries, including the richest countries of the globe, with the explicit intention of leaving no one behind.
This report seeks to assess the extent of the challenge set in the 2030 Agenda in high-income countries, and in line with the focus of previous Innocenti Report Cards, reviews the SDG challenge from the perspective of children. By selecting SDGs most relevant to children, using data to illustrate how rich countries compare on these goals, and discussing the main data gaps and data coverage, this study makes an important contribution to assessing what can and needs to be done for children, as part of the process of addressing the SDGs in high-income settings.
1.1 Children in the SDG framework: Why focus on children in rich countries?
The reasons for monitoring the life outcomes of children cross-nationally have been repeatedly stated (OECD, 2015, 2011, 2009; UNICEF, 2013, 2010, 2007; EC, 2008). Monitoring the life chances of children is considered a necessary starting point for catalyzing social progress for and around children.
Children make up a large and relatively dependent part of the population – and so should not be overlooked in social statistics and social progress plans. Children’s well-being matters; their rights should be met, and statistics are needed to monitor these outcomes. Children will be the social, political and economic decision-makers of the future, and as such, all children should be encouraged to maximize their potential for the benefits of future societies. All governments recognize these issues to varying degrees, and act on them by investing in their child populations, actions which would benefit from child-outcome monitoring frameworks as tools for evaluating policies for children and informing best practices into the future.
In short, a focus on children in social statistics and social progress is not only good for children, but good for the societies in which they live, as well as being necessary for informing action for children. Why focus on children in the SDGs specifically? Two key arguments are as follows:
1) The SDGs can fill a global child-monitoring gap
Monitoring the life experiences of children is a necessary first step in determining whether rights and well-being standards are being achieved. The UNCRC and children’s rights are a universal and normative framework, to which almost all countries have signed up, and against which all signatories regularly report (OHCHR, 2017). Despite the relative wealth in high-income countries, the availability of data – particularly around income and health statistics, the agreements regarding the collection of child focussed data (e.g. the Lisbon Accord for Europe), and the work of previous frameworks in developing countries (such as the MDGs), there are no official global multi-dimensional child-specific monitoring frameworks.

7
Comparing Child-focused Sustainable Development Goals (SDGs) in High-income Countries: Indicator Development and Overview
Innocenti Working Paper 2017-08
Because the SDGs represent the first official global attempt to produce a multidimensional social progress frame for the population as a whole, it is therefore an obvious candidate for filling such a gap in global child monitoring frameworks. Regular reporting on progress for children cross-nationally is the first step to achieving change for all children, highlighting as it does the relative successes and failures across the globe.
2) Progress for children is a way to prioritize responses to the SDGs
The SDGs set out 169 targets, under 17 Goals, to be achieved in 13 years. Given limited time and public resources, countries will need to select the most effective ways to invest in parts of the SDG framework to maximize returns across the board. A good reason for focusing on children in the SDG framework is that supporting progress for children is one promising way to meeting the long-term, multiple ambitions of the SDG agenda. Investment in children has the longest time over which to accumulate, and the longest period over which to accrue returns (OECD, 2009). Arguments linking early investment in the life course to efficiency gains in later investment are also well-developed (e.g. Heckman, 2008). In contrast, spending on older age groups may result in improvement in living standards for short periods of time, but these will not be sustained if this is achieved by underinvesting in younger generations.
An indication of this life course complementarity in high income countries comes from evidence that shows no countries with high child well-being have low adult well-being (OECD, 2015b).
The timeframe within which the SDGs must bring about change suggests a need to prioritize investment in future generations, through prevention-type/investment policies, and front loading of interventions in relation to the life course, where the longer-term pay-offs can be realized (See Box 1).
Box 1: Sustainability: a focus on the future means a focus on children
Almost 30 years after the first acknowledgement of the importance of sustainable development in a globalising world, the SDGs now embody the principle to ‘meet the needs of the present without compromising the ability of future generations to meet their own needs’ (World Commission on Environment and Development, 1987). Specifically, the vision of the SDGs seeks to balance the achievement of sustainable social development, sustainable economic development, and environment protection into the future (UN General Assembly, 2015).
It is inherent in the principle of sustainability behind the SDGs that the needs of future generations should be considered as part of each action to improve the lot of present generations; and specifically, that the social and economic demands of today are not met at the expense of tomorrow – environmentally or otherwise.
The ways in which this paper addresses the principle of sustainability are two-fold. First, through reference to Goals 11 and 12, which look specifically at pollution experienced by, and environmental awareness of, children – indicators which are key factors in setting a baseline for or considering future risks to our living environments. And second, and perhaps more importantly, is the manner in which this paper prioritizes a focus on children across the goals as a single and fundamental step in meeting long-term ambitions for social and economic progress.
Evidence to support a focus on children in approaches to sustainable social progress is found both in terms of investment strategies and social outcome measures. Regarding investment, the most effective interventions for the future rely on prevention strategies, and ‘front-loading’ of public supports to earlier in the life-course where the longer-term pay-offs can be realized (OECD, 2009).

8
Comparing Child-focused Sustainable Development Goals (SDGs) in High-income Countries: Indicator Development and Overview
Innocenti Working Paper 2017-08
Box 1: Sustainability: a focus on the future means a focus on children (cont.)
The Resolution adopted by the General Assembly on 25 September 2015 ‘Transforming our world: the 2030 Agenda for Sustainable Development’ was unambiguous about the need for investing in all children, and for those children to be provided the safe and nurturing environments required for them to achieve their full potential, to be heard and to participate in change, and be supported in their roles as ‘critical agents’ in the transformation of societies, and sustainable social and economic progress. For decades, through income supports, social insurance policies, childcare, education and health policies, to name but few, countries across Europe and the OECD have seen investment in child development and family support as a fundamental aspect of social and economic development.
The argument made in this paper supports these ideals, and calls – through monitoring key SDG targets related to children in poverty, health, education and more – for all stakeholders to put the needs of children today and the needs of future generations, at the forefront of SDG responses. This stands to reason, as failure to provide for children, or under invest in children, will trade-off the future for the present, and in doing so deny the most basic principle of the sustainable development agenda.
1.2 How this work complements existing UNICEF work to support the SDG process
For the last 70 years, UNICEF has played a leading role in calling for more and better data on the situation of children globally. In recent decades, UNICEF has established surveys and extensive cross-national databases of indicators relating to the well-being of children across the globe (e.g. UNICEF-supported Multiple Indicator Cluster Survey (MICS) programme).
Work to support the SDG process at a global level, for each SDG indicator, involves ‘custodians’ that have been appointed to lead the development of data standards and contribute to national statistical capacity building in order to facilitate in compiling and verifying national data to monitor the SDGs. UNICEF is the sole custodian for indicators in the areas of child nutrition, infant mortality, skilled birth attendants, developmental trajectories of children under 5, child marriage and female genital mutilation (FGM). Once compiled by the custodian, SDG indicators are submitted to the global SDG database (managed by the UN Statistics Division) along with interpretation of the data and trends for the annual SDG progress reports.
To generate the information required to monitor trends in the official indicators at the country level, inevitably places demand on national statistical systems. And UNICEF, as an SDG custodian, continues to commit to improving global data for children by supporting national and international partners to meet the data demands of the SDGs.
Beyond the specific custodian role, UNICEF continues to work closely with other international agencies to support the production of a large number of other child-related global SDG indicators (e.g. UNESCO Institute of Statistics’ Global Alliance to Monitor Learning), and with countries to collect, analyse and use many other child-related indicators during the SDG period.
This study is an example of UNICEF’s work outside of its role as an official custodian to the official and global indicators of the SDGs, focusing as it does on higher-income countries and proxy measures aligned to official targets by goal, determined by relevance to this particular group of countries. The unique contribution of this paper is that it opens discussion around the SDGs and social progress which is both child-focused and high-income country-focused.

9
Comparing Child-focused Sustainable Development Goals (SDGs) in High-income Countries: Indicator Development and Overview
Innocenti Working Paper 2017-08
1.3 Organization of this paper
This paper is organized in to four substantive sections. The following section introduces the main findings of the paper, including a summary table of the data available for monitoring the position, and the recent development of high-income countries in the SDG challenge. Section 3 addresses conceptual and methodological issues related to developing a framework of indicators for child-focused SDGs in high-income countries. Section 4 introduces the indicators, by SDG, discussing as relevant the selection of indicators, the limitations of the data, and the findings. The final section briefly summarises key contributions of the work, and highlights some critical next steps for a range of child-focused SDG stakeholders in high-income countries.
2. MAIN MESSAGES
This background paper, as with previous Report Card studies, provides an overview, or league table, comparing country positions on the topic at hand. This section summarises the key messages from this paper, and presents the league table for Report Card 14.
2.1 Key messages
The key messages from this study are:
� The SDGs provide an opportunity for the development of a global child monitoring framework, and a means by which child investment can be strategized with a view to long-term social progress and environmental sustainability for all countries, to the benefit of all children.
� Headline results show that all high-income countries have areas for improvement, if the SDGs are to be met by 2030 (or in the case of NEET rates – by 2020). In particular, new goals that call on countries to undertake concerted international efforts to improve outcomes (such as in terms of peace or pollution) create some surprising results, and underline the need for monitoring of this type – across a broad range of social progress measures – for even the richest countries to achieve comprehensive social progress.
� In many areas, high income countries are well on course for meeting the SDGs by 2030, (e.g. neo-natal mortality rates, teenage fertility rates, child homicide rates). Nonetheless, there are indicators and targets where standards are slipping across the board (such as in the area of income inequality, child health, and even learning outcomes). Efforts need to be made to ensure that these targets are put back on track, and gender-equitable public policies – particularly those related to lowering income inequality, minimizing the influence of family background on the achievement of basic health and education outcomes, and providing human services that promote child development and parental employment – are likely to be key in these efforts.
2.2 Summary table: league table of SDG measures
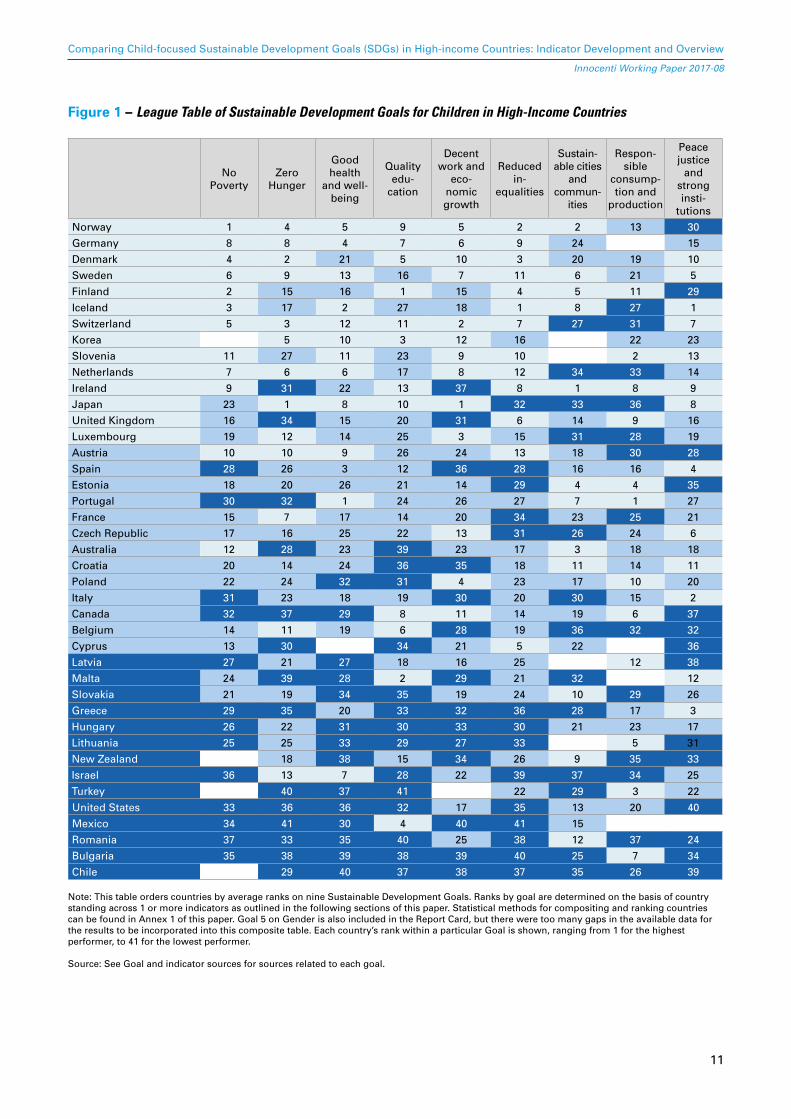
Figure 1 shows the summary league table for child-relevant SDG measures. It is made up of results by country, for 9 goals, and ordered by overall average rank. Ranks represent the position of each country’s performance in each goal starting from 1 – top performer – to 41 – the lowest performer. Each goal is a composite of the indicators presented in the Report Card by goal (e.g. 3 income measures,

10
Comparing Child-focused Sustainable Development Goals (SDGs) in High-income Countries: Indicator Development and Overview
Innocenti Working Paper 2017-08
5 health measures and so on). They are equally weighted and combined using a z-scores method, following the exclusion of statistical outliers (see Annex 1 for methodological details and sensitivity tests).
The summary league table shows which rich countries do better than others across nine social progress goals for children. At a glance, the league table reads well for those countries accustomed to appearing at the top of recent comparisons of human and child development – the Nordic countries, Germany and Switzerland – and less well for lower-income countries of the group, such as Romania, Bulgaria and Chile.
Looking at the table in more detail reveals some key considerations:
� First, the table and the underlying indicators reveal room for improvement across-the-board – all countries rank in the mid- or bottom-third on at least two of the goals. A closer look behind the headline measures shows that the majority of rich countries are moving backwards on key indicators in the goals of reduced inequality (Palma ratio, income gaps), good health and well-being (childhood obesity rates), and quality education (learning outcomes);
� Second, although countries such as Bulgaria and Romania have lower incomes per capita than any other countries in the industrialized world, the presence of countries such as New Zealand and the United States in the bottom reaches of this league table is proof that high national income alone is no guarantee of a good record in sustaining child well-being; and
� Third, although it is the consistency in results across traditional goals – the reduction of poverty, deprivation and inequality, advances in education, health and employment – that drive the overall results of the league table, and reflect where national social policies for children and families are arguably the strongest, these do not associate strongly to the newly-defined social progress goals of environmental sustainability, responsible consumption and production, and peace.
The extended definition of ‘progress’ in the SDGs, and the newly defined goals means the results are not unexpected; rather, they highlight the new challenges the SDGs set for all countries. And unlike the traditional goals that have gone before, these new goals are subject to a range of supra-national influences – such as globalization of markets and economic shocks, pollution, advances in information flows, instability and migration – and demand the attention of all countries, whether high-income or not, in collaboration.
11
Comparing Child-focused Sustainable Development Goals (SDGs) in High-income Countries: Indicator Development and Overview
Innocenti Working Paper 2017-08
Figure 1 – League Table of Sustainable Development Goals for Children in High-Income Countries
No Poverty
Zero Hunger
Good health
and well- being
Quality edu-
cation
Decent work and
eco- nomic growth
Reduced in-
equalities
Sustain- able cities
and commun-
ities
Respon- sible
consump-tion and
production
Peace justice
and strong insti-
tutions
Norway 1 4 5 9 5 2 2 13 30
Germany 8 8 4 7 6 9 24 15
Denmark 4 2 21 5 10 3 20 19 10
Sweden 6 9 13 16 7 11 6 21 5
Finland 2 15 16 1 15 4 5 11 29
Iceland 3 17 2 27 18 1 8 27 1
Switzerland 5 3 12 11 2 7 27 31 7
Korea 5 10 3 12 16 22 23
Slovenia 11 27 11 23 9 10 2 13
Netherlands 7 6 6 17 8 12 34 33 14
Ireland 9 31 22 13 37 8 1 8 9
Japan 23 1 8 10 1 32 33 36 8
United Kingdom 16 34 15 20 31 6 14 9 16
Luxembourg 19 12 14 25 3 15 31 28 19
Austria 10 10 9 26 24 13 18 30 28
Spain 28 26 3 12 36 28 16 16 4
Estonia 18 20 26 21 14 29 4 4 35
Portugal 30 32 1 24 26 27 7 1 27
France 15 7 17 14 20 34 23 25 21
Czech Republic 17 16 25 22 13 31 26 24 6
Australia 12 28 23 39 23 17 3 18 18
Croatia 20 14 24 36 35 18 11 14 11
Poland 22 24 32 31 4 23 17 10 20
Italy 31 23 18 19 30 20 30 15 2
Canada 32 37 29 8 11 14 19 6 37
Belgium 14 11 19 6 28 19 36 32 32
Cyprus 13 30 34 21 5 22 36
Latvia 27 21 27 18 16 25 12 38
Malta 24 39 28 2 29 21 32 12
Slovakia 21 19 34 35 19 24 10 29 26
Greece 29 35 20 33 32 36 28 17 3
Hungary 26 22 31 30 33 30 21 23 17
Lithuania 25 25 33 29 27 33 5 31
New Zealand 18 38 15 34 26 9 35 33
Israel 36 13 7 28 22 39 37 34 25
Turkey 40 37 41 22 29 3 22
United States 33 36 36 32 17 35 13 20 40
Mexico 34 41 30 4 40 41 15
Romania 37 33 35 40 25 38 12 37 24
Bulgaria 35 38 39 38 39 40 25 7 34
Chile 29 40 37 38 37 35 26 39
Note: This table orders countries by average ranks on nine Sustainable Development Goals. Ranks by goal are determined on the basis of country standing across 1 or more indicators as outlined in the following sections of this paper. Statistical methods for compositing and ranking countries can be found in Annex 1 of this paper. Goal 5 on Gender is also included in the Report Card, but there were too many gaps in the available data for the results to be incorporated into this composite table. Each country’s rank within a particular Goal is shown, ranging from 1 for the highest performer, to 41 for the lowest performer.
Source: See Goal and indicator sources for sources related to each goal.

12
Comparing Child-focused Sustainable Development Goals (SDGs) in High-income Countries: Indicator Development and Overview
Innocenti Working Paper 2017-08
3. MEASURING CHILD-FOCUSED SDGS IN HIGH-INCOME COUNTRIES
This section introduces the conceptual and methodological concerns underlying the development of a child-focused SDG framework for high-income countries. In doing so it presents the criteria behind the selection goals, targets and indicators for the study, what the main measurement issues and challenges are, and provides an overview of the framework as a whole.
For a more detailed discussion of the conceptual frame guiding selection and interpretation of child-focused SDGs and indicators in high-income countries, see Bruckauf and Cook (2017).
3.1 Criteria behind the selection of the goals and indicators selected in this paper
Using the internationally agreed indicators as a starting point, this paper selected SDG targets in straightforward ways for ease of monitoring, advocacy and communication. Subject to data availability and relevance to overarching SDGs, the selected indicators are analysed with respect to national averages and trends. Primary considerations for the selection of targets and indicators are that they should be:
� Child-specific: Explicitly relating to children rather than society as a whole (e.g. child poverty vs. population poverty).
� Relevant to higher-income countries: The indicator must reflect the most critical issues of child related policy context in high-income countries, showing meaningful variation across these countries (e.g. obesity vs. stunting).
Criteria for selecting the final measures are then based on whether they are:
� Aligned with existing SDGs and targets: Evaluating the extent to which the indicators match the corresponding SDG target and proposed global indicator.
� Communicable: The extent to which the chosen indicators are advocacy friendly. Can they be easily understood by policymakers and the general public? Do they allow for meaningful interpretation?
� Attainable (policy relevant): Whether the indicator is amenable to national policy, affected by investment, and achievable within the time frame set for the SDGs.
� Available: Measured in a cross-country comparable manner on a regular basis for higher income countries. Otherwise, a critical data gap will be identified and a new measure may be proposed. Examples of countries collecting relevant data will be highlighted as representing good practice.
Additional child-specific indicators may be selected for the Report Card if they are deemed critical to achieving goals set in the broader framework of the SDGs. For example, ensuring equality of opportunity among children is critical to achieving equality for all in the future.
Bruckauf and Cook (2017) discusses in more detail the selection of indicators for a child-focused SDG framework, including: alignment with goals, communicability, implementability, transformational impact, and data availability (as derived from Osborn et al., 2015). This discussion has guided the original selection of indicators.

13
Comparing Child-focused Sustainable Development Goals (SDGs) in High-income Countries: Indicator Development and Overview
Innocenti Working Paper 2017-08
3.2 What are the main measurement issues?
As with other recent attempts to measure dimensions of social progress or well-being goals for children, this study relies on existing data sources – both in terms of administrative series and child and household surveys – to operationalize the goals and targets outlined in the SDG framework. The reliance on existing data sources leads to three data measurement issues that need to be borne in mind when interpreting the findings of this paper.
1. Data availability: This report draws from two types of data sources: i) country-level indicators published on a regular basis through administrative or statistical series by bodies such as, for example, Eurostat and the OECD, and ii) nationally representative micro-data from household- or school-based surveys, such as the European Union Statistics on Income and Living Conditions (EU-SILC) and the Health Behaviour in School-aged Children (HBSC) survey. Where data is not already available, no efforts have been made to collect this data. This situation can lead to compromises in terms of topical, conceptual and/or population coverage, and the time gaps between (or availability of) reported trend series. A common issue is the exclusion of countries from comparisons when they are not part of comparative series or surveys, or do not have equivalent and comparable sources available for use. Moreover, the reliance on existing surveys and series can bring specific conditions a regarding data quality, and potentially forms of bias in estimation, as explained below.
2. Data quality: The ways in which survey data are collected, particularly those collected in schools, can systematically exclude children who are most vulnerable to poor outcomes due to homelessness, institutionalization, poor health, or special educational needs. Surveys exclusions mean surveys are not always fully representative of all children (beyond population coverage set by predetermined age limitations of the survey), and – a particular challenge for the SDG ambition of leaving no one behind – may be biased towards reporting conditions of ‘better-off’ children to varying degrees across countries and years (Richardson and Ali, 2014). These biases cannot be satisfactorily addressed through secondary analysis. However, in this study, on the occasions that non-response rates in survey samples have been high, non-response bias test or exclusions from comparisons have been undertaken as part of data quality assurance efforts.
3. Data interpretation issues: Comparing and juxtaposing national aggregate estimates of social progress or child well-being leads to a number of interpretation issues. In terms of the 22 indicators contributing to the league table, it should be noted that there has been no attempt to prioritize these indicators (following similar studies, an equal weighting method is used [UNICEF, 2007, 2010; OECD, 2009, 2015b]), and valuing these measures differently at the country or individual level would inevitably reshape the results reported here. Moreover the aggregates themselves are measured at a point in time – from population cross-sections in most cases – meaning churn and persistence of experience (whether it is poverty or ill-health) is not observed. Finally, and critical to the full ambition of the SDG framework, is that most of the data has not been disaggregated (in the case of series data, some of it cannot be) leading to limited inference being made on the experiences of particular sub-populations in the countries of study.

14
Comparing Child-focused Sustainable Development Goals (SDGs) in High-income Countries: Indicator Development and Overview
Innocenti Working Paper 2017-08
3.3 An overview of indicators: age coverage, child-centeredness and policy relevance
Table 1 lists the indicators included in the paper, including selected information related to selection criteria outlined above. Nine columns from left to right cover: the goals; targets within the goals; official SDG indicators where these can be readily aligned to the indicators included in this paper; the indicators included in this paper and Report Card 14; the age groups covered; whether the indicators in Report Card 14 differs from the official indicator; the year the data refers to; policy relevance; and whether children are the unit of analysis, or whether this is households with children, or adults providing retrospective reports of their childhood experiences.
Ten goals are covered in the paper, each with varying numbers of targets and indicators, depending on the extent to which the target is child-relevant, relevant to high-income settings, and data availability (see Section 3.1).
Goal 1: End poverty in all its forms covers three indictors of relative income poverty, the reduction rate of social transfers on child income poverty, and multidimensional child poverty. Most recent data for these indicators cover children across the entirety of the child life course (0-17), with high-policy relevance – these results are directly influenced by social protection and child welfare policies – and household survey data are weighted to make children the unit of analysis.
Goal 2: Ending hunger, achieving food security and improved nutrition covers, food insecurity and overweight or obese children (11-15 years). Data for both indicators are from around 2014, and as with ‘end poverty’ are highly policy relevant (including through health and school-based interventions for physical activity / obesity), but neither indicator reflects experiences in later adolescence (over age 15). Data for malnutrition in the form of stunting or wasting, is replaced with malnutrition in the form of obesity, given the focus on high-income countries and prevalence of overweight and obesity cases in comparison to other forms of malnutrition. Data on food insecurity is derived for the Gallup World Poll, in which individuals aged over 15 report on their household experiences. This means the child-centeredness of the indicators from this survey can only be partial, as they are interpreted as proportions of children living with individuals in households reporting specific conditions/experiences, rather than household experiences.
Goal 3: Ensure healthy lives and promote well-being covers, neonatal mortality, adolescent suicide, adolescent self-reported mental health, experiences of drunkenness (ages 11-15), and teenage fertility rates. Health data, as with previous studies (OECD, 2009, UNICEF, 2007 and others) are most prevalent, and the availability of surveys and series that included different estimates (for example, infant mortality estimates (before age 1 for instance, or age 5 even), or a range of health behaviours (drug use, sexual debut, and smoking)) forced a selection of indicators that ‘best fit’ the selection criteria outlined above (in consultation with the Report Card Advisory Board members). For instance, traffic accidents were not selected (target 3.6); neither were smoking rates – despite available data. However, mental health outcomes (which are on the increase, affecting around one quarter of the adolescent population) and drunkenness were included as being both prevalent, implementable, and capable of transformational impact if addressed effectively. Child age coverage focusses on early infancy, or adolescence – with data for early childhood, and middle childhood largely absent. Nonetheless, all indicators are based on data collected on or from children themselves, and so a strongly child-centred.

15
Comparing Child-focused Sustainable Development Goals (SDGs) in High-income Countries: Indicator Development and Overview
Innocenti Working Paper 2017-08
Goal 4: Ensure inclusive education and equitable quality education for all, covers children with basic literacy competencies (age 15), children in organized learning in the preschool year, and preschoolers in center-based care for at least an hour a week. Though the latter indicator is not included in the final Goal 4 calculations, the first two education measures both strongly align to the stated indicators in the SDG framework, and are used to compare countries positioning on progress in child-relevant SDGs. Data are from 2015 or 2014, are strongly child-centred, and highly policy relevant (e.g. public childcare policies, school and education policies).
Goal 5: Achieve gender equality, and empower girls, includes just one indicator on women (18-29) reporting experiences of sexual violence before the age of 15. This indicators is taken from a survey of women who retrospectively report experiences of violence across their life course. The measure itself aligns strongly to the SDGs, but is only available for European countries, has small sample sizes (in the case of certain items), and is retrospective, self-reported data, collected in 2012. The Goal 5 section of the paper also includes reference to two indicators on the proportion of adults who agree that, ‘University education is more important for boys’, and differences in girls and boys participation in housework. In both cases these are indicative of the differences experienced by boys and girls in relation to gender equality in high-income countries, but neither indicator has a sufficient number of countries covered to be included in the goal-level comparisons.
Goal 8: Promote sustained, inclusive economic growth covers NEET rate of 15-19 year olds and children in jobless households. NEET rates are directly aligned to the SDG target 8.6, but here the focus is on 15-19 year-olds, rather than up to age 24 (to retain a focus on children). The children in jobless households measure is linked to target 8.5, which calls for full and productive employment and decent work for all men and women, and is a determinant of children’s poverty risks and later life outcomes. Both data are relatively recent (2014) and are child centred measures susceptible to policy interventions of various kinds (active labour market policies, scholarships, conditional cash transfers, etc.).
Goal 10: to Reduce inequality within and among countries covers the Palma ratio for households with children, the income gap between the median and the poorest 10% (households with children), and the impact of socio-economic difference on learning outcomes. In each case, these indicators align to targets in Goal 10 related to achieving economic growth in a progressive manner (benefiting the poorest 40% of the population – 10.1), promoting social, economic and political inclusion of all (10.2), and ensuring equal opportunity and reduce inequalities of outcome, including by eliminating discriminatory laws, policies and practices (10.3). However, they do not align exactly to indictors proposed through the official discussions. Nonetheless, they do operationalize child-relevant aspects of the targets in high-income settings in terms of progressive growth, economic inclusion, and equalities of outcomes and associated policies (e.g. school policies). The data, from 2014 and 2015, are highly policy relevant, and focus on children themselves or households with children.
Goal 11: Making cities inclusive, safe and resilient covers one indicator of air pollution, directly linked to target 11.6 and indicator 11.6.2. The data are from 2013, and cover children of all ages, 0-19 inclusive.
Goal 12: Ensure sustainable production and consumption also includes just one indicator, on children’s awareness of environmental issues. The data are taken from the Programme for International Student Assessment (PISA) survey, in 2015, so are collected directly from 15 year old children in 39 of the 41 countries covered in this paper.

16
Comparing Child-focused Sustainable Development Goals (SDGs) in High-income Countries: Indicator Development and Overview
Innocenti Working Paper 2017-08
Goal 16: Promote peaceful and inclusive societies for sustainable development, covers child homicides (0-19), experiences of bullying (11-15 years), and women aged 18-29 reporting experiences of physical violence before the age of 15. As with Goal 5, the data on retrospective violence is reported, but not included in composite calculations because of low country coverage. It is also not sufficiently child-centred and reasonably dated compared to other sources. Homicide rates and bullying are either fully or partially aligned to official indicators in the SDG framework in Goal 16, and are highly policy relevant (there are examples of effective interventions in both areas in high-income countries – see KiVa anti-bullying programme in Finland for instance), and are collected directly from series data or surveys of children.
Table 1: Indicators by goal and target, and selected criteria
Goal Target Official indicator RC 14 Indicator Age
group
Differs from
official?Year Policy
relevanceChild-
centred
1: Ending poverty in all its forms
1.2 1.2.1
Relative child poverty (50% of the median house-hold income)
0 to 17 No 2013 3 Yes
1.2 1.2.2
Proportion of children living in multidimensional poverty
0 to 15 Yes 2014 3 Yes
1.3 1.3.1Child poverty rates reduction due to taxes and transfers
0 to 17 Partial 2013 3 Yes
2: Ending hunger, achiev-ing food security and improved nutrition
2.1 2.1.2
Prevalence of mod-erate or severe food insecurity in households with at least one child under age of 15
under 15 No 2014 3 Partial
2.2 2.2.2 Obesity in early adolescence (rates) 11 to 15 Partial 2014 3 Yes
3: Ensure healthy lives and promote well-being
3.2 3.2.1 Neo-natal mortality rate
0 to 4 weeks No 2015 2 Yes
3.4 3.4.2 Suicide rates of older adolescents 15 to 19 No 2012/3 2 Yes
3.4 ---
Adolescents reporting two or more mental health symptoms per week
11 to 15 Partial 2013/4 2 Yes
3.5 3.5.2 Drunkenness in early adolescence 11 to 15 No 2009/10 2 Yes
3.7 3.7.2 Adolescent birth rate 15 to 19 No 2014 3 Yes

17
Comparing Child-focused Sustainable Development Goals (SDGs) in High-income Countries: Indicator Development and Overview
Innocenti Working Paper 2017-08
Table 1: Indicators by goal and target, and selected criteria (cont.)
Goal Target Official indicator RC 14 Indicator Age
group
Differs from
official?Year Policy
relevanceChild-
centred
4: Ensure inclusive education and equit- able quality education for all
4.1 4.1.1
Young people at the end of lower secondary reach-ing at least mini-mum proficiency in three core subjects
15 No 2012 2 Yes
4.2 4.2.2
Participation rate in organized learning (one year before official age for entering primary school)
3 to 6 No 2014 3 Yes
4.2 4.2.2
Children (aged 3+) attending centre based services for 1+ hours per week
3 to 6/7 Yes 2014 3 Yes
5: Achieve gender equality, and empower girls
5.2 5.2.1/2
Percentage of women aged 18-29 who reported having experi-enced sexual violence before the age of 15
under 15 No 2012 3 No
8: Promote sustained, inclusive economic growth
8.6 8.6.1
Proportion of youth not in education, employ-ment or training
15 to 19 No 2014 2 Yes
10: Reduce inequality within and among countries
10.1 10.1.1
Ratio of growth rates in incomes of household with children in the 40th percentile and 90th percentile / Palma ratio
0 to 17 No 2014 3 Partial
10.3 ---Relative income gap (bottom-end inequality)
0 to 17 Partial 2014 2 Partial
10.2 ---
Score point difference in learning outcomes based on socio-economic status
15 Yes 2015 3 Yes
11: Making cities inclusive, safe and resilient
11.6 11.6.2
Annual average PM2.5 air pollution concentrations in cities (child population weight-ed)
0-19 Yes 2013 3 Yes

18
Comparing Child-focused Sustainable Development Goals (SDGs) in High-income Countries: Indicator Development and Overview
Innocenti Working Paper 2017-08
Table 1: Indicators by goal and target, and selected criteria (cont.)
Goal Target Official indicator RC 14 Indicator Age
group
Differs from
official?Year Policy
relevanceChild-
centred
12: Ensure sustainable production and con-sumption
12.8 12.8.1
Students familiar with 5 or more environmental issues (%)
15 Yes 2015 3 Yes
16: Promote peaceful and inclusive societies for sustainable develop-ment
16.1 16.1.1 Homicide rates of children (0-19) 0 to 19 No 2012/3 3 Yes
16.1 16.1.3
Children being bullied more than two or three times in the last month
11 to 15 Partial 2013/4 3 Yes
16.1 16.1.3
Percentage of women reporting aged 18-24 who reported having experienced physical violence before the age of 15
under 15 No 2012 2 No
Notes: Age group years are inclusive. Differs from official: ‘No’ means indictors matches the indicators suggested in the Inter- Agency Report and Expert Groups on the SDGs (UN, 2016). ‘Partial’ means indicator matches some substantive attributes of the target or the proposed indicators for the target. ‘Yes’ means when indicator is not explicitly referenced in targets or indicators of UN Final list of proposed indicators (UN 2016). ‘Year’ refers to reference year (not data collection year). ‘Policy relevance’ refers to score of implementability as categorized by Bruckauf and Cook (2017). ‘Implementability’ asks whether the indicator is amenable to national policy, affected by investment, and achievable within the time frame set for the SDGs. And is scored as follows: ‘0’ progress on the indicator is not achievable regardless of the resources invested; ‘1’ Progress on this indicator is somewhat achievable but highly constrained due to cultural, social norms and other issues, might require a longer timeframe; ‘2’ the issue is responsive to policy intervention but is challenging /will require a long time frame due to cultural, social norms, complexity, political feasibility etc.; and, ‘3’ the issue is responsive to policy intervention and the progress can be achieved within the outlined SDG timeframe. Child centered: ‘Yes’ children are the unit of analysis; ‘Partial’ households with children are the unit of analysis (parent reported), ‘No’ refers to childhood issues, but children are not the unit of analysis.
4. EVIDENCE ON CHILD-FOCUSED SDGS IN HIGH-INCOME COUNTRIES
This section presents the indicators selected and presented in Table 1. Indicators are presented in order by SDGs, including national level outcomes and trends. Each indicator is aligned to an SDG target.
4.1 Goal 1: End poverty in all its forms
Sustainable Development Goal 1 takes on the issue of poverty and calls for an end to the problem in all its manifestations. This section of the paper introduces three measures of poverty in high-income countries: relative child income poverty, the effect of taxes and transfers on the market income poverty rates experienced by households with children, and multidimensional poverty.
Figure 2 reports the country standings on average across three measures in SDG 1, showing that Nordic countries are amongst the more advanced countries on this goal, and that Bulgaria, Israel, Mexico and Romania have the furthest to go.

19
Comparing Child-focused Sustainable Development Goals (SDGs) in High-income Countries: Indicator Development and Overview
Innocenti Working Paper 2017-08
Figure 2 – End poverty in all its forms: Nordic countires are consitently amongst the high performers
75 80 85 90 95 100 105 110 115 120
NorwayFinlandIceland
DenmarkSwitzerland
SwedenNetherlands
GermanyIrelandAustria
SloveniaAustralia
CyprusBelgium
FranceUnited Kingdom
Czech RepublicEstonia
LuxembourgCroatia
SlovakiaPoland
JapanMalta
LithuaniaHungary
LatviaSpain
GreecePortugal
ItalyCanada
United StatesMexico
BulgariaIsrael
Romania
Note: The result is an average of country performance across three indicators: child income poverty (0-17 years of age), multidimensional poverty (0-15 years), and effectiveness of social transfers (0-17 years). Chile, Korea, New Zealand, and Turkey are excluded from the calculation of Goal 1 due to insufficient data (each country reports on only 1 of the 3 indicators for this goal). This chart – and the others at the head of each goal section in this Report Card – is a composite of the indicators in the section. Read 100 as the average country performance for the goal, and 10 points as a standard deviation from this overall average. A greater than 5-point difference from 100, or half a standard deviation, can be interpreted as higher or lower than average (for sample of around 30 cases, half a standard deviation is equivalent to a 99-per-cent confidence interval). Countries with a difference of 10 points or more from the average can be considered as ‘high performing’ or ‘low performing’, while those differing by 20 points or more can be considered ‘leaders’ or ‘laggards’.
Source: Author’s calculations using data sourced for Goal 1. See figure sources in this section.
4.1.1 Relative child poverty (50% of the median household income)
Target 1.2 of SDG 1 specifically relates to halving the proportion of children living in poverty. Poverty risks in childhood can have lifelong effects (Brooks-Gunn and Duncan 1997; Corak 2006; Esping-Andersen and Myles 2009; Gregg and Machin 2001; Griggs and Walker 2008) and can be passed on to future generations (OECD, 2009), embedding, and even increasing, inequality in society.
Child poverty remains high in high-income countries with an estimated 1 in 5 children living in monetary poverty (Figure 3). This average rate of poverty has changed little in recent years, although differences in rates and trends at the national level are large. Child poverty is almost 4 times higher in Romania than Denmark. Overall, countries in the Mediterranean basin and the Americas have the highest rates of relative child income poverty, whilst Nordic countries have the lowest rates.
In the last decade, relative child income poverty rates have fallen in Canada, Cyprus, Iceland, Finland, Mexico, Switzerland, and the United Kingdom. Latvia, Lithuania, Poland and the United Kingdom, whereas Bulgaria, Hungary, Luxembourg, Malta, Romania, Slovenia and Spain have experienced

20
Comparing Child-focused Sustainable Development Goals (SDGs) in High-income Countries: Indicator Development and Overview
Innocenti Working Paper 2017-08
notable increases. The financial crisis and global recession had varying effects on child poverty rates (UNICEF, 2014b); trends in poverty rates in Ireland and the United Kingdom contrast the Greek and Spanish rates because more households higher up the income distribution were also affected by the economic downturn.
Figure 3 – An average of one in five children in rich countries lives in relative income poverty Percentage of children aged 0-17 living in households with incomes lower than 60% of the median, 2014 and 2008
9.2%
10.0
%
10.2
%
10.9
%
11.5
%
12.8
%
13.7
%
14.7
%
14.8
%
14.8
%
15.1
%
15.1
%
17.5
%
17.7
%
18.2
%
18.2
%
18.3
%
18.8
%
19.2
%
19.7
%
19.7
%
19.8
%
21.1
%
22.2
%
22.3
%
23.5
%
24.1
%
24.3
%
25.0
%
25.1
%
25.4
%
25.5
%
25.5
%
25.6
%
29.4
%
30.5
%
31.6
%
31.7
%
31.8
%
36.1
%
39.3
%
0%
5%
10%
15%
20%
25%
30%
35%
40%
45%
Denm
ark
Icel
and
Nor
way
Finl
and
Kore
a
Cypr
us
Net
herla
nds
Czec
h Re
publ
ic
Slov
enia
Switz
erla
nd
Swed
en
Germ
any
Aust
ralia
Fran
ce
Japa
n
Aust
ria
Irela
nd
Belg
ium
Slov
akia
Uni
ted
King
dom
Esto
nia
New
Zea
land
Croa
tia
Cana
da
Pola
nd
Lith
uani
a
Mal
ta
Latv
ia
Hung
ary
Italy
Luxe
mbo
urg
Chile
Gree
ce
Port
ugal
Uni
ted
Stat
es
Spai
n
Mex
ico
Bulg
aria
Turk
ey
Isra
el
Rom
ania
2014 2008 Country average
Country average 2014: 21.0%
Note: The relative child poverty rate shows the proportion of each nation’s children living in a household where disposable income is less than 60% of the national median (after taking taxes and benefits into account and adjusting for family size and composition using the OECD modified equivalence scale).
Source: European Union Statistics on Income and Living Conditions (EU-SILC) for European Union countries and Iceland, Norway and Switzerland; Household, Income and Labour Dynamics (HILDA) for Australia; Canadian Income Survey (CIS) for Canada; La Encuesta de Caracterización Socioeconómica Nacional (CASEN) for Chile; Household Expenditure Survey (from Luxembourg Income Study) for Israel; Ministry of Health, Labour and Welfare’s Comprehensive Survey of Living Conditions for Japan; Combined data of Household Income and Expenditure Survey and Farm Household Economy Survey for Korea; El Módulo de Condiciones Socioeconómicas de la Encuesta Nacional de Ingresos y Gastos de los Hogares (MCS-ENIGH) for Mexico; Household Economic Survey for New Zealand (estimates taken from Perry, B (2016), “Household Incomes in New Zealand: Trends in indicators of inequality and hardship, 1982 to 2015”. Ministry of Social Development, Wellington); Income and Living Conditions Survey for Turkey; Current Population Survey 2013, Annual Social and Economic Supplement (from Luxembourg Income Study) for USA. Reported 2014 data for Australia, Chile and Korea refers to 2015, for USA and New Zealand refers to 2013 and for Israel and Japan refers to 2012. Reported 2008 data for Canada, Israel and USA refers to 2007.Reported 2008 data on inequality indicators for Japan relate to 2006. Income estimates for Chile are based on equivalized total household income and are not directly comparable.
4.1.2 Reduction in relative child poverty rates due to taxes and transfers
Target 1.3 of SDG 1 relates to the implementation of nationally appropriate social protection systems for all, including floors to achieve substantial coverage of the poor and vulnerable by 2030. Social protection is a key tool for governments seeking to limit the effects of poverty on their population, or encouraging engagement with the labour market or access to important human services such as school (for example, active labour market policies, working tax credits, or conditional and unconditional cash transfers). Indicator 1.3.1 calls for coverage rates for social protection systems/floors, distinguished by sub-populations, including children. Head counts of coverage, however, do not represent the effect of

21
Comparing Child-focused Sustainable Development Goals (SDGs) in High-income Countries: Indicator Development and Overview
Innocenti Working Paper 2017-08
that coverage on national poverty rates directly. Therefore Figure 4 reports the difference between poverty rates before and after social transfers as a proportion of the before social transfer poverty rate. The indicator in Figure 4, while representing the effect of social protection on child poverty at the aggregate level, does not clearly indicate the variable effects at the household level within the country, nor the number of families with children that may be entirely excluded from social protection support (e.g. homeless families).
On average, social protection systems in high-income countries lift 2 out of 5 children from low incomes, who would have otherwise lived in relative poverty (37.5% - Figure 4). The effects of social protection systems on reported poverty rates in high-income countries vary a great deal – from reduction rates of around 5% in Mexico, to over 65% in Finland and Iceland.
Since 2008, and the onset of the financial crisis and global recession, trends in social protection effectiveness for children have been mixed. Around 10 countries have seen reduction rates fall significantly, with the Czech Republic, Hungary, Romania, and Sweden marking falls of around 10 per cent or more. In contrast, seven countries have seen a notable increase in the effectiveness of social protection systems in reducing relative child income poverty rates; Cyprus, Iceland, Switzerland, and the United Kingdom have seen improvements of around 10 percentage points or more, and Greece, Lithuania and Latvia have seen improvements in the region of 5 to 7 percentage points.
Figure 4 – Finland, Iceland and Norway are most effective in reducing child poverty Percent reduction in the rate of child poverty due to social transfers, 2014 and 2008
66%
65%
64%
61%
58%
55%
54%
53%
53%
52%
50%
50%
48%
46%
45%
44%
43%
43%
40%
40%
36%
33%
31%
27%
26%
24%
24%
24%
22%
19%
18%
18%
18%
12%
10%
8%
6%
0%
10%
20%
30%
40%
50%
60%
70%
80%
2014 2008 Country average
Country average 2014: 37.5%
Note: Reduction in child poverty is measured as a proportional difference between child poverty rates before and after social transfers. Child poverty rates are measured using income thresholds at 60% of the median household income of the total population, before and after social transfers. Missing countries: Chile, Korea, New Zealand, and Turkey.
Source: See Figure 3.

22
Comparing Child-focused Sustainable Development Goals (SDGs) in High-income Countries: Indicator Development and Overview
Innocenti Working Paper 2017-08
4.1.3 Proportion of children aged 0-15 living in multidimensional poverty
As noted previously, it is well established that poverty harms children not only during childhood, but also has negative consequences on their adult outcomes. Critics of income measures of child poverty, however, point to a reality where deprived children may be ‘hidden’ in higher-income households, as children often have no resources of their own or no say in how household resources are allocated (Feeny and Boyden, 2004). To address this limitation, researchers have developed measures to indicate whether children are deprived of items at home that are important to their well-being and development (see for examples: Townsend, 1979; Gordon et al, 2003; Guio et al, 2012; and de Neubourg et al., 2012).
Target 1.2, and its call for “reducing at least by half the proportion of men, women and children of all ages living in poverty in all its dimensions according to national definitions” by 2030, is clearly multidimensional, demanding a focus on both monetary and non-monetary aspects of poverty. Yet despite this multidimensionality, poverty has so far only been reported in monetary terms in the official SDG database (UNStats, 2016).
For the purposes of this paper, multidimensional poverty is included and reported as the proportion of children in a country deprived in at least two of the following seven dimensions: nutrition; clothing; educational resources; leisure activities; social activities; information access; and quality of housing. Data on deprivation is derived from the European Statistics on Income and Living Conditions (EU-SILC) and so is restricted to European coverage only. For more detail on the construction and validation of this indicator, see Chzhen et al., (2017).
Figure 3 shows that with as many as 1 in every 3 children being deprived in at least two dimensions, the proportion of multidimensionally poor children is higher than the average rate of income-poor children. It is clear therefore, that even in non-income-poor families, there are child poverty challenges to be addressed.
Overall, country experiences differ widely, with only 11 per cent of Swiss children being deprived, compared to 85 per cent of children in Romania. Along with Switzerland, fewer than one in five children are multidimensionally poor in the Nordic countries and in the Netherlands. Over half of all children are multidimensionally poor in Bulgaria, Hungary, Italy and Slovakia. Almost all countries have seen a reduction in deprivation since 2009; the exceptions being three countries amongst those most affected by the financial crisis of 2008 (with different impacts on income poverty): Iceland, Italy and the United Kingdom (but note that there is a break in the series in the United Kingdom, so the trends have to be interpreted with caution). For further analysis of overlaps between different dimensions of child poverty, as well as variation in child poverty risks by key household-level characteristics across 30 European countries, (see Chzhen et al., 2017).

23
Comparing Child-focused Sustainable Development Goals (SDGs) in High-income Countries: Indicator Development and Overview
Innocenti Working Paper 2017-08
Figure 5 – One in three European children is deprived in two or more ways Multidimensional child poverty (two or more dimensions), 2014
11%
12%
13%
16%
18%
18%
21%
21%
23%
23%
24%
24%
26%
31%
31%
34%
35%
36%
38%
39%
40%
44%
45%
46%
47%
51%
53%
58%
77%
85%
0%
10%
20%
30%
40%
50%
60%
70%
80%
90%
100%
2014 2009 Country average
Country average 2014: 34.7%
Note: Material deprivation is measured as children who are deprived of 2 or more of the following: nutrition, clothing, educational resources, leisure activities, social activities, information access, or housing. Data is for European countries only. Norway is excluded due to missing data. The Country average is unweighted. Missing countries: Australia, Canada, Chile, Israel, Japan, Korea, Mexico, New Zealand, Norway, Turkey, and the United States.
Young people were asked about each of these symptoms with responses ranging “About every day,” “More than once a week,” “About every week,” “About every month,” “Rarely or never”. The measure presented here is based on a scale of these four items (0-4) validated in a number of studies and qualitative assessments (Gariepy, G., McKinnon, B., Sentenac, M. et al., 2016; Elgar, et al 2015; Haugland & Wold, 2001). Responses were coded as a dummy variable for two or more psychological symptoms experienced daily.’
Source: Chzhen et al (2017), SDG 1.2: Multidimensional Child Poverty in the European Union, Innocenti Working Paper, 2017-07, UNICEF Office of Research - Innocenti, Florence.
4.2 Goal 2: Ending hunger, achieving food security and improved nutrition
Sustainable Development Goal 2 takes on the challenges of ending hunger, achieving food security and improved nutrition. It also calls for the promotion of sustainable agriculture, which due to the child-centred approach of this study, is not addressed here. This section of the paper introduces two related measures: food insecurity and the proportion of adolescents (aged 11-15), who are obese or overweight.
Figure 6 reports the country standings on average across the two measures in SDG 2. Japan is a clear leader in terms of meeting the child-relevant aspects of Goal 2, with Denmark, the Republic of Korea, Norway and Switzerland not far behind. Mexico and Turkey stand out as being much further behind other OECD or EU countries on this Goal; a result driven by high levels of food insecurity in households with children.

24
Comparing Child-focused Sustainable Development Goals (SDGs) in High-income Countries: Indicator Development and Overview
Innocenti Working Paper 2017-08
Figure 6 – Ending hunger, achieving food security and improved nutrition: Mexico and Turkey lag far behind other countries on this Goal
70 75 80 85 90 95 100 105 110 115 120
JapanDenmark
SwitzerlandNorway
KoreaNetherlands
FranceGermany
SwedenAustria
BelgiumLuxembourg
IsraelCroatiaFinland
Czech RepublicIceland
New ZealandSlovakiaEstonia
LatviaHungary
ItalyPoland
LithuaniaSpain
SloveniaAustralia
ChileCyprusIreland
PortugalRomania
United KingdomGreece
United StatesCanada
BulgariaMalta
TurkeyMexico
Note: The result is an average for country performance across two indicators: food insecurity (0-14 years of age), and rates of overweight and obese children (11-15 years).
Source: Author’s calculations using data sourced for Goal 2. See figure sources in this section.
4.2.1 Prevalence of moderate or severe food insecurity in households with at least one child under age 15
Target 2.1 aims to end hunger and ensure access by all people to safe, nutritious and sufficient food. For infants this includes breastfeeding, which is not referenced in the SDG targets (see Box 2). Food insecurity is one of the most critical issues of a child-related policy agenda and failing to ensure that children can access nutritious food all year round is detrimental to their well-being. Food insecurity in childhood is associated with a range of negative developmental outcomes such as behavioural problems and poor health (Casey et al. 2005), poor school performance (Bernal et al. 2014; Saha et al. 2010), less-healthy diets and insufficient intake of micronutrients like calcium, iron and zinc (for a broad overview see Jaffe et al., 2014; Jyoti et al., 2005; Casey et al. 2005; and Fram et al. 2015).
The official SDG database provides data on food insecurity using the Food Insecurity Experience Scale (FIES), and will report results by country. However these figures are for the total population and not focused solely on child households (UNStats, 2016).
In order to compare food insecurity from a child-centred perspective in rich countries, Figure 7 reports the prevalence of moderate and severe food insecurity among individuals living in households with

25
Comparing Child-focused Sustainable Development Goals (SDGs) in High-income Countries: Indicator Development and Overview
Innocenti Working Paper 2017-08
children, as defined by the established definition that builds on the FIES scale. Results show that 1 in 8 children live in homes where individuals are reporting that access to safe and nutritious food is irregular. In Croatia, Germany, the Republic of Korea, Japan, Sweden and Switzerland the rates of food insecurity are lowest, at 5 per cent or less (much lower than the respective income poverty rates). In Bulgaria, Lithuania and Romania the rates are as high as 20 per cent. In Mexico and Turkey, one third of children under 15 live with individuals reporting that they do not have enough food. Notably, Ireland, the United Kingdom and the United States are among the worst performers despite the relative wealth they hold.
Figure 7 – Food insecurity is high in some of the world’s richest countries Share of children below the age of 15 living with a respondent who is food insecure, 2014-15
1.4%
4.0%
4.8%
4.9%
4.9%
5.0%
5.1%
6.0%
7.2%
7.4%
7.7%
7.7%
8.4%
8.5%
8.8%
8.8%
8.9%
9.7%
10.5
%
10.8
%
10.9
%
11.1
%
11.8
%
11.9
%
12.0
%
12.7
%
12.9
%
14.2
%
15.7
%
16.0
%
17.0
%
17.6
%
17.9
%
18.2
%
19.5
%
19.6
%
21.5
%
25.8
%
26.3
%
33.4
%
34.9
%
0%
5%
10%
15%
20%
25%
30%
35%
40%
45%
Japa
nSw
eden
Kore
aCr
oatia
Germ
any
Switz
erla
ndN
orw
ayFr
ance
Luxe
mbo
urg
Isra
elAu
stria
Finl
and
Icel
and
Denm
ark
Net
herla
nds
Italy
Czec
h…Be
lgiu
mM
alta
Slov
akia
New
Zea
land
Esto
nia
Hung
ary
Cana
daSp
ain
Slov
enia
Latv
iaPo
land
Gree
ceAu
stra
liaCh
ileCy
prus
Irela
ndPo
rtug
alU
nite
d…U
nite
d St
ates
Lith
uani
aBu
lgar
iaRo
man
iaTu
rkey
Mex
ico
2014/2015 Country average
Country average 2014: 12.7%
Note: Food insecurity is measured by the Food Insecurity Experience Scale (FIES), which was created by the Voices of the Hungry project at FAO. Data comes from Gallup World Poll Surveys, which fielded the FIES, from 2014 and 2015. The Country average is unweighted.
Source: Pereira, A., Handa, S., and Holmqvist, G (2017). Prevalence and correlates of food insecurity among children across the globe, Innocenti Working Paper 2017-0, UNICEF Office of Research, Innocenti, Florence.
4.2.2 Proportion of children aged 11-15 who are obese or overweight
Alongside the ambition to agree international targets to end stunting and wasting in the under 5 population by 2025, target 2.2 of the SDGs aims to end all forms of malnutrition, and specifically address the nutritional needs of adolescent girls (amongst others). Official SDG target indicators on malnutrition use measures of growth (height, and weight for height) and aim not only to reflect when children are smaller than average, but also when children are heavier than average. Malnutrition in terms of children who are overweight and obese is a more pressing challenge in high-income settings than in other parts of the world, and is commonly explained by a combination of children eating too much unhealthy food, low levels of exercise and increasingly sedentary lifestyles. Being overweight creates a number of challenges for children’s lives today and for their futures, and has been linked to

26
Comparing Child-focused Sustainable Development Goals (SDGs) in High-income Countries: Indicator Development and Overview
Innocenti Working Paper 2017-08
multiple health conditions in childhood, lower self-esteem, and a heightened risk of cardio-vascular diseases and diabetes in adulthood (see OECD, 2015).
Figure 8 compares rates of 11 to 15 year-olds who are obese and overweight in high-income countries. Data is collected from the children themselves, and used to calculate BMI from their height and weight. In many countries, an inability or reticence to self-report height or weight means these estimates are to be interpreted cautiously, although they have been validated to ensure non-response bias in terms of children’s age and sex, and family wealth does not significantly affect the estimates. Results show that on average, one in seven children in high-income countries is overweight or obese, and that in the past decade (although some falls have been noted in the past 5 years) rates of overweight children have increased in almost all countries.
Figure 8 – Rates of obesity have increased in most high-income countries Rates of 11-15 year olds who are obese or overweight, 2014-15
8.3%
10.0
%
10.2
%
10.4
%
11.7
%
11.8
%
12.6
%
13.1
%
13.3
%
13.8
%
14.2
%
14.3
%
14.4
%
14.5
%
14.6
%
14.7
%
15.0
%
15.2
%
15.3
%
15.3
%
16.1
%
16.2
%
17.3
%
17.5
%
18.0
%
18.1
%
18.4
%
20.9
%
25.0
%
27.4
%0%
5%
10%
15%
20%
25%
30%
35%
2014 2006 2010 Country average
Country average 2014: 15.2%
Note: Data for Ireland and the United Kingdom have been excluded due to high non-response rates (over 50% of sampled children). The United States did not take part in HBSC study in 2014/15. Belgian estimates are based on population weights for regional samples (excluding the Brussels region). The Country average is unweighted. Missing countries: Australia, Chile, Cyprus, Ireland, Japan, Korea, Mexico, New Zealand, Turkey, the United Kingdom and the United States.
Source: HBSC, various waves.
In the ten countries with significantly above-average rates of overweight children, eight are from the southern European region (the exceptions being Canada and Hungary). Ten countries with significantly lower than average rates are mostly from northern Europe (France and Switzerland are the exceptions here). Countries reporting the highest trend increases in obesity include: the Baltic countries, Bulgaria, Canada, Poland, Slovakia and Sweden. Falls in rates of overweight children at much more modest levels (of around 1-2 percentage points) have been seen in Denmark, Italy, Malta and Portugal.

27
Comparing Child-focused Sustainable Development Goals (SDGs) in High-income Countries: Indicator Development and Overview
Innocenti Working Paper 2017-08
Box 2: Prevalence of breastfeeding
Although breastfeeding has long been promoted by UNICEF, and there is a wealth of evidence from high income countries that breastfeeding contributes to children’s cognitive development and healthy development (OECD, 2011; Victora, et al, 2016), SDG targets relating to breastfeeding rates were not agreed.
Nevertheless, the critical role of breastfeeding in providing the required nutrition for new-born and infant development – which in turn can make substantial contributions to SDGs related to later nutrition, health, education, and child and maternal survival rates (Victora, et al. 2016) – provides an opportunity to compare rates and monitoring methods of breastfeeding in high-income countries. This is particularly relevant for this Report Card, given that breastfeeding is one of a few positive health behaviours where rich countries tend to lag behind poorer ones (ibid).
The Table below is drawn from the global review of breastfeeding rates and effects undertaken by Victora and colleagues, and published in the Lancet in early 2016. Although some of the data is quite old, and does not refer to solely exclusive breastfeeding, results indicate that across high-income countries the proportion of mothers having ever breastfed is high on average, with only France and Ireland reporting rates below 75%. By the time the infant is 6 months old, between a third and a half of mothers who initiated are no longer breastfeeding, and in countries such as Canada, Greece and the United Kingdom, falls are more substantial. At 12 months, rates continue to fall, but variation in falls and rates themselves vary widely – only in Japan and Turkey are the majority of mother’s breastfeeding to some degree; in Denmark, Ireland and United Kingdom rates are below 5 percent.
Country Reference yearEstimates by time and prevalence
Ever breastfed At 6 months At 12 months
Australia 2010 92 56 30
Austria 2006 93 42 16
Canada 2011/12 89 30 9
Chile 2011/12 95 41 21
Czech Republic 2005 96 42 16
Denmark 2013 13 3Finland 2010 92 58 34
France 2012/13 63 23 9
Germany 2009/12 82 50 23
Greece 2007/08 88 22 6
Ireland 2012 55 2Italy 2013 86 46 19
Japan 2009 95 63 60
Korea 2012 88 61 46
Mexico 2012 44
Netherlands 2006/08 32 11New Zealand 2006 60 44
Norway 2013 95 71 35
Spain 2011 77 47 23Sweden 2010 98 52 16
Switzerland 2003 94 62 28
Turkey 2008 74
United Kingdom 2005/10 81 34 0.5
United States 2011 79 49 27
Note: Breastfeeding rates are not exclusive breastfeeding rates. Data in bold is extrapolated - see source for methodology. No data for Belgium, Bulgaria, Croatia, Cyprus, Estonia, Hungary, Iceland, Israel, Latvia, Lithuania, Luxembourg, Malta, Poland, Portugal, Romania, Slovakia, and Slovenia.
Source: Victora et al. 2016.

Comparing Child-focused Sustainable Development Goals (SDGs) in High-income Countries: Indicator Development and Overview
Innocenti Working Paper 2017-08
Box 2: Prevalence of breastfeeding (cont.)
The report by Victora et al makes the case for breastfeeding being not only good for children, but society as a whole, as health costs related to malnutrition and mortality fall. Countries wishing to improve on rates of breastfeeding can design their parental leave policies to help families secure the time and resources – an early return to work has been linked to a lower likelihood of breastfeeding initiation (Baker and Milligan, 2007). And when mothers return to work, governments can support – or expand existing support to business – to provide spaces to breastfeed, and provide mothers with legal rights to flexible work arrangements (OECD, 2011).
4.3 Goal 3: Ensure healthy lives and promote well-being
Sustainable Development Goal 3 seeks to ensure healthy lives and the promotion of well-being for all people. As with many previous indicator frameworks for children, a relative wealth of data for health-related measures allows for a greater selection of indicators into this dimension of well-being. This section of the paper introduces five related measures of health and well-being: neo-natal mortality rate; suicide rate; mental health; drunkenness in early adolescence; and adolescent birth rate (15-19).
Figure 9 reports the country standings on average across the five measures in SDG 3, showing that Iceland, Portugal and Spain are the more advanced countries on this goal, and Bulgaria, Chile, New Zealand, and Turkey are some distance behind other countries with reported data (Mexico’s position is affected by the exclusion of outliers for neonatal mortality and teenage birth rates, inclusion of these data would place Mexico among the lowest performing group on Goal 3).
Figure 9 – Ensure healthy lives and promote well-being: four countries are lagging behind the high-income group on Goal 3
65 70 75 80 85 90 95 100 105 110 115
PortugalIceland
SpainGermany
NorwayNetherlands
IsraelJapan
AustriaKorea
SloveniaSwitzerland
SwedenLuxembourg
United KingdomFinlandFrance
ItalyBelgiumGreece
DenmarkIreland
AustraliaCroatia
Czech RepublicEstonia
LatviaMalta
CanadaMexico
HungaryPoland
LithuaniaSlovakia
RomaniaUnited States
TurkeyNew Zealand
BulgariaChile
Note: The result is an average for country performance across five indicators: neonatal mortality (< 4 weeks of age), suicide rates (0-19 years), mental health symptoms (11-15 years), drunkenness (11-15 years), and teenage fertility rates (15-19 years).Missing countries include: Cyprus. The data points for Mexico for neonatal mortality rates (2015) and number of births per 1,000 females aged 15-19 (2015) are outliers, and so have been excluded from the calculation of the results for Goal 3. The inclusion of these outliers would result in the Mexican ranking falling to 40th place. Cyprus is excluded from the calculation of Goal 3 due to insufficient data (reporting on only 2 of the 5 indicators for this goal).
Source: Author’s calculations using data sourced for Goal 3. See figure sources in this section.28

29
Comparing Child-focused Sustainable Development Goals (SDGs) in High-income Countries: Indicator Development and Overview
Innocenti Working Paper 2017-08
4.3.1 Neo-natal mortality rate
Whether children survive infancy is indicative of a range of maternal well-being factors, and child health issues. Infant mortality rates are also determined to an extent by standards in the health systems in country (OECD, 2015). Although when comparing to the global ambitions of the SDGs to ‘reduce neo-natal mortality rates to below 12 deaths per 1000 live births’ in Goal 3, mortality rates in high income countries are low. However, the variation between countries and the trend change which shows rates continuing to fall means there is space for standards to continue to improve in most high income countries. The official SDG indicators list also includes under-5 mortality rates, which are available and reported in global indicators sets, but here neo-natal mortality – or the rates of deaths per 1000 in all children under 4 weeks of age – captures the majority of deaths in high income countries, and is arguably a better representation in this context of the health risks which such indicators of mortality are designed to communicate.
Figure 10 reports rates of neo-natal mortality in high income countries. The good news is that neo-natal infant deaths are falling to very low rates, on average, in the vast majority of countries. In the last ten years, the majority of countries with the greatest success in reducing neo-natal mortality rates are from Eastern Europe (the Baltics, Poland). In 2015, less than 3 children per 1000 on average were dying in the first four weeks of life. Differences across countries remain large however, with rates in Mexico and Turkey being 8 and 7 times higher than the lowest rates seen in Japan and Slovenia.
Figure 10 – In the last decade, most rich countries report notable falls neo-natal mortality rates Neonatal mortality: Deaths in the first 28 days, per 1,000 live births
0.9
1.3
1.4
1.5
1.6
1.6
1.7
1.8
1.8
2.0
2.1
2.1
2.1
2.2
2.2
2.2
2.2
2.3
2.4
2.5
2.5
2.6
2.7
2.8
2.9
2.9
3.1
3.1
3.1
3.3
3.6
4.0
5.2
5.6
7.3
8.0
0
2
4
6
8
10
12
2015 2010 2005 Country average
Country average 2015: 2.8 per 1000
Note: Neonatal mortality has no minimum threshold of gestation period or birthweight. Data for 2015 is 2015 or nearest available year. Break in series France (2009). No data for Ireland in 2015, France or Turkey in 2005. The Country average is unweighted. Missing countries: Canada, Cyprus, Malta, and Romania.
Source: OECD Health database, 2016. Data for Bulgaria is from the WHO World Health Statistics 2016.

30
Comparing Child-focused Sustainable Development Goals (SDGs) in High-income Countries: Indicator Development and Overview
Innocenti Working Paper 2017-08
4.3.2 Suicide rates of children aged 15-19 per 100,000 children of the same age
Suicide is an indication of severe mental health issues, and low levels of personal well-being. Although mental health disorders are the strongest predictors of suicidal behaviour, exposure to multiple risk factors including socio-economic, educational disadvantage, adverse childhood experiences and family circumstances, bullying, and other stressful life events significantly heighten the risks of suicidal behaviour among young people (Beautrais, 2000; Christiansen et al., 2013; Wasserman, 2016). These preventable and unexpected deaths have knock-on effects for families and communities, triggering ‘intangible’ psychological, social and economic costs to those involved (Andriessen and Krysinska, 2016; O’Dea and Tucker, 2005). The official SDG database includes the suicide mortality rate per 100,000 of the population as indicator 3.4.2 (UNStat, 2016). The indicator included here matches this ambition whilst focusing on older adolescents (child-centred) and reporting three-year average rates (as opposed to annual rates) in line with previous studies reporting child mortality figures (UNICEF, 2007; OECD, 2009 and 2015b).
Figure 11 reports rates of suicide in the older adolescent population, and shows that on average, in high-income countries, 6 in every 100,000 children aged 15-19 are taking their own lives each year. There are large variations across the group: countries in the Mediterranean area have the lowest rates of suicide – around one-third to half of average – and Chile, Finland, Ireland, Lithuania, and by some margin New Zealand, have the highest suicide rates among older adolescents. Since 2006 suicide rates have been falling in almost all high-income countries, although the Czech Republic and Mexico stand out as countries showing increases in suicide over time.
Figure 11 – Suicide rates are falling in the vast majority of high income countries Suicide rates of adolescents aged 15-19 per 100,000 population based on the latest available data (2008-2013)
1.7
1.9
2.0
2.2
2.4
2.5
3.0
3.6
3.7
3.7
4.0
4.0
4.2
4.2
4.8
5.0
5.5
5.8
6.1
6.6
6.6
6.7
6.8
6.9
7.3
7.4
7.5
7.6
7.7
7.9
8.5
9.0
10.3
10.3
11.3
13.3
15.6
0.0
2.0
4.0
6.0
8.0
10.0
12.0
14.0
16.0
18.02012/13 c2006 c2009 Country average
Country average 2012/13: 6.1
Note: Figure are 3 year averages around the year in brackets. Earlier estimates are averages for the three years preceding. Data is missing for Greece. Most recent data for Iceland (c2008, 5.4), Slovakia (c2008, 2.5) and Slovenia (c2009, 7.6) is not included in the Figure. The Country average is unweighted. Missing countries: Greece, Iceland, Slovenia, and Slovakia.
Source: WHO Mortality Database, 2016.

31
Comparing Child-focused Sustainable Development Goals (SDGs) in High-income Countries: Indicator Development and Overview
Innocenti Working Paper 2017-08
4.3.3 Share of adolescents reporting two or more mental health symptoms per day (age 11-15) HBSC
Target 3.4 under Goal 3 is to ‘promote mental health and well-being’ along with reducing premature non-communicable disease by a third. The promotion of mental health in childhood is an important task for all countries due to its links with self-harm and suicidal behaviour (WHO, 2014), the experience of bullying (Due et al., 2005; Juvonen, Graham and Schuster, 2003, Perren et al., 2010), school connectedness (Shochet, et al., 2006), health-risk behaviours (Freeman, 2011) and the effects mental health problems can have on academic achievement (Sznitman et al., 2010; Wagner and Cometo, 2004). If left untreated, it is estimated that health disorders emerging before adulthood impose a 10-fold higher health cost than those emerging later in life (Suhrcke, Pillas and Selai, 2007).
The Health Behaviour in School-aged Children survey (HBSC) provides a non-clinical measure of mental health symptoms for children aged 11-15, based on self-reported experiences of feeling low, feeling irritable, nervous, having sleeping difficulties. Figure 12 shows that over 1 in 5 children experience multiple mental health symptoms each week. By country, the percentage of children experiencing two or more mental health symptoms weekly varies from 14 per cent in Austria and Germany to over 30 per cent in Bulgaria and Italy. In ten countries (Bulgaria, Czech Republic, France, Greece, Italy, Malta, Poland, and Romania) more than one in four young people report more than two mental health symptoms each week. In the majority of countries, the prevalence of mental health symptoms increases with age, with the highest rate observed among 15 year-olds (Bruckauf, 2017).
Figure 12 – Adolescent mental-health issues are becoming more common Percentage of adolescents reporting two or more psychological symptoms (feeling low, feeling irritable, nervous, having sleeping difficulties) more than once a week.
14.2
14.7
15.0
15.4
17.1
18.0
18.6
19.9
20.7
20.9
21.1
21.4
21.9
22.0
22.5
22.6
22.9
22.9
23.1
24.9
26.4
26.6
27.3
27.4
27.9
27.9
27.9
28.3
28.4
32.5
36.5
0.0
5.0
10.0
15.0
20.0
25.0
30.0
35.0
40.0
45.02014 2010 2006 Country average
Country average 2014: 23.1%
Note: Data for Israel, Turkey and the United States are available for waves in 2005/6 and 2009/10, but data are missing for 2013/14. Data for Bulgaria and Malta are missing for 2009/10. United Kingdom estimates and Belgian estimates are based on population weights for regional samples (excluding Northern Ireland in the case of the United Kingdom, and the Brussels region for Belgium). The Country average is unweighted. Missing countries: Australia, Chile, Cyprus, Israel, Japan, Korea, Mexico, New Zealand, Turkey, and the United States.
Young people were asked about each of these symptoms with responses: “About every day,” “More than once a week,” “About every week,” “About every month,” “Rarely or never”. The measure presented here is based on a scale of these four items (0-4) validated in a number of studies and qualitative assessments (Gariepy, G., McKinnon, B., Sentenac, M. et al., 2016; Elgar, et al 2015; Haugland & Wold, 2001). Responses were coded as a dummy variable for two or more psychological symptoms experienced daily.
Source: HBSC Study, various waves.

32
Comparing Child-focused Sustainable Development Goals (SDGs) in High-income Countries: Indicator Development and Overview
Innocenti Working Paper 2017-08
Since 2006, only nine countries have shown a reduction in the numbers of young people reporting mental health symptoms. For those that see a notable decrease, only Greece, Lithuania and Romania show consistent trend falls. Austria, Denmark, France, the Netherlands, Ireland, Luxembourg, Slovenia, and Sweden, and to a lesser extent Belgium, Germany, Italy and Iceland report increases since 2005/06 that should be of concern to policymakers.
4.3.4 Drunkenness
Alcohol consumption is one of the leading risk factors of poor health globally (WHO, 2010). Target 3.5 of the SDGs is to ‘strengthen the prevention and treatment of substance abuse, including narcotic drug abuse and harmful use of alcohol’. Harmful drinking is usually defined as a pattern of drinking which is likely to cause physical or psychological harm. It implies the volume of alcohol consumed over time, as well as the drinking pattern and context, and the scale of contamination (WHO, 2009).
Research shows that excessive alcohol consumption in adolescents reduces self-control and increases risky behaviours (Jackson et al., 2012) such as unsafe sex (see Cooper, 2002 for a review), and is linked to injuries and violence (Pickett et.al., 2005; De Loose et al., 2012). Alcohol abuse in youth can also lead to health and social problems in later life (Marshall, 2014).
Figure 13 reports rates of 10-15 year-olds who have been drunk in the previous month. In early adolescence in rich countries, around 7 percent of children aged 11-15 have experienced being in the past month. Eastern European countries and Denmark make up the top ten countries with high rates of recent drunkenness. Iceland has the lowest level of alcohol abuse in early adolescence. Since 2010, all countries see falls in 11-15 year olds reporting recent experiences of drunkenness – the biggest fall being seen in Austria, Denmark, Ireland, Spain and the United Kingdom.

33
Comparing Child-focused Sustainable Development Goals (SDGs) in High-income Countries: Indicator Development and Overview
Innocenti Working Paper 2017-08
Figure 13 – In most rich countries, rates of drunkenness among adolescents are falling Percentage of children aged 11-15 who reported having been drunk in the previous month
1.7
4.0
4.3
4.4
4.4
4.5
4.5
4.8
5.3
5.4
5.8
6.4
7.0
7.0
7.1
7.2
7.2
7.2
7.4
7.5
7.8
8.0
8.0
8.7
9.4
10.5
10.6
12.7
12.8
0.0
5.0
10.0
15.0
20.0
25.0
2014 2010 Country average 2013/14: 6.9%
Note: 2014 data for Finland, Israel and Norway are excluded due to high missing values. 2010 data for Czech Republic, Estonia, Finland, France, Latvia, Lithuania, Poland, Romania and Turkey are excluded due to high missing values. United Kingdom estimates and Belgian estimates are based on population weights for regional samples (excluding Northern Ireland in the case of the United Kingdom, and the Brussels region for Belgium). The Country average is unweighted. Missing countries: Australia, Chile, Cyprus, Finland, Israel, Japan, Korea, Mexico, New Zealand, Norway, Turkey, and the United States.
Source: HBSC, various waves.
4.3.5 Adolescent birth rate (for 15-19 year olds) per woman
Adolescent birth rates are an official measure of health in the SDG database (3.7.2 in UNStats, 2016), both for 15-19 year olds, as included here, and for 10-14 year olds, globally. Adolescent birth rates are in decline in high income countries (Figure 14), but nonetheless remain both a public health challenge, and a child well-being concern. Teenage pregnancy comes with high social costs related to lost education opportunities and lost productivity of fathers and mothers (Singth, Darroch, Frost et al., 2001; Harden, Brunton and Fletcher, 2009), as well as increased reliance on public support (social services and assistance, including on occasion foster care, see for example Hoffman and Maynard, 2008). The personal costs are also serious, including elevated risks of maternal mortality and complications over birth (Nove, Matthews and Neal, 2012; UNPF, 2013; Leppälahti et al., 2013) lower birth weight, and lower scores on new-born physical conditions tests (Xi Kuan Chen et al,. 2007).
In 2015, Mexico reported the highest rate of teenage births at 62.2 births per 1,000 women aged 15-19, followed by Bulgaria, Chile, Romania and Turkey (37, 47, 34 and 27 births respectively). The United States, which traditionally has one of the highest rates of teen birth rates among high-income countries, recorded 21 births per 1,000 women of corresponding age in 2015. The lowest rates were found in Korea (1.6 births) and Switzerland (2.8 births).

34
Comparing Child-focused Sustainable Development Goals (SDGs) in High-income Countries: Indicator Development and Overview
Innocenti Working Paper 2017-08
Teenage birth rates have declined in the past ten years in all of countries with trend data; but this decline happened at a different pace across countries. The largest falls, relative to the starting point, are found in Estonia, Iceland, Mexico, Portugal, Turkey, the United Kingdom and the United States.
Figure 14 – Teenage birth rates are falling in all high-income countries Fertility rate in the population aged 15-19 inclusive, per 1000 females
1.6
2.8
3.6
3.9
4.0
4.0
4.9
5.7
5.7
5.7
5.9
5.9
6.4
6.4
6.8
7.2
8.1
8.3
8.8
9.2
9.3
9.4
9.5
9.7
10.1
10.4
12.4
13.1
13.3
13.8
13.9
16.4
17.7
19.9
21.2
23.3
26.8
34.0
36.8
47.5
62.2
0
10
20
30
40
50
60
70
80
Kore
aSw
itzer
land
Slov
enia
Net
herla
nds
Denm
ark
Japa
nCy
prus
Icel
and
Swed
enLu
xem
bour
gN
orw
ayIta
lyFi
nlan
dGe
rman
yAu
stria
Gree
ceBe
lgiu
mSp
ain
Fran
ceCr
oatia
Isra
elPo
rtug
alCa
nada
Czec
h Re
publ
icIre
land
Lith
uani
aEs
toni
aPo
land
Latv
iaAu
stra
liaU
nite
d…M
alta
Hung
ary
Slov
akia
Uni
ted
Stat
esN
ew Z
eala
ndTu
rkey
Rom
ania
Bulg
aria
Chile
Mex
ico
2015 2010 Country average 2005
Country average 2015: 13.3%
Note: Slovenia and Romania, data for 2004 refers to 2005 estimates. The country average is unweighted.
Source: OECD Family database, 2016 for Slovenia and Romania, and World Development Indicators 2016 for other countries.
4.4 Goal 4: Ensure inclusive education and equitable quality education for all
Sustainable Development Goal 4 seeks to ensure inclusive and equitable quality education and promote lifelong learning opportunities for all. This section of the paper introduces three indicators for education: young people achieving at least minimum standards of proficiency in mathematics, science and reading; the participation rate in organized learning in the year before primary school; and the proportion of pre-schoolers (from age 3) that attend formal childcare settings for a least one hour per week.
Figure 15 reports the country standings on average across two measures in SDG 4 (learning proficiency and organized learning in the pre-school year), showing that Finland and Malta are the most advanced countries on this goal, and Turkey in particular, but also Australia and Romania fare poorly compared to other countries here.

35
Comparing Child-focused Sustainable Development Goals (SDGs) in High-income Countries: Indicator Development and Overview
Innocenti Working Paper 2017-08
Figure 15 – Ensure inclusive education and equitable quality education for all: Finland leads on learning
65 70 75 80 85 90 95 100 105 110 115
FinlandMaltaKorea
MexicoDenmarkBelgium
GermanyCanadaNorway
JapanSwitzerland
SpainIrelandFrance
New ZealandSweden
NetherlandsLatvia
ItalyUnited Kingdom
EstoniaCzech Republic
SloveniaPortugal
LuxembourgAustriaIceland
IsraelLithuaniaHungary
PolandUnited States
GreeceCyprus
SlovakiaCroatia
ChileBulgaria
AustraliaRomania
Turkey
Note: The result is an average for country performance across two indicators: rates of children achieving baseline learning proficiency (15 years of age) and participation rates in the preschool year (between 3 and 6 years). The data point for Turkey for participation rate in organized learning (one year before official age for entering primary school) in 2013/14 is an outlier, and so is excluded from the calculation of the results for Goal 4. The inclusion of this data would result in no change to the Turkish ranking on Goal 4.
Source: Author’s calculations using data sourced for Goal 4. See figure sources in this section.
4.4.1 Proportion of young people at the end of lower secondary education reaching at least minimum proficiency level in three core subjects
The first target of SDG 4 (4.1) is to ensure that the completion of primary and secondary education leads to ‘relevant and effective learning outcomes’. The official SDG database includes data on three sub-targets related to meeting minimum standards of proficiency in mathematics and reading (by sex – see 4.5.2 below) by grade 2 or 3, at the end of primary school, and by the end of lower secondary school (UNStats, 2016). Figure 16 presents rates of children in high-income countries achieving at least minimum proficiency by the end of lower secondary education (age 15). As well as mathematics and reading, this indicator also includes science literacy proficiency as reported by the PISA 2015 survey (overlapping with an additional subject facilitates assessment of educational systems more broadly as subject specific bias is lowered with each inclusion), and achieves the greatest country coverage of all indicator options available.
Achieving proficiency in basic skills for all children is fair, and implies progress in tackling inequality of outcomes driven by socio-economic disadvantage – the most consistent and persistent predictor of low achievement across industrialized nations (Bruckauf, 2016). Poor literacy and numeracy skills at the end of secondary education were found to increase the risks of school dropout (Parsons and Bynner, 2005). They impose a ‘penalty’ on wages (Shomos and Forbes, 2014), and influence the gender wage gap,

36
Comparing Child-focused Sustainable Development Goals (SDGs) in High-income Countries: Indicator Development and Overview
Innocenti Working Paper 2017-08
unemployment and long-term inactivity (Quintini, 2014; Parsons and Bynner, 1997). Within a national context – using the United Kingdom as an example – the costs to the economy arising from failure to master basic literacy skills during the primary school years are estimated to be between £198 million and £2.5 billion every year (Every Child a Chance Trust, 2009).
Figure 16 reveals that across all rich countries, on average, three in every ten children do not meet basic proficiency standards by the end of lower secondary school. Country differences are large however. Over 80 per cent of students in Estonia, Finland and Japan reach level 2 or above in all three subjects. They are closely followed by Canada, Denmark, Ireland, the Republic of Korea, Poland and Slovenia where over 75 per cent meet basic proficiency standards. In contrast, less than 50 per cent of students reach minimum literacy standards in all three subjects in Bulgaria, Chile, Romania and Turkey.
Figure 16 – 70 per cent of 15 year olds are proficient in maths, science and reading literacies Proportion of 15-year-olds achieving baseline competency in reading, mathematics and science
83.1
82.4
81.4
80.8
79.3
77.9
77.2
76.7
75.7
75.5
74.9
74.6
73.3
72.6
71.9
71.7
71.7
71.6
71.0
70.8
70.3
70.0
69.7
69.4
66.6
66.4
65.2
65.2
64.6
63.8
62.6
59.9
59.2
56.7
48.0
47.0
45.5
40.7
0
10
20
30
40
50
60
70
80
90
100
2015 Country average 2006 2012
Country average 2015: 68.6%
Note: Data for 2015 and 2012 are compared to 2006 data as this was the last time that science literacy was the main focus of the PISA tests. 2009 data is available for the majority of countries. 2006 results for the United States are not reported due to data availability in reading. Malta did not participate in PISA rounds 2006 and 2012. Mexico data is excluded due to low rates of enrolment in upper-secondary school at the time of the PISA 2015 tests (65%) – see UNICEF (2016). 35.9% of the Mexican sample reached baseline educational standards in 2015. The country average is unweighted. Missing countries: Cyprus, Malta and Mexico.
Source: OECD PISA survey, various waves.
4.4.2 Access to formal childcare for children between age 3 and compulsory school age
Sustainable Development Target 4.2 aims to ensure that by 2030 “all girls and boys have access to quality early childhood development, care, and pre-primary education so that they are ready for primary school.” The proposed global indicator monitors participation rates in organized learning one year before the official primary entry age, disaggregated by sex.

37
Comparing Child-focused Sustainable Development Goals (SDGs) in High-income Countries: Indicator Development and Overview
Innocenti Working Paper 2017-08
Growing evidence demonstrates the impact of early childhood education on skills formation and life outcomes. Even a few hours a day of high-quality pre-school programmes at age three and four can produce positive life outcomes, including a reduction in criminal behaviour, positive labour market outcomes, education outcomes, and health outcomes (Heckman et al. 2010; Barnett, 2008; Sylva et al., 2003). The specific mechanism of these long-term effects might involve changes in personality skills and a reduction in externalising behaviour (Heckman, Pinto, and Savelyev, 2013). Cross-national evidence shows that participation in pre-primary education substantially decreases the likelihood of low educational performance at age 15, even after controlling for students’ individual characteristics and socio-economic background (OECD, 2016). The equalizing effect of pre-school education on achievement is particularly beneficial for 15 year-olds with an immigrant background (OECD, 2015). These findings support the theory of life course skills formation under which fundamental skills acquired in early years produce and foster skills later in life (Heckman, 2008).
Figure 17 reports the participation rate in organized learning collated from global sources in the SDG Indicators Global Data Set. Results show that progress on this global indicator in the last five-ten years has been mixed across 37 countries. A number of high performing countries, ranging from Malta through to Latvia in Figure 17, have had almost universal participation in organized learning in the preschool year for a number of years now. Only four countries report rates or organized learning below 90%: Australia, Croatia, Poland and Turkey – and with the exception of Poland, in each of these countries recent trends have been positive.
Figure 17 – More than 9 in 10 children participate in organized pre-school learning Participation rate in organized learning (one year before official age for entering primary school)
99.9
99.9
99.8
99.8
99.8
99.3
99.2
99.1
99.0
98.9
98.8
98.8
98.7
98.4
98.0
97.9
97.1
96.7
96.5
96.4
96.2
96.2
96.0
95.7
95.0
95.0
94.9
93.8
93.1
92.3
91.4
91.1
90.3
89.7
89.3
80.3
72.7
0
20
40
60
80
100
120
2013-2014 2010 2005 Country average
Country average 2014: 95.3%
Note: Most recent data is used for 2010 for Croatia, Estonia, Iceland and Switzerland. Data for Canada refers to adjusted net enrolment rate, one year before the official primary entry age, both sexes (%). Missing countries: Austria, Czech Republic, Germany, and Slovakia.
Source: SDG Indicators Global Database (UNESCO, OECD and EUROSTAT Surveys of Formal Education).

38
Comparing Child-focused Sustainable Development Goals (SDGs) in High-income Countries: Indicator Development and Overview
Innocenti Working Paper 2017-08
4.4.3 Children aged over 3 attending centre-based services for at least one hour a week
As the evidence above attests, access to preschool and childcare services in advance of the pre-school year can be beneficial for children’s social, emotional and cognitive development. Many high-income countries have, over the past decade or more, expanded their pre-school and childcare services to facilitate access to the very youngest children (see OECD Family database, 2017).
Figure 18 complements information in Figure 17 to show the proportions of children from age 3 in each country who attend centre-based services for at least one hour per week. Data is only for European countries and Japan, and – noting that these data do not speak to quality of setting or variation in actual hours used – shows that on average 4 in every 5 children are attending some form of centre based care from the age of 3. In Belgium, Iceland and Malta coverage is almost universal, whereas in Croatia, Greece, Poland and Romania rates are at around 65% or lower. Since 2005, 11 countries have seen notable increases in coverage, with Lithuania, Malta and Portugal making the biggest gains. A handful of countries have seen attendance rates fall, including in Croatia, Romania and markedly in the United Kingdom.
Figure 18 – Formal childcare attendance from three years old is less prevalent in some countries Proportion of children from 3 years to minimum compulsory school age attending centre-based services for at least one hour a week
99 99 98 96 95 95 94 93 91 91 90 90 89 89 89 87 86 86 81 80 80 79 76 75 74 72 70 68 65 52 43 40
0
20
40
60
80
100
1202014 Country average 2005 2010
Country average 2014: 81.6%
Note: Missing countries: Australia, Canada, Chile, Israel, Korea, Mexico, New Zealand, Turkey or the United States.
Source: Eurostat (EU-SILC). Data for Japan from 2013 Comprehensive Survey of Living Standard, Ministry of Health, Labour and Welfare.
Goal 4 is also the area of the SDGs which contains explicit mention of indigenous persons in the context most relevant to children (Goal 2 includes references to agricultural productivity and indigenous groups). In particular, target 4.5 asks States to, ‘By 2030, eliminate gender disparities in education and ensure equal access to all levels of education and vocational training for the vulnerable,

39
Comparing Child-focused Sustainable Development Goals (SDGs) in High-income Countries: Indicator Development and Overview
Innocenti Working Paper 2017-08
including persons with disabilities, indigenous peoples and children in vulnerable situations’. As in many other parts of the world, indigenous populations in high-income countries face unique challenges to achieving their rights, and children in indigenous communities can often face worse outcomes than their peers. Due to the lack of available and comparable data for indigenous groups in all high-income countries, indicators related to target 4.5 are not included in this study. However, some issues related to indigenous children in specific countries and for specific goals are discussed in Box 3, below.
Box 3: Beyond averages: Focus on indigenous children
Inclusive society and non-discrimination are at the core of the Sustainable Development Agenda, reflecting the human rights foundation of targeted progress. These values are operationalized in many SDG targets and are also underlined in the SDG central promise of ‘Leaving no one behind.’ They drive data disaggregation efforts to include the most vulnerable and at risk population groups including indigenous children and their families, an effort that should respect the rights of indigenous peoples to own and control data about their lives. Many of the indigenous groups suffered historical injustices and continue to be excluded from progress, and from data (ILO, 2016).
The most recent available data refers to 370 million indigenous people living in 99 countries worldwide (DESA, 2015). The exact number of indigenous children is hard to estimate but the indigenous population is typically young. According to 2011 data, Aboriginal children in Canada aged 14 and under represent over 28% of the total Aboriginal population compared to 16.5% representation of children in the non-Aboriginal population (Canadian National Household Survey, 2011). Similarly in Australia, 36% of the Aboriginal and Torres Strait Islander population were aged 0-14 years compared to 18% in non-indigenous group (ABS, 2017). Indigenous children are likely to be the most vulnerable due to social dislocation resulting from colonization and persistent poverty greater dependency on family livelihood, poor access to educational and health opportunities and discriminatory attitudes they often face in their society (UNICEF, 2012). National examples from three geographically diverse countries (Australia, Canada and Norway) highlight the vulnerability of this group of children compared to the general children population often represented as national averages.
Goal 1: No Poverty. Indigenous children face higher rates of poverty than the national averages reported in the country. In 2010, 38% of all Aboriginal children (First Nations, Inuit and Métis) in Canada lived in poverty compared to only 17% of non-indigenous children. Further disaggregation by identity shows that half (51%) the Status First Nations children lived in poverty (MacDonald and Wilson, 2016). This is a violation of their right to survival and development.
Goal 3: Good Health and Well-being. Indigenous children are vulnerable on many health and well-being indicators. Twice as many of Aboriginal and Torres Strait Islander children born in 2011 in Australia were low-birthweight compared to those born to non-indigenous mothers (11% and 4.5% respectively) (Australian Child’s Rights Taskforce). Adolescent birth rates among Sami population of Norway1 aged 15-19 in 2014 were more than twice as high as average in the country: 12.7 live births per 1000 women of corresponding age (Statistics Norway, 2016) compare to 5.9 live births among non-Sami population (WDI, 2016). Girls’ mortality among the Sami children population in Norway between ages 0 and 9 is estimated to be 37 deaths per 100,000 compared to 27 deaths in the total girls’ population of the corresponding age. Aboriginal children in Canada experience higher rates of injury, suicide, obesity, infant mortality and health conditions such as community-associated methicillin-resistant Staphylococcus aureus and various respiratory conditions such as tuberculosis (Irvine, Kitty and Pekeles, 2012).
Goal 4: Quality Education. Despite the progress in many countries, closing the gap in education between indigenous and non-indigenous children remains a challenge. According to the most recent government report, Aboriginal and Torres Children of Australia continued to lag behind in reading (in year 9) and numeracy (in years 3 and 7) compared to their non-indigenous peers in 2015 based on the National Minimum Standards (NMS) assessed by the National Assessment Program Literacy and Numeracy
1 This refers to the SNT area of North of Saltfjellet. SNT area: The area of activity of the Sami Parliament subsidy schemes for business development (SNT).

40
Comparing Child-focused Sustainable Development Goals (SDGs) in High-income Countries: Indicator Development and Overview
Innocenti Working Paper 2017-08
Box 3: Beyond averages: Focus on indigenous children (cont.)
(NAPLAN: Australian Government, 2016). The national studies show that low attendance is one of the critical factors behind achievement gaps with only 83.7% of indigenous children nationally attending school compared to 93.1 % of non-indigenous students.
Education should safeguard indigenous children’s identity and cultural roots including the native language, a key factor in low attendance. Early education and pre-school programmes have an important role to play in supporting indigenous language during the formative years of early childhood. For instance, in 2015 there were 23 Sami kindergartens in Norway, attended by 523 children. This is about half of all 1000 Sami children enrolled in kindergarten nationwide (Norwegian Directorate for Education and Training, 2016), yet the extent to which Sami children master the Sami language is not recorded in official statistics for kindergarten children.
The SDG agenda is a window of opportunity to bring a dramatic change in the lives of indigenous children and youth. One way to promote that is to support indigenous communities in the advancement of comprehensive, culturally relevant data (Young et al, 2012). Good national examples exist, such as Australia government’s annual reporting on the progress for indigenous children on selected indicators in health, education, employment and economic opportunities and the First Nations Information Governance Centre in Canada. Regular monitoring stimulates nation-wide focus and much needed policy action. Yet more can be done in all countries to ensure that the rights of indigenous children accorded under the CRC and United Nations Declaration on the Rights of Indigenous people are fully supported in relevant national legislations.
4.5 Goal 5: Achieve gender equality, and empower girls
Sustainable Development Goal 5 aims to achieve gender equality and empower all women and girls. In the Official SDG database, data for this goal is mostly available for adult gender equality (managerial positions, parliamentary positions, and information gathered on retrospective experiences from adults), or in areas less often associated with high-income settings, or the necessary data focusing on children is not available or limited (female genital cutting and domestic work and care).
To begin to populate Goal 5 with data, information from the European Fundamental Rights Agency’s survey on sexual violence against women is used to operationalize target 5.2 (5.2.1), and this is complemented with information on attitudes towards gender equality in education, and differences in boys and girls self-reported domestic work and care (see Box 4). However, because attempts to operationalize Goal 5 in a child-relevant way uncovered few comparable child-focused indicators that reflect gender inequalities in childhood, and where data is available, country coverage or data quality is an issue, no Goal 5 composite or ranking has been calculated.
4.5.1 Women who report experiences of sexual violence
Target 5.2, under Goal 5 calls for the elimination of ‘all forms of violence against all women and girls in the public and private spheres, including trafficking and sexual and other types of exploitation’. Amongst the types of violence listed is the official indicators are physical, sexual and psychological violence by current or former intimate partners (5.2.1) and sexual violence by other persons (5.2.2).
Sexual violence takes many forms, and the perpetration of sexual violence by one or more persons against another person can have devastating consequences for the survivor’s present and future life. For children, aside from being subject to a violent crime, such experiences can lead to personal injury

41
Comparing Child-focused Sustainable Development Goals (SDGs) in High-income Countries: Indicator Development and Overview
Innocenti Working Paper 2017-08
and ill health, worsening emotional and mental health, social isolation, increased risk behaviours, perpetration and/or victimization in later life, and exit from school (see the review in UNICEF, 2014a: pp 62 onwards).
Figure 19 reports the proportion of women aged 18-29 who reported an experience of sexual violence before the age of 15, perpetrated by an adult (including: being forced to have intercourse; unwelcome touching of breasts or genitals; being forced to pose naked; or the adult exposing their genitals). On average across the countries with data, more than 1 in 20 women experienced sexual violence as girls. The lowest reported rates were seen in Romania, at just over 1 per cent, and the highest rates in France, Luxembourg and the United Kingdom at over 12 per cent.
Figure 19 – Sexual violence by adults affects 6 per cent of European girls under the age of 15 Women aged 18-29 who reported having experienced sexual violence before age 15 (%)
1.1%
1.9%
1.9%
2.0%
2.0%
2.6%
4.4%
4.6%
4.6%
4.6%
4.7%
4.9%
5.1%
5.2%
6.0%
6.1%
6.2%
6.6%
6.8%
8.2%
8.4%
9.7%
9.8%
10.3
%
11.1
%
12.0
%
12.3
%
13.0
%
0%
2%
4%
6%
8%
10%
12%
14%2012 Country average
Country average 2014: 6.3%
Note: Sexual violence was defined as: forced to have intercourse; unwelcome touching of breasts or genitals; being forced to pose naked; or the adult exposing their genitals. Countries above and below the Country average with an ‘*’ are significantly different from the average at the p<0.05 level. Missing countries: Australia, Canada, Chile, Iceland, Israel, Japan, Korea, Mexico, New Zealand, Norway, Switzerland, Turkey, and United States.
Source: FRA gender-based violence against women survey dataset, 2012.
It should be noted that self-reported, retrospective data, on highly stigmatized experiences – particularly those related to crimes – are likely to be subject to many measurement issues, most commonly under-reporting. The data reported in Figure 19 is likely to be affected by these issues to variable degrees by country, and should be read with this in mind. Moreover, for these reasons, and for reasons of small sub-sample sizes and country coverage on this indicator (a subset of European countries), these data are not included in further analysis related to composite measures by Goal.

42
Comparing Child-focused Sustainable Development Goals (SDGs) in High-income Countries: Indicator Development and Overview
Innocenti Working Paper 2017-08
Box 4: Gender norms: higher education and housework
Targets 5.4 and 5.5 under Goal 5 of the SDGs call broadly for the recognition of unpaid domestic work and to ensure women’s full and effective participation at all levels of public life. Indicators to these targets include time spent on unpaid domestic care and work (5.4.1) and proportions of women in political office or managerial roles (5.5.1 / 5.5.2). The burden on unpaid work, and success in future careers are not unconnected issues – home care for children, for instance, is a key reason why many women undertake career breaks, or are disconnected permanently from the labour market. Moreover, expectations of who cares, who learns and who works are often establish early on in life, and so measures to indicate differences in ‘gender norms’ in education and housework have been reviewed as part of the background documentation for Report Card 14, and are briefly introduced here (for full details see Innocenti Research Briefs by Bruckauf and Chzhen, 2017 and Bruckauf and Rees, 2017).
Below Box Figure 4.1 reports the share of adult respondents disagreeing that, “University education is more important for a boy than for a girl”. Results show that although results vary widely across the 17 countries with data, many men and women view higher education as being more important for boys than girls. In Chile, Germany, Korea, Mexico Romania, and Turkey, one in five male respondents believed this to be the case – rates which are matched by female respondents in Korea and Turkey.
Box Figure 4.1 – Attitudes that reinforce gender inequality remain entrenched Share of adult respondents agreeing that, “University education is more important for a boy than for a girl”, 2010-2014
0
5
10
15
20
25
30
35
40
Male respondent Female respondent
Country average: 13.9%
Note: Data refers to the current official release version v2016-01-01. Respondents agree or strongly agree to the statement.
Source: World Values Survey, 2010-2014
Box Figure 4.2 reports children’s participation in household work, by gender, at ages 8 and 12, taken from Children’s World, the International Survey of Children’s Well-Being (ISCWeB) in 2013/14. In all countries (perhaps with the exception of 12-year olds in Korea) more girls report doing daily housework than boys, within the range of around 3 to almost 16 percentage points difference.
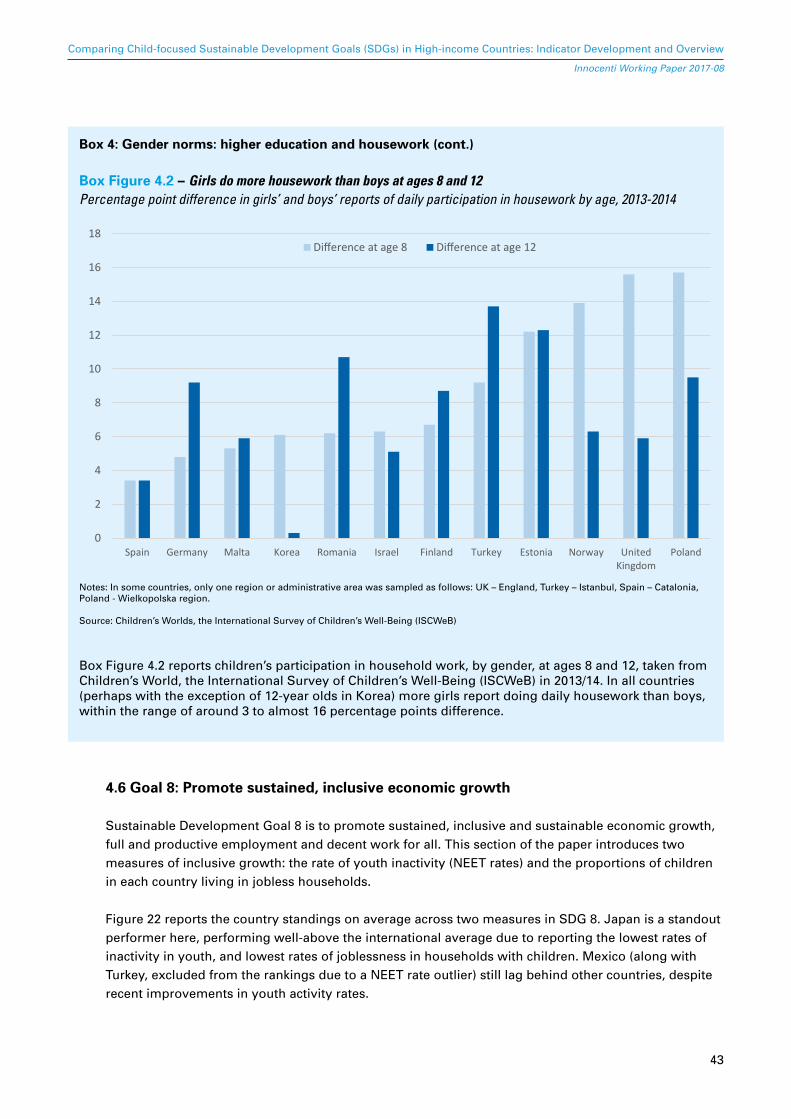
43
Comparing Child-focused Sustainable Development Goals (SDGs) in High-income Countries: Indicator Development and Overview
Innocenti Working Paper 2017-08
Box 4: Gender norms: higher education and housework (cont.)
Box Figure 4.2 – Girls do more housework than boys at ages 8 and 12 Percentage point difference in girls’ and boys’ reports of daily participation in housework by age, 2013-2014
0
2
4
6
8
10
12
14
16
18
Spain Germany Malta Korea Romania Israel Finland Turkey Estonia Norway UnitedKingdom
Poland
Difference at age 8 Difference at age 12
Notes: In some countries, only one region or administrative area was sampled as follows: UK – England, Turkey – Istanbul, Spain – Catalonia, Poland - Wielkopolska region. Source: Children’s Worlds, the International Survey of Children’s Well-Being (ISCWeB)
Box Figure 4.2 reports children’s participation in household work, by gender, at ages 8 and 12, taken from Children’s World, the International Survey of Children’s Well-Being (ISCWeB) in 2013/14. In all countries (perhaps with the exception of 12-year olds in Korea) more girls report doing daily housework than boys, within the range of around 3 to almost 16 percentage points difference.
4.6 Goal 8: Promote sustained, inclusive economic growth
Sustainable Development Goal 8 is to promote sustained, inclusive and sustainable economic growth, full and productive employment and decent work for all. This section of the paper introduces two measures of inclusive growth: the rate of youth inactivity (NEET rates) and the proportions of children in each country living in jobless households.
Figure 22 reports the country standings on average across two measures in SDG 8. Japan is a standout performer here, performing well-above the international average due to reporting the lowest rates of inactivity in youth, and lowest rates of joblessness in households with children. Mexico (along with Turkey, excluded from the rankings due to a NEET rate outlier) still lag behind other countries, despite recent improvements in youth activity rates.

44
Comparing Child-focused Sustainable Development Goals (SDGs) in High-income Countries: Indicator Development and Overview
Innocenti Working Paper 2017-08
Figure 20 – Promote sustained, inclusive economic growth: Japan leads the high-income groups with the lowest rates of inactive youth and joblessness in households with children
70 75 80 85 90 95 100 105 110 115 120
JapanSwitzerland
LuxembourgPoland
NorwayGermany
SwedenNetherlands
SloveniaDenmark
CanadaKorea
Czech RepublicEstoniaFinland
LatviaUnited States
IcelandSlovakia
FranceCyprus
IsraelAustralia
AustriaRomaniaPortugal
LithuaniaBelgium
MaltaItaly
United KingdomGreece
HungaryNew Zealand
CroatiaSpain
IrelandChile
BulgariaMexico
Note: The result is an average of country performance across two indicators: youth inactivity (NEET) rates (15-19 years) and children living in jobless households (0-17 years of age). Missing countries include: Turkey. The data point for Turkey for the proportion of youth (aged 15-19) not in education, employment or training (NEET rate) in 2014 is an outlier, and so is excluded from the calculation of the results for Goal 8. The inclusion of the outlier would result in Turkey ranking 41st on Goal 8.
Source: Author’s calculations using data sourced for Goal 8. See figure sources in this section.
4.6.1 Proportion of youth (aged 15-19) not in education, employment or training (NEET rate)
The proportion of youth (aged 15-24) not in education, employment or training is an official measure of inclusive growth in the SDG database (8.6.1 in UNstats, 2016). Because of the desire to be child-focused, but also because of the different ways in which education and employment contribute to inactivity between the ages of 20 and 24, only NEET rates for young people aged 15 to 19 are reported here.
In the 15-19 age group, high NEET rates suggest an interrupted transition from school to work, or from school to further education, with long-term individual and societal costs (OECD, 2013). NEET status carries risks of skills deterioration, underemployment and discouragement (ILO, 2016). Moreover, inactivity has social consequences for young people, such as isolation, involvement in risky behaviour, lower subjective well-being and unstable mental and physical health (Eurofound 2012, Bell and Blanchflower 2011).
In high-income countries, on average, one in every 12 older adolescents is not in education, employment or training (Figure 23). This average hides variation, where the highest rates of inactivity

45
Comparing Child-focused Sustainable Development Goals (SDGs) in High-income Countries: Indicator Development and Overview
Innocenti Working Paper 2017-08
of over 10 per cent or more are seen in southern European and Latin American countries, and the lowest rates, under 4 per cent, are seen in countries in central and northern Europe. Despite improvements in recent years, Turkey stands out as a country where 1 in 5 older adolescents is NEET. In the past decade, although NEET rates have fallen in a majority of the countries – and markedly so in Israel – increases have been seen in Ireland and Poland, and to a lesser extent in France and the United States, where they are large relative to their starting points.
Figure 21 – Around 1 in 13 young people aged 15-19 are not in school or work Proportion of youth (aged 15-19) not in education, employment or training (NEET rate)
2.0
2.4
2.9
3.2
3.5
3.5
3.6
3.8
4.0
4.3
4.6
4.7
5.4
5.5
5.5
5.7
6.1
6.8
7.0
7.1
7.1
7.2
7.2
7.6
7.6
7.7
7.8
7.9
8.4
9.1
10.4
10.5
10.8
11.2
12.1
12.5
12.7
14.1
15.3
21.0
0
5
10
15
20
25
30
Japa
nLu
xem
bour
gGe
rman
yCz
ech
Repu
blic
Denm
ark
Nor
way
Net
herla
nds
Latv
iaPo
land
Swed
enSl
oven
iaSw
itzer
land
Belg
ium
Finl
and
Icel
and
Slov
akia
Port
ugal
Hung
ary
Esto
nia
Cana
daN
ew Z
eala
ndAu
stra
liaAu
stria
Uni
ted
Stat
esCy
prus
Kore
aIs
rael
Fran
ceU
nite
d Ki
ngdo
mIre
land
Rom
ania
Gree
ceM
alta
Italy
Spai
nCr
oatia
Chile
Bulg
aria
Mex
ico
Turk
ey
2014 2010 2005
Country average 2014: 7.1%
Note: Students in work-study programmes are considered to be both in education and employed, irrespective of their labour market status according to the ILO definition. Reported 2014 data for Korea and Chile refers to 2013; reported 2010 data for Chile refers to 2009. Missing country: Lithuania. Source: OECD Family Database, 2016. Data for Japan: Statistics Bureau, Labour Force Survey 2015.
4.6.2 Rates of children living in jobless households
The children in jobless households measure is linked to target 8.5 in Goal 8, which calls for full and productive employment and decent work for all men and women. Unemployment in a household, and the poverty and insecurity this brings, is a key determinant of children’s poverty risks and later life outcomes.
Figure 22 shows that across the countries of study, an average of 9 per cent of all children are living in jobless households. Rates are very low in Canada, Korea, Japan, Poland, and Switzerland at less than one in 20 children, and high in Hungary, Ireland and New Zealand, where over 15 per cent of children are growing up in households without anyone in paid work.

46
Comparing Child-focused Sustainable Development Goals (SDGs) in High-income Countries: Indicator Development and Overview
Innocenti Working Paper 2017-08
Figure 22 – One in eleven children live in households where no one works for pay Proportion of children under 18 in jobless households (based on self-defined economic status of adults)
2.1%
2.9%
4.0%
4.2%
4.2%
5.5%
5.6%
5.8%
6.0%
6.0%
6.1%
6.3%
6.4%
6.8%
7.8%
7.9%
8.1%
8.2%
8.2%
8.5%
9.0%
9.4%
9.7%
9.8%
10.1
%10
.3%
10.4
%11
.6%
11.6
%12
.9%
13.4
%14
.0%
14.0
%14
.3%
16.0
%16
.0%
18.8
%
0%
5%
10%
15%
20%
25%
Japa
nSw
itzer
land
Kore
aCa
nada
Pola
ndN
orw
aySw
eden
Rom
ania
Luxe
mbo
urg
Uni
ted
Stat
esEs
toni
aSl
oven
iaN
ethe
rland
sGe
rman
yFr
ance
Denm
ark
Finl
and
Cypr
usIs
rael
Icel
and
Slov
akia
Aust
riaIta
lyLi
thua
nia
Mal
taCz
ech
Repu
blic
Latv
iaPo
rtug
alGr
eece
Belg
ium
Croa
tiaU
nite
d Ki
ngdo
mBu
lgar
iaSp
ain
New
Zea
land
Hung
ary
Irela
nd
2014 2010 Country average
Country average 2014: 9.0%
Note: Reported 2014 data for Korea and New Zealand refers to 2015, for USA 2014 data refers to 2013 and for Israel and Japan refers to 2012. Mexico data is excluded due to high rates of informality in the labour market. Missing countries: Australia, Chile, Mexico and Turkey. Source: See Figure 3.
4.7 Goal 10: Reduce inequality within and among countries
Sustainable Development Goal 10 is to reduce inequality within and among countries. This section of the paper introduces three measures: the ratio of growth in incomes between poor households and the national average, an indicator of the extent to which students’ backgrounds determine their educational outcomes, and income inequality, in the bottom half of the income distribution.
Figure 25 reports the country standings on average across three measures in SDG 10. The top four performing countries on this goal are Nordic countries – traditionally countries reporting rates of low income inequality. Bulgaria, Chile, Greece, Israel, Mexico, and Romania make up a group of six countries that fall some distance behind the overall country average.

47
Comparing Child-focused Sustainable Development Goals (SDGs) in High-income Countries: Indicator Development and Overview
Innocenti Working Paper 2017-08
Figure 23 – Reduce inequality within and among countries: Nordic countries lead the group
75 80 85 90 95 100 105 110 115 120 125
IcelandNorway
DenmarkFinlandCyprus
United KingdomSwitzerland
IrelandGermanySloveniaSweden
NetherlandsAustriaCanada
LuxembourgKorea
AustraliaCroatia
BelgiumItaly
MaltaTurkeyPoland
SlovakiaLatvia
New ZealandPortugal
SpainEstonia
HungaryCzech Republic
JapanLithuania
FranceUnited States
GreeceChile
RomaniaIsrael
BulgariaMexico
Note: The result is an average of country performance across three indicators: Palma ratio (0-17 years of age), ‘bottom-end’ inequality (0-17 years), and Impact of socio-economic status on student performance (15 years). The data point for Mexico for the Palma Ratio based on households with children (2014) is an outlier, and has been excluded from the calculation of the results for Goal 10. The inclusion of the outlier would result in Mexico ranking 41st on Goal 10.
Source: Author’s calculations using data sourced for Goal 10. See figure sources in this section.
4.7.1 Ratio of growth rates in incomes of household with children in the 40th percentile compared to the 90th percentile
Target 10.1 of Goal 10 seeks ‘by 2030, to progressively achieve and sustain income growth of the bottom 40 per cent of the population at a rate higher than the national average’. The indicators aligned to this target (10.1.1) call for measurement of ‘growth rates of household expenditure or income per capita among the bottom 40 per cent of the population and the total population’ for the purposes of comparison. On this measure, progressive growth would see income growth in the poorest 40 percent of a population, in economic terms, being in advance of the population as a whole.
For the purpose of this report, and with reference to reducing inequality within country across the board, trends in the Palma ratio are used to operationalize Target 10.1. The Palma ratio is a ratio between the income share of the top 10% and the bottom 40% of a population in an income distribution, where a value of 1 indicates that the income of the top 10% is the same as that of the bottom 40%, and values below one, show the income share of the bottom 40% is higher than the top 10%. The purpose of using the Palma ratio is to highlight trends in rates of inequality in income between two ends of the income distribution, rather than per capita growth rates (which can be detached from absolute levels of wealth, and rely on normality assumptions for the clearest interpretation), as a starting point to reducing inequality within countries.

48
Comparing Child-focused Sustainable Development Goals (SDGs) in High-income Countries: Indicator Development and Overview
Innocenti Working Paper 2017-08
Figure 24 shows that in majority of high-income countries, the top ten richest households with children present have more combined income than the bottom 40% of households with children. On average, the ratio is 1.17, or the top income decile holds on average around 1.2 times more income than the poorest 4 deciles. Eleven countries buck this trend by more than 5% in favour of the poorest, including all of the Nordic countries, Austria, Belgium, France, Korea, the Netherlands, and Slovenia. Chile and Mexico have ratios that show the richest ten percent of household with children holding at least twice the income of the poorest 40 percent. The trend news is not good for the SDG in high-income countries, as in most cases ratios are creeping up. Only in Iceland, Portugal and the United Kingdom have ratios fallen to any great degree since the onset of the financial crisis and global recession in 2008 (by 0.2 or more).
Figure 24 – In most countries the income share of the top 10% exceeds that of the bottom 40% Palma Ratio based on households with children, 2014 and 2008
0.70
0.74
0.76
0.81
0.82
0.83
0.83
0.85
0.86
0.86
0.94
0.99
1.00
1.00
1.00
1.01
1.01
1.02
1.05
1.06
1.06
1.07
1.10
1.12
1.12
1.19
1.20
1.21
1.35
1.36
1.46
1.50
1.56
1.61
1.64
1.64
1.73
1.77
1.89
2.21
2.80
0.0
0.5
1.0
1.5
2.0
2.5
3.0
Icel
and
Nor
way
Swed
en
Finl
and
Slov
enia
Kore
a
Net
herla
nds
Belg
ium
Aust
ria
Denm
ark
Fran
ce
Slov
akia
Czec
h Re
publ
ic
Germ
any
Cypr
us
Croa
tia
Mal
ta
Japa
n
Hung
ary
Switz
erla
nd
Luxe
mbo
urg
Irela
nd
Uni
ted…
Cana
da
Aust
ralia
New
Zea
land
Pola
nd
Italy
Esto
nia
Port
ugal
Spai
n
Lith
uani
a
Rom
ania
Latv
ia
Uni
ted
Stat
es
Gree
ce
Bulg
aria
Isra
el
Turk
ey
Chile
Mex
ico
2014 2008 Country average
Country average 2014: 1.17
Note: The Palma ratio is a ratio between the income share of the top 10% and the bottom 40% of a population in an income distribution. A value of 1 indicates that the income of the top 10% is the same as that of the bottom 40%. Values above 1 show that the share of the top 10% is higher and those below 1 that it is lower. Values below 1 therefore suggest lower levels of inequality. Source: See Figure 3.
4.7.2 Relative income gap (bottom-end inequality)
Target 10.3 of the SDGs seeks to ‘ensure equal opportunity and reduce inequalities of outcome, including by eliminating discriminatory laws, policies and practices and promoting appropriate legislation, policies and action in this regard’ (UN, 2016). Nevertheless, there is no established methodology and no available data for the indicator at the moment (UNStats, 2016). As the concept of equal opportunity for children is central to UNICEF’s mandate, it is instructive to use bottom-end income inequality among children (relative income gap) as an indicator for a target on equality of opportunity. It represents an overview of how well the world’s developed nations are living up to the ideal of ‘no child left behind’ or within the broader ideology of the SDG’s, the ideal of ‘leaving no one behind’.

49
Comparing Child-focused Sustainable Development Goals (SDGs) in High-income Countries: Indicator Development and Overview
Innocenti Working Paper 2017-08
Achieving a target to reduce inequalities of outcome, i.e. lowering the relative income gap among children, will have a transformational impact on child well-being as it has been shown that lower income inequality and lower income gaps are associated with higher overall child well-being (Toczydlowska et al., 2016). Bottom-end income inequality among children is also policy amenable and in fact is responsive to policy intervention. Social transfers are effective in lowering the relative income gap in Europe, although to different degrees across the continent (Toczydlowska et al., 2016).
Data from 2014 show that children in the poorest ten per cent of the population have just half of the income of children at the mid-point (50 per cent, see Figure 25). The relative income gaps among children by country vary substantially, ranging from as high as 71 per cent in Bulgaria to 34 per cent in Iceland. Since the onset of the financial crisis and global recession, the gaps in income in the bottom half of the distribution have been increasing in most cases, in particular children in eastern and southern European countries are most affected.
Figure 25 – In most countries the poorest 10% of households with children have fallen further behind the median income since 2008 Relative income gap between median income and that of the bottom 10% of households with children, 2014 and 2008
34.2
%
37.1
%
38.5
%
38.6
%
39.0
%
41.9
%
42.3
%
42.3
%
43.0
%
44.0
%
44.1
%
44.6
%
44.6
%
44.9
%
45.2
%
45.7
%
46.6
%
46.7
%
49.2
%
49.2
%
49.5
%
50.6
%
51.6
%
52.2
%
52.8
%
53.7
%
53.7
%
56.6
%
56.8
%
58.9
%
59.7
%
59.8
%
60.3
%
61.1
%
62.4
%
63.2
%
64.6
%
65.0
%
65.7
%
67.4
%
71.1
%
0%
10%
20%
30%
40%
50%
60%
70%
80%
90%
Icel
and
Nor
way
Switz
erla
ndDe
nmar
kFi
nlan
dAu
stria
Net
herla
nds
Uni
ted
King
dom
Germ
any
Irela
ndFr
ance
Luxe
mbo
urg
Kore
aCy
prus
Aust
ralia
Czec
h Re
publ
icSw
eden
New
Zea
land
Mal
taSl
oven
iaBe
lgiu
mHu
ngar
yCa
nada
Pola
ndCh
ileSl
ovak
iaCr
oatia
Lith
uani
aTu
rkey
Uni
ted
Stat
esLa
tvia
Japa
nIta
lyEs
toni
aPo
rtug
alGr
eece
Isra
elSp
ain
Mex
ico
Rom
ania
Bulg
aria
2014 2008 Country average
Country average 2014: 51.2%
Note: Relative income gap (‘bottom-end inequality’) is measured as the gap between household income of the child at the 50th percentile (the median) and that of the child at the 10th percentile, reported as a percentage of the median. Data for Chile is for 2015 only, and for Turkey, for 2014 only. Source: See Figure 3.

50
Comparing Child-focused Sustainable Development Goals (SDGs) in High-income Countries: Indicator Development and Overview
Innocenti Working Paper 2017-08
4.7.3 Score point difference in learning outcomes based on socio-economic differences
Reducing inequalities and ensuring equal opportunity of outcomes as underlined by Sustainable Development Goal 10, target 10.3, would require governments to increase their efforts in mitigating the impact of socio-economic background on child outcomes throughout the course of childhood. Children and young people should succeed in education and other areas of their lives regardless of circumstances beyond their control. These are fairness and social justice ideals (Rawls, 1971), which influence the social norms and policy discourse in many modern societies.
The socio-economic background of the family is arguably the most powerful ‘circumstance’ of childhood. Empirical evidence to date shows the extent to which family SES creates unfair opportunities for educational outcomes and leads to diverging paths very early in life, before children start kindergarten (Bradbury, 2015; Blanden, and Machin, 2010; Waldfogel, 2013; Brooks-Gunn and Duncan, 1997). There has also been a long-established connection between family socio-economic background and children’s health outcomes. A lower socio-economic background is found to increase the likelihood of fewer life opportunities and poorer health (Kuntsche and Ravens-Sieberer 2015). It remains a leading contextual factor, explaining differences in adolescent health outcomes across industrialized countries (Elgar et al. 2015; Currie et al. 2012).
Using a measure of socio-economic background developed by the Programme for International Student Assessment (PISA) – the ESCS composite index (including measures of parental employment status, parents’ education, family wealth, home educational resources, cultural possessions, and number of books in the home) – this indicator records the average score-point difference across performance in all three PISA subjects (reading, mathematics and science) associated with a one unit increase in the ESCS index.
Figure 26 compares the average impact of socio-economic background on students’ achievement in reading, mathematics and science across 39 countries with data. On average across OECD countries, one unit increase in the PISA ESCS index is associated with an increase of 38 score points, which is the equivalent to more than one year of schooling, currently estimated to be approximately 30 score points between adjacent grades (OECD, 2016, p.65).
Of the ten countries where the impact of SES is significantly higher than the OECD average, the largest score-point difference in academic performance explained by students’ socio-economic status is observed in the Czech Republic and France: one unit increase on the ESCS index is associated with a 52 and 56 point increase on average improvement across three subjects (equivalent of almost two years of schooling). From 12 countries with lower than average SES effects, Turkey stands out as by far the lowest.
Between 2006 and 2015, Chile, Turkey and Germany made the biggest gains in equity of academic outcomes of their 15-year-olds students. The socio-economic gradient in these countries declined by 7, 8, and 8 score points respectively. The Slovak Republic, the country with one of the highest socio-economic gradients in the past PISA rounds, improved significantly between 2012 and 2015 reducing the impact of SES by 14 score points. Similarly, Denmark reduced the differences attributed to SES between the latest rounds by 10 score points. Meanwhile, a substantial reverse trend in equity is observed in Korea, where the difference in students’ performance associated with a one-unit increase in the ESCS index increased by 16 score points between 2006 and 2015.

51
Comparing Child-focused Sustainable Development Goals (SDGs) in High-income Countries: Indicator Development and Overview
Innocenti Working Paper 2017-08
Figure 26 – Socio-economic advantage leads to better school results in all 39 countries studied The score-point difference in reading, mathematics and science associated with a one-unit increase in the ESCS index
20.6
26.6
27.4
29.9
30.5
31.1
31.4
31.8
31.9
32.0
32.9
33.3
35.0
35.3
35.5
36.4
37.7
37.9
38.4
38.5
38.5
38.8
39.4
39.7
41.4
41.6
41.8
42.0
42.1
42.3
43.6
43.7
44.4
45.7
46.3
46.4
47.1
52.1
56.3
0
10
20
30
40
50
60
702015 2012 2006
Country average 2014: 38.1 points
Note: All values are statistically significant. 2006 data for US is not available due to no data in reading. Mexico data is excluded due to low rates of enrolment in upper-secondary school at the time of the PISA 2015 tests (65%) - see UNICEF (2016). Socio-economic advantage led to a 19.8 score point difference in Mexico in 2015. Data on ESCS index is missing for Austria 2012 round. Austria data for 2009 is not comparable. Missing countries: Cyprus and Mexico. Source: OECD PISA survey, various waves.
A final consideration for Goal 10, and an important on-going issue for high-income countries, is migration. Target 10.7 in goal 10 – to facilitate orderly, safe, regular and responsible migration and mobility of people, including through the implementation of planned and well-managed migration policies – will be an important contribution to protecting and supporting the development of many at-risk children and youth in the coming years, and as such, a means to meeting the SDGs in high-income settings, whilst leaving no one behind. The issue of migration (either in specific SDG targets, or as a cross-cutting issue for the operationalization of SDG targets) is not addressed in this paper, but will be covered in two forthcoming Innocenti Research Briefs (see Toczydlowska and D’Costa, IRB 2017-14 and D’Costa and Toczydlowska, IRB 2017-15).
4.8 Goal 11: Making cities inclusive, safe and resilient
Sustainable Development Goal 11 is to make cities (and settlements) inclusive, safe, resilient and sustainable. This section of the paper introduces one measure: air pollution in urban areas (PM2.5 concentrations) affecting children.
Figure 29 reports the country standings on SDG 11. Ireland and Norway are most advanced countries on this measure – noting that the ranking is informed solely by air pollution in cities (weighted by concentration of under-20s in cities) – whereas air pollution in cities in Israel (along with the Republic of Korea whose estimate for air pollution is a statistical outlier, and so is excluded from the goal ranking) falls well behind the standards of other high-income countries on Goal 11.

52
Comparing Child-focused Sustainable Development Goals (SDGs) in High-income Countries: Indicator Development and Overview
Innocenti Working Paper 2017-08
Figure 27 – Making cities inclusive, safe and resilient: air pollution is a problem in Israel
65 70 75 80 85 90 95 100 105 110 115
IrelandNorway
AustraliaEstoniaFinland
SwedenPortugal
IcelandNew Zealand
SlovakiaCroatia
RomaniaUnited States
United KingdomMexico
SpainPolandAustriaCanada
DenmarkHungary
CyprusFrance
GermanyBulgaria
Czech RepublicSwitzerland
GreeceTurkey
ItalyLuxembourg
MaltaJapan
NetherlandsChile
BelgiumIsrael
Note: The result is the country performance on annual average PM2.5 concentrations in urban areas, weighted by the proportion of child population living in urban areas (0-19 years of age) relative to the international average. Missing countries: Korea, Latvia, Lithuania and Slovenia. The data point for Korea for annual average PM2.5 concentrations in urban areas, weighted for child population, 2013 is an outlier and has been excluded from the calculation of the results for Goal 11. The inclusion of the outlier would result in Korea ranking 38th on Goal 11.
Source: Author’s calculations using data sourced for Goal 11. See figure sources in this section.
4.8.1. Air pollution in urban areas (PM2.5 concentrations) affecting children
Target 11.6 – to reduce adverse per capita environmental impact of cities – is highly relevant domestically and internationally in the context of climate change. For this target the official SDG database includes data on annual mean levels of fine particular matter in cities (air pollution – 11.6.2), and although air pollution will inevitably affect children like everyone else, the indicator here uses annual average PM2.5 concentration of air pollution in urban areas weighted to account for the proportion of the 0-19 year-old population living in urban areas (child population weighted) to provide a more child-specific estimate.
Combating local area pollution is likely to have a significant positive effect on child health and well-being regionally and globally, through health as well as safe places to play. Public health effects of environmental pollution include respiratory abnormalities, abdominal and intestinal problems, blood disorders and others (UNEP, 2012). Further, as part of recognizing a child’s right to enjoyment of the highest attainable standard of health, and to leisure and play, the UNCRC (United Nations Convention on the Rights of the Child, see UNCRC, 1990) gives a specific role to governments to take into consideration the dangers and risks of environmental pollution and to recognize and promote the rights to recreational activities and play (art. 24.2 and 31.1, respectively).

53
Comparing Child-focused Sustainable Development Goals (SDGs) in High-income Countries: Indicator Development and Overview
Innocenti Working Paper 2017-08
Figure 28 illustrates the rates of PM2.5 (the size of the pollution particular matter – less than 2.5 microns in diameter – small enough to enter the lungs and bloodstream) concentration levels in each cubic metre of air in cities in 38 high-income countries after weighting for child populations in cities. To understand the numbers reported, concentrations below 10 PM2.5 are considered safe by the World Health Organisation. To account for an effect on children, the rates have been reduced according to the proportion of child population living in cities (if all children live in rural settings, the country would have a child-specific pollution rate recorded as 0, if 50% of children live in cities, the country’s urban pollution rate is halved). The higher the concentration, the greater the risk on children’s health overall in each country.
After reducing pollution rates to account for many children living outside cities (although urbanization rates are increasing) still half of all countries have higher than safe levels of air pollution of this kind. The countries with the lowest rates of pollution affecting children are found in Ireland and Norway, and the highest rates (twice the levels of safety, after weighting) are found in Israel and the Republic of South Korea.
Figure 28 – There are large variations in the levels of air pollution affecting children in high-income countries Annual average PM2.5 concentrations for 2013, 2010, 2005, in urban areas, weighted by proportion of child population (0-19) living in urban areas
4.8
4.8
5.3
5.8
5.9
6.2
6.2
6.8
7.4
7.9
7.9
8.3
8.8
8.9
9.0
9.2
9.3
9.5
9.7
10.0
10.7
10.7
11.1
11.4
11.7
11.8
12.1
12.3
12.3
12.7
13.2
13.4
14.8
14.9
16.4
18.1
23.5
24.8
0
5
10
15
20
25
30
Irela
ndN
orw
ayAu
stra
liaEs
toni
aFi
nlan
dSw
eden
Port
ugal
Icel
and
New
Zea
land
Slov
akia
Croa
tiaRo
man
iaU
nite
d St
ates
Uni
ted
King
dom
Mex
ico
Spai
nPo
land
Aust
riaCa
nada
Denm
ark
Hung
ary
Cypr
usFr
ance
Germ
any
Bulg
aria
Czec
h Re
publ
icSw
itzer
land
Gree
ceTu
rkey
Italy
Luxe
mbo
urg
Mal
taJa
pan
Net
herla
nds
Chile
Belg
ium
Isra
elKo
rea
2013 2010 2005
Country average 2013: 10.7
Note: Data is weighted to account for the child population (aged 0-19) living in urban settings according to most recent UNDP figures. 2013 is the average of 2010 and 2015 reports (data is reported every 5 years). Urbanization rates on average across the country group were 73.8% in 2005, 74.9% in 2010, and 75.4% in 2013. Data for Latvia in 2010 is 7.9, and for 2005, 8.0. For Lithuania data for 2010 is 9.1 and for 2005 9.5. Missing countries: Latvia, Lithuania, and Slovenia.
Source: Brauer et al., 2016; UNDP (2017) Urban and Rural Population by Age and Sex, 1980-2015, Downloaded at: nin.tl/UNDP2017.

54
Comparing Child-focused Sustainable Development Goals (SDGs) in High-income Countries: Indicator Development and Overview
Innocenti Working Paper 2017-08
4.9 Goal 12: Ensure sustainable production and consumption
Sustainable Development Goal 12 is to ensure sustainable production and consumption. This section of the paper introduces a measure of environmental awareness in the 15-year-old student population drawn from responses to the PISA 2015 survey. The indicator relates to target 12.8 ensuring people have the relevant information and awareness for sustainable development and lifestyles in harmony with nature.
Figure 29 reports the country standings on SDG 12. Portugal is a standout performer on this measure, noting that the ranking is informed solely by a measure of environmental awareness in the 15-year-old student population. At the opposite end of the table are Japan and Romania, countries with the lowest rates of 15-year-old students reporting familiarity with 5 or more environmental issues.
Figure 29 – Ensure sustainable production and consumption: Portuguese students know most about environmental issues
70 75 80 85 90 95 100 105 110 115 120 125
PortugalSlovenia
TurkeyEstonia
LithuaniaCanada
BulgariaIreland
United KingdomPolandFinland
LatviaNorwayCroatia
ItalySpain
GreeceAustraliaDenmark
United StatesSweden
KoreaHungary
Czech RepublicFrance
ChileIceland
LuxembourgSlovakiaAustria
SwitzerlandBelgium
NetherlandsIsrael
New ZealandJapan
Romania
Note: Result is the country performance on the indicator ‘Students familiar with 5 or more environmental issues (age 15)’ relative to the international average. Missing countries: Cyprus, Germany, Malta, and Mexico.
Source: Author’s calculations using data sourced for Goal 12. See figure sources in this section.
4.9.1 15-year-old students familiar with five or more environmental issues
The environment is at the core of sustainable development. In turn, awareness of environmental issues is a foundation of any actions promoting and supporting progress in harmony with the world around
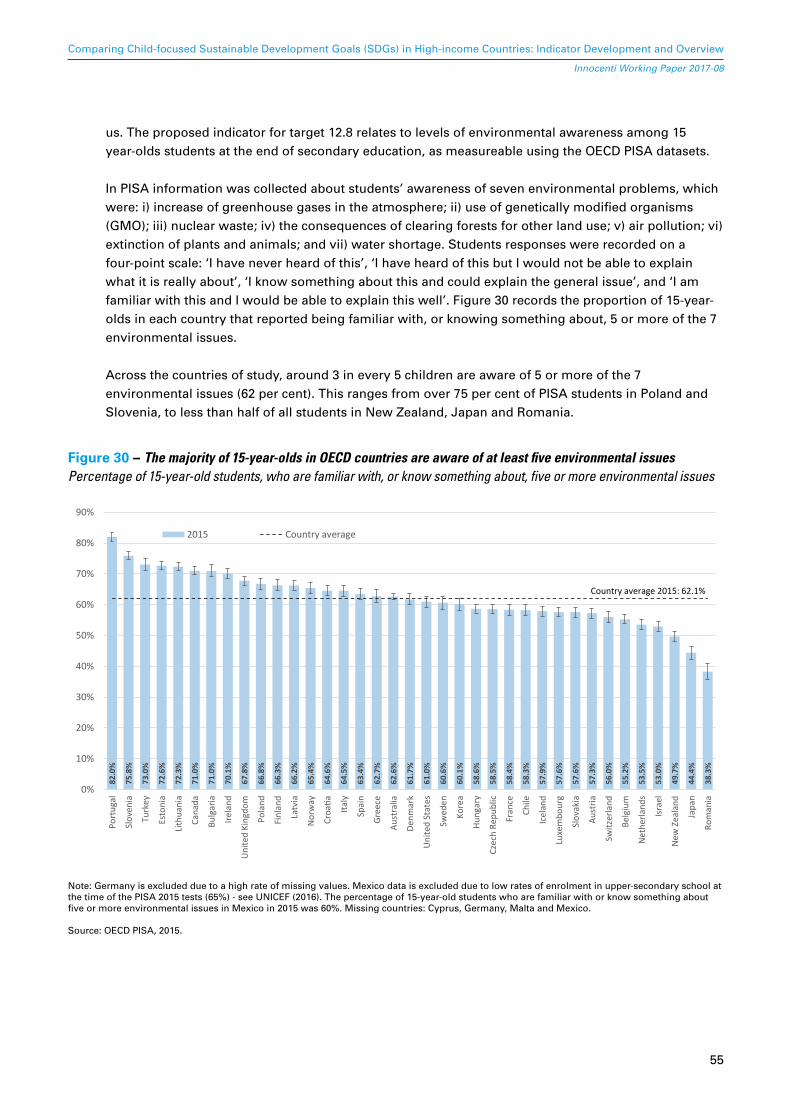
55
Comparing Child-focused Sustainable Development Goals (SDGs) in High-income Countries: Indicator Development and Overview
Innocenti Working Paper 2017-08
us. The proposed indicator for target 12.8 relates to levels of environmental awareness among 15 year-olds students at the end of secondary education, as measureable using the OECD PISA datasets.
In PISA information was collected about students’ awareness of seven environmental problems, which were: i) increase of greenhouse gases in the atmosphere; ii) use of genetically modified organisms (GMO); iii) nuclear waste; iv) the consequences of clearing forests for other land use; v) air pollution; vi) extinction of plants and animals; and vii) water shortage. Students responses were recorded on a four-point scale: ‘I have never heard of this’, ‘I have heard of this but I would not be able to explain what it is really about’, ‘I know something about this and could explain the general issue’, and ‘I am familiar with this and I would be able to explain this well’. Figure 30 records the proportion of 15-year- olds in each country that reported being familiar with, or knowing something about, 5 or more of the 7 environmental issues.
Across the countries of study, around 3 in every 5 children are aware of 5 or more of the 7 environmental issues (62 per cent). This ranges from over 75 per cent of PISA students in Poland and Slovenia, to less than half of all students in New Zealand, Japan and Romania.
Figure 30 – The majority of 15-year-olds in OECD countries are aware of at least five environmental issues Percentage of 15-year-old students, who are familiar with, or know something about, five or more environmental issues
82.0
%
75.8
%
73.0
%
72.6
%
72.3
%
71.0
%
71.0
%
70.1
%
67.8
%
66.8
%
66.3
%
66.2
%
65.4
%
64.6
%
64.5
%
63.4
%
62.7
%
62.6
%
61.7
%
61.0
%
60.6
%
60.1
%
58.6
%
58.5
%
58.4
%
58.3
%
57.9
%
57.6
%
57.6
%
57.3
%
56.0
%
55.2
%
53.5
%
53.0
%
49.7
%
44.4
%
38.3
%
0%
10%
20%
30%
40%
50%
60%
70%
80%
90%
Port
ugal
Slov
enia
Turk
ey
Esto
nia
Lith
uani
a
Cana
da
Bulg
aria
Irela
nd
Uni
ted
King
dom
Pola
nd
Finl
and
Latv
ia
Nor
way
Croa
tia
Italy
Spai
n
Gree
ce
Aust
ralia
Denm
ark
Uni
ted
Stat
es
Swed
en
Kore
a
Hung
ary
Czec
h Re
publ
ic
Fran
ce
Chile
Icel
and
Luxe
mbo
urg
Slov
akia
Aust
ria
Switz
erla
nd
Belg
ium
Net
herla
nds
Isra
el
New
Zea
land
Japa
n
Rom
ania
2015 Country average
Country average 2015: 62.1%
Note: Germany is excluded due to a high rate of missing values. Mexico data is excluded due to low rates of enrolment in upper-secondary school at the time of the PISA 2015 tests (65%) - see UNICEF (2016). The percentage of 15-year-old students who are familiar with or know something about five or more environmental issues in Mexico in 2015 was 60%. Missing countries: Cyprus, Germany, Malta and Mexico. Source: OECD PISA, 2015.
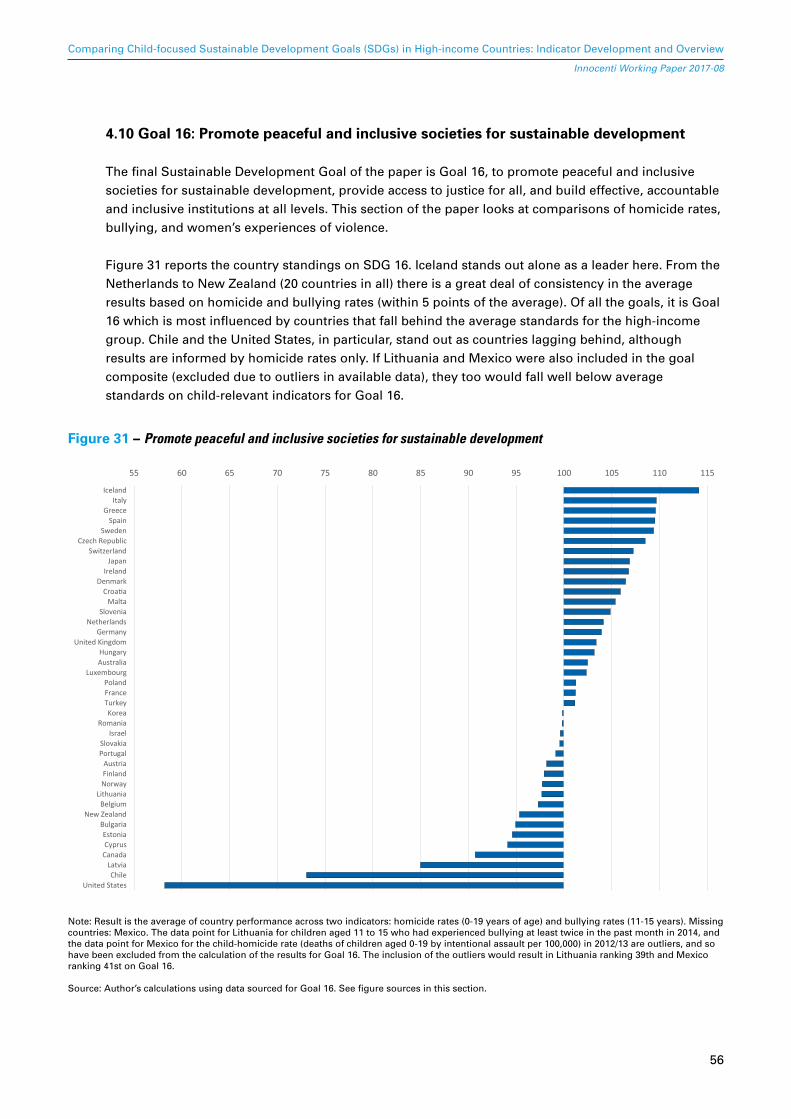
56
Comparing Child-focused Sustainable Development Goals (SDGs) in High-income Countries: Indicator Development and Overview
Innocenti Working Paper 2017-08
4.10 Goal 16: Promote peaceful and inclusive societies for sustainable development
The final Sustainable Development Goal of the paper is Goal 16, to promote peaceful and inclusive societies for sustainable development, provide access to justice for all, and build effective, accountable and inclusive institutions at all levels. This section of the paper looks at comparisons of homicide rates, bullying, and women’s experiences of violence.
Figure 31 reports the country standings on SDG 16. Iceland stands out alone as a leader here. From the Netherlands to New Zealand (20 countries in all) there is a great deal of consistency in the average results based on homicide and bullying rates (within 5 points of the average). Of all the goals, it is Goal 16 which is most influenced by countries that fall behind the average standards for the high-income group. Chile and the United States, in particular, stand out as countries lagging behind, although results are informed by homicide rates only. If Lithuania and Mexico were also included in the goal composite (excluded due to outliers in available data), they too would fall well below average standards on child-relevant indicators for Goal 16.
Figure 31 – Promote peaceful and inclusive societies for sustainable development
55 60 65 70 75 80 85 90 95 100 105 110 115
IcelandItaly
GreeceSpain
SwedenCzech Republic
SwitzerlandJapan
IrelandDenmark
CroatiaMalta
SloveniaNetherlands
GermanyUnited Kingdom
HungaryAustralia
LuxembourgPolandFranceTurkeyKorea
RomaniaIsrael
SlovakiaPortugal
AustriaFinlandNorway
LithuaniaBelgium
New ZealandBulgariaEstoniaCyprus
CanadaLatviaChile
United States
Note: Result is the average of country performance across two indicators: homicide rates (0-19 years of age) and bullying rates (11-15 years). Missing countries: Mexico. The data point for Lithuania for children aged 11 to 15 who had experienced bullying at least twice in the past month in 2014, and the data point for Mexico for the child-homicide rate (deaths of children aged 0-19 by intentional assault per 100,000) in 2012/13 are outliers, and so have been excluded from the calculation of the results for Goal 16. The inclusion of the outliers would result in Lithuania ranking 39th and Mexico ranking 41st on Goal 16.
Source: Author’s calculations using data sourced for Goal 16. See figure sources in this section.

57
Comparing Child-focused Sustainable Development Goals (SDGs) in High-income Countries: Indicator Development and Overview
Innocenti Working Paper 2017-08
4.10.1 Homicide rates of children aged 0-19 inclusive
Target 16.1 of Goal 16, is to significantly reduce all forms of violence and related death rates everywhere. The first official indicator for this broad target is the number of victims of intentional homicide per 100,000 of the population, by sex and age (16.1.1). In this paper, the rates of child homicide (ages 0-19 inclusive) are recorded in three year averages, in numbers per 100,000 of the same age cohort per year, dating back from the most recent available data. Absolute rates of homicide are standardized by population and averaged over three years for reasons of comparability of risk in different sized populations, and to account for spikes in records related to random acts of mass violence, such as terrorist events or school shootings.
Figure 32 reports child homicide rates for 38 of the countries of study, and shows that child homicides are on average lower than 1 in 100,000 of the child population. Rates vary widely, from no reported homicide cases in Maltese data, to rates of homicide nearly ten times the average in Mexico (6 children per 100,000). In the vast majority of countries, rates of homicide are falling, however in a few countries – again notably Mexico, but also Finland and Norway – increases in homicide rates have been recorded over the last decade.
Figure 32 – Child homicide rates in Mexico are more than twice that of any other OECD or EU country Child-homicide rate (deaths of children aged 0-19 by intentional assault per 100,000) – 3-year averages
0.00
0.01
0.13
0.17
0.19
0.19
0.19
0.19
0.20
0.21
0.24
0.25
0.26
0.27
0.28
0.31
0.32
0.32
0.37
0.38
0.38
0.42
0.43
0.46
0.48
0.52
0.55
0.62
0.66
0.76
0.78
0.84
0.90
1.23
1.91
2.66
5.98
0
1
2
3
4
5
6
72012/13 c2009 c2006 Country average 2012/13: 0.65 per 100,000
Note: Mexico is excluded from the composite league table as it is an outlier with a child homicide rate over 3 standard deviations higher than the Country average as reported here. Figures are 3 year averages around the year in brackets. Earlier estimates are averages for the three preceding years. Country average is unweighted. Missing countries: Greece, Iceland, Slovenia, and Slovakia.
Source: WHO Mortality database, 2016.

58
Comparing Child-focused Sustainable Development Goals (SDGs) in High-income Countries: Indicator Development and Overview
Innocenti Working Paper 2017-08
4.10.2 Proportion of 11-15 year-olds reporting being bullied more than two or three times in the last month
Target 16.1 seeks to significantly reduce all forms of violence and related deaths everywhere. For children across the globe, and equally in high-income countries, bullying is one of the most common forms of violence experienced. Bullying does not only mean children are subject to physical violence, but also to emotional and psychological violence (being teased, isolated, or made to feel afraid by peers are all forms of bullying). Bullying has recently been the focus of a UN General Assembly resolution, and in response, a report from the Office of the Special Representative to the UN Secretary General on Violence against Children. This report entitled Ending the Torment (Office of the Special Representative of the Secretary-General on Violence against Children, 2016) draws from global expertise and links experiences of bullying to ill-health, low self-esteem, poorer educational outcomes, depression and suicide ideation in childhood.
Figure 33 reports the rates of chronic bullying (more than twice in the past month) of children aged 11 to 15 years, and shows that one in ten children, on average, experiences recent and repeated bullying by their peers, in high-income countries. The Baltic countries stand out as the countries with the highest rates of chronic bullying (all significantly above 15%), and Sweden and Iceland report the lowest rates (less than 5% each). In terms of trends, the picture is mixed, although more often than not, falls are seen since 2006. In contrast, in Hungary, Latvia, Lithuania, Malta, Poland, Sweden, and the United Kingdom, the most recent rates of bullying are higher than they have been in the past 10 years.
Figure 33 – More than 1 in 10 children in rich countries are experiencing chronic bullying Children aged 11 to 15 who have experienced bullying at least twice in the past month
4.5%
4.6%
5.2%
5.3%
5.5%
6.3%
6.4%
6.6%
7.6%
7.9%
8.1%
8.3%
8.4%
9.3%
9.5%
10.0
%
10.3
%
10.5
%
10.9
%
11.3
%
11.6
%
12.0
%
12.7
%
13.3
%
13.9
%
14.7
%
15.0
%
15.1
%
16.6
%
22.7
%
29.2
%
0%
5%
10%
15%
20%
25%
30%
35%
2014 2010 2006
Country average 2014: 10.8%
Note: Chronic bullying refers to when children experience bullying 2 or more times in the past month. Data for 2014 is not available for Switzerland. Countries missing from HBSC in 2014, but not earlier waves, include Turkey and the United States. United Kingdom estimates and Belgian estimates are based on population weights for regional samples (excluding Northern Ireland in the case of the United Kingdom, and the Brussels region for Belgium). Data for Japan, which records 14.3% of 10-1- year-olds and 13-15 year olds who report they were “lightly bumped or hit or kicked while pretending to play (more than 2 or 3 times a month)”, is available from the Japanese National Center for Research on Education, 2013-15 Bullying Follow-up Survey, but not included in the comparison above. Missing countries: Australia, Chile, Cyprus, Japan, Korea, Mexico, New Zealand, Switzerland, Turkey, and the United States. Source: HBSC, various waves.

59
Comparing Child-focused Sustainable Development Goals (SDGs) in High-income Countries: Indicator Development and Overview
Innocenti Working Paper 2017-08
4.10.3 Percentage of women aged 18-24 who reported having experienced physical violence before age 15
Target 16.2 aims to end abuse, exploitation, trafficking and all forms of violence against and torture of children, both girls and boys; nevertheless the availability of comparable data remain a serious challenge under this target. While household surveys such as DHS have been collecting data in low- and middle-income countries since the late 1990s, comparable data for this indicator in rich countries is scarce. However, in the absence of a perfect indicator, a recent survey on violence against women from the European Union Agency for Fundamental Right allows the inclusion of an indicator on the percentage of women aged 18-29 who have reported having experienced physical violence before the age of 15. The effect of violence on children both through experience and the anticipation of violence can be severe, and spill over into physical and mental health, security, education, as well as being a violation of their rights.
Figure 34 shows that as many as 1 in 5 young women in Europe have experienced physical violence, perpetrated by adults, during their childhood. Approximately 45 per cent of women in age group 18-29 in Estonia answered ‘yes’ when asked about ‘experiencing physical violence before the age of 15 by an adult perpetrator’. The rate is as high as 40 per cent in Finland and around 1 in 3 young women in Bulgaria, France, Latvia, Luxembourg and Slovakia experienced physical violence as girls. In 22 countries the rate is as high as 10 per cent. The rates are lowest in Cyprus, the Netherlands and Slovenia being 9.5, at respectively 8.0 and 8.4 per cent respectively.
Slovenia being 9.5, at respectively 8.0 and 8.4 per cent respectively.
Figure 34 – One in 5 young women reported experiencing physical violence before the age of 15 Percentage of women aged 18-29 who reported having experienced physical violence before the age of 15
8.0%
8.4%
9.5%
11.3
%
11.7
%
12.2
%
12.7
%
12.8
%
15.3
%
15.7
%
16.1
%
16.2
%
18.0
%
19.6
%
20.5
%
21.9
%
22.9
%
23.7
%
24.0
%
24.7
%
25.9
%
30.0
%
30.2
%
30.9
%
31.8
%
34.9
%
40.0
%
44.6
%
0%
5%
10%
15%
20%
25%
30%
35%
40%
45%
50%2012 Country average
Country average 2012: 21.2%
Note: Physical violence was defined as: hair-pulling, slapping, hitting, kicking, beating or stabbing. Missing countries: Australia, Canada, Chile, Iceland, Israel, Japan, Korea, Mexico, New Zealand, Norway, Switzerland, Turkey, and United States.
Source: FRA gender-based violence against women survey dataset, 2012.
60
Comparing Child-focused Sustainable Development Goals (SDGs) in High-income Countries: Indicator Development and Overview
Innocenti Working Paper 2017-08
5. Where next for child-focused SDG measurement in high-income countries?
This final section highlights some critical next steps for a range of critical, and child-relevant, next steps for a range of actors working to meet the 2030 SDG Agenda in high-income countries.
5.1 Children in High-income countries and the SDGs: Priority recommendations
This paper has drawn together indicators relating to high-income countries’ positons on various child-relevant Goals and targets in the SDGs. The indictors are not always official, or complete in their country coverage, but represent a contribution to engaging high-income countries in the SDG discussions in terms of a focus on children, the situation of children outcomes and recent trends at the national level as they stand, and the acute need for good quality, comprehensive data on all children across the range of social progress and well-being measures.
As noted in the key messages, the SDGs will continue to provide a frame by which children’s issues can not only be globally monitored, but prioritized as both being good for children, and a promising method by which effective and sustained social progress can be achieved. This said, there is evidence of both success and challenges for high-income countries across the Goals reviewed here. As much as these countries can be reassured that they are already well on track to meet some of these SDGs, new approaches will be required to turn around concerning trends across some of the key targets (including poverty, income inequality, adolescent health outcomes, and education).
Based on the evidence above, UNICEF calls for high-income countries to take action in five key areas:
� Put children at the centre of sustainable and equitable progress: Focusing on children will help high-income countries to achieve the overarching SDGs by 2030. Investing in children will reinforce progress over time, and equitable approaches to children’s material well-being, health and education today will help to check adult inequalities in the future. Children will spearhead the changes in social norms and awareness that are key to attaining the goals on gender equality, peaceful societies and environmental sustainability.
� Leave no child behind: National averages will inevitably conceal variation in outcomes, and, as such, disadvantage at the bottom of the scale. Moreover, some children are left so far behind that they are entirely missing from the data presented here: for instance, those who are undocumented, out of school or in institutional care. The data collected from this point need to include all children and to allow for disaggregation of statistics by key household characteristics. A key step towards future equality and sustainability is to identify those at the greatest risk of falling behind.
� Improve the collection of comparable data in key areas: comparable statistics on high-income countries are lacking in four key SDG areas: violence against children, early childhood development, migration and gender. In the first two areas, rich countries lag behind their lower-income peers, which tend to collect these data via internationally comparable household surveys. Some of the most urgent child-rights violations in high-income countries relate to migration – and the SDG framework challenges all countries to respect the rights of all children irrespective of their migration status – yet appropriate indicators that measure their performance are lacking. Finally, given that girls tend to do better than boys on many childhood indicators, there is a paucity of data reflecting the processes that lead to women’s disadvantage in the labour market and under-representation in public life.

61
Comparing Child-focused Sustainable Development Goals (SDGs) in High-income Countries: Indicator Development and Overview
Innocenti Working Paper 2017-08
� Use these rankings to help tailor policy responses to national contexts: no country does well on all indicators and all countries face challenges in reaching the SDGs. The league tables indicate which countries come closest to the SDG vision on each goal and may allow other countries to craft policy responses that are appropriate to their own contexts.
� Honour the commitment to global sustainable development: The overarching SDG framework engages all countries in a global endeavour. High-income countries are not only accountable for their performance in pursuing the goals but also for their commitments to global environmental sustainability and development assistance, on which the future well-being of children worldwide depends.

62
Comparing Child-focused Sustainable Development Goals (SDGs) in High-income Countries: Indicator Development and Overview
Innocenti Working Paper 2017-08
REFERENCES
Andriessen, K., and Krysinska, K. (2016). A psycho-educational perspective on family involvement in suicide prevention and postvention. Chapter 32 in Wasserman, D. Ed. (2016). Suicide. An Unnecessary Death. Second Edition. Forewords by N. L. Farberow and S. Saxena. Oxford: Oxford University Pres, p. 333-345.
Australian Child Rights Task Force (undated) CRC25. Australian Child Rights Progress Report. A Report on 25 years of the UN Convention on the Rights of the Child in Australia.
Australian Government (2016) Closing the Gap: Prime Ministers’s Report 2016. Available at: http://closingthegap.dpmc.gov.au/assets/pdfs/closing_the_gap_report_2016.pdf
Baker, M. and Milligan, K.S. (2007) Maternal employment, breastfeeding, and health: Evidence from maternity leave mandates, NBER Working Papers 13188, National Bureau of Economic Research, Inc.
Barnett, W.S. (2008). Preschool Education and Its Lasting Effects: Research and Policy Implications. National Institute for Early Education Research Rutgers. Boulder and Tempe: Education and the Public Interest Center and Education Policy Research Unit. Retrieved [date] from http://epicpolicy.org/publication/preschooleducation
Beautrais, A.L. (2000). Risk factors for suicide and attempted suicide among young people. Australian and New Zealand Journal of Psychiatry, 34 (3): 420-436.
Bell, D. and Blanchflower, D. (2011). ‘Young People and the Great Recession’. Oxford Review of Economic Policy 27 (2): 241–67.
Bernal, J., et al., (2014). Food insecurity in children but not in their mothers is associated with altered activities, school absenteeism, and stunting. Journal of Nutrition, 2014. 144: p. 1619-1626.
Blanden, J., and Machin, S. (2010). Intergenerational inequality in early years’ assessments. In K. Hansen, H. Joshi, and S. Dex (Eds.), Children of the 21st Century–The First Five Years (pp. 153–168). Bristol: The Policy Press.
Bradbury, B., Corak, M., Waldfogel, J., and Washbrook, J. (2015). Too Many Children Left Behind: The U.S. Achievement Gap in Comparative Perspective. Russel Sage Foundation: New York.
Brauer M. et al (2016) Ambient air pollution exposure estimation for the Global Burden of Disease 2013. Environmental Science and Technology 50(1): 79-88.
Brooks-Gunn, J., and Duncan, G. J. (1997). The effects of poverty on children. The future of children, 55–71.
Bruckauf, Z. (2017). Adolescents’ Mental Health: Out of the shadows. Evidence on psychological well-being of 11-15 year olds youth from 31 industrialised countries, Innocenti Research Brief 2017-12, UNICEF Office of Research – Innocenti, Florence.

63
Comparing Child-focused Sustainable Development Goals (SDGs) in High-income Countries: Indicator Development and Overview
Innocenti Working Paper 2017-08
Bruckauf, Z. and Chzhen, Y. (2016a). Education for All? Measuring inequality of educational outcomes among 15-year-olds across 39 industrialized nations, Innocenti Working Paper 2016-08, UNICEF Office of Research, Florence.
Bruckauf, Z. and Chzhen, Y. (2017). Is University Education More Important for a Boy than for a Girl? Social approval of unequal educational opportunity in across 19 countries, Innocenti Research Brief 2017-11, UNICEF Office of Research – Innocenti, Florence.
Bruckauf, Z. and Hayes, N. (2017). Quality of Childcare and Pre-primary Education. How do we measure it? Innocenti Research Brief 2017-13, UNICEF Office of Research – Innocenti, Florence.
Bruckauf, Z. and Rees, G. (2017). Children’s Involvement in Housework: Is there a case of gender stereotyping? Evidence from International Survey of Children’s Well-Being (ISCWeb), Innocenti Research Brief 2017-17, UNICEF Office of Research – Innocenti, Florence.
Bruckauf, Zlata (2016b). Falling Behind: Socio-demographic profiles of educationally disadvantaged youth. Evidence from PISA 2000-2012, Innocenti Working Paper 2016-11, UNICEF Innocenti Research Centre, Florence.
Bruckauf. Z. and Cook, S. (2017). Child-centred Approach to the Sustainable Development Goals (SDGs) in High-income Countries: Conceptual issues and monitoring approaches, Innocenti Working Paper 2017-06, UNICEF Office of Research – Innocenti, Florence.
Casey, P.H., et al. (2005). Child health-related quality of life and household food insecurity. Archives of Pediatric Adolescent Medicine, 159(1): p. 51-56.
Christiansen, E., Larsen, K.J., Agerbo, E., Bilenberg, N. and Stenager, E. (2013). Incidence and risk factors for suicide attempts in a general population of young people: A Danish register-based study. Australian and New Zealand Journal of Psychiatry, 47 (3): 259-270.
Chzhen, Y. and Richardson, D. (2014). Young people (not) in the labour market in rich countries during the Great Recession, Innocenti Working Paper 2014-12, UNICEF Office of Research, Florence
Chzhen, Y., Bruckauf, Z. and Toczydlowska, E. (2017). Sustainable Development Goal 1.2: Multidimensional child poverty in the European Union, Innocenti Working Paper 2017-07, UNICEF Office of Research – Innocenti, Florence.
Cooper, M.L. (2002). Alcohol Use and Risky Sexual Behavior among College Students and Youth: Evaluating the Evidence. Journal of Studies of Alcohol, Supplement N.14:101-117
Corak, M. (2006). Do poor children become poor adults? Lessons from a cross-country comparison of generational earnings mobility. Research on Economic Inequality, 13, 143–188. doi:10.1016/S1049-2585(06)13006-9
Currie, C., Zanotti, C., Morgan, A., Currie, D., de Looze, M., Roberts, C., et al. (2012). Social determinants of health and well-being among young people. Copenhagen: World Health Organization Regional Office for Europe.

64
Comparing Child-focused Sustainable Development Goals (SDGs) in High-income Countries: Indicator Development and Overview
Innocenti Working Paper 2017-08
D’Costa, B. and Toczydlowska, E. (2017). Not Refugee Children, Not Migrant Children, But Children First: Lack of a systematic and integrated approach, Innocenti Research Brief 2017-15, UNICEF Office of Research – Innocenti, Florence.
De Looze M.E. et al.(2012). Early risk behaviors and adolescent injury in 25 European and North American countries: a cross-national consistent relationship. The Journal of Early Adolescence, 32(1):101–122.
de Neubourg, C., Chai, J., de Milliano, M., Plavgo, I. and Wei, Z. (2012). Step-by-step guidelines to the multiple overlapping deprivation analysis (MODA). UNICEF Office of Research Working Paper, WP-2012-10.
DESA (2015). State of the Worlds’ Indigenous People 2nd Volume, Health. Division for Social Policy and Development Indigenous People. http://www.un.org/esa/socdev/unpfii/documents/2016/Docs-updates/SOWIP_Health.pdf
Due, P. et al. (2005). Bullying and symptoms among school-aged children: international comparative cross-sectional study in 28 countries. European Journal of Public Health, Vol.15., N.5: 128-132.
Elgar, F. J., Pförtner, T.-K., Moor, I., De Clercq, B., Stevens, G. W. and Currie, C. (2015). Socioeconomic inequalities in adolescent health 2002–2010: a time-series analysis of 34 countries participating in the Health Behaviour in School-aged Children study. The Lancet, 385(9982), 2088–2095.
Entwistle, D. R. and Astone, N. M. (1994). Some Practical Guidelines for Measuring Youth’s Race/Ethnicity and Socioeconomic Status. Child Development, 65, 1521-1540.
Esping-Andersen, G., and Myles, J. (2009). Economic inequality and the welfare state. The Oxford Handbook of Economic Inequality, 639–664.
Eurofund (2012). Young People Not in Employment, Education or Training: Characteristics, Costs and Policy Responses in Europe. Dublin: European Foundation for the Improvement of Living and Working Conditions.
Every Child a Chance Trust (2009). The long-term costs of literacy difficulties. 2nd Ed. accessed 15.09.2015: available at: http://ilc.ioe.ac.uk/documents/The_long_term_costs_of_literacy_difficulties_2nd_edition.pdf.
Feeny, T. and Boyden, J. (2004). Acting in adversity: Rethinking the causes, experiences and effects of child poverty in contemporary literature. Literature and thought on Children and Poverty”, in Children and Poverty Series Working Paper, 116. Accessed 22 July 2013.
Fram, M.S., et al. (2015). Child Experience of Food Insecurity Is Associated with Child Diet and Physical Activity. The Journal of nutrition, 145(3): p. 499-504.
Freeman, J. G., King, M., Pickett, W., Craig, W., Elgar, F., Jansen, I., Klinger, I. (2011). The health of Canada’s young people: a mental health focus. Health Behaviour of School-aged Children, Public Health Agency of Canada.

65
Comparing Child-focused Sustainable Development Goals (SDGs) in High-income Countries: Indicator Development and Overview
Innocenti Working Paper 2017-08
Gariepy, G., McKinnon, B., Sentenac, M. et al. (2016). Validity and Reliability of a Brief Symptom Checklist to Measure Psychological Health in School-Aged Children. Child Indicators Research 9: 471. doi:10.1007/s12187-015-9326-2
Gordon, D., Nandy, S., Pantazis, C., Pemberton, S., and Townsend, P. (2003). The distribution of child poverty in the developing world. Bristol: Centre for International Poverty Research.
Gregg, P., and Machin, S. (2001). Childhood experiences, educational attainment and adult labour market performance. Child well-being, child poverty and child policy in modern nations, 129–150.
Griggs, J., and Walker, R. (2008). The costs of child poverty for individuals and society: a literature review. Joseph Rowntree Foundation.
Guio, A.-C., Gordon, D., and Marlier, E. (2012). Measuring material deprivation in the EU: Indicators for the whole population and child-specific indicators, Eurostat Methodologies and Working Papers, Luxembourg: Office for Official Publications of the European Communities.
Harden, A., Brunton, G., Fletcher, A., et al. (2009). Teenage pregnancy and social disadvantage: Systematic review integrating controlled trials and qualitative studies. BMJ, 339: b4254
Haugland, S. and Wold, B. (2001). Subjective health complaints in adolescence. Reliability and validity of survey methods. Journal of Adolescence, 24: 611–624.
Heckman J.J., Moon S.H., Pinto, R., Savelyev, P.A., Yavitz, A.Q. (2010). Analyzing Social Experiments as Implemented: A Reexamination of the Evidence from the HighSchope Perry Preschool Program. Quantitative Economics. 1(1):1-46.
Heckman, J.J. (2008). Schools, Skills, and Synapses. Economic Inquiry, 46 (3): 289-324.
Heckman, J.J., Rodrigo P. Savelyev, P. (2013). Understanding the Mechanisms Through Which an Influential Early Childhood Program Boosted Adult Outcomes, American Economic Review, 103(6): 2052-2086.
Hoffman, S.D. and Maynard, R.A. (2008). Kids Having Kids. Economic Costs and Social Consequences of Teens Pregnancies. Washington, DC: The Urban Institute Press.
ILO (2016). Sustainable Development Goals. Indigenous peoples in focus. Brief. Available at: http://www.ilo.org/global/topics/indigenous-tribal/publications/WCMS_503715/lang--en/index.htm
ILO (2016). World Employment and Social Outlook 2016: Trends for youth, International Labour Office – Geneva.
Irvine, J., Kitty, D., Pekeles, G., (2012). Healing winds: Aboriginal child and youth health in Canada. Paediatric Child Health, 17 (7): 363-364.
Jackson C et al. (2012). Interventions to prevent substance use and risky sexual behaviour in young people: a systematic review. Addiction, DOI: 10.1111/j.1360-0443.2011.03751.

66
Comparing Child-focused Sustainable Development Goals (SDGs) in High-income Countries: Indicator Development and Overview
Innocenti Working Paper 2017-08
Jaffe, K., J. Bernal, and H. Herrera (2014). Relation between shame, nutrition and happiness in children. Acta Cientifica Venezolana, 65(1): p. 29-39.
Juvonen, J., Graham, S., and Schuster, M., (2003). Bullying Among Young Adolescents: The Strong, the Weak, and the Troubled, Pediatrics, V.112/6:1231-1237.
Jyoti, D.F., E.A. Frongillo, and S.J. Jones (2005). Food insecurity affects school children’s academic performance, weight gain, and social skills. Journal of Nutrition, 135: p. 2831-2839.
Kuntsche, E., and Ravens-Sieberer, U. (2015). Monitoring adolescent health behaviours and social determinants cross-nationally over more than a decade: introducing the Health Behaviour in School-aged Children (HBSC) study supplement on trends. The European Journal of Public Health, 25(suppl 2), 1–3.
Leppälahti, S., Gissler, M., Mentula, M., Heikinheimo, O., (2013). Is teenage pregnancy an obstetric risk in a welfare society? A population-based study in Finland, from 2006 to 2011, BMJ open e003225 doi:10.1136/bmjopen-2013-003225
Marshall, E.J (2014). Adolescent Alcohol Use: Risks and Consequences. Alcohol and Alcoholism, Vol. 49, No. 2: 160–164.
Mcdonald and Wilson (2016). Shameful Neglect. Indigenous Child Poverty in Canada. Canadian Centre for Policy Alternatives. Available at: https://www.policyalternatives.ca/sites/default/files/uploads/publications/National%20Office/2016/05/Indigenous_Child%20_Poverty.pdf
National Household Survey, 2011. Aboriginal Peoples in Canada: First nations People, Metis and Inuit. Statistics Canada. Catalogue no. 99-011-X2011001. Available at: https://www12.statcan.gc.ca/nhs-enm/2011/as-sa/99-011-x/99-011-x2011001-eng.cfm
Norwegian Directorate for Education and Training (2016). The Education Mirror. Available at: http://utdanningsspeilet.udir.no/2016/wp-content/uploads/2016/10/Utdanningsspeilet_2016_en.pdf
Nove, A., Matthews, Z., Neal, A., et al. (2012). Maternal mortality in adolescents compared with women of other ages: Evidence from 144 countries. The Lancet Glob Health, 2: 155–e164.Maguire, S. (2013). What measures can be taken to address the specific problem of NEET young people. Intereconomics, 4, pp.196-201.
O’Dea D. and Tucker, S. (2005). The Cost of Suicide to Society. Wellington: Ministry of Health. Available at: https://www.health.govt.nz/system/files/documents/publications/thecostofsuicidetosociety.pdf
OECD (1996). The Knowledge-Based Economy. Paris: Organisation for Economic Co-operation and Development. Available at: https://www.oecd.org/sti/sci-tech/1913021.pdf
OECD (2009). Doing Better for Children, OECD Publishing, Paris, http://dx.doi.org/10.1787/9789264059344-en
OECD (2011) Doing Better for Families. OECD publishing, Paris.

67
Comparing Child-focused Sustainable Development Goals (SDGs) in High-income Countries: Indicator Development and Overview
Innocenti Working Paper 2017-08
OECD (2013a). PISA 2012 Results: Excellence Through Equity: Giving Every Student the Chance to Succeed (Volume II), PISA, OECD Publishing. http://dx.doi.org/10.1787/9789264201132-en
OECD (2013b). Education at a Glance 2013: OECD Indicators. Paris: OECD Publishing.
OECD (2014). PISA Technical Report 2012. Chapter 16: Scaling Procedures and Construct Validation of Context Questionnaire Data. Available at: http://www.oecd.org/pisa/pisaproducts/PISA-2012-technical-report-final.pdf
OECD (2015). Education at Glance 2015: OECD Indicators, OECD Publishing. http://dx.doi.org/10.1787/eag-2015-en.
OECD (2015). How’s Life for Children?, in OECD, How’s Life?, OECD publishing, Paris.
OECD (2016). What are the benefits from early childhood education? Education Indicators in Focus Brief. May 2016. DOI: 10.1787/22267077, Available at http:// at http://www.oecd-ilibrary.org/education/what-are-the-benefits-from-early-childhood-education_5jlwqvr76dbq-en
Office of the Special Representative of the Secretary-General on Violence against Children (2016), Ending the torment: tackling bullying from the schoolyard to cyberspace, UN Publications, New York.
OHCHR (2017) State Parties Reports to the UNCRC. Downloadable at: http://www.ohchr.org/EN/HRBodies/CRC/Pages/CRCIndex.aspx
Parsons, S. and Bynner, J. (1997). Numeracy and employment. Education + Training, V. 39 (2), 43-51.
Parsons, S. and Bynner, J. (2005). Does numeracy matter more? London: National Research and Development Centre for Adult Literacy and Numeracy, Institute of Education, University of London.
Perren, S., Dooley, J., Shaw, T. and Cross, D. (2010). Bullying in school and cyberspace: Associations with depressive symptoms in Swiss and Australian adolescents Child and Adolescent Psychiatry and Mental Health, V. 4:28, DOI: 10.1186/1753-2000-4-28.
Pickett W et al. (2005). Cross national study of injury and social determinants in adolescents. Injury Prevention, 11(4):213–218.
Quintini, G. (2014). Skills at Work: How Skills and their Use Matter in the Labour Market, OECD Social, Employment and Migration Working Papers, No. 158, OECD Publishing. http://dx.doi.org/10.1787/5jz44fdfjm7j-en
Richardson, D. and A. Nabil (2014), An Evaluation of International Surveys of Children. OECD Social, Employment and Migration Working Papers (No. 146). Retrieved from http://dx.doi.org/10.1787/5jxzmjrqvntf-en

68
Comparing Child-focused Sustainable Development Goals (SDGs) in High-income Countries: Indicator Development and Overview
Innocenti Working Paper 2017-08
Robbins, D.R. and Alessi, N.E. (1985). Depressive symptoms and suicidal behavior in adolescents. American Journal of Psychiatry. 142(5):588-92.
Roemer, J.E. 1998. Equality of Opportunity. Boston: Harvard University Press.
Sachs, J., Schmidt-Traub, G., Kroll, C., Durand-Delacre, D. and Teksoz, K. (2016). SDG Index and Dashboards - Global Report. New York: Bertelsmann Stiftung and Sustainable Development Solutions Network (SDSN).
Saha, K.K., et al. (2010). Household food security is associated with early childhood language development: results from a longitudinal study in rural Bangladesh. Child: Care, health and development, 2010. 36(3): p. 309-316.
Shochet, I.M., Dadds, M.R., Ham, D., and Montague, R. (2006). School Connectedness Is an Underemphasised parameter in Adolescent Mental Health: Results of a Community Prediction Study, Journal of Clinical Child and Adolescent Psychology, Vol.35m N.2, p.170-179
Shomos, A. and Forbes, M. (2014). Literacy and Numeracy Skills and Labour Market Outcomes in Australia. Productivity Commission Staff Working Paper. Available at: http://www.pc.gov.au/research/supporting/literacy-numeracy-skills/literacy-numeracy-skills.pdf
Singth, S., Darroch, J.E. Frost, J.J., at al. (2001). Socioeconomic Disadvantage and Adolescent Women’s Sexual and Reproductive Behaviour: The Case of Five Developed Countries. Family Planning Perspective. 33(6):251–258 and 289.
Statistics Norway (2016). Population, Sami 2014-2015. Statbank. Available at: https://www.ssb.no/en/befolkning/statistikker/samisk
Suhrcke, M., Pillas, D., Selai, C. (2007). Economic aspects of mental health in children and adolescents. Background paper. World Health Organization. Available at: http://www.euro.who.int/__data/assets/pdf_file/0003/76485/Hbsc_Forum_2007_economic_aspects.pdf?ua=1
Sylva, K., Melhuish, E., Sammons, P., Siraj-Blatchford, I., Taggart, B., and Elliot, K. (2003). The effective provision of pre-school education (EPPE) Project: Findings from the Pre-school period. Brief No: RBX15. Available at: http://www.statesassembly.gov.je/ScrutinyReviewResearches/2007/S-9175-13573-3152007.pdf
Sznitman SR, Reisel L, Romer D. (2011). The neglected role of adolescent emotional well-being in national educational achievement: bridging the gap between education and mental health policies. Journal of Adolescent Health, 2011, 48(2):135–1
Toczydlowska, E. and Bruckauf, Z. (2017). Growing Inequality and Unequal Opportunities in Rich Countries, Innocenti Research Brief 2017-16, UNICEF Office of Research – Innocenti, Florence.
Toczydlowska, E. and D’Costa, B. (2017). Migration and Inequality: Making policies inclusive for every child, Innocenti Research Brief 2017-14, UNICEF Office of Research – Innocenti, Florence.
69
Comparing Child-focused Sustainable Development Goals (SDGs) in High-income Countries: Indicator Development and Overview
Innocenti Working Paper 2017-08
Toczydlowska, E., et al. (2016). Income Inequality among Children in Europe 2008–2013, Innocenti Working Papers no. 2016_15, UNICEF Innocenti Research Centre, Florence
Townsend, P. (1979). Poverty in the United Kingdom: a survey of household resources and standards of living. University of California Pr. Accessed here on 22 July 2013.
UN (2016) Report on the Inter-Agency and Expert Group on Sustainable Development Goal indicators, Annex IV, Final List of Proposed Sustainable Development Goal indicators, downloaded at http://unstats.un.org/sdgs/indicators/Official%20List%20of%20Proposed%20SDG%20Indicators.pdf
UN General Assembly (2015) Transforming our world: the 2030 Agenda for Sustainable Development. Downloaded at http://www.un.org/ga/search/view_doc.asp?symbol=A/RES/70/1andLang=E, January 2017.
UNCRC (1990). United Nations Convention on the Rights of the Child, United Nations, New York. www.unhchr.ch/html/menu3/b/k2crc.htm.
UNEP (2012). Environmental Pollution and Impacts on Public Health - Report Summary. Urban Environment Unit, Nairobi, Kenya
UNICEF (2007). Child poverty in perspective: A League Table of Child Well-being. UNICEF Innocenti Report Card 7, Office of Research – Innocenti.
UNICEF (2010). The Children Left Behind: A league table of inequality in child well-being in the world’s rich countries, Innocenti Report Card no. 9, UNICEF Office of Research - Innocenti, Florence
UNICEF (2012). Challenges: Newsletter on progress towards the Millennium Development Goals from a child right perspective. The Rights of Indigenous Children. Number 14, September 2012. Available at: https://www.unicef.org/lac/challenges-14-ECLAC-UNICEF.pdf
UNICEF (2013). Child Well-being in Rich Countries: A comparative overview, Innocenti Report Card 11, UNICEF Office of Research - Innocenti, Florence
UNICEF (2014a), Hidden in Plain Sight: A statistical analysis of violence against children, UNICEF, New York, 2014.
UNICEF (2014b). Children of the Recession: The impact of the Economic Crisis on Child Well-being in Rich Countries, Innocenti Report Card 11, UNICEF Office of Research- Innocenti, Florence.
UNICEF (2016). Fairness for Children. A league table of inequality in child well-being in rich countries, Innocenti Report Card 13, UNICEF Office of Research - Innocenti, Florence
United Nations Population Fund (2013). Motherhood in childhood: Facing the challenge of adolescent pregnancy: The State of World Population 2013, New York: 163–196.
Victora, C., Aluísio J. D., Barros A. J. D., and França, G. V. A. et al. (2016). Breastfeeding in the 21st century: epidemiology, mechanisms, and lifelong effect. Lancet 2016; 387: 475–90.

70
Comparing Child-focused Sustainable Development Goals (SDGs) in High-income Countries: Indicator Development and Overview
Innocenti Working Paper 2017-08
Wagner, M. and Cameto, R. (2004). The Characteristics, Experiences, and Outcomes of Youth with Emotional Disturbances. A Report from the National Longitudinal Transition Study-2 3(2):1-7.
Waldfogel, J. (2013). Socio-economic inequality in childhood and beyond: an overview of challenges and findings from comparative analyses of cohort studies. Longitudinal and Life Course Studies, 4(3), 268–275.
Wasserman, D. Ed. (2016). Suicide. An Unnecessary Death. Second Edition. Forewords by N. L. Farberow and S. Saxena. Oxford: Oxford University Press.
WHO (2009). Harmful use of Alcohol. NMH Fact Sheet. Word Health Organization. Available at http://www.who.int/nmh/publications/fact_sheet_alcohol_en.pdf
WHO (2010). Global strategy to reduce the harmful use of alcohol. World Health Organization. Available at http://www.who.int/substance_abuse/alcstratenglishfinal.pdf?ua=1
WHO (2014). Preventing Suicide. A Global Imperative. World Health Organization.
WHO (2015). Mental Health Atlas 2014. World Health Organization: Geneva. Available at http://apps.who.int/iris/bitstream/10665/178879/1/9789241565011_eng.pdf
World Commission on Environment and Development (1987), Our Common Future: Report of the World Commission on Environment and Development. Downloaded at http://www.un-documents.net/our-common-future.pdf, January 2017.
World Development Indicators (2016), data used in the RC14.
Xi-Kuan Chen, Shi Wu Wen, Fleming, N., Demissie, K., Rhoads, G.G. and Walker, M. (2007). Teenage pregnancy and adverse birth outcomes: a large population based retrospective cohort study, Int. J. Epidemiol. (2007) 36 (2):368-373, doi: 10.1093/ije/dyl284
Young, N.L., Wabano, M.J., Usuba, K., Pangowish, B., Trottier, M., Jacko, D., Burke, T.A., Cobiere, R.G. (2015). Validity of the Aboriginal Children’s Health and Well-being Measure: Aaniish Naa Gegii? Health Qual Life Outcomes, V. 13: 148

71
Comparing Child-focused Sustainable Development Goals (SDGs) in High-income Countries: Indicator Development and Overview
Innocenti Working Paper 2017-08
DATA SOURCES
Australian Bureau of Statistics (2017). Available at: http://www.abs.gov.au/ausstats/
EC (2016). European Survey on Income and Living Conditions: see http://ec.europa.eu/eurostat/web/microdata/european-union-statistics-on-income-and-living-conditions
Fundamental Rights Agency (2012). Violence against women survey: see http://fra.europa.eu/en/publication/2014/violence-against-women-eu-wide-survey-main-results-report
HBSC (varies waves). Health Behaviour in School-aged Children Study: see www.hbsc.org.
OECD PISA (2012). Programme for International Student Assessment: see https://www.oecd.org/pisa.
OECD (2016). OECD Family Database: accessed http://www.oecd.org/social/family/database.htm, September 2016
OECD (2016). OECD Health database: accessed http://www.oecd.org/els/health-systems/health-data.htm, September 2016.
OECD Stat. (2016). OECD Statistics database: accessed http://stats.oecd.org/, September 2016
UNStats (2016). SDG Indicators, Global Database: accessed http://unstats.un.org/sdgs/indicators/database/, September 2016.
WHO (2016). WHO Mortality Database: accessed http://www.who.int/healthinfo/mortality_data/en/, September 2016
World Bank (2016). World Development Indicators: accessed http://data.worldbank.org/data-catalog/world-development-indicators, September 2016
http://ec.europa.eu/eurostat/web/microdata/european-union-statistics-on-income-and-living-conditions

72
Comparing Child-focused Sustainable Development Goals (SDGs) in High-income Countries: Indicator Development and Overview
Innocenti Working Paper 2017-08
ANNEX I: GOAL COMPOSITES AND THE LEAGUE TABLE: DATA SOURCES, METHODS AND SENSTIVITY TESTS
A1.1 Calculating goal composites
Goal composites are calculated using an unweighted average of z scores for each indicator in the goal, following the exclusion of outlying results (plus or minus 3 standard deviations from the mean). Following an initial round of exclusions, no further exclusions are made (for instance, in cases where countries are outliers in the second round of standardisation, following initial exclusions). Statistical outliers are noted beneath each goal composite charts as appropriate (as is the result in case of their inclusion).
To calculate a z-score involves establishing the difference between a reported value and the mean, and then dividing it by the standard deviation. Before averaging, indicator z-scores are reordered so that higher values represent more positive outcomes. The final results are standardised to present the country average as 100, and the standard deviation in the range as 10 (z scores result in a mean of 0 and a standard deviation of 1, the standardisation is simply performed as follows: (z-score * 10) + 100).
A1.2 League table methods
To create the league table, goal composites were ranked and ordered from 1 to 41 (or the maximum number of countries) with rank 1 being the highest performing country. Country results are presented in order of highest average rank from all available Goal ranks by country, with the value of each Goal (regardless of the number of indicators per goal) equally weighted. The country positon in the league table is most robustly interpreted in terms of group status (high, middle and low performing groups - based on sensitivity tests) – and so average ranks have not been presented in the league table.
A1.3 Sensitivity tests
Sensitivity tests on the league table positions were undertaken by assigning 500 random weights to each Goal (between the range of 0 and 1, using the ‘=RAND()’ command in excel), and recalculating final membership groups (country being in high, middle or low performing groups). The result show (see Annex 1 Figure 1 and Table 1 below), that stability in ranking and group order is strongest at the upper and lower end of the league table, as well as in the middle of the mid-group. Only Cyprus and Latvia fall outside the group position (both lower) more often than not when comparing random weighting to the equal weighting approach used to calculate the league table.

73
Comparing Child-focused Sustainable Development Goals (SDGs) in High-income Countries: Indicator Development and Overview
Innocenti Working Paper 2017-08
Annex 1 Figure 1 – After 500 re-ranks with randomly assigned weights, results show that high, low and mid-ranking groups are robust
Randomly assigned weights
100%
100%
100%
100%
100%
100%
100%
100%
100%
100%
100%
90%
57%
76%
91%
88% 94
% 98%
100%
100%
100%
100%
100%
100%
100%
87%
47%
37%
73%
99%
100%
100%
100%
100%
100%
100%
100%
100%
100%
100%
100%
0
50
100
150
200
250
300
350
400
450
500
No
rway
Ger
man
y
Den
mar
k
Sw
eden
Finl
and
Icel
and
Sw
itze
rlan
d
Ko
rea
Slo
ven
ia
Net
her
lan
ds
Irel
and
Jap
an
Un
ited
Kin
gdom
Luxe
mb
ou
rg
Au
stri
a
Sp
ain
Est
on
ia
Por
tug
al
Fran
ce
Cze
ch R
epub
lic
Au
stra
lia
Cro
atia
Pol
and
Ital
y
Can
ada
Bel
giu
m
Cyp
rus
Latv
ia
Mal
ta
Slo
vaki
a
Gre
ece
Hu
ng
ary
Lith
uan
ia
New
Zea
lan
d
Isra
el
Tu
rkey
Un
ited
Sta
tes
Mex
ico
Rom
ania
Bu
lgar
ia
Chi
le
Randomly assigned weights

74
Comparing Child-focused Sustainable Development Goals (SDGs) in High-income Countries: Indicator Development and Overview
Innocenti Working Paper 2017-08
Annex 1 Table 1 – Sensitivity tests data
Country nameGroup membership in the League table (unweighted data)
Average group membership Matches from 500 Match rate
Australia 2 1.99 499 100%
Austria 2 1.91 456 91%
Belgium 2 2.13 437 87%
Bulgaria 3 3.00 500 100%
Canada 2 2.00 498 100%
Chile 3 3.00 500 100%
Croatia 2 2.00 500 100%
Cyprus 2 2.53 237 47%
Czech Republic 2 2.00 500 100%
Denmark 1 1.00 500 100%
Estonia 2 1.94 468 94%
Finland 1 1.00 500 100%
France 2 2.00 500 100%
Germany 1 1.00 500 100%
Greece 3 3.00 500 100%
Hungary 3 3.00 500 100%
Iceland 1 1.00 500 100%
Ireland 1 1.00 500 100%
Israel 3 3.00 500 100%
Italy 2 2.00 500 100%
Japan 1 1.10 448 90%
Korea 1 1.00 500 100%
Latvia 2 2.63 186 37%
Lithuania 3 3.00 500 100%
Luxembourg 2 1.76 378 76%
Malta 3 2.73 364 73%
Mexico 3 3.00 500 100%
Netherlands 1 1.00 500 100%
New Zealand 3 3.00 500 100%
Norway 1 1.00 500 100%
Poland 2 2.00 500 100%
Portugal 2 1.98 490 98%
Romania 3 3.00 500 100%
Slovakia 3 2.99 494 99%
Slovenia 1 1.00 500 100%
Spain 2 1.88 442 88%
Sweden 1 1.00 500 100%
Switzerland 1 1.00 500 100%
Turkey 3 3.00 500 100%
United Kingdom 1 1.43 285 57%
United States 3 3.00 500 100%
Note: Group membership is ranked 1 to 3 for high to low groups.