COMPARATIVE SWOT ANALYSIS IN THE FRAME...
54
. . COMPARATIVE SWOT ANALYSIS IN THE FRAME OF TAB PROJECT Samar Al Sayegh Petkovšek, Zdenka Mazej Grudnik WP3: Transnational baseline and monitoring with stakeholder involvement
Transcript of COMPARATIVE SWOT ANALYSIS IN THE FRAME...
. .
COMPARATIVE SWOT ANALYSIS IN THE
FRAME OF TAB PROJECT
Samar Al Sayegh Petkovšek, Zdenka Mazej Grudnik
WP3: Transnational baseline and monitoring with
stakeholder involvement
.
. Comparative SWOT analysis in the frame of TAB project
1
Title of the Report: COMPARATIVE SWOT ANALYSIS IN THE FRAME OF
TAB PROJECT
Title of the Project: Take a Breath! Adaptation actions to reduce adverse health
impacts of air pollution (TAB), project code: 3CE356P3
Financed by: European Regional Development Fund (ERDF)
Responsible promoter: Samar Al Sayegh Petkovšek (ERICo L.t.d.)
Authors: Samar Al Sayegh Petkovšek, Ph.D.
Zdenka Mazej Grudnik, Ph.D.
Co-workers at ERICo: Klara Orešnik, M.Sc.
Ida Jelenko, Ph.D.
Boštjan Pokorny, Ph.D.
Co-workers TAB: Ferencsik István and Anna Paldy (Hungary)
Alina Kotuła, Iwona Balińska, Grażyna Kowalska (Poland)
Anna Lehká and Peřina Tomáš (Czheck Republik)
Francesco Tagliaferro and Fabio Giannetti (Italy)
Head of Department: Boštjan Pokorny, Ph.D.
Date: 27.06.2013
ERICo L.t.d.:
Marko Mavec, director
.
. Comparative SWOT analysis in the frame of TAB project
2
TABLE OF CONTENT
1 INTRODUCTION ............................................................................................................................................. 6
2 CHARACTERISTICS OF STUDY AREAS ..................................................................................................... 7
2.1 VELENJE (THE ŠALEK VALLEY) .................................................................................................................. 7 2.1.1 Sources of air pollutants in the Šalek Valley ............................................................................................... 7 2.1.2 Imission concentrations of air pollutants at monitoring stations in the Šalek Valley ................................. 8 2.1.3 Health data .................................................................................................................................................. 9
2.2 SOSNOWIEC ................................................................................................................................................... 13 2.2.1 Sources of the air pollutants in Sosnowiec ................................................................................................ 13 2.2.2 Imission concentrations of air pollutants at monitoring stations in Sosnowiec ........................................ 14 2.2.3 Health data ................................................................................................................................................ 15
2.3 VÁRPALOTA .................................................................................................................................................. 17 2.3.1 Sources of air pollutants in Várpalota ...................................................................................................... 17 2.3.2 Imission concentrations of air pollutants at monitoring stations in Várpalota ......................................... 17 2.3.3 Health data ................................................................................................................................................ 19
2.4 USTI REGION .................................................................................................................................................. 22 2.4.1 Sources of air pollutants in the Usti Region .............................................................................................. 23 2.4.2 Imission concentrations of air pollutants at monitoring stations in the Usti Region ................................ 24 2.4.3 Health data ................................................................................................................................................ 24
2.5 VAL SANGONE VALLEY .............................................................................................................................. 28 2.5.1 Sources of air pollutants in the Val Sangone Valley ................................................................................. 28 2.5.2 Imission concentrations of air pollutants in the Val Sangone Valley ........................................................ 29 2.5.3 Health data ................................................................................................................................................ 31
3 COMPARISON AMONG STUDIED REGIONS REGARDING AIR POLLUTANTS AND HEALTH
DATA ............................................................................................................................................................ 32
3.1 THE QUALITY OF THE AIR .......................................................................................................................... 32 3.2 HEALTH DATA ............................................................................................................................................... 34
4 COMMON CHARACTERISTICS OR EXCEPTIONS OF STUDY AREAS ............................................... 37
4.1 STRENGTHS AND WEAKNESSES ............................................................................................................... 37 4.1.1 Geographical features ............................................................................................................................... 37 4.1.2 Monitoring system ..................................................................................................................................... 37 4.1.3 Monitoring results ..................................................................................................................................... 39 4.1.4 Industry .................................................................................................................................................... 39 4.1.5 Heating ..................................................................................................................................................... 39 4.1.6 Usage of alternative/renewable energy ..................................................................................................... 40 4.1.7 Traffic ........................................................................................................................................................ 40 4.1.8 The health care system .............................................................................................................................. 41 4.1.9 Access to environmental information ........................................................................................................ 42 4.1.10 Strategic documents ................................................................................................................................ 43 4.1.11 Completed studies regarding the problematic of air pollution in the study areas .................................. 44
4.2. OPPORTUNITIES AND THREATS ............................................................................................................... 45 4.2.1 Legislation ................................................................................................................................................. 45 4.2.2 Trends regarding limiting the use of fossil fuels ....................................................................................... 45 4.2.3 High risk of emission from neighbouring towns ........................................................................................ 46 4.2.4 Opportunity for financial support from the state and EU for using of renewable energy sources............ 46
.
. Comparative SWOT analysis in the frame of TAB project
3
4.2.5 Operational programs and action plans at the state level for reduction of emissions .............................. 47 4.2.6 Plans for redirect of transport from the city’s centres .............................................................................. 48 4.2.7 Negative trends in the economy and limiting financial sources at EU and state level .............................. 48 4.2.8 Increase of energy resources prices .......................................................................................................... 48
5 CONCLUSIONS .............................................................................................................................................. 49
6 SUMMARY ..................................................................................................................................................... 51
7 REFERENCES ................................................................................................................................................ 53
.
. Comparative SWOT analysis in the frame of TAB project
4
LIST OF TABLES Table 1: Changes of mortality in time: standardized death rates per 100 000 inhabitants in the Šalek Valley ......... 10
Table 2: Deaths all non-external causes (ICD10A00-R99). Attributable deaths on days when daily PM10 level was
above 50 µg/m3. .......................................................................................................................................... 11
Table 3: Potential reduced total mortality (excluding external causes) due to reduced annual rate of PM10 pollution
to 20 µg/m3 or due to the reduction of 24-hour PM10 levels by 5 µg/m
3. ................................................... 11
Table 4: Potential benefits of reducing annual PM2.5 levels on total mortality and on life expectancy. ................... 12
Table 5: Emission of main air pollutants from plants in Sosnowiec (expressed in tons/year) .................................. 13
Table 6: Annual number of deaths and annual rate per 100 000 inhabitants in Sosnowiec (2008). ......................... 15
Table 7: Changes of mortality in time: standardized death rates per 100 000 inhabitants in Sosnowiec. ................. 15
Table 8: Deaths all non-external causes (ICD10A00-R99). Attributable deaths on days when daily PM10 level was
above 50 µg/m3.. ......................................................................................................................................... 16
Table 9: Potential reduced total mortality (excluding external causes) due to reduced annual rate of PM10 pollution
to 20 µg/m3. ................................................................................................................................................ 16
Table 10: Changes of mortality in time: standardized death rates per 100 000 inhabitants in Sosnowiec. ................ 19
Table 11: Deaths all non-external causes (ICD10A00-R99). ..................................................................................... 19
Table 12: Potential benefits of reducing annual PM10 levels on total non-external mortality. ........................... 20
Table 13: Potential benefits of reducing annual PM2.5 levels on total mortality and on life expectancy. ................... 20
Table 14: Potential benefits of reducing daily ozone levels on total non-external* mortality. ................................... 21
Table 15: Main sources of air pollution in Usti Region, 2010 (expressed in tons/year). ............................................ 23
Table 16: Annual number of deaths and annual rate per 100 000 inhabitants in Usti Region (2008)......................... 25
Table 17: Changes of mortality in time: standardized death rates per 100 000 inhabitants in Usti Region................ 25
Table 18: Excess mortality due to all non-external causes (ICD10A00-Q99) on days when the daily PM10
concentration was >50 µg/m3 in Usti nad Labem. ...................................................................................... 26
Table 19: Number of days with daily mean PM10 concentration >50 µg/m3 and number of attributable death cases
due to all causes in 6 town of Usti Region, 2006-2010. ............................................................................. 26
Table 20: Potential benefits of reducing annual PM10 levels on total non-external* mortality in Usti nad Labem ..... 27
Table 21: Potential benefits of reducing annual PM2.5 levels on total mortality and on life expectancy in Usti nad
Labem. ........................................................................................................................................................ 27
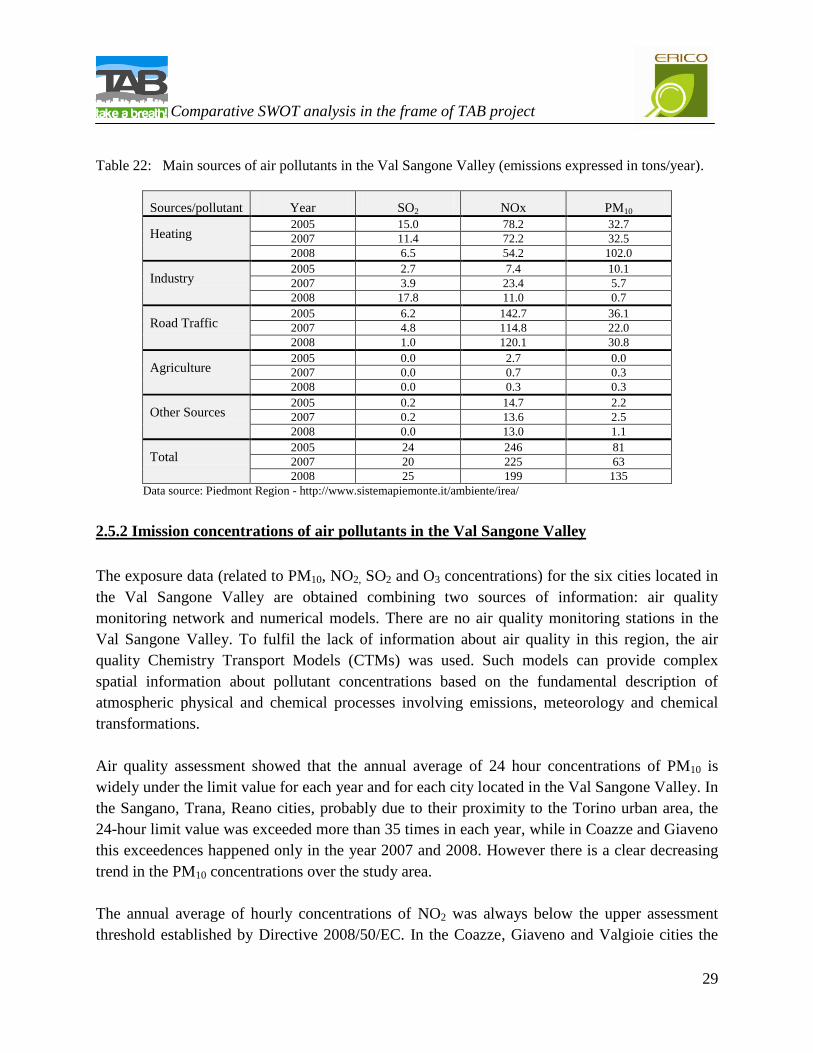
Table 22: Main sources of air pollutants in the Val Sangone Valley (emissions expressed in tons/year). ................. 29
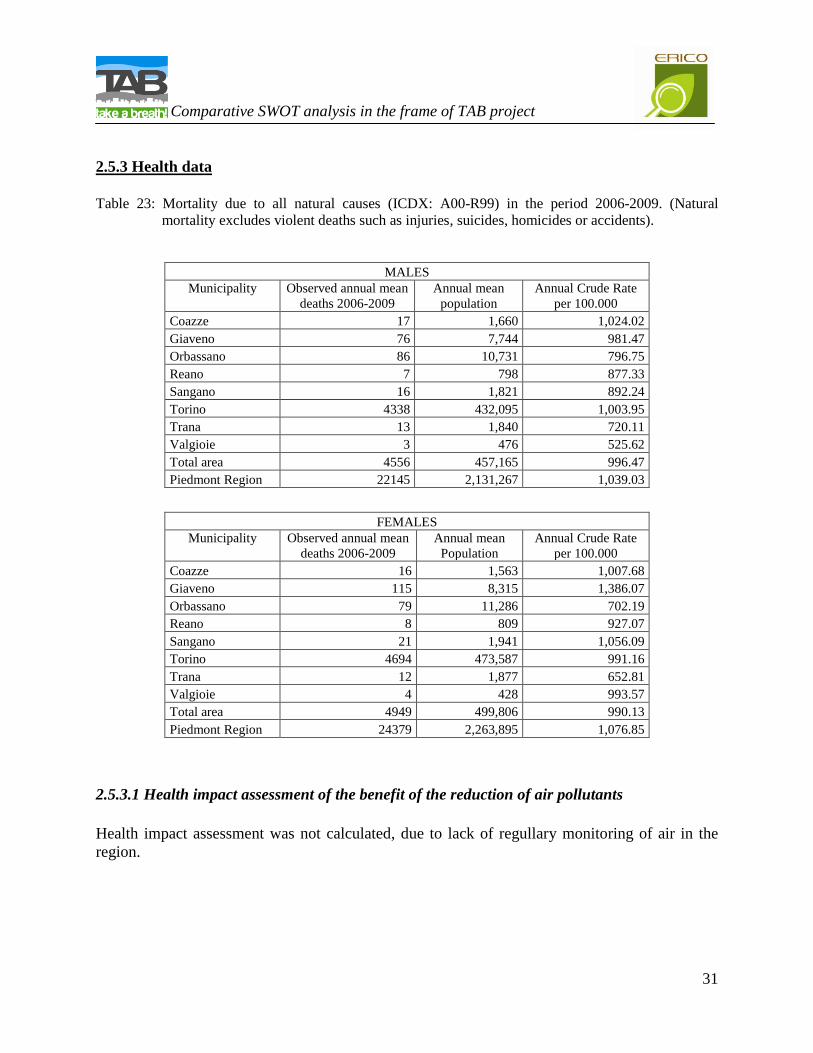
Table 23: Mortality for all natural causes. ICD X: A00-R99- period 2006-2009 ........................................................ 31
Table 24: Strengths and weaknesses of different areas/cities. .................................................................................... 38
Table 25: Table of opportunities and threats of study areas. ....................................................................................... 45
.
. Comparative SWOT analysis in the frame of TAB project
5
LIST OF FIGURES
Figure 1: The locations of the studied areas in the frame of the project TAB.. ............................................................ 6
Figure 2: Map of the area of the Šalek Valley.............................................................................................................. 7
Figure 3: Emissions of SO2, NO2 and dust from industrial facilities in the Šalek Valley. ........................................... 8
Figure 4: Average imission concentrations of different pollutants (SO2, NO2, O3 and PM10) in the Šalek Valley.. .... 9
Figure 5: Specific mortality per 1000 inhabitants due to different causes in the Šalek Valley .................................. 10
Figure 6: Map of the area of the Sosnowiec. .............................................................................................................. 13
Figure 7: Average imission concentrations of different pollutants (SO2, NO2, O3 and PM10) in Sosnowiec.. ........... 14
Figure 8: Map of the area of the city of Várpalota. ................................................................................................... 17
Figure 9: Average imission concentrations of different pollutants (SO2, NO2, and PM10) in Várpalota. ................... 18
Figure 10: Map of the y area Usti Region.................................................................................................................... 22
Figure 11: Emissions of SO2, NO2 and PM10 from sources of air pollution in Usti Region. ....................................... 23
Figure 12: Average imission concentrations of different pollutants (SO2, NO2, O3 and PM10) in the Usti Region. .... 24
Figure 13: Map of the area of Val Sangone Valley. .................................................................................................... 28
Figure 14: Average imission concentrations of different pollutants (SO2, NO2, O3 and PM10) in the Val Sangone
Valley (Based on the air quality Chemistry Transport Models (CTMs)).................................................... 30
Figure 15: Average yearly SO2 and NO2 concentrations in studied areas in the period 2006-2010. ........................... 32
Figure 16: Average yearly PM10 concentrations in studied areas in the period 2006-2010. ....................................... 32
Figure 17: Number of days, when daily value 50 µg/m3 was exceeded (EU legislation: 35 days with daily conc>50
µg/m3 are allowed in a year). ...................................................................................................................... 33
Figure 18: Standardized death rates per 100 000 inhabitants 2006-2010.. .................................................................. 34
Figure 19: Excess total mortality (per 100 000) due to short term effect of PM10 pollution >50 µg/m3 in the studied
regions, 2006-2010. .................................................................................................................................... 35
Figure 20: Excess mortality due to cardiovascular and respiratory diseases (per 100 000) due to short term effect of
PM10 pollution >50 ug/m3 in the studied regions, 2006-2010. .................................................................... 35
Figure 21: Environmental Health Impact Assessment (EHIA): short term gain (life/100 000) of the reduction of
PM10 concentration (µg/m3) by different scenarios in Sosnowiec, Usti Regia, Velenje, Várpalota, Torino
.................................................................................................................................................................... 36
.
. Comparative SWOT analysis in the frame of TAB project
6
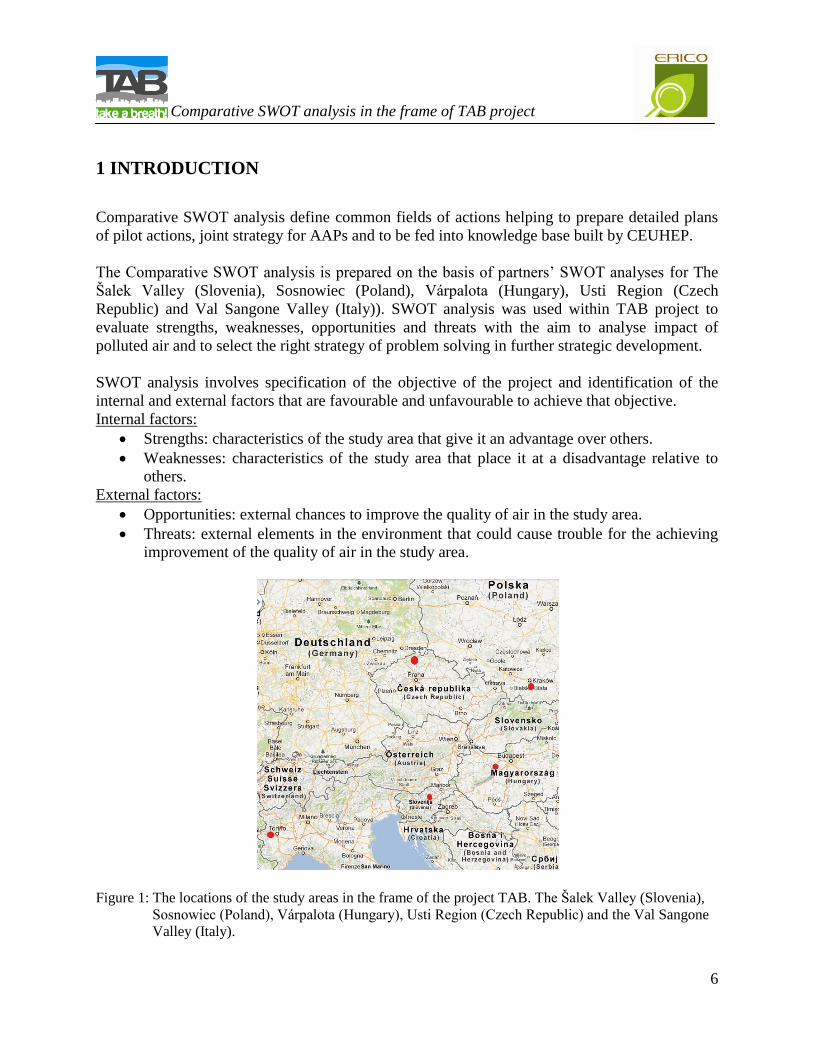
1 INTRODUCTION
Comparative SWOT analysis define common fields of actions helping to prepare detailed plans
of pilot actions, joint strategy for AAPs and to be fed into knowledge base built by CEUHEP.
The Comparative SWOT analysis is prepared on the basis of partners’ SWOT analyses for The
Šalek Valley (Slovenia), Sosnowiec (Poland), Várpalota (Hungary), Usti Region (Czech
Republic) and Val Sangone Valley (Italy)). SWOT analysis was used within TAB project to
evaluate strengths, weaknesses, opportunities and threats with the aim to analyse impact of
polluted air and to select the right strategy of problem solving in further strategic development.
SWOT analysis involves specification of the objective of the project and identification of the
internal and external factors that are favourable and unfavourable to achieve that objective.
Internal factors:
Strengths: characteristics of the study area that give it an advantage over others.
Weaknesses: characteristics of the study area that place it at a disadvantage relative to
others.
External factors:
Opportunities: external chances to improve the quality of air in the study area.
Threats: external elements in the environment that could cause trouble for the achieving
improvement of the quality of air in the study area.
Figure 1: The locations of the study areas in the frame of the project TAB. The Šalek Valley (Slovenia),
Sosnowiec (Poland), Várpalota (Hungary), Usti Region (Czech Republic) and the Val Sangone
Valley (Italy).
.
. Comparative SWOT analysis in the frame of TAB project
7
2 CHARACTERISTICS OF STUDY AREAS
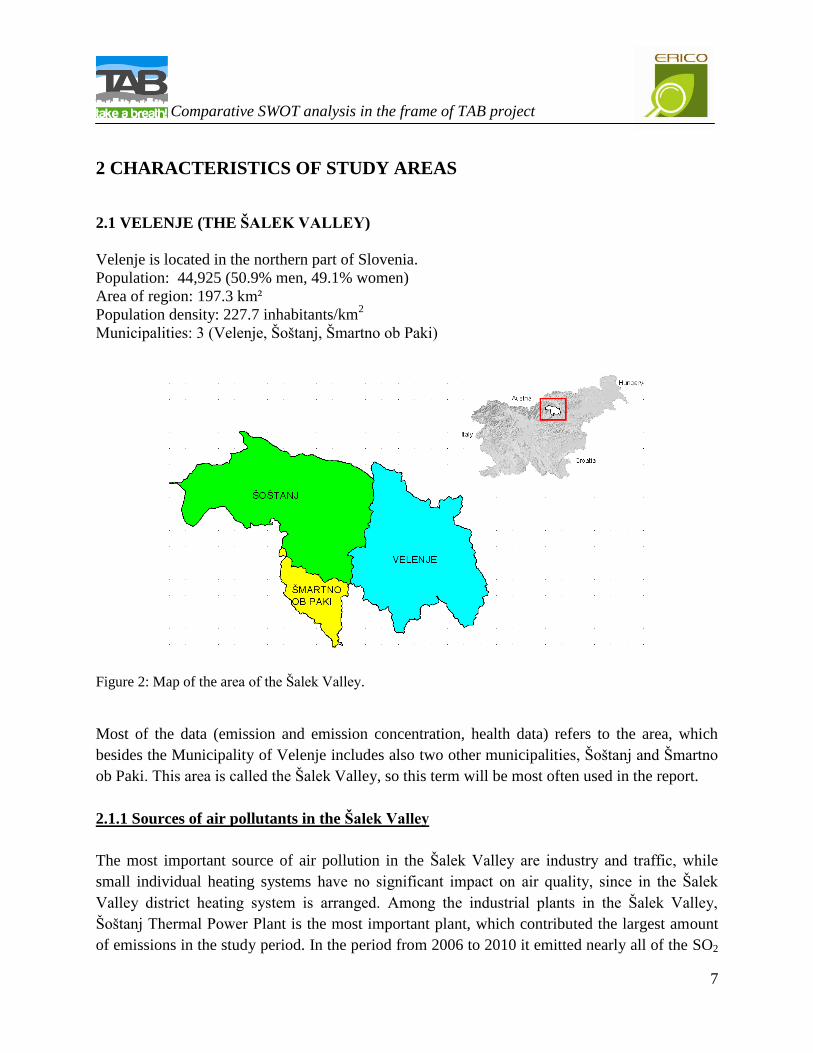
2.1 VELENJE (THE ŠALEK VALLEY)
Velenje is located in the northern part of Slovenia.
Population: 44,925 (50.9% men, 49.1% women)
Area of region: 197.3 km²
Population density: 227.7 inhabitants/km2
Municipalities: 3 (Velenje, Šoštanj, Šmartno ob Paki)
Figure 2: Map of the area of the Šalek Valley.
Most of the data (emission and emission concentration, health data) refers to the area, which
besides the Municipality of Velenje includes also two other municipalities, Šoštanj and Šmartno
ob Paki. This area is called the Šalek Valley, so this term will be most often used in the report.
2.1.1 Sources of air pollutants in the Šalek Valley
The most important source of air pollution in the Šalek Valley are industry and traffic, while
small individual heating systems have no significant impact on air quality, since in the Šalek
Valley district heating system is arranged. Among the industrial plants in the Šalek Valley,
Šoštanj Thermal Power Plant is the most important plant, which contributed the largest amount
of emissions in the study period. In the period from 2006 to 2010 it emitted nearly all of the SO2
.
. Comparative SWOT analysis in the frame of TAB project
8
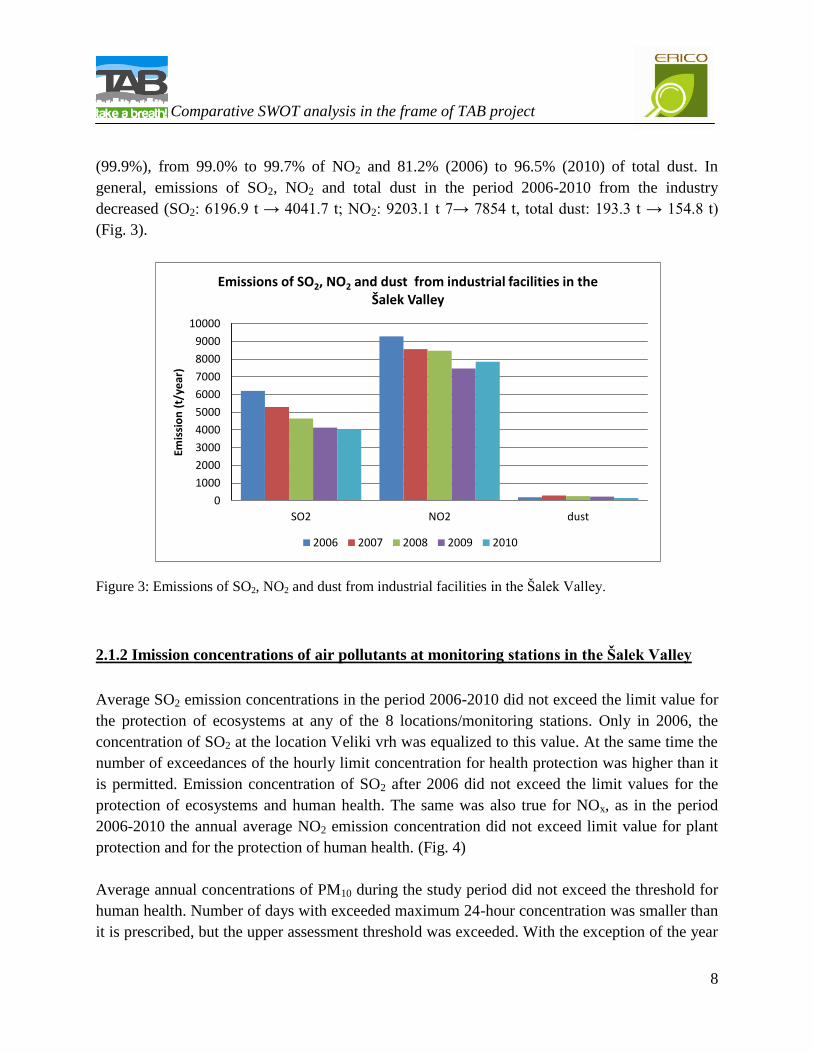
(99.9%), from 99.0% to 99.7% of NO2 and 81.2% (2006) to 96.5% (2010) of total dust. In
general, emissions of SO2, NO2 and total dust in the period 2006-2010 from the industry
decreased (SO2: 6196.9 t → 4041.7 t; NO2: 9203.1 t 7→ 7854 t, total dust: 193.3 t → 154.8 t)
(Fig. 3).
Figure 3: Emissions of SO2, NO2 and dust from industrial facilities in the Šalek Valley.
2.1.2 Imission concentrations of air pollutants at monitoring stations in the Šalek Valley
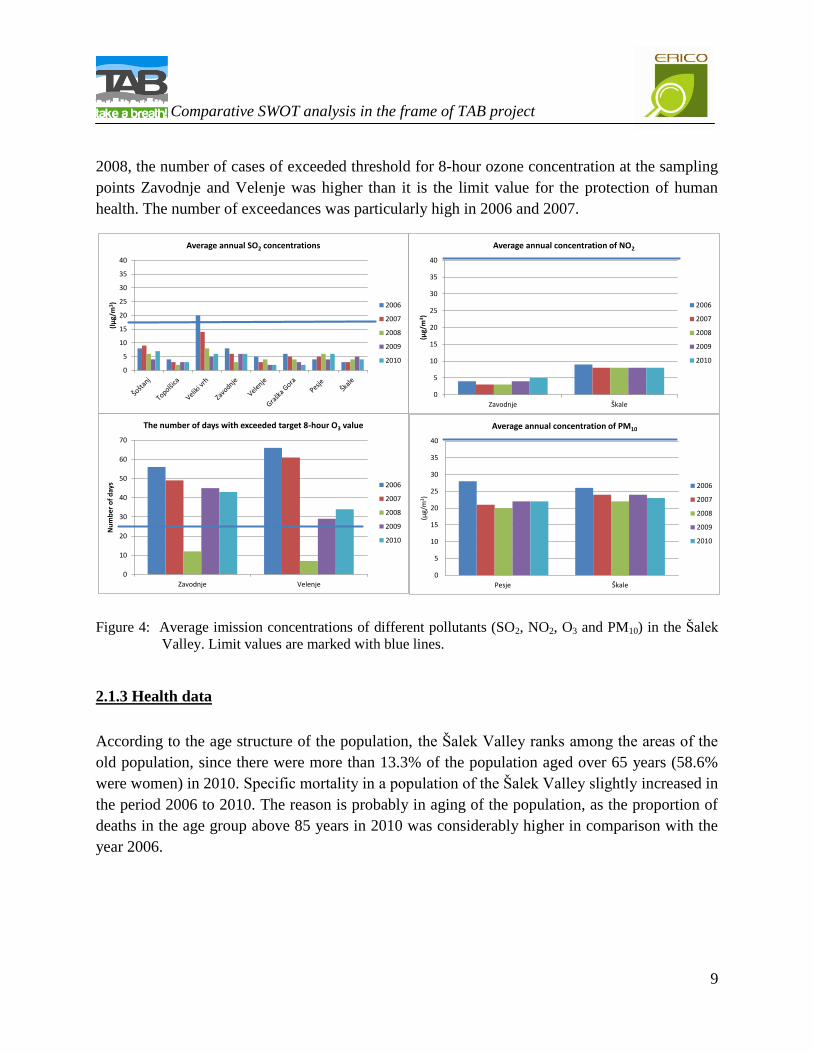
Average SO2 emission concentrations in the period 2006-2010 did not exceed the limit value for
the protection of ecosystems at any of the 8 locations/monitoring stations. Only in 2006, the
concentration of SO2 at the location Veliki vrh was equalized to this value. At the same time the
number of exceedances of the hourly limit concentration for health protection was higher than it
is permitted. Emission concentration of SO2 after 2006 did not exceed the limit values for the
protection of ecosystems and human health. The same was also true for NOx, as in the period
2006-2010 the annual average NO2 emission concentration did not exceed limit value for plant
protection and for the protection of human health. (Fig. 4)
Average annual concentrations of PM10 during the study period did not exceed the threshold for
human health. Number of days with exceeded maximum 24-hour concentration was smaller than
it is prescribed, but the upper assessment threshold was exceeded. With the exception of the year
0
1000
2000
3000
4000
5000
6000
7000
8000
9000
10000
SO2 NO2 dust
Emis
sio
n (
t/ye
ar)
Emissions of SO2, NO2 and dust from industrial facilities in the Šalek Valley
2006 2007 2008 2009 2010
.
. Comparative SWOT analysis in the frame of TAB project
9
2008, the number of cases of exceeded threshold for 8-hour ozone concentration at the sampling
points Zavodnje and Velenje was higher than it is the limit value for the protection of human
health. The number of exceedances was particularly high in 2006 and 2007.
Figure 4: Average imission concentrations of different pollutants (SO2, NO2, O3 and PM10) in the Šalek
Valley. Limit values are marked with blue lines.
2.1.3 Health data
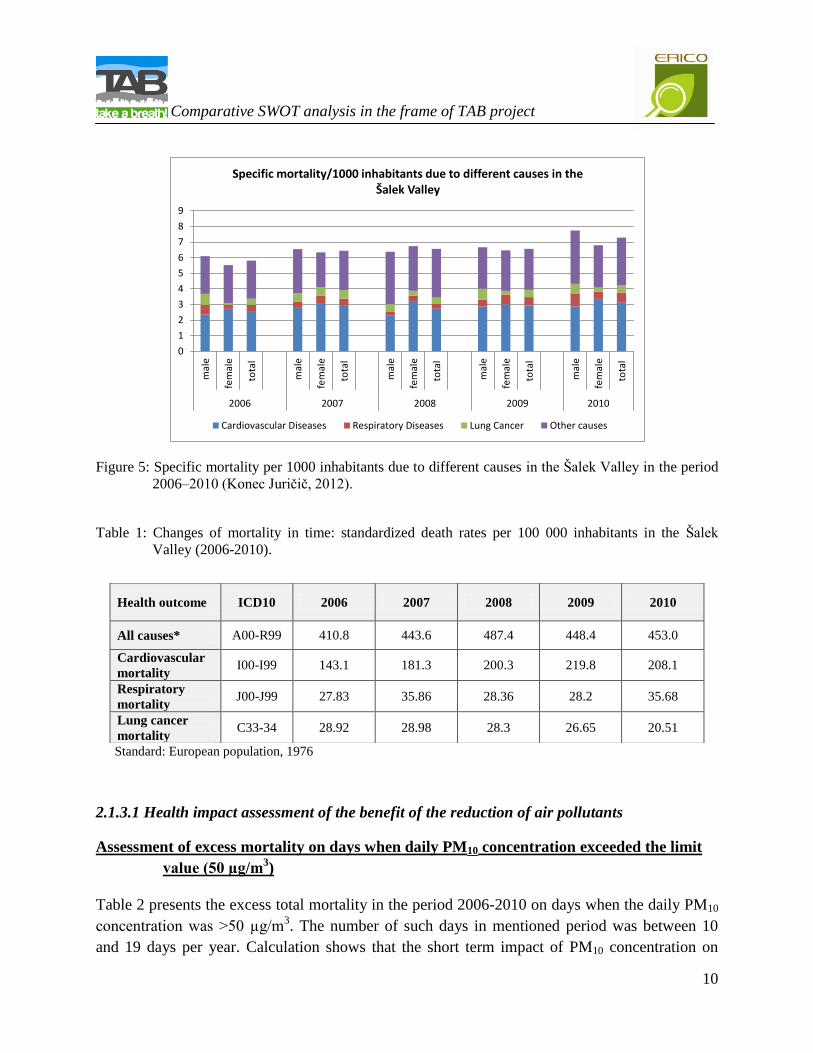
According to the age structure of the population, the Šalek Valley ranks among the areas of the
old population, since there were more than 13.3% of the population aged over 65 years (58.6%
were women) in 2010. Specific mortality in a population of the Šalek Valley slightly increased in
the period 2006 to 2010. The reason is probably in aging of the population, as the proportion of
deaths in the age group above 85 years in 2010 was considerably higher in comparison with the
year 2006.
0
5
10
15
20
25
30
35
40
(lµ
g/m
3 )
Average annual SO2 concentrations
2006
2007
2008
2009
2010
0
5
10
15
20
25
30
35
40
Zavodnje Škale
(µg/
m3 )
Average annual concentration of NO2
2006
2007
2008
2009
2010
0
10
20
30
40
50
60
70
Zavodnje Velenje
Nu
mb
er
of
day
s
The number of days with exceeded target 8-hour O3 value
2006
2007
2008
2009
2010
0
5
10
15
20
25
30
35
40
Pesje Škale
(µg/
m3 )
Average annual concentration of PM10
2006
2007
2008
2009
2010
.
. Comparative SWOT analysis in the frame of TAB project
10
Figure 5: Specific mortality per 1000 inhabitants due to different causes in the Šalek Valley in the period
2006–2010 (Konec Juričič, 2012).
Table 1: Changes of mortality in time: standardized death rates per 100 000 inhabitants in the Šalek
Valley (2006-2010).
Standard: European population, 1976
2.1.3.1 Health impact assessment of the benefit of the reduction of air pollutants
Assessment of excess mortality on days when daily PM10 concentration exceeded the limit
value (50 µg/m3)
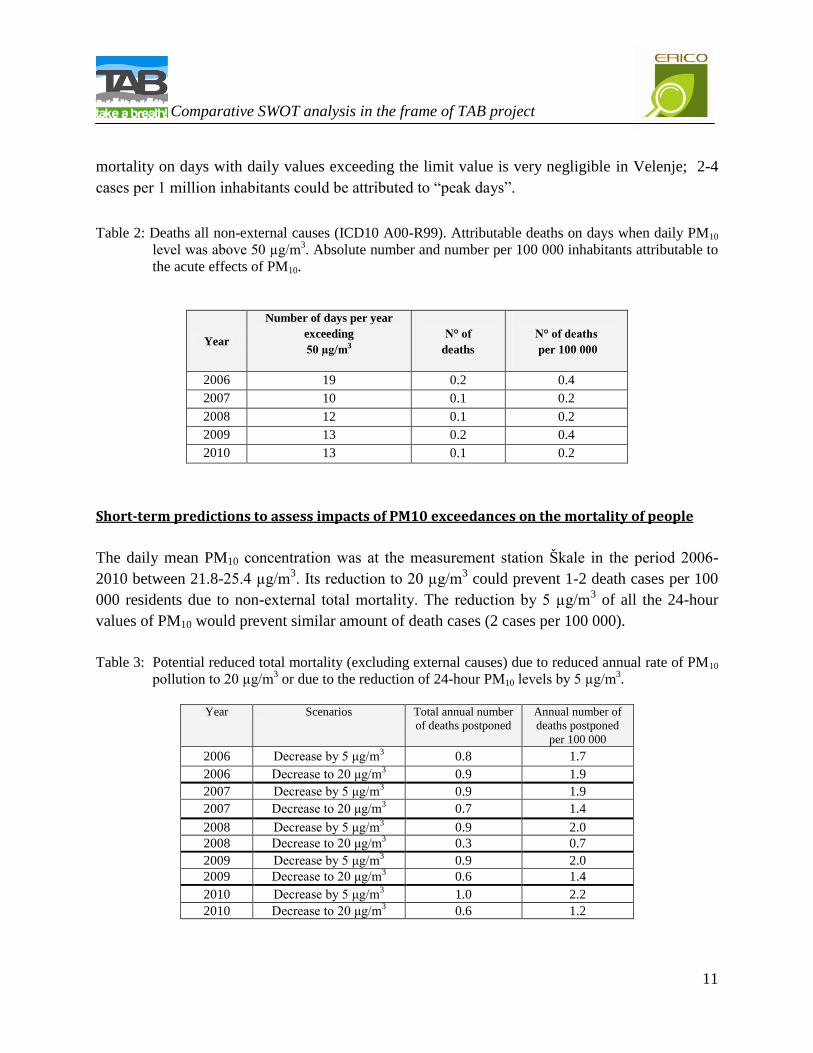
Table 2 presents the excess total mortality in the period 2006-2010 on days when the daily PM10
concentration was >50 µg/m3. The number of such days in mentioned period was between 10
and 19 days per year. Calculation shows that the short term impact of PM10 concentration on
0
1
2
3
4
5
6
7
8
9m
ale
fem
ale
tota
l
mal
e
fem
ale
tota
l
mal
e
fem
ale
tota
l
mal
e
fem
ale
tota
l
mal
e
fem
ale
tota
l
2006 2007 2008 2009 2010
Specific mortality/1000 inhabitants due to different causes in the Šalek Valley
Cardiovascular Diseases Respiratory Diseases Lung Cancer Other causes
Health outcome ICD10 2006 2007 2008 2009 2010
All causes* A00-R99 410.8 443.6 487.4 448.4 453.0
Cardiovascular
mortality I00-I99 143.1 181.3 200.3 219.8 208.1
Respiratory
mortality J00-J99 27.83 35.86 28.36 28.2 35.68
Lung cancer
mortality C33-34 28.92 28.98 28.3 26.65 20.51
.
. Comparative SWOT analysis in the frame of TAB project
11
mortality on days with daily values exceeding the limit value is very negligible in Velenje; 2-4
cases per 1 million inhabitants could be attributed to “peak days”.
Table 2: Deaths all non-external causes (ICD10 A00-R99). Attributable deaths on days when daily PM10
level was above 50 µg/m3. Absolute number and number per 100 000 inhabitants attributable to
the acute effects of PM10.
Year
Number of days per year
exceeding
50 µg/m3
N° of
deaths
N° of deaths
per 100 000
2006 19 0.2 0.4
2007 10 0.1 0.2
2008 12 0.1 0.2
2009 13 0.2 0.4
2010 13 0.1 0.2
Short-term predictions to assess impacts of PM10 exceedances on the mortality of people
The daily mean PM10 concentration was at the measurement station Škale in the period 2006-
2010 between 21.8-25.4 µg/m3. Its reduction to 20 µg/m
3 could prevent 1-2 death cases per 100
000 residents due to non-external total mortality. The reduction by 5 µg/m3 of all the 24-hour
values of PM10 would prevent similar amount of death cases (2 cases per 100 000).
Table 3: Potential reduced total mortality (excluding external causes) due to reduced annual rate of PM10
pollution to 20 µg/m3 or due to the reduction of 24-hour PM10 levels by 5 µg/m
3.
Year Scenarios Total annual number
of deaths postponed
Annual number of
deaths postponed
per 100 000
2006 Decrease by 5 μg/m3
0.8 1.7
2006 Decrease to 20 μg/m3 0.9 1.9
2007 Decrease by 5 μg/m3
0.9 1.9
2007 Decrease to 20 μg/m3 0.7 1.4
2008 Decrease by 5 μg/m3
0.9 2.0
2008 Decrease to 20 μg/m3 0.3 0.7
2009 Decrease by 5 μg/m3
0.9 2.0
2009 Decrease to 20 μg/m3 0.6 1.4
2010 Decrease by 5 μg/m3
1.0 2.2
2010 Decrease to 20 μg/m3 0.6 1.2
.
. Comparative SWOT analysis in the frame of TAB project
12
Long-term predictions to assess impacts of PM2.5 exceedances on the mortality of people
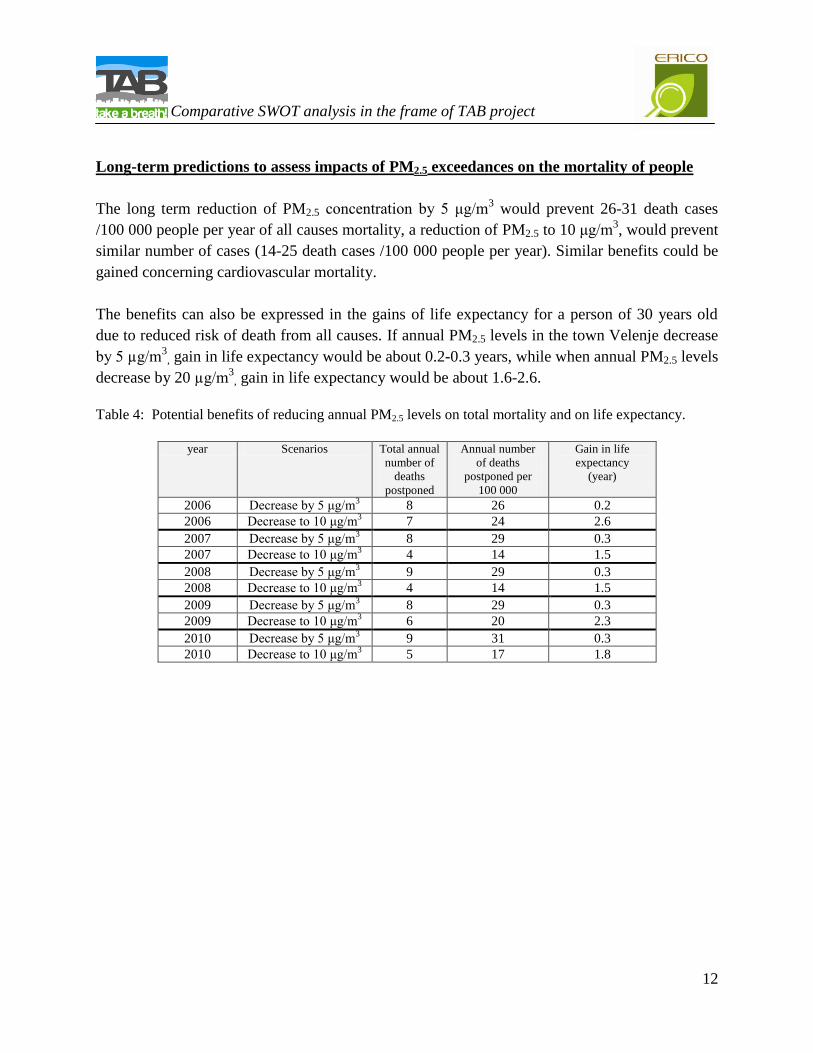
The long term reduction of PM2.5 concentration by 5 μg/m3 would prevent 26-31 death cases
/100 000 people per year of all causes mortality, a reduction of PM2.5 to 10 μg/m3, would prevent
similar number of cases (14-25 death cases /100 000 people per year). Similar benefits could be
gained concerning cardiovascular mortality.
The benefits can also be expressed in the gains of life expectancy for a person of 30 years old
due to reduced risk of death from all causes. If annual PM2.5 levels in the town Velenje decrease
by 5 µg/m3
, gain in life expectancy would be about 0.2-0.3 years, while when annual PM2.5 levels
decrease by 20 µg/m3
, gain in life expectancy would be about 1.6-2.6.
Table 4: Potential benefits of reducing annual PM2.5 levels on total mortality and on life expectancy.
year Scenarios Total annual
number of
deaths
postponed
Annual number
of deaths
postponed per
100 000
Gain in life
expectancy
(year)
2006 Decrease by 5 μg/m3
8 26 0.2
2006 Decrease to 10 μg/m3 7 24 2.6
2007 Decrease by 5 μg/m3
8 29 0.3
2007 Decrease to 10 μg/m3 4 14 1.5
2008 Decrease by 5 μg/m3
9 29 0.3
2008 Decrease to 10 μg/m3 4 14 1.5
2009 Decrease by 5 μg/m3
8 29 0.3
2009 Decrease to 10 μg/m3 6 20 2.3
2010 Decrease by 5 μg/m3
9 31 0.3
2010 Decrease to 10 μg/m3 5 17 1.8
.
. Comparative SWOT analysis in the frame of TAB project
13
2.2 SOSNOWIEC
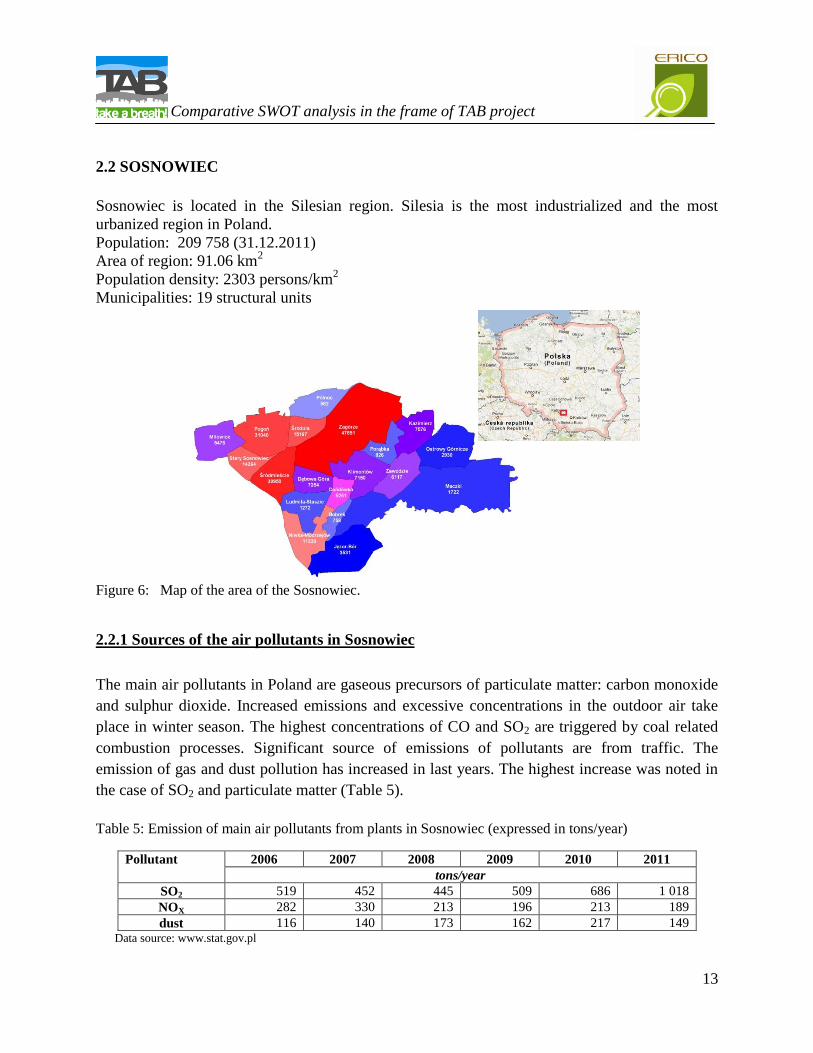
Sosnowiec is located in the Silesian region. Silesia is the most industrialized and the most
urbanized region in Poland.
Population: 209 758 (31.12.2011)
Area of region: 91.06 km2
Population density: 2303 persons/km2
Municipalities: 19 structural units
Figure 6: Map of the area of the Sosnowiec.
2.2.1 Sources of the air pollutants in Sosnowiec
The main air pollutants in Poland are gaseous precursors of particulate matter: carbon monoxide
and sulphur dioxide. Increased emissions and excessive concentrations in the outdoor air take
place in winter season. The highest concentrations of CO and SO2 are triggered by coal related
combustion processes. Significant source of emissions of pollutants are from traffic. The
emission of gas and dust pollution has increased in last years. The highest increase was noted in
the case of SO2 and particulate matter (Table 5).
Table 5: Emission of main air pollutants from plants in Sosnowiec (expressed in tons/year)
Pollutant 2006 2007 2008 2009 2010 2011
tons/year
SO2 519 452 445 509 686 1 018
NOX 282 330 213 196 213 189
dust 116 140 173 162 217 149 Data source: www.stat.gov.pl
.
. Comparative SWOT analysis in the frame of TAB project
14
2.2.2 Imission concentrations of air pollutants at monitoring stations in Sosnowiec
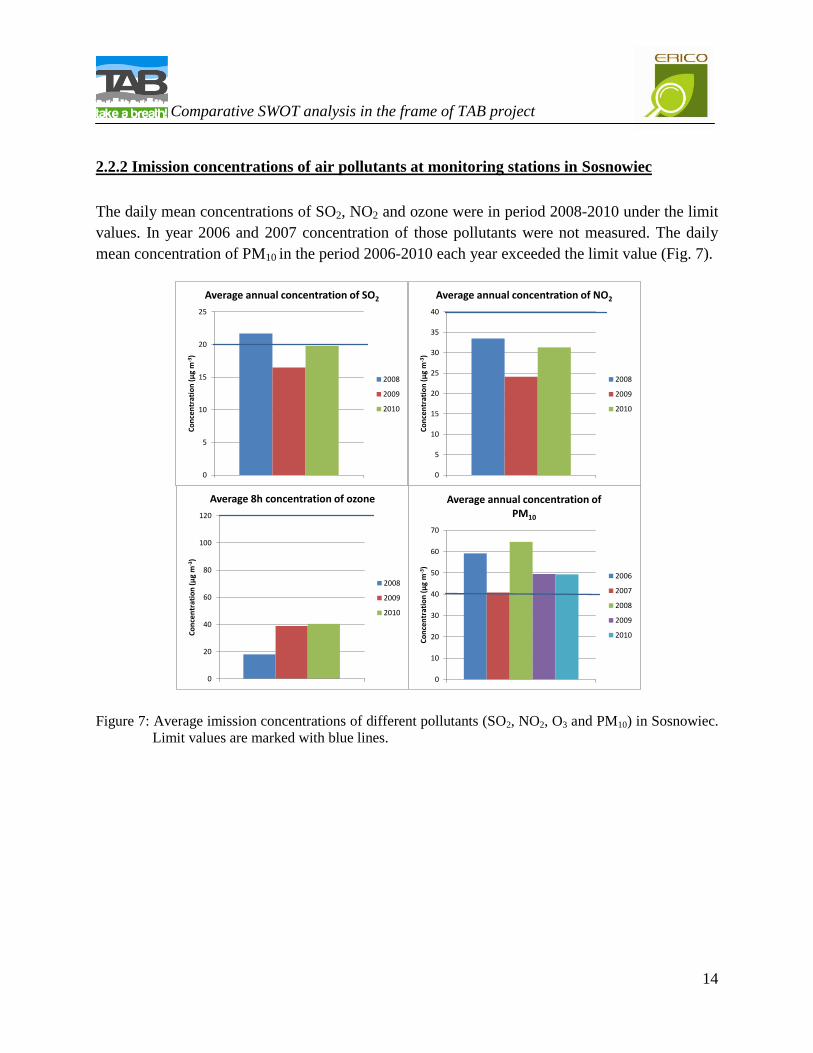
The daily mean concentrations of SO2, NO2 and ozone were in period 2008-2010 under the limit
values. In year 2006 and 2007 concentration of those pollutants were not measured. The daily
mean concentration of PM10 in the period 2006-2010 each year exceeded the limit value (Fig. 7).
Figure 7: Average imission concentrations of different pollutants (SO2, NO2, O3 and PM10) in Sosnowiec.
Limit values are marked with blue lines.
0
20
40
60
80
100
120
Co
nce
ntr
atio
n (
µg
m-3
)
Average 8h concentration of ozone
2008
2009
2010
0
10
20
30
40
50
60
70
Co
nce
ntr
atio
n (
µg
m-3
)
Average annual concentration of PM10
2006
2007
2008
2009
2010
0
5
10
15
20
25
Co
nce
ntr
atio
n (
µg
m-3
)
Average annual concentration of SO2
2008
2009
2010
0
5
10
15
20
25
30
35
40
Co
nce
ntr
atio
n (
µg
m-3
)
Average annual concentration of NO2
2008
2009
2010
.
. Comparative SWOT analysis in the frame of TAB project
15
2.2.3 Health data
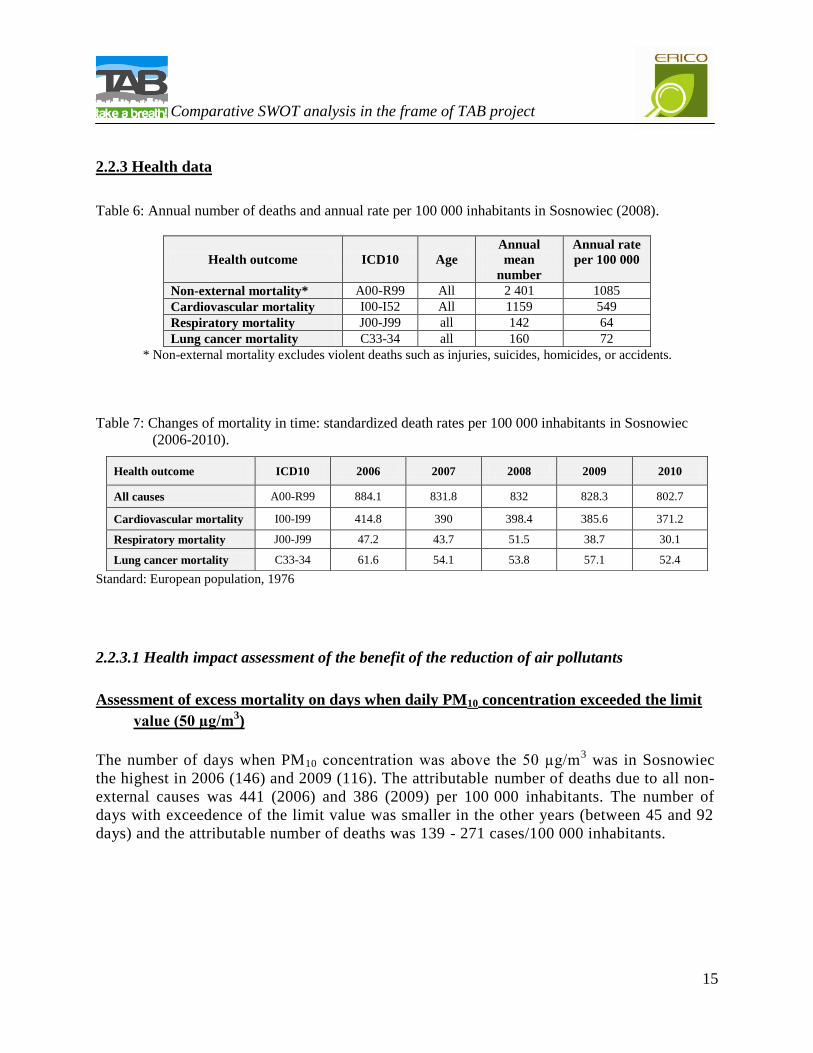
Table 6: Annual number of deaths and annual rate per 100 000 inhabitants in Sosnowiec (2008).
Health outcome ICD10
Age
Annual
mean
number
Annual rate
per 100 000
Non-external mortality* A00-R99 All 2 401 1085
Cardiovascular mortality I00-I52 All 1159 549
Respiratory mortality J00-J99 all 142 64
Lung cancer mortality C33-34 all 160 72
* Non-external mortality excludes violent deaths such as injuries, suicides, homicides, or accidents.
Table 7: Changes of mortality in time: standardized death rates per 100 000 inhabitants in Sosnowiec
(2006-2010).
Standard: European population, 1976
2.2.3.1 Health impact assessment of the benefit of the reduction of air pollutants
Assessment of excess mortality on days when daily PM10 concentration exceeded the limit
value (50 µg/m3)
The number of days when PM10 concentration was above the 50 µg/m3 was in Sosnowiec
the highest in 2006 (146) and 2009 (116). The attributable number of deaths due to all non-
external causes was 441 (2006) and 386 (2009) per 100 000 inhabitants. The number of
days with exceedence of the limit value was smaller in the other years (between 45 and 92
days) and the attributable number of deaths was 139 - 271 cases/100 000 inhabitants.
Health outcome ICD10 2006 2007 2008 2009 2010
All causes A00-R99 884.1 831.8 832 828.3 802.7
Cardiovascular mortality I00-I99 414.8 390 398.4 385.6 371.2
Respiratory mortality J00-J99 47.2 43.7 51.5 38.7 30.1
Lung cancer mortality C33-34 61.6 54.1 53.8 57.1 52.4
.
. Comparative SWOT analysis in the frame of TAB project
16
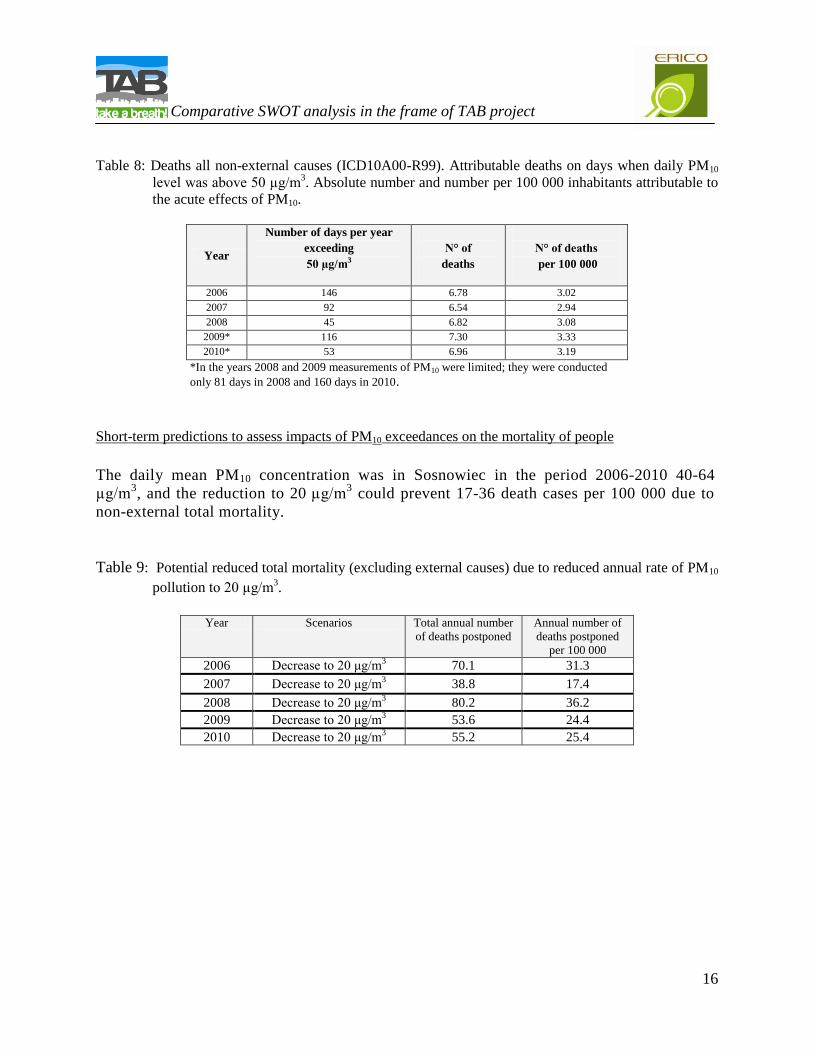
Table 8: Deaths all non-external causes (ICD10A00-R99). Attributable deaths on days when daily PM10
level was above 50 µg/m3. Absolute number and number per 100 000 inhabitants attributable to
the acute effects of PM10.
Year
Number of days per year
exceeding
50 µg/m3
N° of
deaths
N° of deaths
per 100 000
2006 146 6.78 3.02
2007 92 6.54 2.94
2008 45 6.82 3.08
2009* 116 7.30 3.33
2010* 53 6.96 3.19
*In the years 2008 and 2009 measurements of PM10 were limited; they were conducted
only 81 days in 2008 and 160 days in 2010.
Short-term predictions to assess impacts of PM10 exceedances on the mortality of people
The daily mean PM10 concentration was in Sosnowiec in the period 2006-2010 40-64
µg/m3, and the reduction to 20 µg/m
3 could prevent 17-36 death cases per 100 000 due to
non-external total mortality.
Table 9: Potential reduced total mortality (excluding external causes) due to reduced annual rate of PM10
pollution to 20 µg/m3.
Year Scenarios Total annual number
of deaths postponed
Annual number of
deaths postponed
per 100 000
2006 Decrease to 20 μg/m3 70.1 31.3
2007 Decrease to 20 μg/m3 38.8 17.4
2008 Decrease to 20 μg/m3 80.2 36.2
2009 Decrease to 20 μg/m3 53.6 24.4
2010 Decrease to 20 μg/m3 55.2 25.4
.
. Comparative SWOT analysis in the frame of TAB project
17
2.3 VÁRPALOTA
Várpalota is located in western part of Hungary.
Population: 20 482 (2010)
Area of region: 77.26 km²
Population density 267.8 inhabitants/km2
Number of municipalities: 1
Figure 8: Map of the area of the city of Várpalota.
2.3.1 Sources of air pollutants in Várpalota
Mining, energy and chemical industry have a long tradition in Várpalota and its surroundings
and it has strategic economic position in the regional and national economy. Nowadays probably
the most significant is the big chemical industrial company (processing nitrogen),
Nitrogénművek Zrt (www.nitrogen.hu). Although it takes effort to reduce emission, it can be the
biggest industrial potential polluter in the region.
2.3.2 Imission concentrations of air pollutants at monitoring stations in Várpalota
The municipal air quality according to SO2 (highest hourly average: 29.0 µg/m3, 24-hour
average: 29.0 µg/m3) is excellent. Air quality on concentration of NO2 (highest hourly average:
27.7 µg/m3, 24-hour average: 26.7 µg/m
3), NOx (highest hourly average: 45.80 µg/m
3, 24-hour
average: 45.8 µg/m3) and O3 (highest 8-hour average: 78.3 µg/m
3) is good (Annual report on Air
Quality, 2012). Occasionally threshold value of 24-hour concentrations of PM10 has been
.
. Comparative SWOT analysis in the frame of TAB project
18
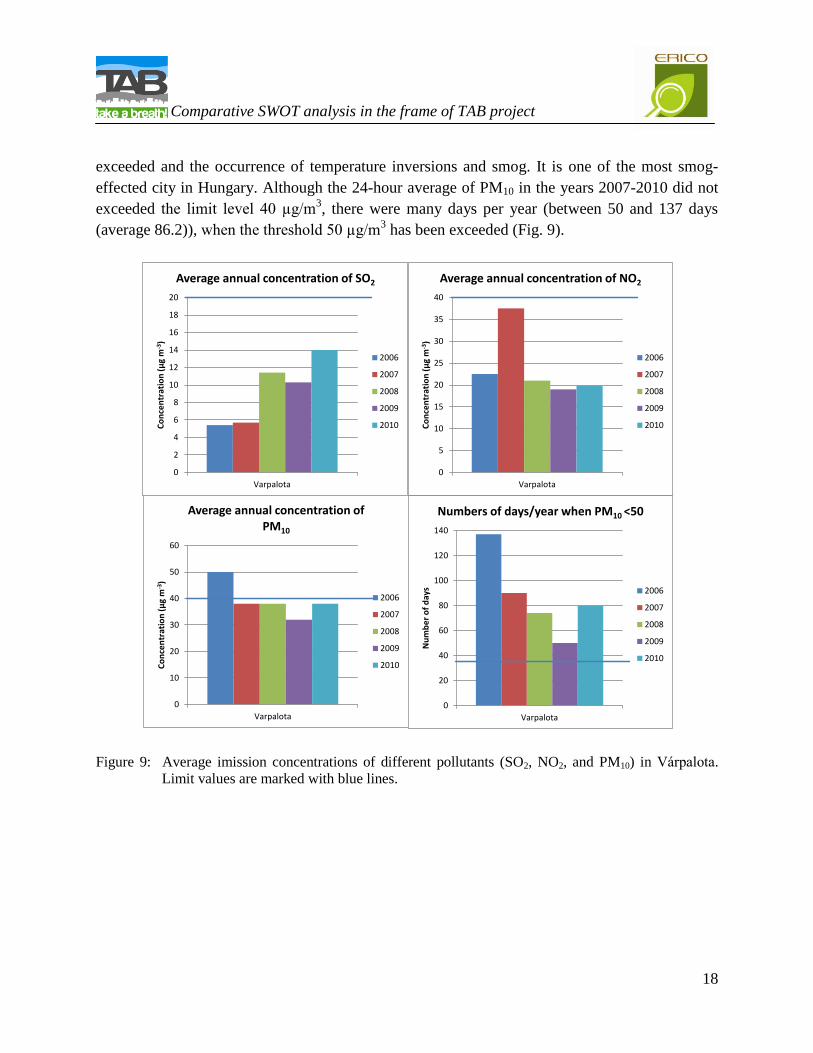
exceeded and the occurrence of temperature inversions and smog. It is one of the most smog-
effected city in Hungary. Although the 24-hour average of PM10 in the years 2007-2010 did not
exceeded the limit level 40 µg/m3, there were many days per year (between 50 and 137 days
(average 86.2)), when the threshold 50 µg/m3 has been exceeded (Fig. 9).
Figure 9: Average imission concentrations of different pollutants (SO2, NO2, and PM10) in Várpalota.
Limit values are marked with blue lines.
0
10
20
30
40
50
60
Varpalota
Co
nce
ntr
atio
n (
µg
m-3
)
Average annual concentration of PM10
2006
2007
2008
2009
2010
0
5
10
15
20
25
30
35
40
Varpalota
Co
nce
ntr
atio
n (
µg
m-3
)
Average annual concentration of NO2
2006
2007
2008
2009
2010
0
2
4
6
8
10
12
14
16
18
20
Varpalota
Co
nce
ntr
atio
n (
µg
m-3
)
Average annual concentration of SO2
2006
2007
2008
2009
2010
0
20
40
60
80
100
120
140
Varpalota
Nu
mb
er
of
day
s
Numbers of days/year when PM10 <50
2006
2007
2008
2009
2010
.
. Comparative SWOT analysis in the frame of TAB project
19
2.3.3 Health data
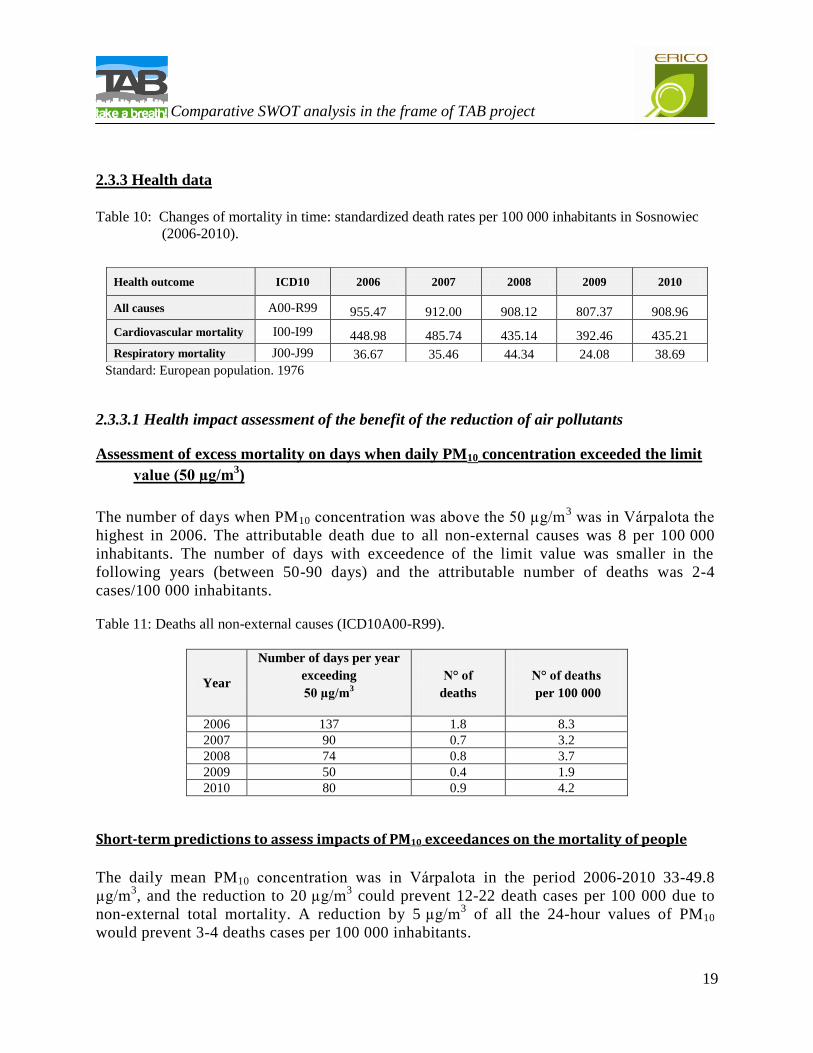
Table 10: Changes of mortality in time: standardized death rates per 100 000 inhabitants in Sosnowiec
(2006-2010).
Standard: European population. 1976
2.3.3.1 Health impact assessment of the benefit of the reduction of air pollutants
Assessment of excess mortality on days when daily PM10 concentration exceeded the limit
value (50 µg/m3)
The number of days when PM10 concentration was above the 50 µg/m3 was in Várpalota the
highest in 2006. The attributable death due to all non-external causes was 8 per 100 000
inhabitants. The number of days with exceedence of the limit value was smaller in the
following years (between 50-90 days) and the attributable number of deaths was 2-4
cases/100 000 inhabitants.
Table 11: Deaths all non-external causes (ICD10A00-R99).
Year
Number of days per year
exceeding
50 µg/m3
N° of
deaths
N° of deaths
per 100 000
2006 137 1.8 8.3
2007 90 0.7 3.2
2008 74 0.8 3.7
2009 50 0.4 1.9
2010 80 0.9 4.2
Short-term predictions to assess impacts of PM10 exceedances on the mortality of people
The daily mean PM10 concentration was in Várpalota in the period 2006-2010 33-49.8
µg/m3, and the reduction to 20 µg/m
3 could prevent 12-22 death cases per 100 000 due to
non-external total mortality. A reduction by 5 µg/m3 of all the 24-hour values of PM10
would prevent 3-4 deaths cases per 100 000 inhabitants.
Health outcome ICD10 2006 2007 2008 2009 2010
All causes A00-R99 955.47 912.00 908.12 807.37 908.96
Cardiovascular mortality I00-I99 448.98 485.74 435.14 392.46 435.21
Respiratory mortality J00-J99 36.67 35.46 44.34 24.08 38.69
.
. Comparative SWOT analysis in the frame of TAB project
20
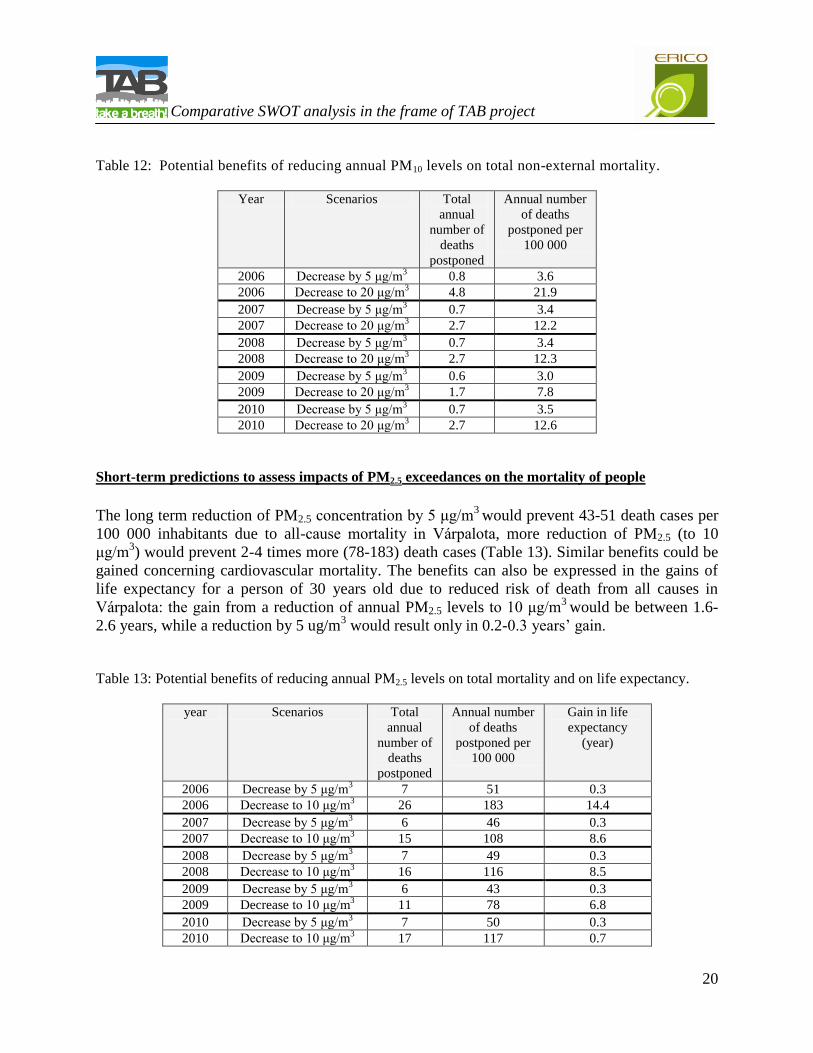
Table 12: Potential benefits of reducing annual PM10 levels on total non-external mortality.
Year Scenarios Total
annual
number of
deaths
postponed
Annual number
of deaths
postponed per
100 000
2006 Decrease by 5 μg/m3
0.8 3.6
2006 Decrease to 20 μg/m3 4.8 21.9
2007 Decrease by 5 μg/m3
0.7 3.4
2007 Decrease to 20 μg/m3 2.7 12.2
2008 Decrease by 5 μg/m3
0.7 3.4
2008 Decrease to 20 μg/m3 2.7 12.3
2009 Decrease by 5 μg/m3
0.6 3.0
2009 Decrease to 20 μg/m3 1.7 7.8
2010 Decrease by 5 μg/m3
0.7 3.5
2010 Decrease to 20 μg/m3 2.7 12.6
Short-term predictions to assess impacts of PM2.5 exceedances on the mortality of people
The long term reduction of PM2.5 concentration by 5 μg/m3
would prevent 43-51 death cases per
100 000 inhabitants due to all-cause mortality in Várpalota, more reduction of PM2.5 (to 10
μg/m3) would prevent 2-4 times more (78-183) death cases (Table 13). Similar benefits could be
gained concerning cardiovascular mortality. The benefits can also be expressed in the gains of
life expectancy for a person of 30 years old due to reduced risk of death from all causes in
Várpalota: the gain from a reduction of annual PM2.5 levels to 10 μg/m3
would be between 1.6-
2.6 years, while a reduction by 5 ug/m3 would result only in 0.2-0.3 years’ gain.
Table 13: Potential benefits of reducing annual PM2.5 levels on total mortality and on life expectancy.
year Scenarios Total
annual
number of
deaths
postponed
Annual number
of deaths
postponed per
100 000
Gain in life
expectancy
(year)
2006 Decrease by 5 μg/m3
7 51 0.3
2006 Decrease to 10 μg/m3 26 183 14.4
2007 Decrease by 5 μg/m3
6 46 0.3
2007 Decrease to 10 μg/m3 15 108 8.6
2008 Decrease by 5 μg/m3
7 49 0.3
2008 Decrease to 10 μg/m3 16 116 8.5
2009 Decrease by 5 μg/m3
6 43 0.3
2009 Decrease to 10 μg/m3 11 78 6.8
2010 Decrease by 5 μg/m3
7 50 0.3
2010 Decrease to 10 μg/m3 17 117 0.7
.
. Comparative SWOT analysis in the frame of TAB project
21
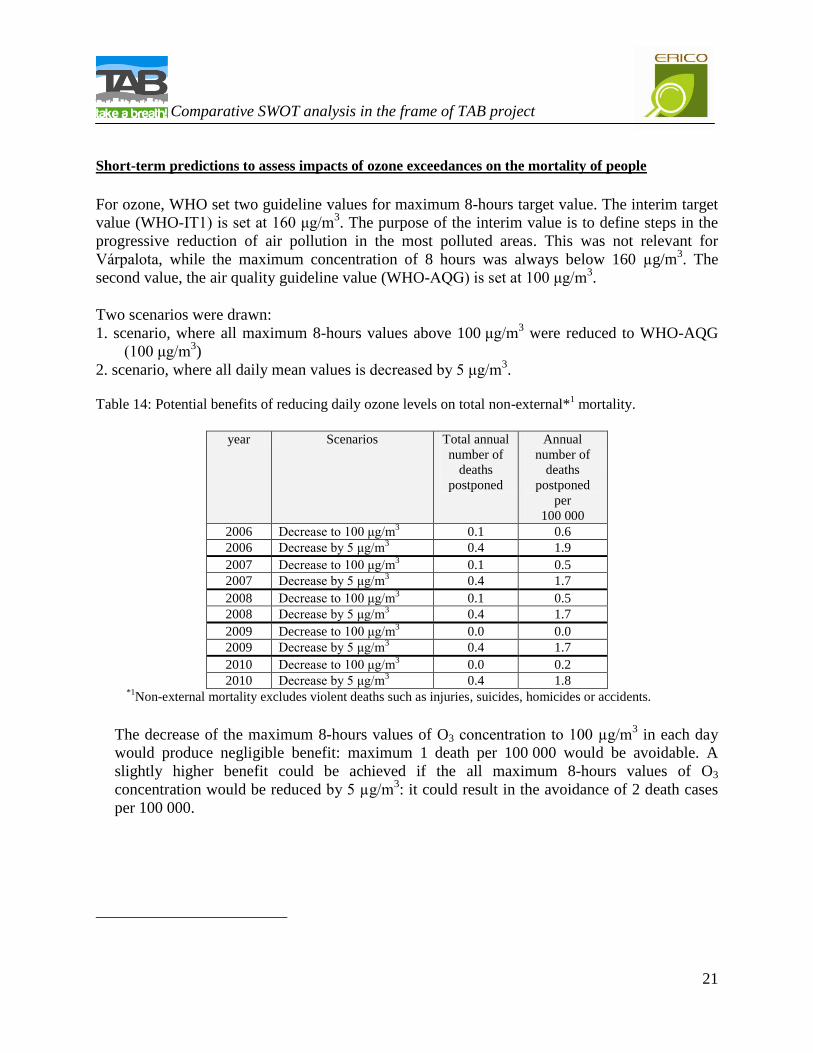
Short-term predictions to assess impacts of ozone exceedances on the mortality of people
For ozone, WHO set two guideline values for maximum 8-hours target value. The interim target
value (WHO-IT1) is set at 160 μg/m3. The purpose of the interim value is to define steps in the
progressive reduction of air pollution in the most polluted areas. This was not relevant for
Várpalota, while the maximum concentration of 8 hours was always below 160 µg/m3. The
second value, the air quality guideline value (WHO-AQG) is set at 100 μg/m3.
Two scenarios were drawn:
1. scenario, where all maximum 8-hours values above 100 μg/m3 were reduced to WHO-AQG
(100 μg/m3)
2. scenario, where all daily mean values is decreased by 5 μg/m3.
Table 14: Potential benefits of reducing daily ozone levels on total non-external*1 mortality.
year Scenarios Total annual
number of
deaths
postponed
Annual
number of
deaths
postponed
per
100 000
2006 Decrease to 100 μg/m3 0.1 0.6
2006 Decrease by 5 μg/m3 0.4 1.9
2007 Decrease to 100 μg/m3 0.1 0.5
2007 Decrease by 5 μg/m3 0.4 1.7
2008 Decrease to 100 μg/m3 0.1 0.5
2008 Decrease by 5 μg/m3 0.4 1.7
2009 Decrease to 100 μg/m3 0.0 0.0
2009 Decrease by 5 μg/m3 0.4 1.7
2010 Decrease to 100 μg/m3 0.0 0.2
2010 Decrease by 5 μg/m3 0.4 1.8
*1
Non-external mortality excludes violent deaths such as injuries, suicides, homicides or accidents.
The decrease of the maximum 8-hours values of O3 concentration to 100 µg/m3 in each day
would produce negligible benefit: maximum 1 death per 100 000 would be avoidable. A
slightly higher benefit could be achieved if the all maximum 8-hours values of O3
concentration would be reduced by 5 µg/m3: it could result in the avoidance of 2 death cases
per 100 000.
.
. Comparative SWOT analysis in the frame of TAB project
22
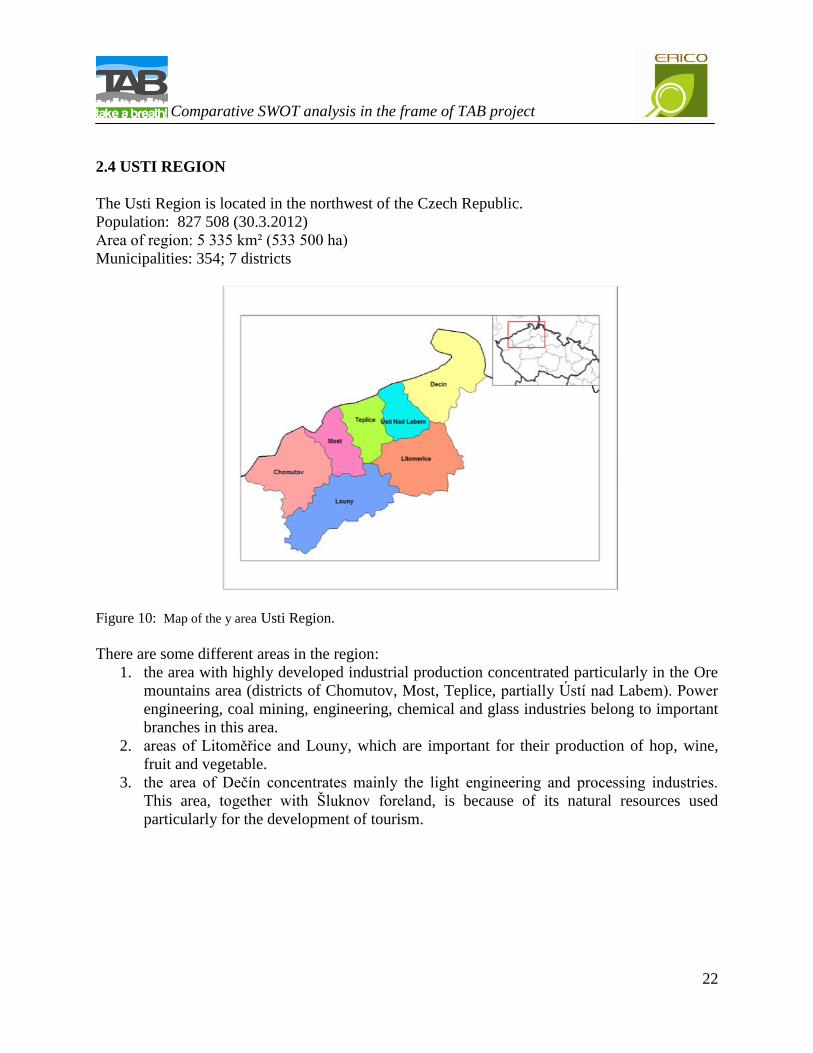
2.4 USTI REGION
The Usti Region is located in the northwest of the Czech Republic.
Population: 827 508 (30.3.2012)
Area of region: 5 335 km² (533 500 ha)
Municipalities: 354; 7 districts
Figure 10: Map of the y area Usti Region.
There are some different areas in the region:
1. the area with highly developed industrial production concentrated particularly in the Ore
mountains area (districts of Chomutov, Most, Teplice, partially Ústí nad Labem). Power
engineering, coal mining, engineering, chemical and glass industries belong to important
branches in this area.
2. areas of Litoměřice and Louny, which are important for their production of hop, wine,
fruit and vegetable.
3. the area of Dečín concentrates mainly the light engineering and processing industries.
This area, together with Šluknov foreland, is because of its natural resources used
particularly for the development of tourism.
.
. Comparative SWOT analysis in the frame of TAB project
23
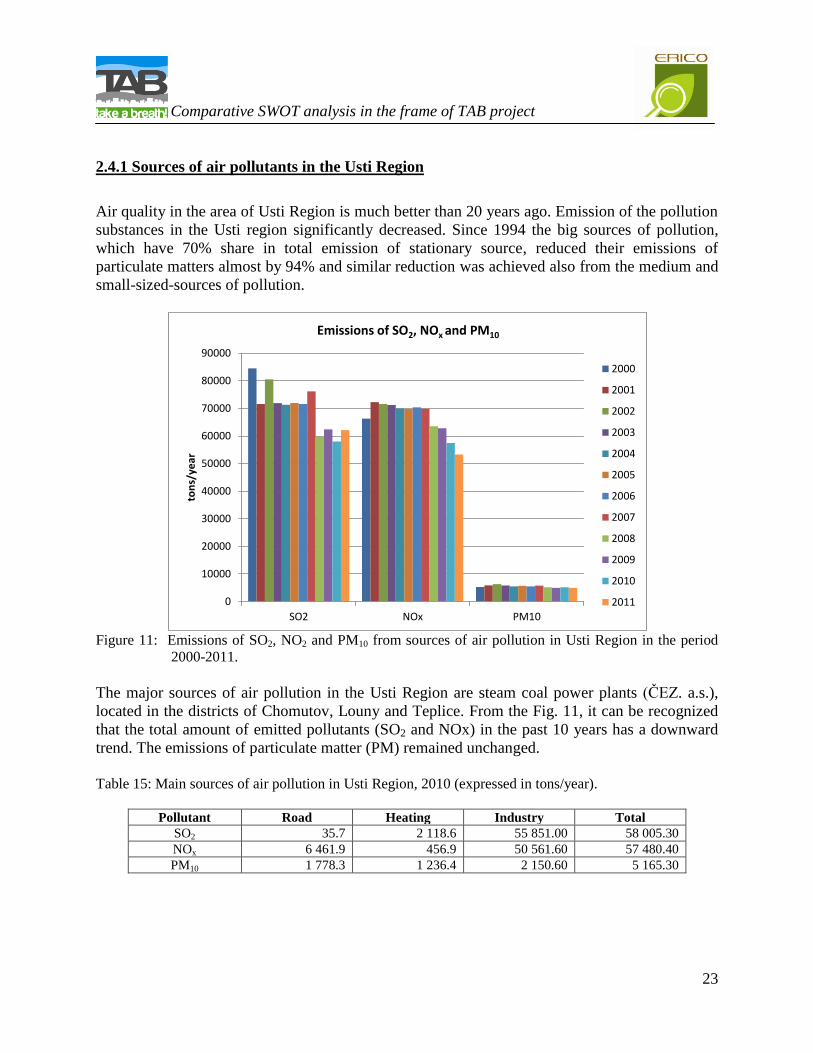
2.4.1 Sources of air pollutants in the Usti Region
Air quality in the area of Usti Region is much better than 20 years ago. Emission of the pollution
substances in the Usti region significantly decreased. Since 1994 the big sources of pollution,
which have 70% share in total emission of stationary source, reduced their emissions of
particulate matters almost by 94% and similar reduction was achieved also from the medium and
small-sized-sources of pollution.
Figure 11: Emissions of SO2, NO2 and PM10 from sources of air pollution in Usti Region in the period
2000-2011.
The major sources of air pollution in the Usti Region are steam coal power plants (ČEZ. a.s.),
located in the districts of Chomutov, Louny and Teplice. From the Fig. 11, it can be recognized
that the total amount of emitted pollutants (SO2 and NOx) in the past 10 years has a downward
trend. The emissions of particulate matter (PM) remained unchanged.
Table 15: Main sources of air pollution in Usti Region, 2010 (expressed in tons/year).
Pollutant Road Heating Industry Total
SO2 35.7 2 118.6 55 851.00 58 005.30
NOx 6 461.9 456.9 50 561.60 57 480.40
PM10 1 778.3 1 236.4 2 150.60 5 165.30
0
10000
20000
30000
40000
50000
60000
70000
80000
90000
SO2 NOx PM10
ton
s/ye
ar
Emissions of SO2, NOx and PM10
2000
2001
2002
2003
2004
2005
2006
2007
2008
2009
2010
2011
.
. Comparative SWOT analysis in the frame of TAB project
24
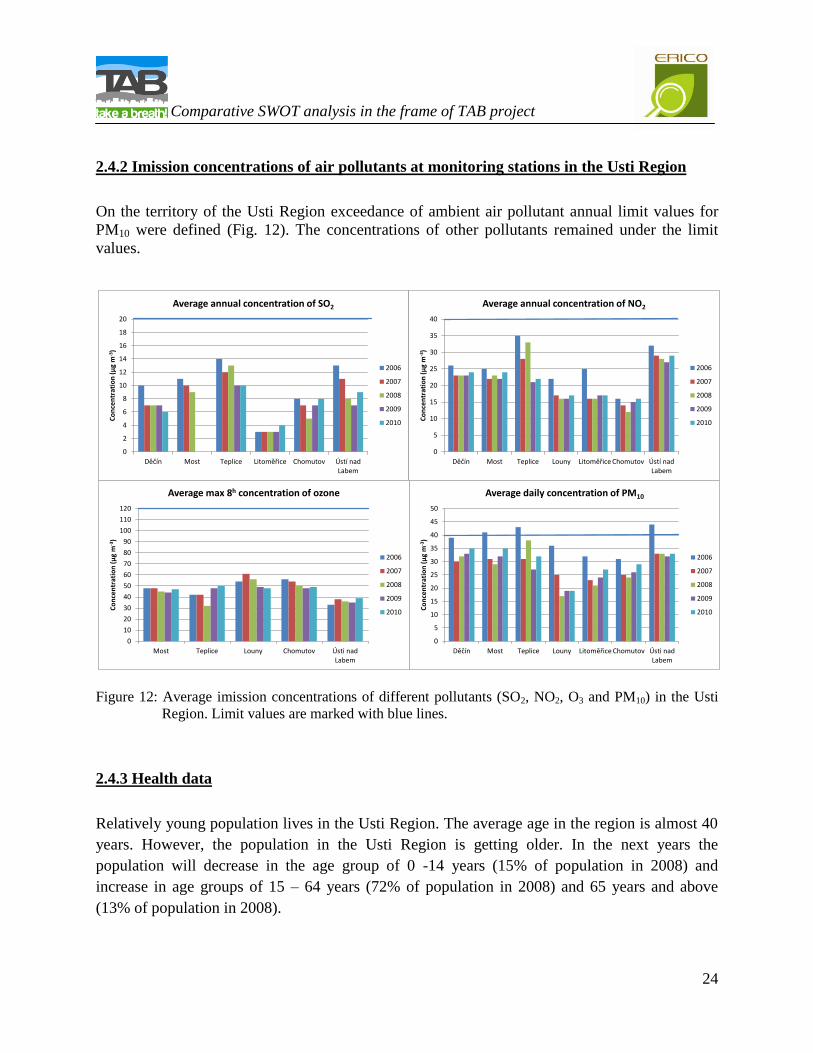
2.4.2 Imission concentrations of air pollutants at monitoring stations in the Usti Region
On the territory of the Usti Region exceedance of ambient air pollutant annual limit values for
PM10 were defined (Fig. 12). The concentrations of other pollutants remained under the limit
values.
Figure 12: Average imission concentrations of different pollutants (SO2, NO2, O3 and PM10) in the Usti
Region. Limit values are marked with blue lines.
2.4.3 Health data
Relatively young population lives in the Usti Region. The average age in the region is almost 40
years. However, the population in the Usti Region is getting older. In the next years the
population will decrease in the age group of 0 -14 years (15% of population in 2008) and
increase in age groups of 15 – 64 years (72% of population in 2008) and 65 years and above
(13% of population in 2008).
0
2
4
6
8
10
12
14
16
18
20
Děčín Most Teplice Litoměřice Chomutov Ústí nadLabem
Co
nce
ntr
atio
n (
µg
m-3
)
Average annual concentration of SO2
2006
2007
2008
2009
2010
0
5
10
15
20
25
30
35
40
Děčín Most Teplice Louny Litoměřice Chomutov Ústí nadLabem
Co
nce
ntr
atio
n (
µg
m-3
)
Average annual concentration of NO2
2006
2007
2008
2009
2010
0
10
20
30
40
50
60
70
80
90
100
110
120
Most Teplice Louny Chomutov Ústi nadLabem
Co
nce
ntr
atio
n (
µg
m-3
)
Average max 8h concentration of ozone
2006
2007
2008
2009
2010
0
5
10
15
20
25
30
35
40
45
50
Děčín Most Teplice Louny Litoměřice Chomutov Ústi nadLabem
Co
nce
ntr
atio
n (
µg
m-3
)
Average daily concentration of PM10
2006
2007
2008
2009
2010
.
. Comparative SWOT analysis in the frame of TAB project
25
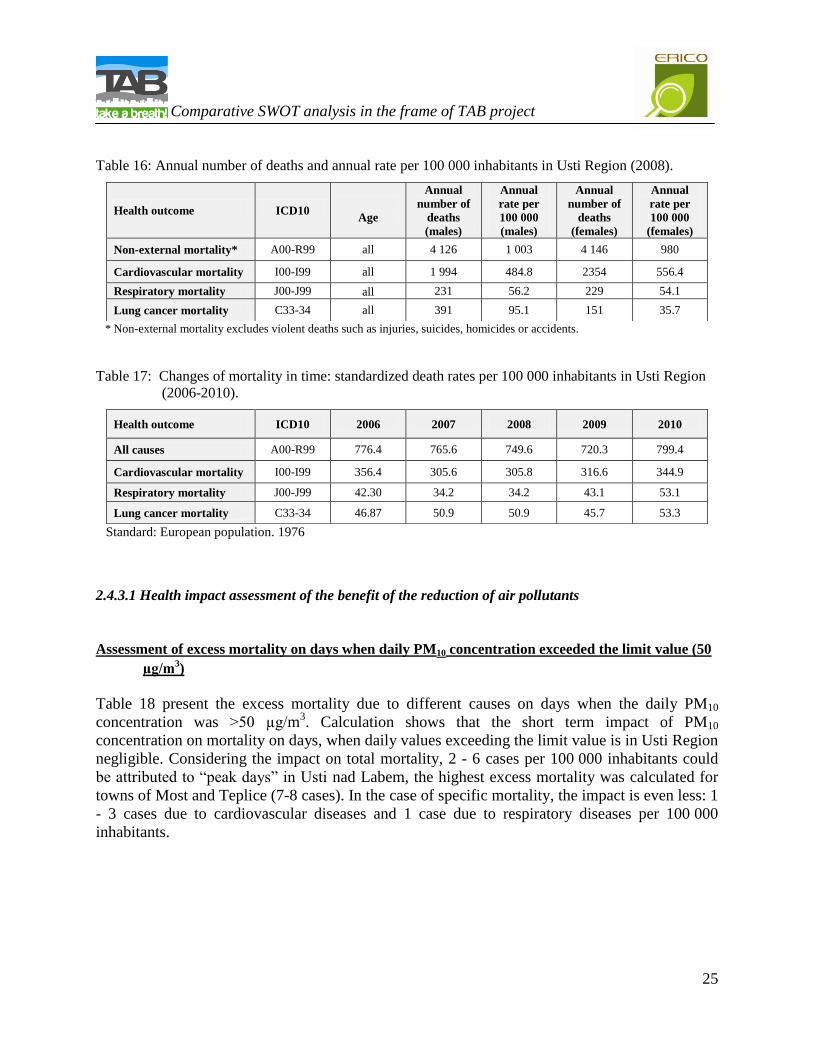
Table 16: Annual number of deaths and annual rate per 100 000 inhabitants in Usti Region (2008).
* Non-external mortality excludes violent deaths such as injuries, suicides, homicides or accidents.
Table 17: Changes of mortality in time: standardized death rates per 100 000 inhabitants in Usti Region
(2006-2010).
Standard: European population. 1976
2.4.3.1 Health impact assessment of the benefit of the reduction of air pollutants
Assessment of excess mortality on days when daily PM10 concentration exceeded the limit value (50
µg/m3)
Table 18 present the excess mortality due to different causes on days when the daily PM10
concentration was >50 µg/m3. Calculation shows that the short term impact of PM10
concentration on mortality on days, when daily values exceeding the limit value is in Usti Region
negligible. Considering the impact on total mortality, 2 - 6 cases per 100 000 inhabitants could
be attributed to “peak days” in Usti nad Labem, the highest excess mortality was calculated for
towns of Most and Teplice (7-8 cases). In the case of specific mortality, the impact is even less: 1
- 3 cases due to cardiovascular diseases and 1 case due to respiratory diseases per 100 000
inhabitants.
Health outcome ICD10
Age
Annual
number of
deaths
(males)
Annual
rate per
100 000
(males)
Annual
number of
deaths
(females)
Annual
rate per
100 000
(females)
Non-external mortality* A00-R99 all 4 126 1 003 4 146 980
Cardiovascular mortality I00-I99 all 1 994 484.8 2354 556.4
Respiratory mortality J00-J99 all 231 56.2 229 54.1
Lung cancer mortality C33-34 all 391 95.1 151 35.7
Health outcome ICD10 2006 2007 2008 2009 2010
All causes A00-R99 776.4 765.6 749.6 720.3 799.4
Cardiovascular mortality I00-I99 356.4 305.6 305.8 316.6 344.9
Respiratory mortality J00-J99 42.30 34.2 34.2 43.1 53.1
Lung cancer mortality C33-34 46.87 50.9 50.9 45.7 53.3
.
. Comparative SWOT analysis in the frame of TAB project
26
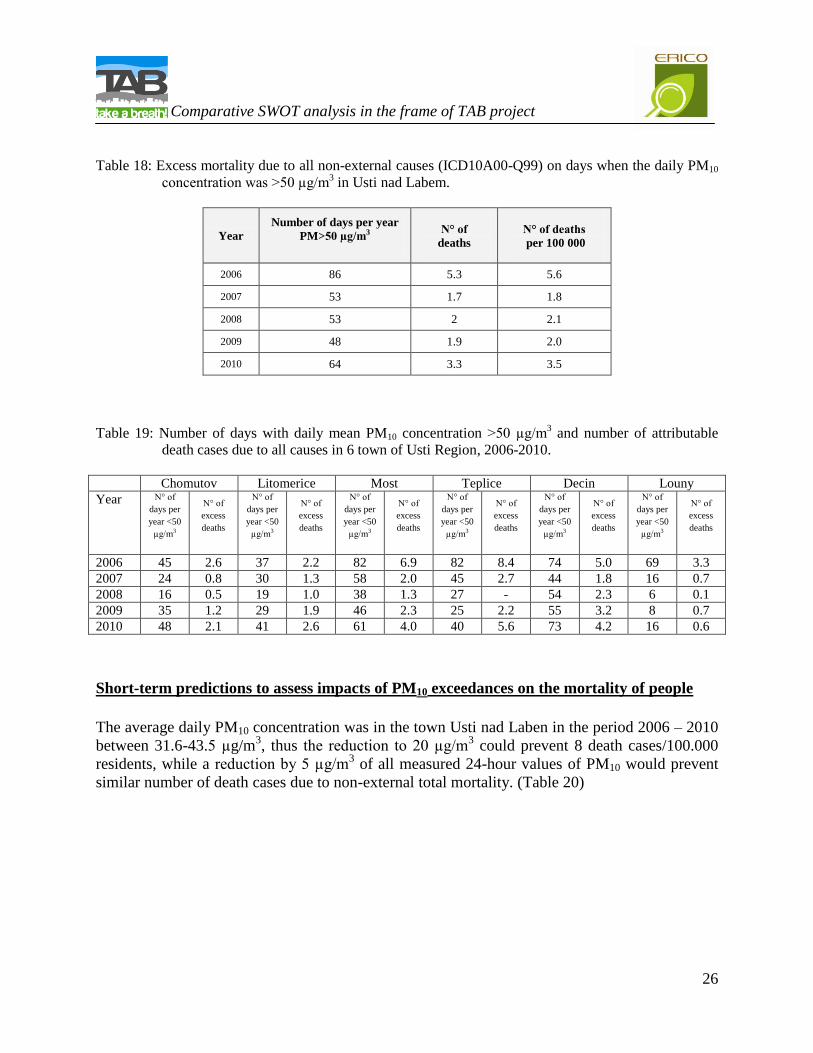
Table 18: Excess mortality due to all non-external causes (ICD10A00-Q99) on days when the daily PM10
concentration was >50 µg/m3 in Usti nad Labem.
Year
Number of days per year
PM>50 µg/m3
N° of
deaths
N° of deaths
per 100 000
2006 86 5.3 5.6
2007 53 1.7 1.8
2008 53 2 2.1
2009 48 1.9 2.0
2010 64 3.3 3.5
Table 19: Number of days with daily mean PM10 concentration >50 µg/m3 and number of attributable
death cases due to all causes in 6 town of Usti Region, 2006-2010.
Chomutov Litomerice Most Teplice Decin Louny
Year N° of
days per
year <50
µg/m3
N° of
excess
deaths
N° of
days per
year <50
µg/m3
N° of
excess
deaths
N° of
days per
year <50
µg/m3
N° of
excess
deaths
N° of
days per
year <50
µg/m3
N° of
excess
deaths
N° of
days per
year <50
µg/m3
N° of
excess
deaths
N° of
days per
year <50
µg/m3
N° of
excess
deaths
2006 45 2.6 37 2.2 82 6.9 82 8.4 74 5.0 69 3.3
2007 24 0.8 30 1.3 58 2.0 45 2.7 44 1.8 16 0.7
2008 16 0.5 19 1.0 38 1.3 27 - 54 2.3 6 0.1
2009 35 1.2 29 1.9 46 2.3 25 2.2 55 3.2 8 0.7
2010 48 2.1 41 2.6 61 4.0 40 5.6 73 4.2 16 0.6
Short-term predictions to assess impacts of PM10 exceedances on the mortality of people
The average daily PM10 concentration was in the town Usti nad Laben in the period 2006 – 2010
between 31.6-43.5 µg/m3, thus the reduction to 20 µg/m
3 could prevent 8 death cases/100.000
residents, while a reduction by 5 µg/m3 of all measured 24-hour values of PM10 would prevent
similar number of death cases due to non-external total mortality. (Table 20)
.
. Comparative SWOT analysis in the frame of TAB project
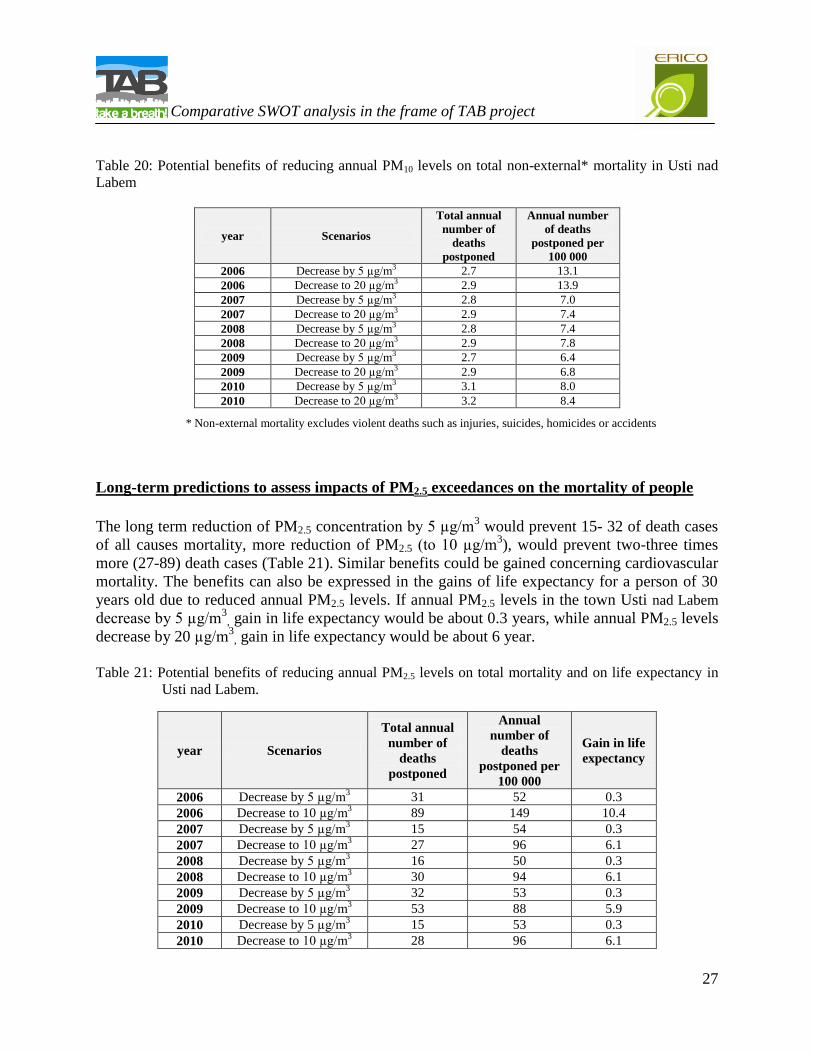
27
Table 20: Potential benefits of reducing annual PM10 levels on total non-external* mortality in Usti nad
Labem
year Scenarios
Total annual
number of
deaths
postponed
Annual number
of deaths
postponed per
100 000
2006 Decrease by 5 µg/m3 2.7 13.1
2006 Decrease to 20 µg/m3 2.9 13.9
2007 Decrease by 5 µg/m3 2.8 7.0
2007 Decrease to 20 µg/m3 2.9 7.4
2008 Decrease by 5 µg/m3 2.8 7.4
2008 Decrease to 20 µg/m3 2.9 7.8
2009 Decrease by 5 µg/m3 2.7 6.4
2009 Decrease to 20 µg/m3 2.9 6.8
2010 Decrease by 5 µg/m3 3.1 8.0
2010 Decrease to 20 µg/m3 3.2 8.4
* Non-external mortality excludes violent deaths such as injuries, suicides, homicides or accidents
Long-term predictions to assess impacts of PM2.5 exceedances on the mortality of people
The long term reduction of PM2.5 concentration by 5 µg/m3 would prevent 15- 32 of death cases
of all causes mortality, more reduction of PM2.5 (to 10 µg/m3), would prevent two-three times
more (27-89) death cases (Table 21). Similar benefits could be gained concerning cardiovascular
mortality. The benefits can also be expressed in the gains of life expectancy for a person of 30
years old due to reduced annual PM2.5 levels. If annual PM2.5 levels in the town Usti nad Labem
decrease by 5 µg/m3
, gain in life expectancy would be about 0.3 years, while annual PM2.5 levels
decrease by 20 µg/m3
, gain in life expectancy would be about 6 year.
Table 21: Potential benefits of reducing annual PM2.5 levels on total mortality and on life expectancy in
Usti nad Labem.
year Scenarios
Total annual
number of
deaths
postponed
Annual
number of
deaths
postponed per
100 000
Gain in life
expectancy
2006 Decrease by 5 µg/m3 31 52 0.3
2006 Decrease to 10 µg/m3 89 149 10.4
2007 Decrease by 5 µg/m3 15 54 0.3
2007 Decrease to 10 µg/m3 27 96 6.1
2008 Decrease by 5 µg/m3 16 50 0.3
2008 Decrease to 10 µg/m3 30 94 6.1
2009 Decrease by 5 µg/m3 32 53 0.3
2009 Decrease to 10 µg/m3 53 88 5.9
2010 Decrease by 5 µg/m3 15 53 0.3
2010 Decrease to 10 µg/m3 28 96 6.1
.
. Comparative SWOT analysis in the frame of TAB project
28
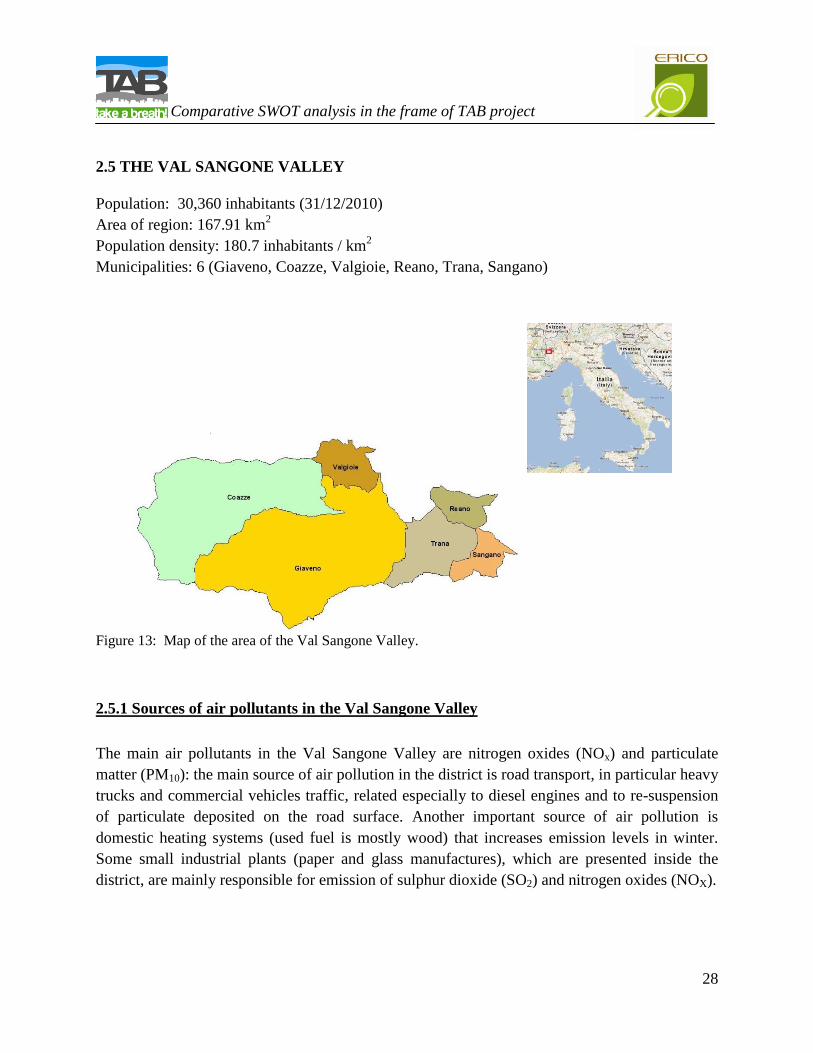
2.5 THE VAL SANGONE VALLEY
Population: 30,360 inhabitants (31/12/2010)
Area of region: 167.91 km2
Population density: 180.7 inhabitants / km2
Municipalities: 6 (Giaveno, Coazze, Valgioie, Reano, Trana, Sangano)
Figure 13: Map of the area of the Val Sangone Valley.
2.5.1 Sources of air pollutants in the Val Sangone Valley
The main air pollutants in the Val Sangone Valley are nitrogen oxides (NOx) and particulate
matter (PM10): the main source of air pollution in the district is road transport, in particular heavy
trucks and commercial vehicles traffic, related especially to diesel engines and to re-suspension
of particulate deposited on the road surface. Another important source of air pollution is
domestic heating systems (used fuel is mostly wood) that increases emission levels in winter.
Some small industrial plants (paper and glass manufactures), which are presented inside the
district, are mainly responsible for emission of sulphur dioxide (SO2) and nitrogen oxides (NOX).
.
. Comparative SWOT analysis in the frame of TAB project
29
Table 22: Main sources of air pollutants in the Val Sangone Valley (emissions expressed in tons/year).
Sources/pollutant Year SO2 NOx PM10
Heating 2005 15.0 78.2 32.7
2007 11.4 72.2 32.5
2008 6.5 54.2 102.0
Industry 2005 2.7 7.4 10.1
2007 3.9 23.4 5.7
2008 17.8 11.0 0.7
Road Traffic 2005 6.2 142.7 36.1
2007 4.8 114.8 22.0
2008 1.0 120.1 30.8
Agriculture 2005 0.0 2.7 0.0
2007 0.0 0.7 0.3
2008 0.0 0.3 0.3
Other Sources 2005 0.2 14.7 2.2
2007 0.2 13.6 2.5
2008 0.0 13.0 1.1
Total 2005 24 246 81
2007 20 225 63
2008 25 199 135
Data source: Piedmont Region - http://www.sistemapiemonte.it/ambiente/irea/
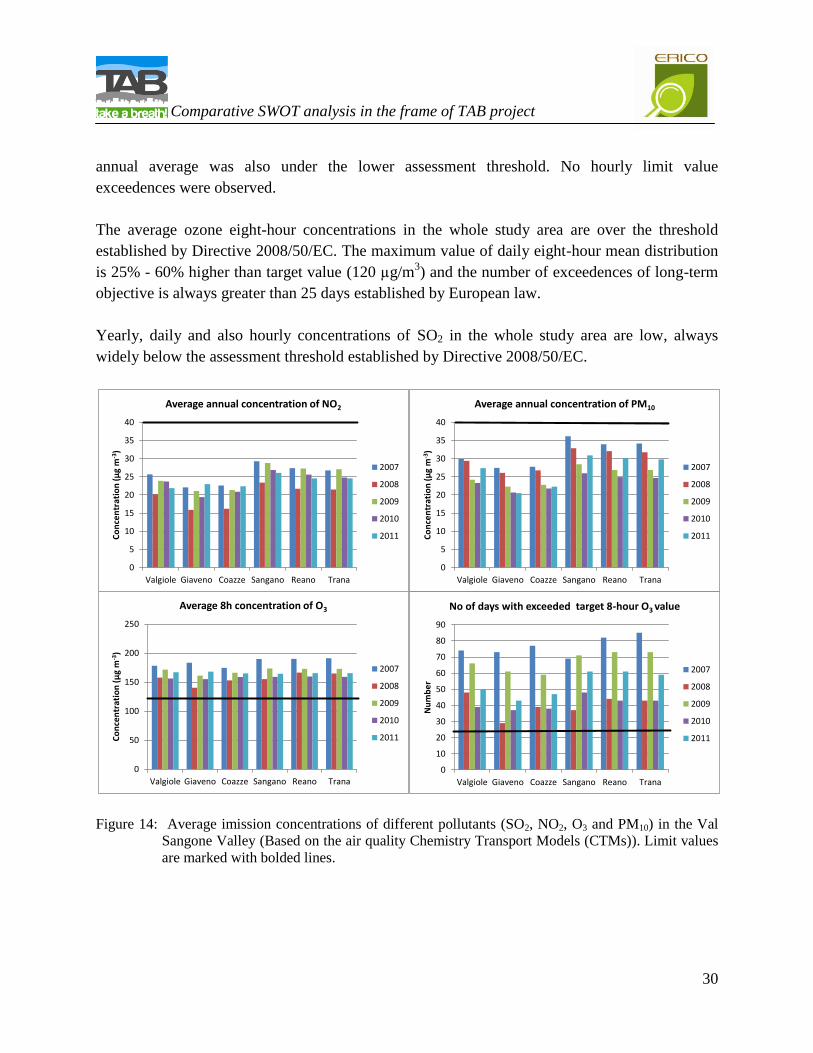
2.5.2 Imission concentrations of air pollutants in the Val Sangone Valley
The exposure data (related to PM10, NO2, SO2 and O3 concentrations) for the six cities located in
the Val Sangone Valley are obtained combining two sources of information: air quality
monitoring network and numerical models. There are no air quality monitoring stations in the
Val Sangone Valley. To fulfil the lack of information about air quality in this region, the air
quality Chemistry Transport Models (CTMs) was used. Such models can provide complex
spatial information about pollutant concentrations based on the fundamental description of
atmospheric physical and chemical processes involving emissions, meteorology and chemical
transformations.
Air quality assessment showed that the annual average of 24 hour concentrations of PM10 is
widely under the limit value for each year and for each city located in the Val Sangone Valley. In
the Sangano, Trana, Reano cities, probably due to their proximity to the Torino urban area, the
24-hour limit value was exceeded more than 35 times in each year, while in Coazze and Giaveno
this exceedences happened only in the year 2007 and 2008. However there is a clear decreasing
trend in the PM10 concentrations over the study area.
The annual average of hourly concentrations of NO2 was always below the upper assessment
threshold established by Directive 2008/50/EC. In the Coazze, Giaveno and Valgioie cities the
.
. Comparative SWOT analysis in the frame of TAB project
30
annual average was also under the lower assessment threshold. No hourly limit value
exceedences were observed.
The average ozone eight-hour concentrations in the whole study area are over the threshold
established by Directive 2008/50/EC. The maximum value of daily eight-hour mean distribution
is 25% - 60% higher than target value (120 µg/m3) and the number of exceedences of long-term
objective is always greater than 25 days established by European law.
Yearly, daily and also hourly concentrations of SO2 in the whole study area are low, always
widely below the assessment threshold established by Directive 2008/50/EC.
Figure 14: Average imission concentrations of different pollutants (SO2, NO2, O3 and PM10) in the Val
Sangone Valley (Based on the air quality Chemistry Transport Models (CTMs)). Limit values
are marked with bolded lines.
0
5
10
15
20
25
30
35
40
Valgiole Giaveno Coazze Sangano Reano Trana
Co
nce
ntr
atio
n (
µg
m-3
)
Average annual concentration of PM10
2007
2008
2009
2010
2011
0
5
10
15
20
25
30
35
40
Valgiole Giaveno Coazze Sangano Reano Trana
Co
nce
ntr
atio
n (
µg
m-3
)
Average annual concentration of NO2
2007
2008
2009
2010
2011
0
50
100
150
200
250
Valgiole Giaveno Coazze Sangano Reano Trana
Co
nce
ntr
atio
n (
µg
m-3
)
Average 8h concentration of O3
2007
2008
2009
2010
2011
0
10
20
30
40
50
60
70
80
90
Valgiole Giaveno Coazze Sangano Reano Trana
Nu
mb
er
No of days with exceeded target 8-hour O3 value
2007
2008
2009
2010
2011
.
. Comparative SWOT analysis in the frame of TAB project
31
2.5.3 Health data
Table 23: Mortality due to all natural causes (ICDX: A00-R99) in the period 2006-2009. (Natural
mortality excludes violent deaths such as injuries, suicides, homicides or accidents).
MALES
Municipality
Observed annual mean
deaths 2006-2009
Annual mean
population
Annual Crude Rate
per 100.000
Coazze 17 1,660 1,024.02
Giaveno 76 7,744 981.47
Orbassano 86 10,731 796.75
Reano 7 798 877.33
Sangano 16 1,821 892.24
Torino 4338 432,095 1,003.95
Trana 13 1,840 720.11
Valgioie 3 476 525.62
Total area 4556 457,165 996.47
Piedmont Region 22145 2,131,267 1,039.03
FEMALES
Municipality
Observed annual mean
deaths 2006-2009
Annual mean
Population
Annual Crude Rate
per 100.000
Coazze 16 1,563 1,007.68
Giaveno 115 8,315 1,386.07
Orbassano 79 11,286 702.19
Reano 8 809 927.07
Sangano 21 1,941 1,056.09
Torino 4694 473,587 991.16
Trana 12 1,877 652.81
Valgioie 4 428 993.57
Total area 4949 499,806 990.13
Piedmont Region 24379 2,263,895 1,076.85
2.5.3.1 Health impact assessment of the benefit of the reduction of air pollutants
Health impact assessment was not calculated, due to lack of regullary monitoring of air in the
region.
.
. Comparative SWOT analysis in the frame of TAB project
32
3 COMPARISON AMONG STUDY REGIONS REGARDING AIR
POLLUTANTS AND HEALTH DATA
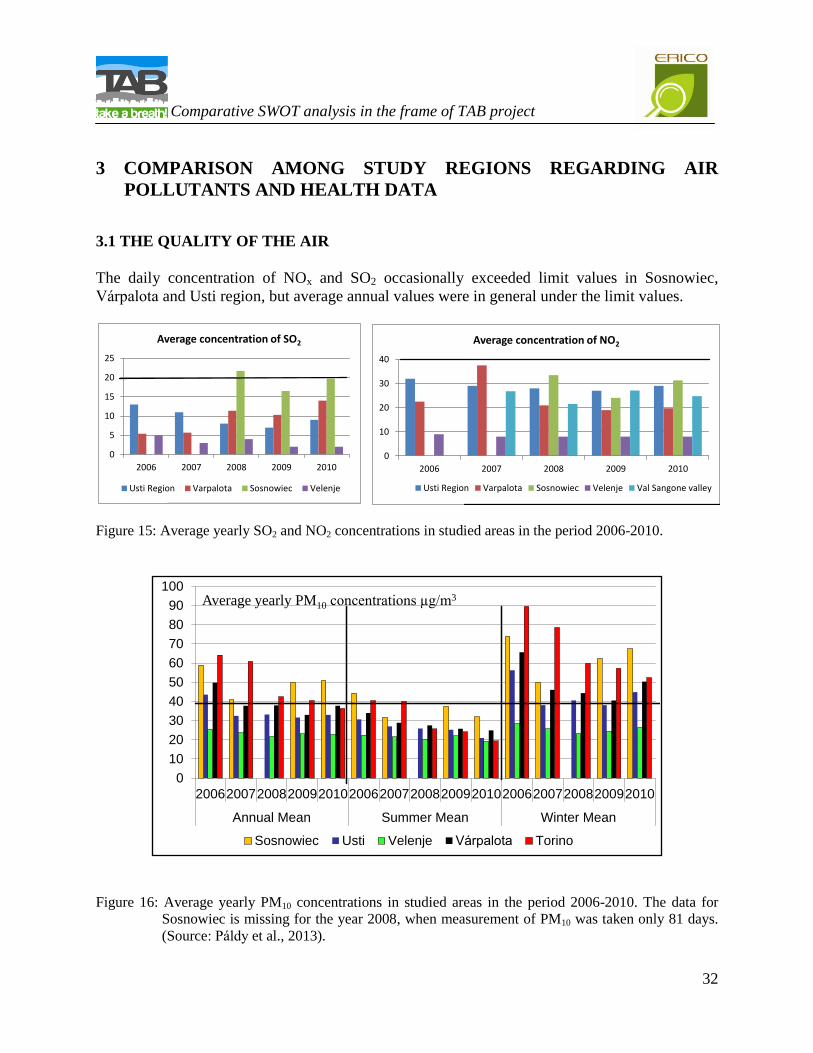
3.1 THE QUALITY OF THE AIR
The daily concentration of NOx and SO2 occasionally exceeded limit values in Sosnowiec,
Várpalota and Usti region, but average annual values were in general under the limit values.
Figure 15: Average yearly SO2 and NO2 concentrations in studied areas in the period 2006-2010.
Figure 16: Average yearly PM10 concentrations in studied areas in the period 2006-2010. The data for
Sosnowiec is missing for the year 2008, when measurement of PM10 was taken only 81 days.
(Source: Páldy et al., 2013).
0
10
20
30
40
2006 2007 2008 2009 2010
Average concentration of NO2
Usti Region Varpalota Sosnowiec Velenje Val Sangone valley
0
5
10
15
20
25
2006 2007 2008 2009 2010
Average concentration of SO2
Usti Region Varpalota Sosnowiec Velenje
0
10
20
30
40
50
60
70
80
90
100
200620072008200920102006200720082009201020062007200820092010
Annual Mean Summer Mean Winter Mean
Average yearly PM10 concentrations µg/m3
Sosnowiec Usti Velenje Várpalota Torino
.
. Comparative SWOT analysis in the frame of TAB project
33
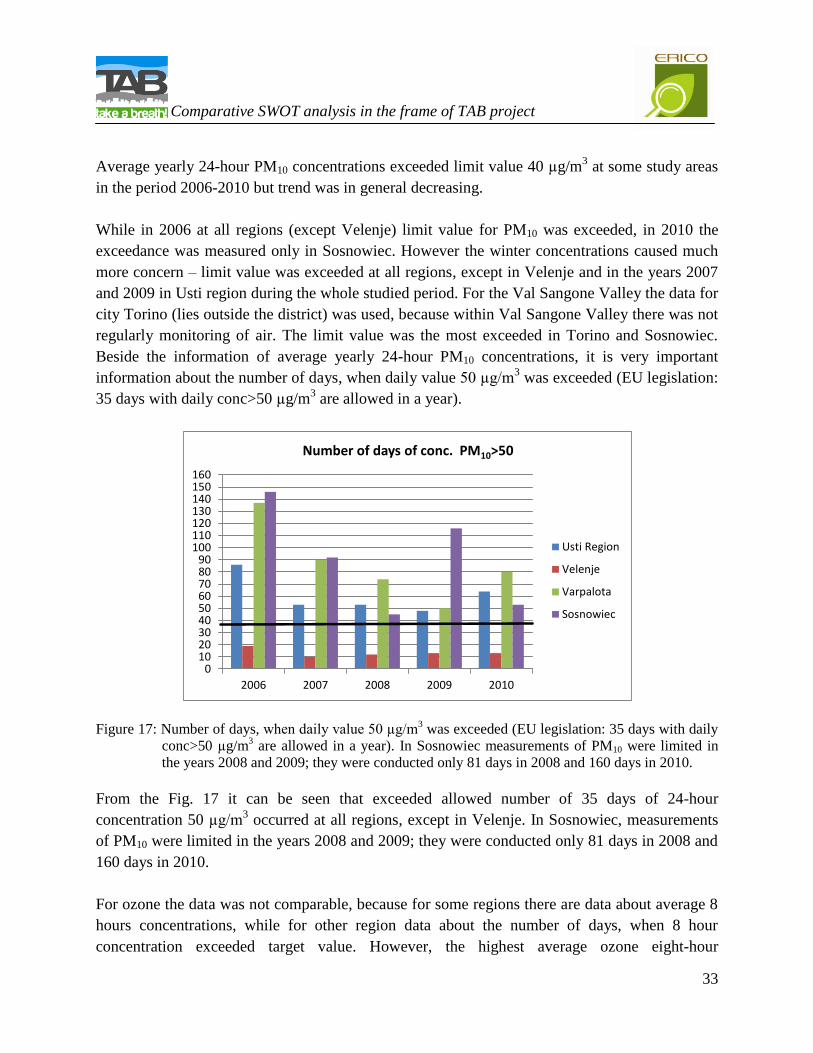
Average yearly 24-hour PM10 concentrations exceeded limit value 40 µg/m3 at some study areas
in the period 2006-2010 but trend was in general decreasing.
While in 2006 at all regions (except Velenje) limit value for PM10 was exceeded, in 2010 the
exceedance was measured only in Sosnowiec. However the winter concentrations caused much
more concern – limit value was exceeded at all regions, except in Velenje and in the years 2007
and 2009 in Usti region during the whole studied period. For the Val Sangone Valley the data for
city Torino (lies outside the district) was used, because within Val Sangone Valley there was not
regularly monitoring of air. The limit value was the most exceeded in Torino and Sosnowiec.
Beside the information of average yearly 24-hour PM10 concentrations, it is very important
information about the number of days, when daily value 50 µg/m3 was exceeded (EU legislation:
35 days with daily conc>50 µg/m3 are allowed in a year).
Figure 17: Number of days, when daily value 50 µg/m3 was exceeded (EU legislation: 35 days with daily
conc>50 µg/m3 are allowed in a year). In Sosnowiec measurements of PM10 were limited in
the years 2008 and 2009; they were conducted only 81 days in 2008 and 160 days in 2010.
From the Fig. 17 it can be seen that exceeded allowed number of 35 days of 24-hour
concentration 50 µg/m3 occurred at all regions, except in Velenje. In Sosnowiec, measurements
of PM10 were limited in the years 2008 and 2009; they were conducted only 81 days in 2008 and
160 days in 2010.
For ozone the data was not comparable, because for some regions there are data about average 8
hours concentrations, while for other region data about the number of days, when 8 hour
concentration exceeded target value. However, the highest average ozone eight-hour
0102030405060708090
100110120130140150160
2006 2007 2008 2009 2010
Number of days of conc. PM10>50
Usti Region
Velenje
Varpalota
Sosnowiec
.
. Comparative SWOT analysis in the frame of TAB project
34
concentrations were in the Val Sangone Valley; the maximum value of daily eight-hour mean
distribution is 25% - 60% higher than target value (120 µg/m3) and the number of exceedences
of long-term objective is always much greater than 25 days established by European law.
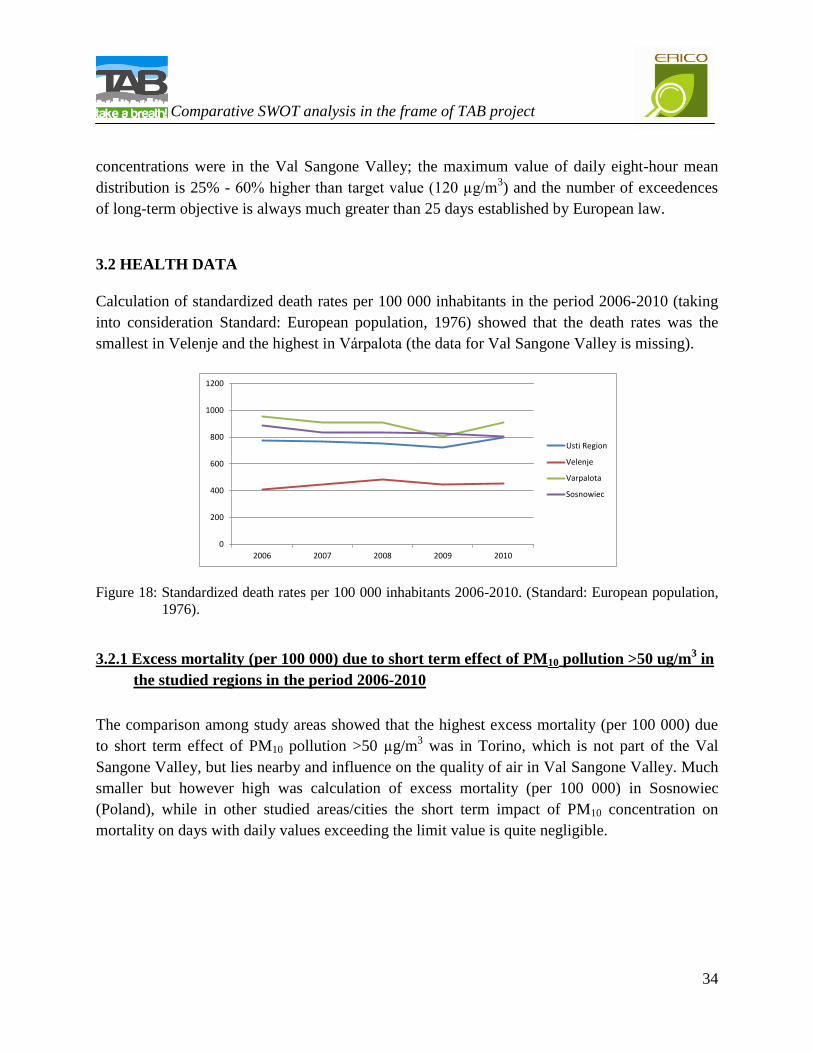
3.2 HEALTH DATA
Calculation of standardized death rates per 100 000 inhabitants in the period 2006-2010 (taking
into consideration Standard: European population, 1976) showed that the death rates was the
smallest in Velenje and the highest in Várpalota (the data for Val Sangone Valley is missing).
Figure 18: Standardized death rates per 100 000 inhabitants 2006-2010. (Standard: European population,
1976).
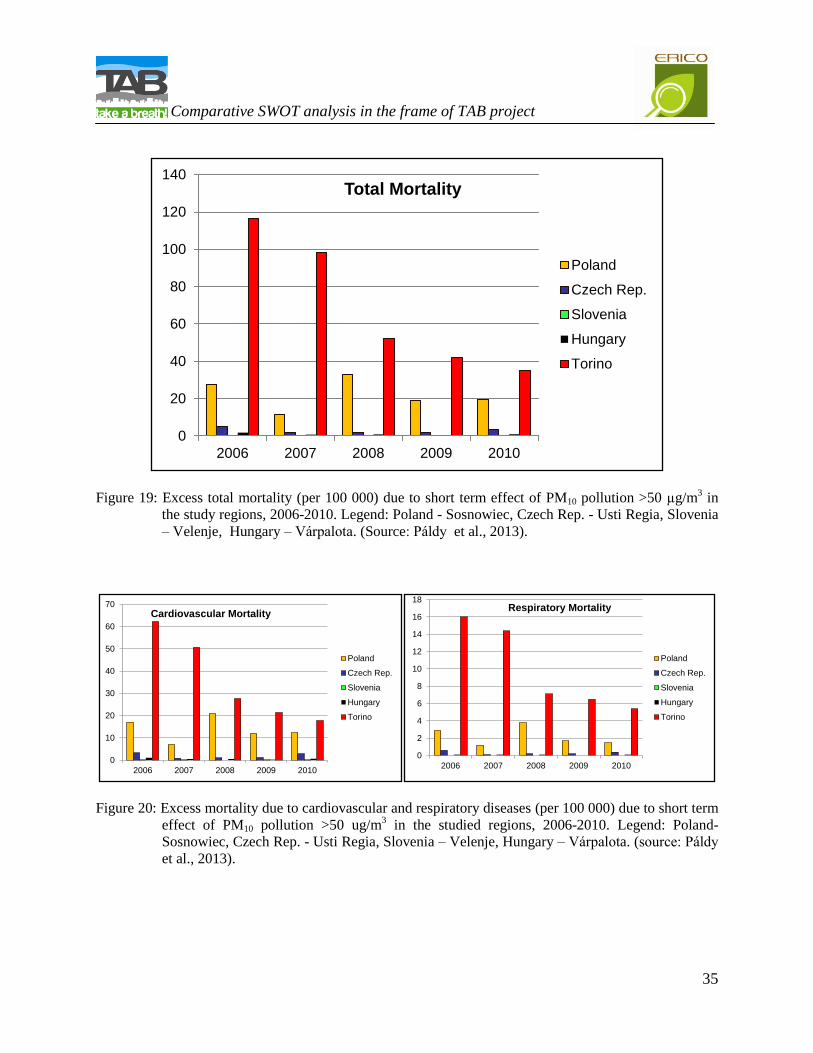
3.2.1 Excess mortality (per 100 000) due to short term effect of PM10 pollution >50 ug/m3 in
the studied regions in the period 2006-2010
The comparison among study areas showed that the highest excess mortality (per 100 000) due
to short term effect of PM10 pollution >50 µg/m3 was in Torino, which is not part of the Val
Sangone Valley, but lies nearby and influence on the quality of air in Val Sangone Valley. Much
smaller but however high was calculation of excess mortality (per 100 000) in Sosnowiec
(Poland), while in other studied areas/cities the short term impact of PM10 concentration on
mortality on days with daily values exceeding the limit value is quite negligible.
0
200
400
600
800
1000
1200
2006 2007 2008 2009 2010
Usti Region
Velenje
Varpalota
Sosnowiec
.
. Comparative SWOT analysis in the frame of TAB project
35
Figure 19: Excess total mortality (per 100 000) due to short term effect of PM10 pollution >50 µg/m3 in
the study regions, 2006-2010. Legend: Poland - Sosnowiec, Czech Rep. - Usti Regia, Slovenia
– Velenje, Hungary – Várpalota. (Source: Páldy et al., 2013).
Figure 20: Excess mortality due to cardiovascular and respiratory diseases (per 100 000) due to short term
effect of PM10 pollution >50 ug/m3 in the studied regions, 2006-2010. Legend: Poland-
Sosnowiec, Czech Rep. - Usti Regia, Slovenia – Velenje, Hungary – Várpalota. (source: Páldy
et al., 2013).
0
20
40
60
80
100
120
140
2006 2007 2008 2009 2010
Total Mortality
Poland
Czech Rep.
Slovenia
Hungary
Torino
0
10
20
30
40
50
60
70
2006 2007 2008 2009 2010
Cardiovascular Mortality
Poland
Czech Rep.
Slovenia
Hungary
Torino
0
2
4
6
8
10
12
14
16
18
2006 2007 2008 2009 2010
Respiratory Mortality
Poland
Czech Rep.
Slovenia
Hungary
Torino
.
. Comparative SWOT analysis in the frame of TAB project
36
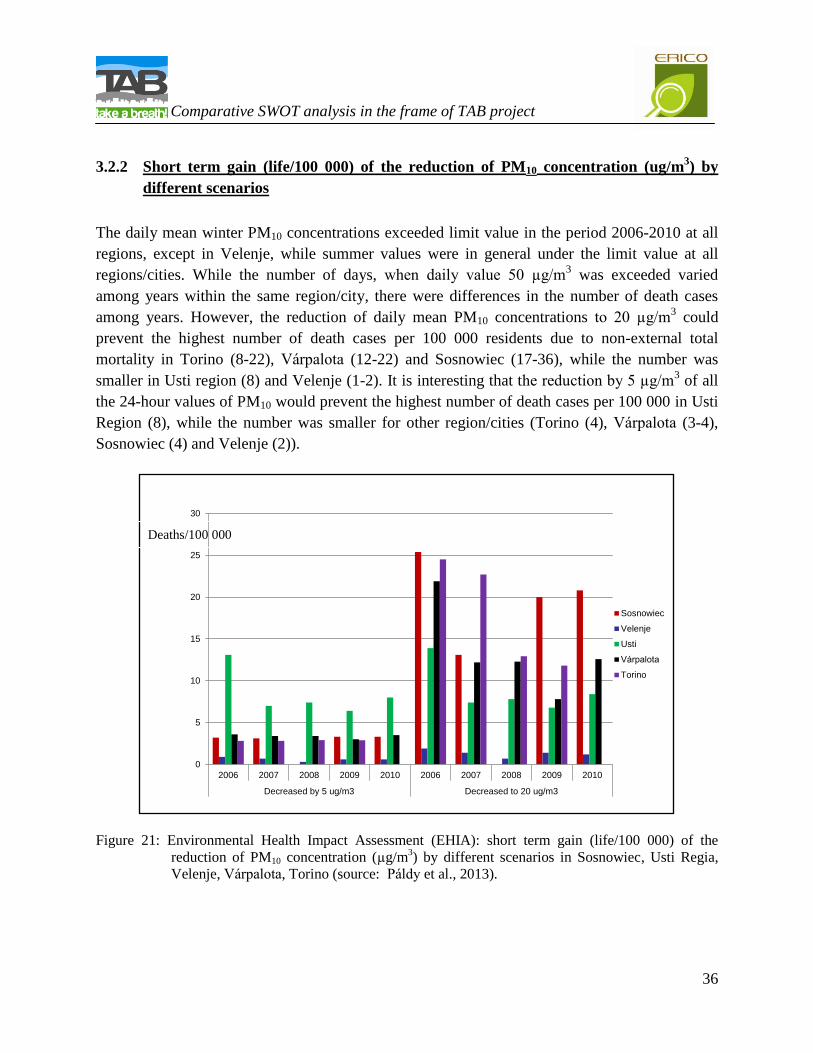
3.2.2 Short term gain (life/100 000) of the reduction of PM10 concentration (ug/m3) by
different scenarios
The daily mean winter PM10 concentrations exceeded limit value in the period 2006-2010 at all
regions, except in Velenje, while summer values were in general under the limit value at all
regions/cities. While the number of days, when daily value 50 µg/m3 was exceeded varied
among years within the same region/city, there were differences in the number of death cases
among years. However, the reduction of daily mean PM10 concentrations to 20 µg/m3 could
prevent the highest number of death cases per 100 000 residents due to non-external total
mortality in Torino (8-22), Várpalota (12-22) and Sosnowiec (17-36), while the number was
smaller in Usti region (8) and Velenje (1-2). It is interesting that the reduction by 5 µg/m3 of all
the 24-hour values of PM10 would prevent the highest number of death cases per 100 000 in Usti
Region (8), while the number was smaller for other region/cities (Torino (4), Várpalota (3-4),
Sosnowiec (4) and Velenje (2)).
Figure 21: Environmental Health Impact Assessment (EHIA): short term gain (life/100 000) of the
reduction of PM10 concentration (µg/m3) by different scenarios in Sosnowiec, Usti Regia,
Velenje, Várpalota, Torino (source: Páldy et al., 2013).
0
5
10
15
20
25
30
2006 2007 2008 2009 2010 2006 2007 2008 2009 2010
Decreased by 5 ug/m3 Decreased to 20 ug/m3
Sosnowiec
Velenje
Usti
Várpalota
Torino
Deaths/100 000
.
. Comparative SWOT analysis in the frame of TAB project
37
4 COMMON CHARACTERISTICS OR EXCEPTIONS OF STUDY AREAS
4.1 STRENGTHS AND WEAKNESSES
The most important characteristics of the study areas that give them an advantage or
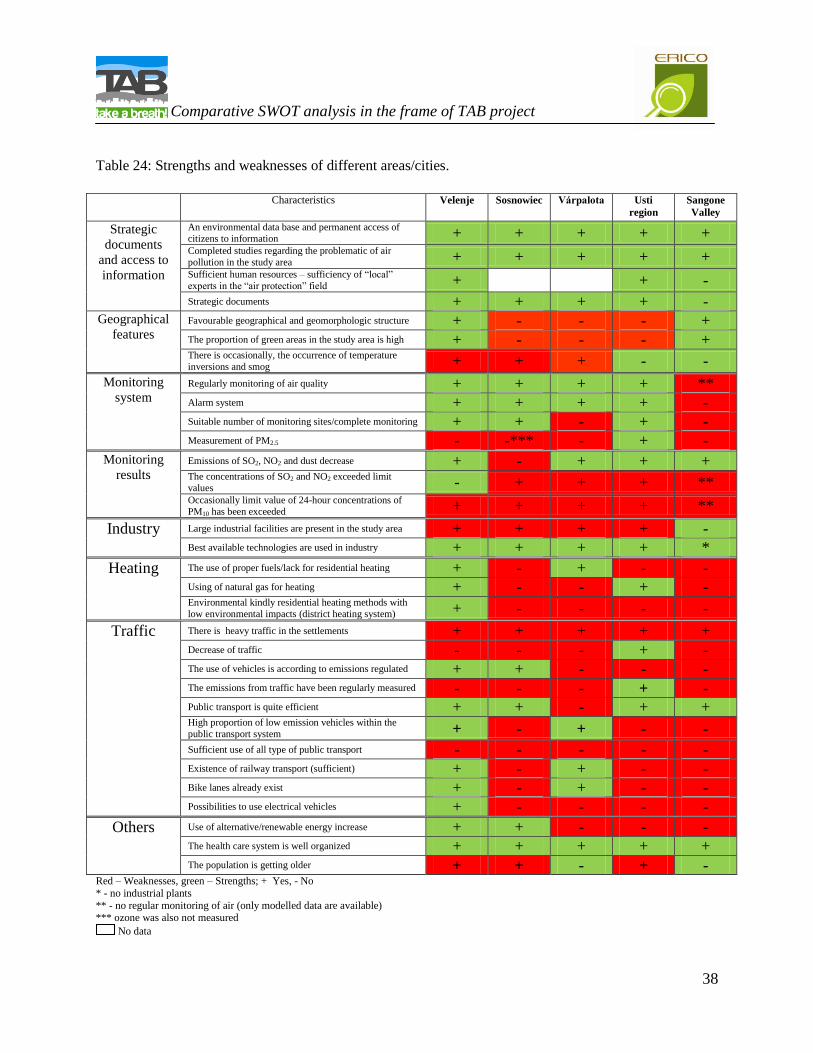
disadvantage over others are represent in the Table 24.
4.1.1 Geographical features
Only for Velenje (The Šalek Valley) and the Val Sangone Valley geographical features are
favourable to prevent retention of pollutants in the regions. The Val Sangone Valley is not
directly facing the centre of Turin, as the river stream curves towards North West during its
course. The main winds that hit the industrial region of Turin tend to orientate along the Susa
Valley and still rarely go back to the Val Sangone Valley. However the particular morphology of
the Piedmont plain, in which the greater part of the population lives, surrounded by mountains to
the north, west and south, facilitates the accumulation of pollutants coming from the east at the
openings created by the routes of the river Po and its two main tributaries Ticino and Tanaro, on
the border with Lombardy and Emilia-Romagna. In Velenje and Várpalota the occurrence of
temperature inversions and smog occurred occasionally (in winter). Várpalota situated near the
Bakony mountains in a closed basin. The climate is dry and the number of windy days is below
the average. Wind often brings rain and although wind blows the pollutants out of the basin, rain
washes those down causing secondary pollutions (e.g. soil contamination).
4.1.2 Monitoring system
Regularly monitoring of air quality with early warning system (when alert threshold is exceeded)
is well organized at all regions, except in the Val Sangone Valley, where monitoring has not
occurred. In the Val Sangone Valley the presence of air pollutants is estimated by using an
information support system based on integrated models. In the analysed period of 2006-2010, in
Sosnowiec there are incomplete measurement data concerning air pollution from the National
Environmental Monitoring. In Sosnowiec and Várpalota the lack of suitable number of
monitoring sites has also been observed. For ozone and PM2.5 harmful effect on the human health
have been recognized thus the measurement of this parameter would be obligatory for
assessment of quality of air. The measurement of ozone and PM2.5 is missing in the Val Sangone
Valley and Sosnowiec, while in Velenje and Várpalota ony the measurement of PM2.5 has not
been performed.
.
. Comparative SWOT analysis in the frame of TAB project
38
Table 24: Strengths and weaknesses of different areas/cities.
Characteristics
Velenje Sosnowiec Várpalota Usti
region
Sangone
Valley
Strategic
documents
and access to
information
An environmental data base and permanent access of
citizens to information + + + + + Completed studies regarding the problematic of air
pollution in the study area + + + + + Sufficient human resources – sufficiency of “local”
experts in the “air protection” field + + -
Strategic documents + + + + - Geographical
features Favourable geographical and geomorphologic structure + - - - + The proportion of green areas in the study area is high + - - - + There is occasionally, the occurrence of temperature
inversions and smog + + + - -
Monitoring
system Regularly monitoring of air quality + + + + ** Alarm system + + + + - Suitable number of monitoring sites/complete monitoring + + - + - Measurement of PM2.5 - -*** - + -
Monitoring
results Emissions of SO2, NO2 and dust decrease + - + + + The concentrations of SO2 and NO2 exceeded limit
values - + + + ** Occasionally limit value of 24-hour concentrations of
PM10 has been exceeded + + + + **
Industry Large industrial facilities are present in the study area + + + + - Best available technologies are used in industry + + + + *
Heating The use of proper fuels/lack for residential heating + - + - - Using of natural gas for heating + - - + - Environmental kindly residential heating methods with
low environmental impacts (district heating system) + - - - -
Traffic There is heavy traffic in the settlements + + + + + Decrease of traffic - - - + - The use of vehicles is according to emissions regulated + + - - - The emissions from traffic have been regularly measured - - - + - Public transport is quite efficient + + - + + High proportion of low emission vehicles within the
public transport system + - + - -
Sufficient use of all type of public transport - - - - - Existence of railway transport (sufficient) + - + - - Bike lanes already exist + - + - - Possibilities to use electrical vehicles + - - - -
Others Use of alternative/renewable energy increase + + - - - The health care system is well organized + + + + + The population is getting older + + - + -
Red – Weaknesses, green – Strengths; + Yes, - No
* - no industrial plants
** - no regular monitoring of air (only modelled data are available) *** ozone was also not measured
No data
.
. Comparative SWOT analysis in the frame of TAB project
39
4.1.3 Monitoring results
Emissions of SO2, NO2 and dust decreased in all involved regions in the last decade, only in
Sosnowiec the emission of gas and dust pollution has increased in last years. The highest
increase was noted in the case of SO2 and particulate matter. In spite of decrease trend of
emissions of some air pollutants, the daily imission concentrations of SO2 and NO2 exceeded
limit values in Sosnowiec, Várpalota and Usti region. At all regions (data for Val Sangone
Valley, where monitoring has not occurred, is on a modeling basis) limit value of 24-hour
concentrations of PM10 (40 µg/m3) has been occasionally exceeded in the period 2006-2010,
while allowed number of 35 days of exceedance of 24-hour concentration 50 µg/m3, occurred at
all regions, except in the Šalek Valley. The highest average ozone eight-hour concentrations
were calculated for the Val Sangone Valley; the maximum value of daily eight-hour mean
distribution is 25% - 60% higher than target value (120 µg/m3) and the number of exceedences
of long-term objective is always much greater than 25 days established by European law.
4.1.4 Industry
Large industrial facilities are present in all studied areas (except in the Val Sangone Valley),
which used the best available technologies with the aim to maintain the acceptable level of
emission and to reduce the emission and the impact on the environment. Only small enterprises
are operated in Val Sangone Valley; large industrial centre is located nearby, in Turin.
4.1.5 Heating
At some regions (Sosnowiec, Usti region, the Val Sangone Valley) there are lack of use of
proper fuels for residential heating. Burning municipal waste in individual heating systems is a
big problem for the city of Sosnowiec. To stop that in Sosnowiec, financial support for the
modernization of heating system in residential buildings is available and an implementation of
the program of the development of heating network and the replacement of heating systems
(TAURON). In Usti Region there is low use of existing natural gas distribution network for
heating by households, where improper fuels are burned in obsolete improper maintained heating
systems. 69% of the population in mountainous areas of the Val Sangone Valley uses wood as
the main source for heating and the age of heat generators is high (14% of them are over 20 years
old). Not only that the majority of the heating systems are obsolescent but in many cases also the
poor quality of the wood raises the emission level. In the Šalek Valley there is a constructed
system of remote heating supply (from burning coal in Šoštanj Thermal Power plant), which
.
. Comparative SWOT analysis in the frame of TAB project
40
provides hot water and heating to residential buildings as well as to the business, administrative
and industrial buildings. 90% of the population of the Šalek Valley is connected to this system.
Additionally, some households and other buildings are heated with natural gas. In Várpalota
distant heating system is available in certain districts but needs some improvements.
4.1.6 Usage of alternative/renewable energy
Substituting conventional energy sources with renewable energy sources: solar and air collectors,
wind power plants, bio gas plants - are still not sufficiently popularized in study areas due to
various factors, e.g. insufficient financial mechanisms addressed directly to renewable energy
producers. Further, the costs of energy production being lower or similar to the costs or prices of
conventional energy carriers (Usti Region, Sosnowiec and Várpalota). The usage of alternative
energy increases in the Šalek Valley, but in insufficient level. In the Val Sangone Valley, due to
its rural location and high prices of fossil fuels (wood is abundant in the valley), wood heating in
the house is quite common, but the age of heat generators is high. The increased use of solar
energy systems have not yet been in common usage in this area, in spite of public aids granted
for the installation.
4.1.7 Traffic
Roads with heavy traffic are in the settlements of all study areas. The increase trend of traffic is
recognized in all regions, except in Usti Region. The use of vehicles is according to emissions
regulated in the Šalek Valley and Sosnowiec. In Slovenia, vehicles shall not be included in
traffic, unless they comply with the rules laid down in Rules on roadworthiness tests for motor
vehicles and trailers (Official Gazette of RS. no. 88/2005). The emissions from traffic have been
regularly measured only in Várpalota, but it is not representative enough, because only one
measurement unit operates there. It situates near busy main road but in a less populated
residential area. Inside other areas (The Šalek Valley, Sosnowiec, Usti Region, the Val Sangone
Valley) the emissions from traffic have not been regularly measured. In the Val Sangone Valley
only measured data from temporary campaign, the one occurred in November-December 2012,
was available, but no fixed measurement stations are placed inside the area.
Despite of the well-organized public transport, it is not used sufficiently in all studied regions. In
Várpalota, regional community transport uses elder buses with high-emissions. Várpalota
directly links to the national railway network; it has a railways station. In the Val Sangone
Valley, the organization of public transport is quite efficient in terms of connections and
.
. Comparative SWOT analysis in the frame of TAB project
41
frequency (bus, train) but ecological buses and electric vehicles are not used for public transport
and the whole fleet should be renovated. Bus service is quite efficient, at least to and from Turin,
at the main peak hours; a connection with train is possible in Avigliana. Connections to other
important localities, however, are not so easy by public transport. In particular connections with
Rivoli, one of the most important towns of the surroundings with an important hospital and
schools is quite deficient. In Sosnowiec free transport to large supermarkets is organized. The
Municipality of Sosnowiec, together with the municipalities of Będzin and Dąbrowa Górnicza,
entered the Project "Modernization of public bus transportation infrastructure in the
municipalities of Będzin, Dąbrowa Górnicza and Sosnowiec". Within the framework of the
project, 62 buses were withdrawn from circulation and they were replaced by 72 buses, equipped
with ecological power units that fulfil the requirements in the scope of pollution emission on the
level of Euro 3 standard. In Usti Region there are available all kinds of public transport (bus,
regional bus, railways) with coordination lines, interchanges, continuity connections of different
types of public transport. There is also financial support for ecological traffic - environmental
friendly modernization of public transport vehicles – e.g. building of new trolleybus lines. In
Velenje there is free of charge local public transport since September 2008.
Bike lanes already exist only in Velenje and Várpalota. In Velenje bicycle rental is free of charge.
In Várpalota bike lanes run all over the city connecting the centre and the outer block districts. In
the Val Sangone Valley, the morphology of the area (mainly hilly and mountainous) and the
remarkable distances are not favourable conditions to the extensive bike use as a means of
transport. Inside the area there are only two short bike lanes in Giaveno district and a longer one
in Sangano connected to the urban and periurban network of the Turin city.
A possibility to use electrical vehicles is only in Velenje and Sosnowiec. In Velenje two pillars
for charging electric vehicles have been available since November 2010. However, their usage is
currently quite low. There are 12 charging stations for electric vehicles in the Silesian
Voivodeship. Unfortunately, these are mostly private points; there are not enough commercial
stations. There is one 230 volt (1 phase) charging point in Sosnowiec.
4.1.8 The health care system
The health care system is well organized at all study areas. Three hospitals are in the vicinity of
Velenje. Most of the population has basic health assurance (for employees it was paid by
companies, for the unemployed and pensioners it was paid by the state), what allows access to
the health services most of the population. Inhabitants have also access to information about the
health condition of the population in different regions in Slovenia via different websites. In
.
. Comparative SWOT analysis in the frame of TAB project
42
Várpalota pulmono-respiratory diseases are monitored regularly. Rehabilitation is also well
organised. The Rehabilitation Institute for Pulmonary Diseases in Várpalota records the patients
and diseases and reports ones to the Municipal Assembly every year. In Usti Region existing
public health system is in operation. In Sosnowiec there are 4 hospitals. Citizens have equal
access to health care services, financed from public funds, irrespective of their material situation.
In Giaveno District, there is a public hospital in the Val Sangone Valley and a specific Health
district is seated in this municipality; close to the area are located some other hospitals (Rivoli
and Avigliana hospitals. Cancer research centre in Candiolo, several hospitals in Turin, Azienda
ospedaliera San Luigi in Orbassano) and highly specialised centres (Cancer research centre in
Candiolo). Some other private structures are also present around Giaveno District (Villa Augusta
in Bruino, Villa Serena a Piossasco). Basic data about health condition are available at the site of
ISTAT – National Institute of Statistics (http://www.istat.it).
4.1.9 Access to environmental information
Inhabitants of the Šalek Valley have via the website of Environmental Agency of RS
http://www.arso.gov.si/ access to all annual reports on quality of air in Slovenia. At the same
website there are forecasts for increased concentration of ozone. On the website of Šoštanj
Thermal Power plant http://www.te-sostanj.si/si/ hourly and daily values on some air pollutants
are available (continuous monitoring). Data is renewed every hour. On this website also the
forecast for every day for the pollution of area with different pollutants (SO2, NO2, and PM10) is
available. On the website of Municipality of Velenje http://www.velenje.si/ there are also
available hourly and daily concentrations of SO2, NO2, O3 and PM10 for all measuring station
(the same stations than on the website of ŠTPP). Local comparable data of air quality in
Várpalota is accessed via internet: http://oki.wesper.hu/levego/2013-02-21/25. Information about
the quality of air in Sosnowiec is systematically published on the website of the Silesian air
monitoring. The website is connected with the system of air quality forecast, where forecasts
worked out by the Institute of Meteorology and Water Management based on current results
from automatic stations, are available. The website of the Regional Inspectorate of
Environmental Protection in Katowice publishes information and reports on the state of
environment for the city of Sosnowiec and other cities of the Silesian Voivodeship. Citizens of
the Piemonte Region can get much information about the environment parameters through the
website of Environmental Agency of Regione Piemonte (http://www.arpa.piemonte.it). Every
year a report on the Environment conditions in Piedmont is also published by Arpa and uploaded
on the website. The public may also find the annual report on the State of the environment for
Piemonte region. On www.sistemapiemonte.it you can find data on PM10, ozone, NO2 and others
parameters. For Usti Regia, all data are freely available on the website CHMI
.
. Comparative SWOT analysis in the frame of TAB project
43
www.portal.chmi.cz, Usti Region www.kr-ustecky.cz and The Institute of Public Health in Usti
nad Labem www.zuusti.cz.
4.1.10 Strategic documents
Velenje
Local Agenda 21
Municipal Environmental Protection Programme
Usti Region
The Act on Air Protection (Among others include IPPC, Strategic documents of the
Environmental Education in the Czech Republic, the concept of sustainable development,
Local Agenda 21, EIA / SEA, etc.).
The Region strategic materials, the issues of energy and climate protection (Integrated
regional Plan to improve air quality in the Usti Region and its Programme Complement),
which are regularly updated.
Várpalota
Integrated Urban Development Strategy (2011)
Local Environment Protection Programme (2009)
Programme for Restructuring Micro-regional Economic Structure (2011)
Micro-regional Spatial Development Concept
Economy Development Strategy for Várpalota (2004)
Municipal Order on the Protection of Clearness of Air
Municipal Order on Smog Alarm Plan for Várpalota
Municipal Order on Support of Energy Saving Renovation of Block of Flats Made of
Industrial Technology
Municipal Order on Environment Protection Fund
Municipal Order on Environment Protection Programme of City of Várpalota
Integrated Urban Spatial Plan supports environment protection oriented urban spatial
development appointing special industrial development zones and environmental criteria.
Urban Environment Protection Programme for Várpalota (2008)
.
. Comparative SWOT analysis in the frame of TAB project
44
Sosnowiec
The Low Emission Reduction Program (LERP) for the city of Sosnowiec aims at the
reduction of dust and gas pollution emission into the atmosphere from individual heat
sources.
The Val Sangone Valley
The lack of territorial integrated plans is also due to a series of administrative changes suffered
by the Val Sangone Valley in the last years. The original Mountain Community with 6
municipalities of the valley was merged in a larger Community with adjacent Susa Valley; then
at the beginning of 2013 this administrative entity was cancelled for coming back to a simple
Union of the valley municipalities. Despite of these changes, the Mountain Communities were
active in developing projects, services and activities in the renewable energy field.
Some studies and plans partially or totally developed in the last years are:
Health plan for the Val Sangone Valley
Energy plan of the former the Val Sangone Valley Mountain Community (only draft).
4.1.11 Completed studies regarding the problematic of air pollution in the study areas
Velenje
Biomonitoring of the forest ecosystem in the area of influence of the ŠTPP (1991-2008)
The impact of tropospheric ozone in urban and rural areas of the Šalek Valley (2000 -
2008)
Human exposure to air pollutants in the Šalek Valley (2008-2011)
Biomonitoring of air quality in the vicinity of roads and possible measures to reduce its
negative impact on human health (2011)
Sosnowiec
Researches on the issue of air pollution and its influence on the health of the citizens are
conducted for the area of the city of Sosnowiec. The works are conducted by the Chair of
Climatology of the Silesian University and the Institute of Occupational Medicine and
Environmental Health (IOMEH).
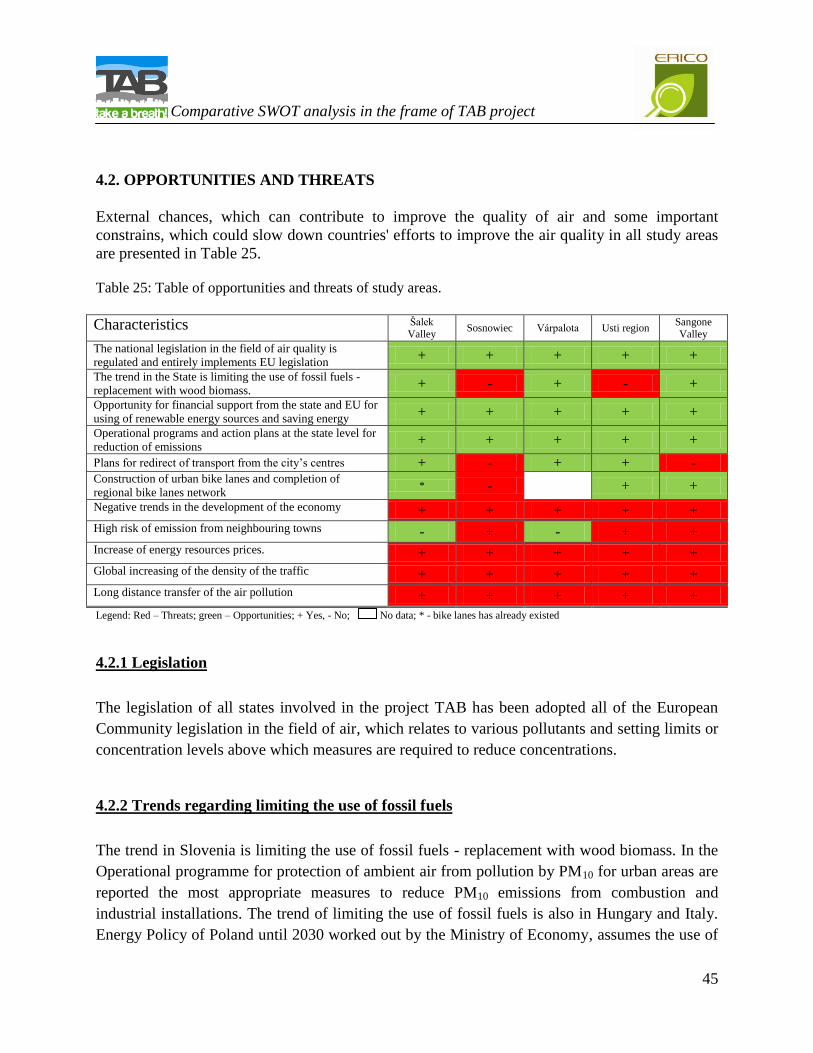
.
. Comparative SWOT analysis in the frame of TAB project
45
4.2. OPPORTUNITIES AND THREATS
External chances, which can contribute to improve the quality of air and some important
constrains, which could slow down countries' efforts to improve the air quality in all study areas
are presented in Table 25.
Table 25: Table of opportunities and threats of study areas.
Characteristics Šalek Valley
Sosnowiec Várpalota Usti region Sangone Valley
The national legislation in the field of air quality is
regulated and entirely implements EU legislation + + + + +
The trend in the State is limiting the use of fossil fuels -
replacement with wood biomass. + - + - +
Opportunity for financial support from the state and EU for
using of renewable energy sources and saving energy + + + + +
Operational programs and action plans at the state level for
reduction of emissions + + + + +
Plans for redirect of transport from the city’s centres + - + + - Construction of urban bike lanes and completion of
regional bike lanes network * - + +
Negative trends in the development of the economy + + + + +
High risk of emission from neighbouring towns - + - + +
Increase of energy resources prices. + + + + +
Global increasing of the density of the traffic + + + + +
Long distance transfer of the air pollution + + + + +
Legend: Red – Threats; green – Opportunities; + Yes, - No; No data; * - bike lanes has already existed
4.2.1 Legislation
The legislation of all states involved in the project TAB has been adopted all of the European
Community legislation in the field of air, which relates to various pollutants and setting limits or
concentration levels above which measures are required to reduce concentrations.
4.2.2 Trends regarding limiting the use of fossil fuels
The trend in Slovenia is limiting the use of fossil fuels - replacement with wood biomass. In the
Operational programme for protection of ambient air from pollution by PM10 for urban areas are
reported the most appropriate measures to reduce PM10 emissions from combustion and
industrial installations. The trend of limiting the use of fossil fuels is also in Hungary and Italy.
Energy Policy of Poland until 2030 worked out by the Ministry of Economy, assumes the use of
.
. Comparative SWOT analysis in the frame of TAB project
46
carbon as the main fuel for heavy current engineering in order to guarantee a suitable level of the
country's energy safety.
4.2.3 High risk of emission from neighbouring towns
High risk of emission from neighbouring towns exists in Sosnowiec, Usti region and the Val
Sangone Valley. The area of the city of Sosnowiec is exposed to the affluence of polluted air
masses from neighbouring cities, i.e. Dąbrowa Górnicza, Jaworzno and Będzin. These cities are
highly industrialized centres emitting significant amounts of pollution. The particular
morphology of the Piedmont plain, in which the greater part of the population lives, surrounded
by mountains to the north, west and south, facilitates the accumulation of pollutants coming from
the east at the openings created by the routes of the river Po and its two main tributaries Ticino
and Tanaro, on the border with Lombardy and Emilia-Romagna. The protection of the Alpine
barrier from the northwest prevents the Atlantic air flows to generate constant winds that may
mitigate or reverse the flow of air from east and the rest of the Po Valley.
4.2.4 Opportunity for financial support from the state and EU for using of renewable
energy sources
There is opportunity for all involved states to use European funds in the new programming
period 2014-20. The new EU perspective assumes the implementation of programs which will
subsidize, among others, projects in the scope of environmental protection - energy efficiency in
buildings, renewable energy sources, supporting the transition to low-emission energy in all
sectors; promotion of energy efficiency and the use of renewable energy in small and medium
enterprises, supporting energy efficiency and the use of renewable energy in public infrastructure,
supporting actions for the quality of urban environment, including regeneration of post-industrial
areas, and the reduction of air pollution.
ECO Fund Slovenian Environmental Public Fund is the largest financial institution intended to
encourage environmental investments in the Republic of Slovenia. The Fund encourages the
development of environmental protection by providing credit or guarantees for environmental
investments and other forms of assistance. The Fund encourages investments that are consistent
with the National Environmental Action Plan and the environmental policy of the EU.
In 2011, the City Council in Sosnowiec passed a resolution on the principles and the procedure
of granting and accounting for designated subsidy from the funds of the budget of the city of
.
. Comparative SWOT analysis in the frame of TAB project
47
Sosnowiec for, among others, the modernization of heating system in residential buildings or
separate residential buildings. The subsidy is granted in the case of connecting to the heating
network and in the case of the purchasing of biomass, gas or oil oven. The citizens may also
apply for a reimbursement of the incurred costs of the purchase of solid fuel-fired retort ovens.
In Usti Region they have opportunity to use national financial resources for the program “Green
Light to Energy Savings”. The "Green Light to Energy Savings" is grant program, which is
financed from national financial resources devoted to the promotion of energy saving. Applicants
for a grant may be private sector, state administration and self-government.
Recently Piedmont region provided funds for initiating environmental investments such as: low-
energy buildings, increase use of renewable energy in the private sector, improving energy
efficiency of the public buildings and valorisation of thermic energy from biomass energy plants.
At the national level, many years has been active an incineration program, which provides funds
for improving the energy efficiency of single flats or buildings (replacement of obsolete boilers.
better insulation. etc.). The program gives the opportunity of reimbursement up to the 55% of the
total cost through tax deduction.
4.2.5 Operational programs and action plans at the state level for reduction of emissions
Slovenia
Operational program for reduction emissions into the air from large combustion plants
Operational programme for protection of ambient air from pollution by PM10
Czech Republic
National strategic plans aimed at emission reduction from industries, transport and other
air pollution sources (new National Emission Reduction Plan of the Czech Republic)
New regional air quality improvement plan
Poland
Energy Policy of Poland until 2030
Air protection program for the zones of the Silesian Voivodeship, where supra-normal
levels of substances in the air were found
Italy
“Regional plan for the rehabilitation and protection of air quality” is an operational
program for protection of ambient air from pollution including guidelines for the
.
. Comparative SWOT analysis in the frame of TAB project
48
preparation, adoption and implementation of programs of measures to improve air quality
in the different polluted zones and agglomerations.
“TAPE, Turin Action Plan for Energy” is developed in the framework of the Convenant
of Major. This action plans aiming at improving air quality and spreading modern heating
systems based on co-generation.
4.2.6 Plans for redirect of transport from the city’s centres
The town Velenje is about 15 km away from highway. Construction of highway will connect the
Šalek Valley with other developed regions in Slovenia and thus enable higher economic
development of the region and also contribute to lower number of vehicles driving daily through
the valley. In Usti Region completion of the D8 motorway leading from the capital Prague to
Dresden (Germany) will significantly alleviate the impact of transport on Usti Region, which
today are going through a major transport corridors especially with heavy truck traffic.
4.2.7 Negative trends in the economy and limiting financial sources at EU and state level
Fewer resources from the state budget and continuation of economic crisis could lead to the loss
of free of charge urban transport, to poorer health care, less investment in education and
awareness of the population and into environmental projects. All of this could lead to poorer
quality of life and therefore greater vulnerability of populations on polluted air. Currently, the
economic crisis is a factor that inhibits the process of the improvement of natural environment.
Due to the lack of economic stability, entrepreneurs reluctantly invest in undertakings connected
with environmental protection. The budgets for national and EU repair programs and for research
and development projects are also being decreased.
4.2.8 Increase of energy resources prices
Increase of energy resources prices could lead to usage of improper fuels. The long-term
prognosis regarding fuel prices for Poland assumes that prices of hard coal will remain on
constant level, contrary to the prices of natural gas, which will systematically rise until 2030.
Such prognoses may negatively influence the condition of air in the analyzed area, since hard
coal will remain the least expensive, and at the same time, the most often used fuel.
.
. Comparative SWOT analysis in the frame of TAB project
49
5 CONCLUSIONS
On the basis of review of SWOT analysis and comparison amongst five study areas (The Šalek
Valley, the Val Sangone Valley, Várpalota, Sosnowiec and Usti Region) the following
conclusion can be made:
1. The legislation of all states involved in the project TAB has been adopted all of the European
Community legislation in the field of air, which relates to various pollutants and setting limits or
concentration levels above which measures are required to reduce concentrations.
2. Monitoring of air quality, environmental data bases and permanent access of inhabitants to the
information are established at the majority of the study areas (cities/regions within TAB project).
3. The daily concentration of NOx and SO2 occasionally exceeded limit values in Sosnowiec,
Várpalota and Usti region, but average annual values were in general under the limit values. The
concentrations of dust particles (PM10) are increased occasionally at all study areas. Exceeded
allowed number of 35 days of 24-hour concentration 50 µg/m3, occurred in the period 2006-
2010 at all regions, except in Velenje. The important factor for retention of pollutants within
the studied areas is unfavourable geographical and geomorphological structure.
4. The main sources of air pollutants are industry, traffic and residential heating. Industrial
devices are (in general) not problematic, since the large industrial facilities present in studied
areas use the best available technologies. But the high number of large industrial devices with
high emissions of pollutants at relatively small area could be problematic. The traffic and
residential heating remains the main problem at the majority of studied areas and
contribute significantly to emissions of NOx, which are precursors for ozone and PM10 in
the air.
5. At some regions (Sosnowiec, Usti region, the Val Sangone Valley), there are lack of use of
proper fuels (municipal waste as well) for residential heating. Satisfied constructed system of
remote heating supply, which provides hot water and heating to residential buildings as
well as to the business, administrative and industrial buildings is available only in the Šalek
Valley. In Várpalota distant heating system is also available in certain districts but needs some
improvements.
6. Roads with heavy traffic are in the settlements of all studied regions. The increase trend
of traffic is recognized in all regions, except in Usti Region. Public transport is quite efficient
in the Šalek Valley, Sosnowiec, Usti region and the Val Sangone Valley but needs some
improvements. Bike lanes already exist only in the Šalek Valley and Várpalota. A possibility to
use electrical vehicles exists only in Velenje and Sosnowiec – but usage of pillars for charging
electric vehicles has not been on satisfactory level.
.
. Comparative SWOT analysis in the frame of TAB project
50
7. The health care system is well organized at all studied regions, but populations are getting
older and vulnerability of population is increasing.
8. Reducing the emissions from traffic and residential heating system will be the most
important issues within actions plans as well. However, every city/region has his own specific
modification of these problems; consequently, the partner’s actions plans for reducing the
negative impact of air pollution (mostly dust particles) increase will be specific and unique.
9. The following external chances, which can contribute to improve the quality of air in all
studied areas are: the trend in the studied states to limit the use of fossil fuels, opportunity for
financial support from the states and EU for using of renewable energy sources and saving
energy and operational programs and action plans at the state’s level for reduction of emissions.
10. There are some important constrains, which could slow down countries' efforts to improve
the air quality: negative trends in the development of the economy, high risk of emission from
neighbouring towns and long distance transfer of the air pollution, increase of energy resources
prices and global increasing of the density of the traffic.
.
. Comparative SWOT analysis in the frame of TAB project
51
6 SUMMARY
The Comparative SWOT analysis, which is prepared on the basis of partners’ SWOT analyses
for the Šalek Valley (Slovenia), Sosnowiec (Poland), Várpalota (Hungary), Usti Region (Czech
Republic) and the Val Sangone Valley (Italy)) define common fields of actions helping to
prepare detailed plans of pilot actions, joint strategy for AAPs and to be fed into knowledge base
built by CEUHEP. The Comparative SWOT analysis in its first part presents sources of air
pollutants, imission concentrations of air pollutants and health data for study areas in the period
2006-2010. In the second part strengths, weaknesses, opportunities and threats for each study
area were presented and comparison amongst areas was made. The studied areas differed in their
surfaces from 77.26 km2 (Várpalota) to 5,335 km
2 (Usti Region). Therefore the level of emission
cannot be comparable. The imission daily concentration of NOx and SO2 occasionally exceeded
limit values in Sosnowiec, Várpalota and Usti region, but average annual values were in general
under the limit values. Average yearly 24-hour PM10 concentrations exceeded limit value 40
ug/m3 at some study areas but trend was in general decreasing. However, allowed number of 35
days of 24-hour concentration 50 µg/m3 occurred at all regions, except in Velenje. The important
factor for retention of pollutants within the studied areas is unfavourable geographical and
geomorphological structure.
The most important findings within comparative SWOT analysis are: (a)
The legislation of all states involved in the project TAB has been adopted all of the European
Community legislation in the field of air, which relates to various pollutants and setting limits or
concentration levels above which measures are required to reduce concentrations. Monitoring of
air quality, environmental data bases and permanent access of inhabitants to the information are
established at the majority of the study areas (cities/regions within TAB project). (b) The main
sources of air pollutants are industry, traffic and residential heating. Industrial devices are (in
general) not problematic, since the large industrial facilities present in studied areas use the best
available technologies. But the high number of large industrial devices with high emissions of
pollutants at relatively small area could be problematic. The traffic and residential heating
remains the main problem at the majority of studied areas and contribute significantly to
emissions of NOx, which are precursors for ozone and PM10 in the air. (c) At some regions
(Sosnowiec, Usti region, the Val Sangone Valley), there are lack of use of proper fuels
(municipal waste as well) for residential heating. Satisfied constructed system of remote heating
supply, which provides hot water and heating to residential buildings as well as to the business,
administrative and industrial buildings is available in the Šalek Valley. In Várpalota distant
heating system is available in certain districts. (d) Roads with heavy traffic are in the settlements
of all studied regions. The increase trend of traffic is recognized in all regions, except in Usti
.
. Comparative SWOT analysis in the frame of TAB project
52
Region. Public transport is quite efficient in the Šalek Valley, Sosnowiec, Usti region and the
Val Sangone Valley but needs some improvements. Bike lanes already exist only in Velenje and
Várpalota. A possibility to use electrical vehicles exists only in Velenje and Sosnowiec – but
usage of pillars for charging electric vehicles has not been on satisfactory level. (e) The health
care system is well organized at all studied regions, but populations are getting older and
vulnerability of population is increasing. (f) External chances to improve the quality of air in the
all studied areas presented: the trend in the studied states to limit the use of fossil fuels,
opportunity for financial support from the states and EU for using of renewable energy sources
and saving energy and operational programs and action plans at the state’s level for reduction of
emissions. (g) There are some important constrains, which could slow down countries' efforts to
improve the air quality: negative trends in the development of the economy, high risk of
emission from neighbouring towns and long distance transfer of the air pollution, increase of
energy resources prices and global increasing of the density of the traffic.
On the basis of comparative SWOT analysis it is evident that reducing of the emissions
from traffic and residential heating system will be the most important issues within actions
plans as well. However, every city/region has his own specific modification of these
problems; consequently, the partner’s actions plans for reducing the negative impact of air
pollution (mostly dust particles) increase will be specific and unique.
.
. Comparative SWOT analysis in the frame of TAB project
53
7 REFERENCES
Al Sayegh Petkovšek S., Mazej Grudnik Z., Orešnik K., Jelenko I.,
Iršič A. 2012. Vulnerability assessment of the Šalek Valley.
Al Sayegh Petkovšek S., Mazej Grudnik Z., Orešnik K., 2013. SWOT analysis for the Šalek
Valley in the frame of TAB project
Balińska I., Rejman Burzyńska A., Kowalska G., Jędrysik E., Krzemień J. 2013. SWOT analysis
for the city of Sosnowiec within the framework of the TAB project.
Giannetti F., Tagliaferro F., 2012. Vulnerability assessment of the city Giaveno District.
Ferencsik I., Páldy A., Pándics T. 2012. City of Várpalota. Vulnerability Assessment “Take a
Breath!”
Kotzó S., Ferencsik I. 2013. City of Várpalota SWOT analysis “Take a Breath!”- 3CE356P3.
Lehká A., Michálková E., Peřina T., Rychlíková E. 2012. Impacts of air pollution on human
health: vulnerability – adaptability Usti Region, Czech Republic.
Lehká A., Peřina Tomáš and stakeholders 2013. SWOT analysis for the Usti region in the frame
of TAB project.
Páldy A., Pándics T., Bobvos J., Szalkai M., Fazekas B., Rudnai P. 2013. Transnational baseline
and monitoring with stakeholder involvement (WP3): Comparative vulnerability
assessment. Meeting of the project group. National Institute of Environmental Health,
Budapest, 20-21 March, Usti nad Labem.
Giannetti F., Petrella F., Tagliaferro F. 2013. SWOT analysis for the Val Sangone Valley in the
frame of TAB project.