Comparative Study Using Scanning Electron Microscopy … · Comparative Study Using Scanning...
10
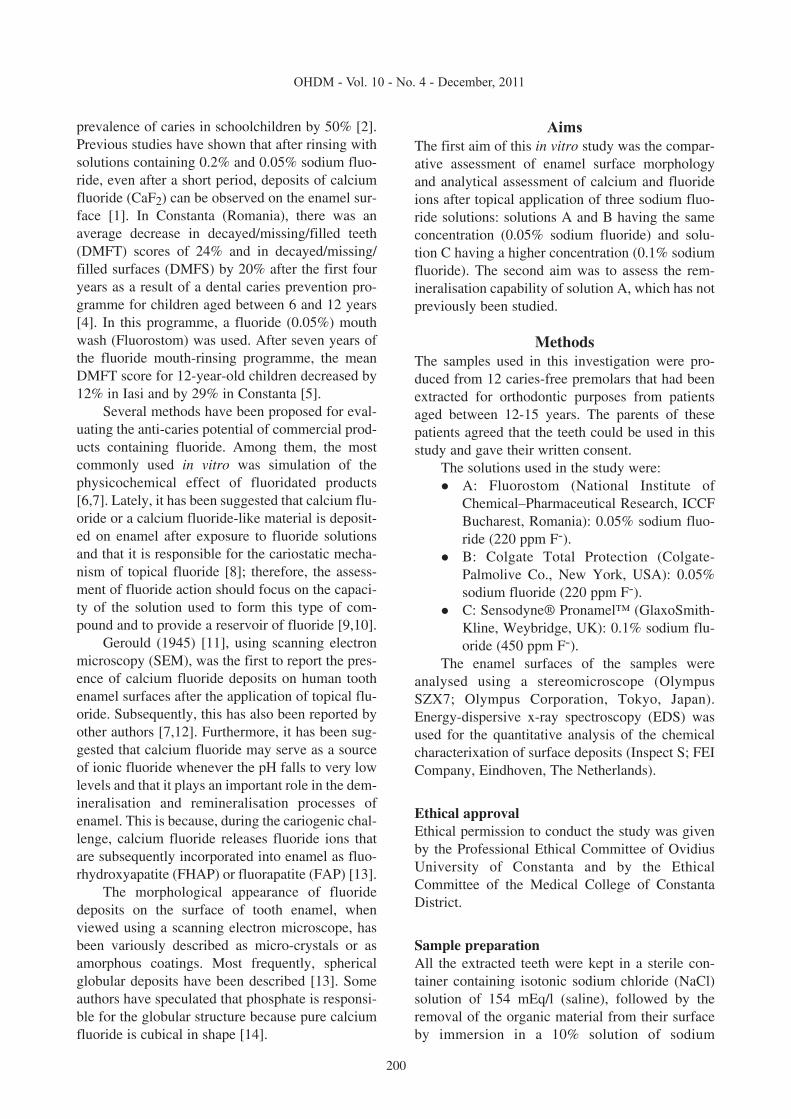
199 Introduction The use of fluoridated mouth rinses has achieved a significant level of popularity among the public due to health care programmes, particularly those involving school-age children. Topical applications of fluoride-containing products have demonstrated effectiveness in pre- venting and controlling dental caries [1,2]. A better post-eruptive effect and anti-caries effectiveness is obtained through frequent applications of low con- centrations of fluoride [1]. The use of fluoridated mouth rinses were and are recommended by the World Health Organization as alternative mecha- nism for caries prevention and as a treatment method to encourage remineralisation, which has an impact on public health [3]. Fluoride concentra- tion in these solutions (mouth rinses) varies between 0.2% and 0.5% ionic fluoride (F - ), depending on the recommendation for a daily or weekly use [3]. After five years of studies, Ripa et al. (1983) concluded that the weekly use of mouth rinses with a neutral 0.2% sodium fluoride solution reduced the Comparative Study Using Scanning Electron Microscopy and Energy Dispersive X-Ray Spectroscopy to Assess Morphological Modifications to the Enamel Surface Produced by Three Sodium Fluoride Solutions Cristina S. Nicolae 1 , Corneliu I. Amariei 2 1 D.M.D., Ph.D.-Student and Assistant Professor, Department of Paedodontics, Faculty of Dental Medicine, Ovidius University, Constanta, Romania. 2 Ph.D., D.M.D. Professor, Department of Oral Health and Dental Management, Faculty of Dental Medicine, Ovidius University, Constanta, Romania. Abstract Aims: The first aim of this in vitro study was the comparative assessment of enamel surface morphology and analytical assessment of calcium and fluoride ions after topical application of three sodium fluoride solutions: solutions A and B having the same concentration (0.05% sodium fluoride) and solution C having a higher concentration (0.1% sodium flu- oride). The second aim was to assess the remineralisation capability of solution A, which has not previously been stud- ied. Methods: Twelve sound premolars, extracted for orthodontic purposes from patients aged between 12-15 years, were used. Demineralisation areas were created by etching with 37% phosphoric acid gel for 60 seconds. Enamel sec- tions were immersed in 100 ml of three solutions, twice daily for 30 days: solution A—Fluorostom (0.05% sodium flu- oride), solution B—Colgate Total Protection (0.05% sodium fluoride), and solution C—Sensodyne ProNamel (0.1% sodium fluoride). Surface examination was performed using a scanning electron microscope. The calcium and fluoride concentrations in the enamel surfaces were assessed using energy-dispersive X-ray spectroscopy. Results: Mean rem- ineralisation depths were: 5.73 μm [95% CI, 2.4-12 μm] for A, 5.63 μm [95% CI 2.5-12.7 μm] for B, and 8.28 μm [95% CI 2.91-15.54 μm] for C. There were significant differences between A versus C (P=0.0006) and B versus C (P=0.003) but no significant differences between A versus B (P=0.83). Morphological appearance of fluoride as globular precipi- tates was revealed in all treated specimens, regardless of ionic fluoride (F - ) content. The distribution of the deposits was more homogeneous and smaller in groups treated with higher fluoride concentrations and larger in groups treated with lower fluoride concentrations. The energy-dispersive x-ray spectroscopy revealed that the intensity of signals for calci- um and fluoride varied significantly across the three groups (P=0.0001). Conclusions: In the teeth studied, the reminer- alisation depths depended on the fluoride concentration of the solutions. Globular structures of amorphous calcium flu- oride precipitates, which act as a fluoride reservoir, were observed on the enamel surface after the action of all solutions. The differences between solutions A and B were not statistically significant. Key Words: Sodium Fluoride Solution, Enamel, Scanning Electron Microscopy (SEM), Energy-Dispersive X-Ray Spectroscopy (EDS) Corresponding author: Assistant Professor Cristina S. Nicolae, Department of Paedodontics, Faculty of Dental Medicine, Ovidius University, 7 Ilarie Voronca Street, Constanta, 900684, Romania; e-mail: [email protected]
-
Upload
vuongnguyet -
Category
Documents
-
view
231 -
download
0
Transcript of Comparative Study Using Scanning Electron Microscopy … · Comparative Study Using Scanning...
199
IntroductionThe use of fluoridated mouth rinses has achieved asignificant level of popularity among the public dueto health care programmes, particularly thoseinvolving school-age children.
Topical applications of fluoride-containingproducts have demonstrated effectiveness in pre-venting and controlling dental caries [1,2]. A betterpost-eruptive effect and anti-caries effectiveness isobtained through frequent applications of low con-centrations of fluoride [1]. The use of fluoridated
mouth rinses were and are recommended by theWorld Health Organization as alternative mecha-nism for caries prevention and as a treatmentmethod to encourage remineralisation, which hasan impact on public health [3]. Fluoride concentra-tion in these solutions (mouth rinses) variesbetween 0.2% and 0.5% ionic fluoride (F-),depending on the recommendation for a daily orweekly use [3].
After five years of studies, Ripa et al. (1983)concluded that the weekly use of mouth rinses witha neutral 0.2% sodium fluoride solution reduced the
Comparative Study Using Scanning Electron Microscopy and EnergyDispersive X-Ray Spectroscopy to Assess Morphological Modificationsto the Enamel Surface Produced by Three Sodium Fluoride Solutions
Cristina S. Nicolae1, Corneliu I. Amariei2
1 D.M.D., Ph.D.-Student and Assistant Professor, Department of Paedodontics, Faculty of Dental Medicine, Ovidius University,Constanta, Romania. 2 Ph.D., D.M.D. Professor, Department of Oral Health and Dental Management, Faculty of Dental Medicine,Ovidius University, Constanta, Romania.
AbstractAims: The first aim of this in vitro study was the comparative assessment of enamel surface morphology and analyticalassessment of calcium and fluoride ions after topical application of three sodium fluoride solutions: solutions A and Bhaving the same concentration (0.05% sodium fluoride) and solution C having a higher concentration (0.1% sodium flu-oride). The second aim was to assess the remineralisation capability of solution A, which has not previously been stud-ied. Methods: Twelve sound premolars, extracted for orthodontic purposes from patients aged between 12-15 years,were used. Demineralisation areas were created by etching with 37% phosphoric acid gel for 60 seconds. Enamel sec-tions were immersed in 100 ml of three solutions, twice daily for 30 days: solution A—Fluorostom (0.05% sodium flu-oride), solution B—Colgate Total Protection (0.05% sodium fluoride), and solution C—Sensodyne ProNamel (0.1%sodium fluoride). Surface examination was performed using a scanning electron microscope. The calcium and fluorideconcentrations in the enamel surfaces were assessed using energy-dispersive X-ray spectroscopy. Results: Mean rem-ineralisation depths were: 5.73 µm [95% CI, 2.4-12 µm] for A, 5.63 µm [95% CI 2.5-12.7 µm] for B, and 8.28 µm [95%CI 2.91-15.54 µm] for C. There were significant differences between A versus C (P=0.0006) and B versus C (P=0.003)but no significant differences between A versus B (P=0.83). Morphological appearance of fluoride as globular precipi-tates was revealed in all treated specimens, regardless of ionic fluoride (F-) content. The distribution of the deposits wasmore homogeneous and smaller in groups treated with higher fluoride concentrations and larger in groups treated withlower fluoride concentrations. The energy-dispersive x-ray spectroscopy revealed that the intensity of signals for calci-um and fluoride varied significantly across the three groups (P=0.0001). Conclusions: In the teeth studied, the reminer-alisation depths depended on the fluoride concentration of the solutions. Globular structures of amorphous calcium flu-oride precipitates, which act as a fluoride reservoir, were observed on the enamel surface after the action of all solutions.The differences between solutions A and B were not statistically significant.
Key Words: Sodium Fluoride Solution, Enamel, Scanning Electron Microscopy (SEM), Energy-Dispersive X-RaySpectroscopy (EDS)
Corresponding author: Assistant Professor Cristina S. Nicolae, Department of Paedodontics, Faculty of Dental Medicine,Ovidius University, 7 Ilarie Voronca Street, Constanta, 900684, Romania; e-mail: [email protected]
200
OHDM - Vol. 10 - No. 4 - December, 2011
prevalence of caries in schoolchildren by 50% [2].Previous studies have shown that after rinsing withsolutions containing 0.2% and 0.05% sodium fluo-ride, even after a short period, deposits of calciumfluoride (CaF2) can be observed on the enamel sur-face [1]. In Constanta (Romania), there was anaverage decrease in decayed/missing/filled teeth(DMFT) scores of 24% and in decayed/missing/filled surfaces (DMFS) by 20% after the first fouryears as a result of a dental caries prevention pro-gramme for children aged between 6 and 12 years[4]. In this programme, a fluoride (0.05%) mouthwash (Fluorostom) was used. After seven years ofthe fluoride mouth-rinsing programme, the meanDMFT score for 12-year-old children decreased by12% in Iasi and by 29% in Constanta [5].
Several methods have been proposed for eval-uating the anti-caries potential of commercial prod-ucts containing fluoride. Among them, the mostcommonly used in vitro was simulation of thephysicochemical effect of fluoridated products[6,7]. Lately, it has been suggested that calcium flu-oride or a calcium fluoride-like material is deposit-ed on enamel after exposure to fluoride solutionsand that it is responsible for the cariostatic mecha-nism of topical fluoride [8]; therefore, the assess-ment of fluoride action should focus on the capaci-ty of the solution used to form this type of com-pound and to provide a reservoir of fluoride [9,10].
Gerould (1945) [11], using scanning electronmicroscopy (SEM), was the first to report the pres-ence of calcium fluoride deposits on human toothenamel surfaces after the application of topical flu-oride. Subsequently, this has also been reported byother authors [7,12]. Furthermore, it has been sug-gested that calcium fluoride may serve as a sourceof ionic fluoride whenever the pH falls to very lowlevels and that it plays an important role in the dem-ineralisation and remineralisation processes ofenamel. This is because, during the cariogenic chal-lenge, calcium fluoride releases fluoride ions thatare subsequently incorporated into enamel as fluo-rhydroxyapatite (FHAP) or fluorapatite (FAP) [13].
The morphological appearance of fluoridedeposits on the surface of tooth enamel, whenviewed using a scanning electron microscope, hasbeen variously described as micro-crystals or asamorphous coatings. Most frequently, sphericalglobular deposits have been described [13]. Someauthors have speculated that phosphate is responsi-ble for the globular structure because pure calciumfluoride is cubical in shape [14].
AimsThe first aim of this in vitro study was the compar-ative assessment of enamel surface morphologyand analytical assessment of calcium and fluorideions after topical application of three sodium fluo-ride solutions: solutions A and B having the sameconcentration (0.05% sodium fluoride) and solu-tion C having a higher concentration (0.1% sodiumfluoride). The second aim was to assess the rem-ineralisation capability of solution A, which has notpreviously been studied.
MethodsThe samples used in this investigation were pro-duced from 12 caries-free premolars that had beenextracted for orthodontic purposes from patientsaged between 12-15 years. The parents of thesepatients agreed that the teeth could be used in thisstudy and gave their written consent.
The solutions used in the study were:A: Fluorostom (National Institute ofChemical–Pharmaceutical Research, ICCFBucharest, Romania): 0.05% sodium fluo-ride (220 ppm F-).B: Colgate Total Protection (Colgate-Palmolive Co., New York, USA): 0.05%sodium fluoride (220 ppm F-).C: Sensodyne® Pronamel™ (GlaxoSmith-Kline, Weybridge, UK): 0.1% sodium flu-oride (450 ppm F-).
The enamel surfaces of the samples wereanalysed using a stereomicroscope (OlympusSZX7; Olympus Corporation, Tokyo, Japan).Energy-dispersive x-ray spectroscopy (EDS) wasused for the quantitative analysis of the chemicalcharacterixation of surface deposits (Inspect S; FEICompany, Eindhoven, The Netherlands).
Ethical approvalEthical permission to conduct the study was givenby the Professional Ethical Committee of OvidiusUniversity of Constanta and by the EthicalCommittee of the Medical College of ConstantaDistrict.
Sample preparationAll the extracted teeth were kept in a sterile con-tainer containing isotonic sodium chloride (NaCl)solution of 154 mEq/l (saline), followed by theremoval of the organic material from their surfaceby immersion in a 10% solution of sodium
201
OHDM - Vol. 10 - No. 4 - December, 2011
hypochlorite (NaOCl). Then, they were brushed for60 seconds with a brush on a dental handpieceusing an abrasive, fluoride-free, prophylaxis paste(Clean Polish; KerrHawe, Bioggio, Switzerland)and water.
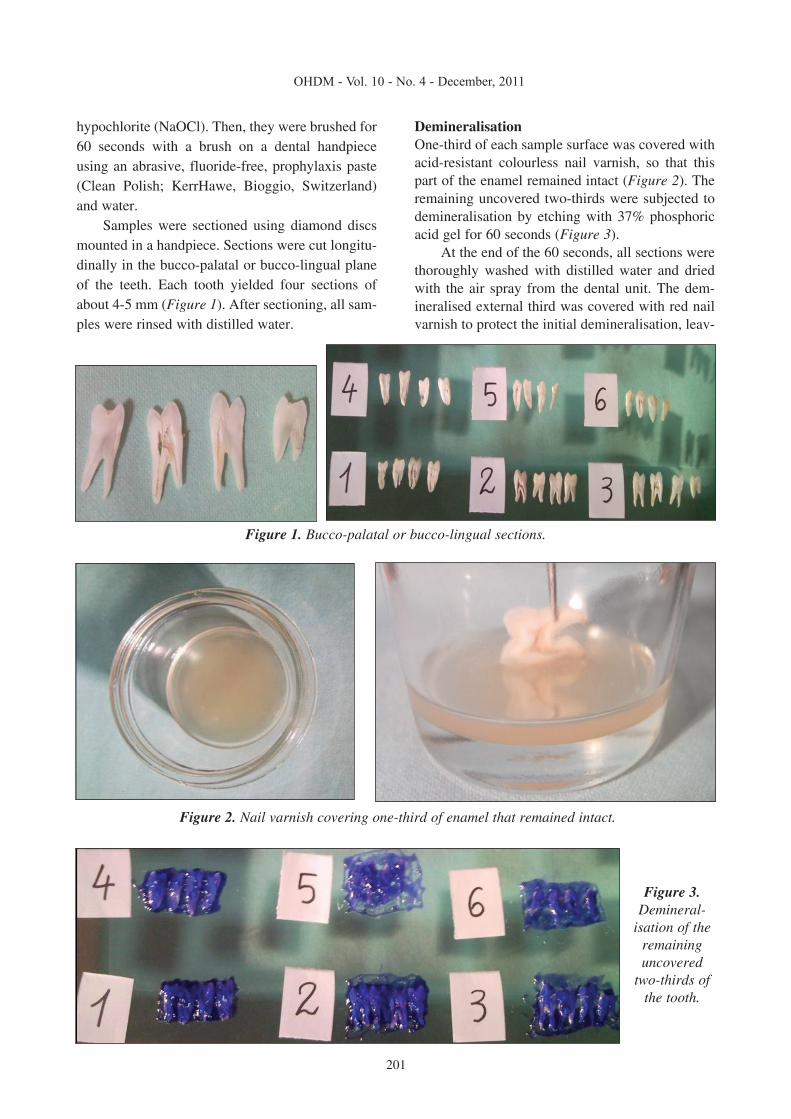
Samples were sectioned using diamond discsmounted in a handpiece. Sections were cut longitu-dinally in the bucco-palatal or bucco-lingual planeof the teeth. Each tooth yielded four sections ofabout 4-5 mm (Figure 1). After sectioning, all sam-ples were rinsed with distilled water.
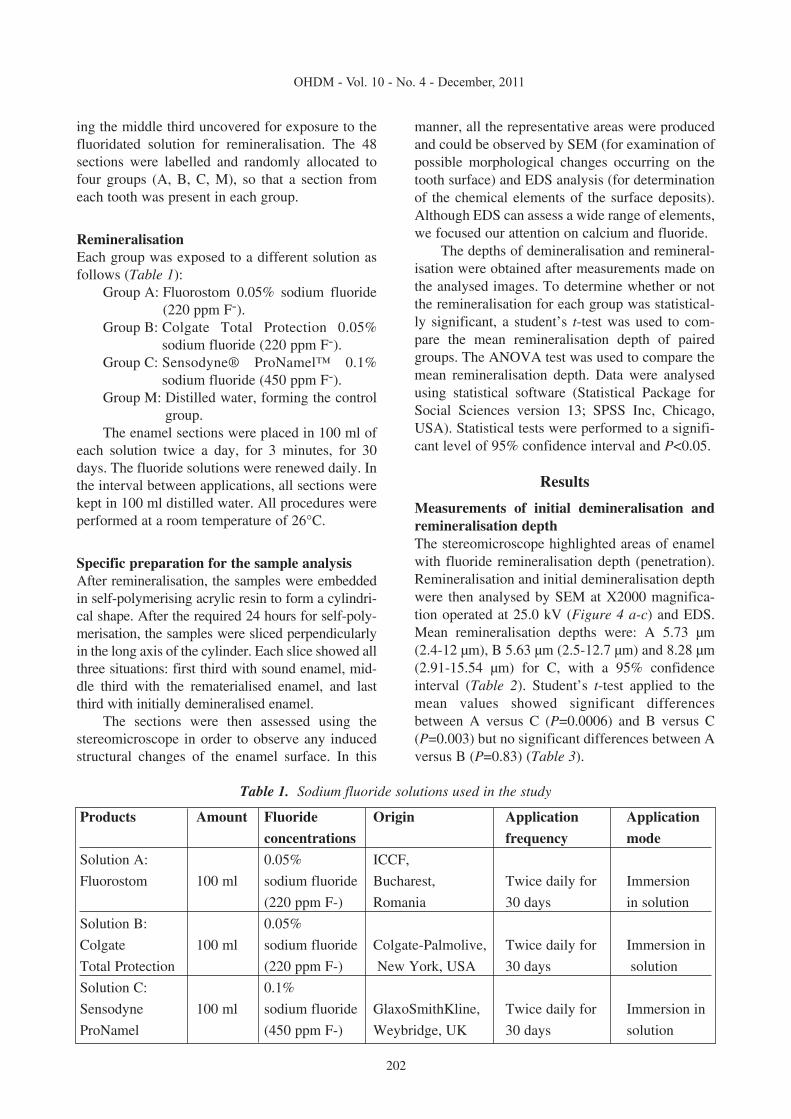
DemineralisationOne-third of each sample surface was covered withacid-resistant colourless nail varnish, so that thispart of the enamel remained intact (Figure 2). Theremaining uncovered two-thirds were subjected todemineralisation by etching with 37% phosphoricacid gel for 60 seconds (Figure 3).
At the end of the 60 seconds, all sections werethoroughly washed with distilled water and driedwith the air spray from the dental unit. The dem-ineralised external third was covered with red nailvarnish to protect the initial demineralisation, leav-
Figure 1. Bucco-palatal or bucco-lingual sections.
Figure 3.Demineral-
isation of theremaininguncovered
two-thirds ofthe tooth.
Figure 2. Nail varnish covering one-third of enamel that remained intact.
ing the middle third uncovered for exposure to thefluoridated solution for remineralisation. The 48sections were labelled and randomly allocated tofour groups (A, B, C, M), so that a section fromeach tooth was present in each group.
RemineralisationEach group was exposed to a different solution asfollows (Table 1):
Group A: Fluorostom 0.05% sodium fluoride(220 ppm F-).
Group B: Colgate Total Protection 0.05%sodium fluoride (220 ppm F-).
Group C: Sensodyne® ProNamel™ 0.1%sodium fluoride (450 ppm F-).
Group M: Distilled water, forming the controlgroup.
The enamel sections were placed in 100 ml ofeach solution twice a day, for 3 minutes, for 30days. The fluoride solutions were renewed daily. Inthe interval between applications, all sections werekept in 100 ml distilled water. All procedures wereperformed at a room temperature of 26°C.
Specific preparation for the sample analysisAfter remineralisation, the samples were embeddedin self-polymerising acrylic resin to form a cylindri-cal shape. After the required 24 hours for self-poly-merisation, the samples were sliced perpendicularlyin the long axis of the cylinder. Each slice showed allthree situations: first third with sound enamel, mid-dle third with the rematerialised enamel, and lastthird with initially demineralised enamel.
The sections were then assessed using thestereomicroscope in order to observe any inducedstructural changes of the enamel surface. In this
manner, all the representative areas were producedand could be observed by SEM (for examination ofpossible morphological changes occurring on thetooth surface) and EDS analysis (for determinationof the chemical elements of the surface deposits).Although EDS can assess a wide range of elements,we focused our attention on calcium and fluoride.
The depths of demineralisation and remineral-isation were obtained after measurements made onthe analysed images. To determine whether or notthe remineralisation for each group was statistical-ly significant, a student’s t-test was used to com-pare the mean remineralisation depth of pairedgroups. The ANOVA test was used to compare themean remineralisation depth. Data were analysedusing statistical software (Statistical Package forSocial Sciences version 13; SPSS Inc, Chicago,USA). Statistical tests were performed to a signifi-cant level of 95% confidence interval and P<0.05.
Results
Measurements of initial demineralisation andremineralisation depthThe stereomicroscope highlighted areas of enamelwith fluoride remineralisation depth (penetration).Remineralisation and initial demineralisation depthwere then analysed by SEM at X2000 magnifica-tion operated at 25.0 kV (Figure 4 a-c) and EDS.Mean remineralisation depths were: A 5.73 µm(2.4-12 µm), B 5.63 µm (2.5-12.7 µm) and 8.28 µm(2.91-15.54 µm) for C, with a 95% confidenceinterval (Table 2). Student’s t-test applied to themean values showed significant differencesbetween A versus C (P=0.0006) and B versus C(P=0.003) but no significant differences between Aversus B (P=0.83) (Table 3).
202
OHDM - Vol. 10 - No. 4 - December, 2011
Products Amount Fluoride Origin Application Application
concentrations frequency mode
Solution A: 0.05% ICCF,
Fluorostom 100 ml sodium fluoride Bucharest, Twice daily for Immersion
(220 ppm F-) Romania 30 days in solution
Solution B: 0.05%
Colgate 100 ml sodium fluoride Colgate-Palmolive, Twice daily for Immersion in
Total Protection (220 ppm F-) New York, USA 30 days solution
Solution C: 0.1%
Sensodyne 100 ml sodium fluoride GlaxoSmithKline, Twice daily for Immersion in
ProNamel (450 ppm F-) Weybridge, UK 30 days solution
Table 1. Sodium fluoride solutions used in the study
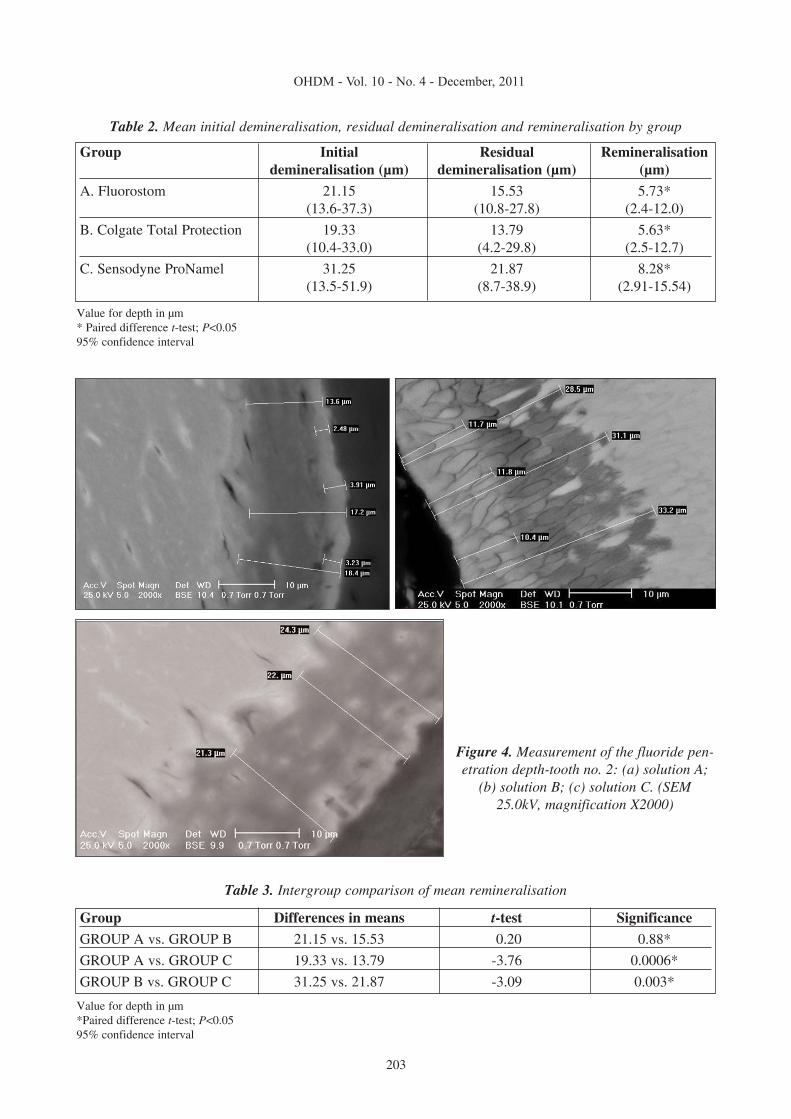
Table 3. Intergroup comparison of mean remineralisation
203
OHDM - Vol. 10 - No. 4 - December, 2011
Group Initial Residual Remineralisationdemineralisation (µm) demineralisation (µm) (µm)
A. Fluorostom 21.15 15.53 5.73*(13.6-37.3) (10.8-27.8) (2.4-12.0)
B. Colgate Total Protection 19.33 13.79 5.63* (10.4-33.0) (4.2-29.8) (2.5-12.7)
C. Sensodyne ProNamel 31.25 21.87 8.28*(13.5-51.9) (8.7-38.9) (2.91-15.54)
Table 2. Mean initial demineralisation, residual demineralisation and remineralisation by group
Value for depth in µm * Paired difference t-test; P<0.05 95% confidence interval
Group Differences in means t-test Significance
GROUP A vs. GROUP B 21.15 vs. 15.53 0.20 0.88*
GROUP A vs. GROUP C 19.33 vs. 13.79 -3.76 0.0006*
GROUP B vs. GROUP C 31.25 vs. 21.87 -3.09 0.003*
Value for depth in µm*Paired difference t-test; P<0.0595% confidence interval
Figure 4. Measurement of the fluoride pen-etration depth-tooth no. 2: (a) solution A;
(b) solution B; (c) solution C. (SEM25.0kV, magnification X2000)
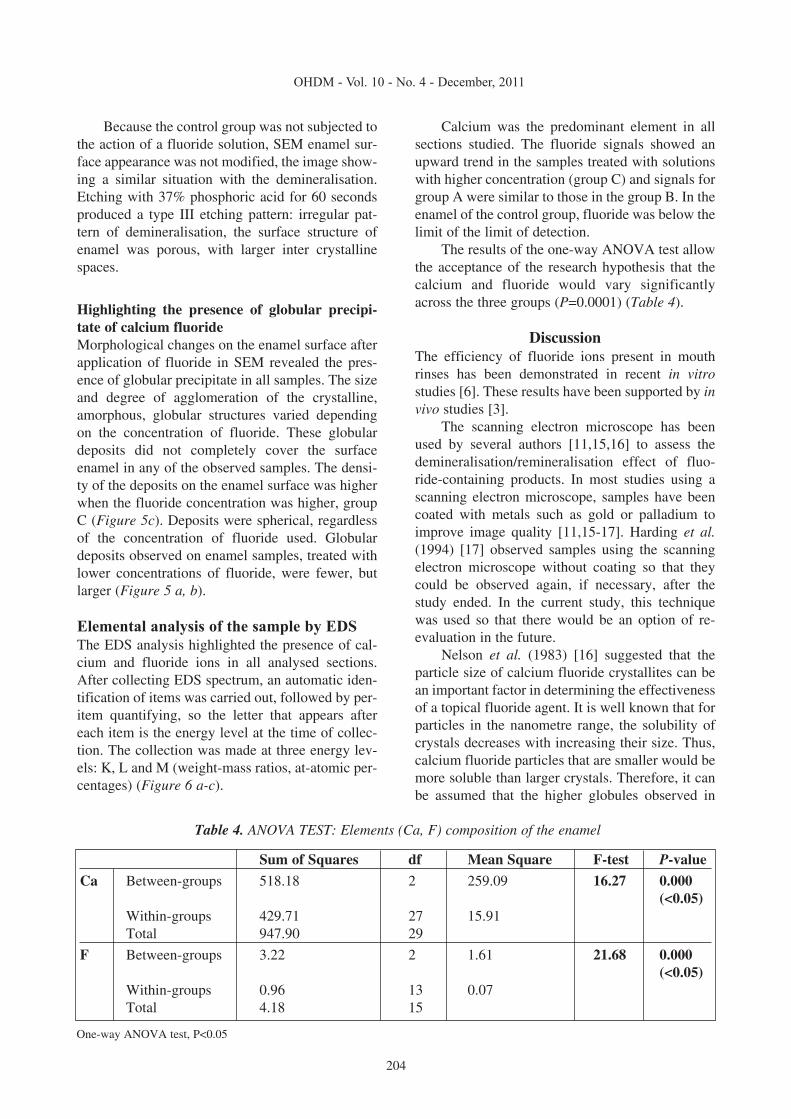
Because the control group was not subjected tothe action of a fluoride solution, SEM enamel sur-face appearance was not modified, the image show-ing a similar situation with the demineralisation.Etching with 37% phosphoric acid for 60 secondsproduced a type III etching pattern: irregular pat-tern of demineralisation, the surface structure ofenamel was porous, with larger inter crystallinespaces.
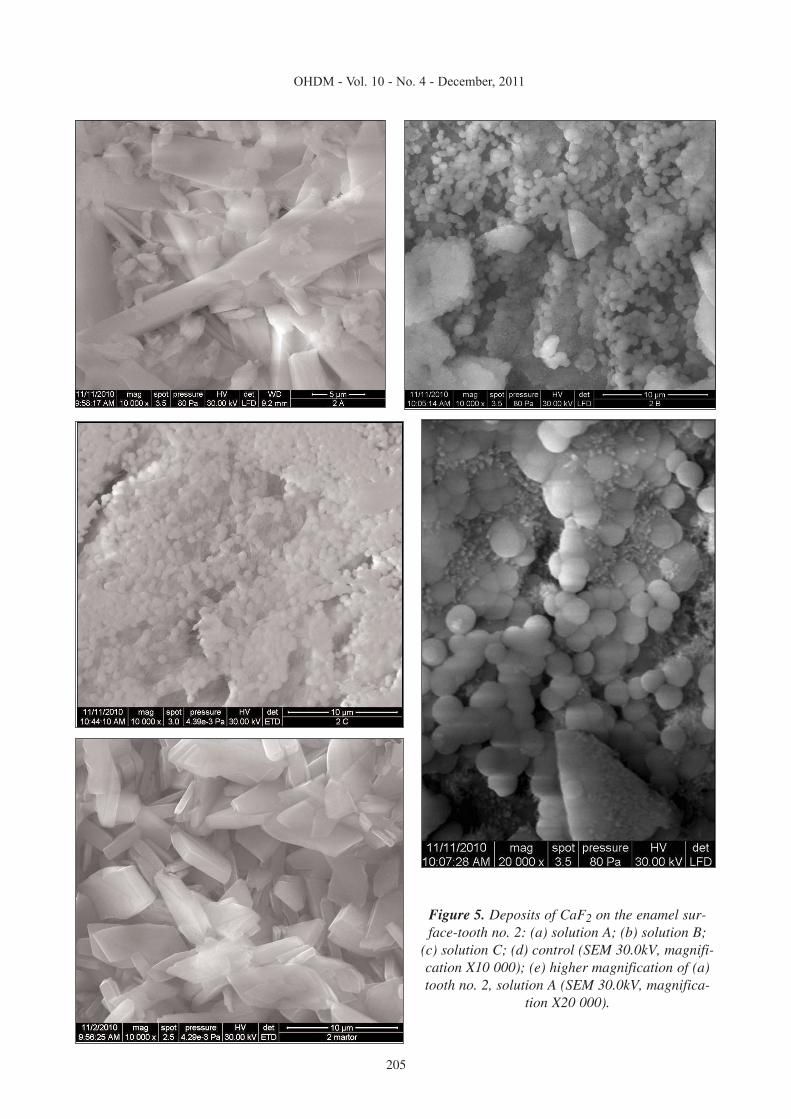
Highlighting the presence of globular precipi-tate of calcium fluorideMorphological changes on the enamel surface afterapplication of fluoride in SEM revealed the pres-ence of globular precipitate in all samples. The sizeand degree of agglomeration of the crystalline,amorphous, globular structures varied dependingon the concentration of fluoride. These globulardeposits did not completely cover the surfaceenamel in any of the observed samples. The densi-ty of the deposits on the enamel surface was higherwhen the fluoride concentration was higher, groupC (Figure 5c). Deposits were spherical, regardlessof the concentration of fluoride used. Globulardeposits observed on enamel samples, treated withlower concentrations of fluoride, were fewer, butlarger (Figure 5 a, b).
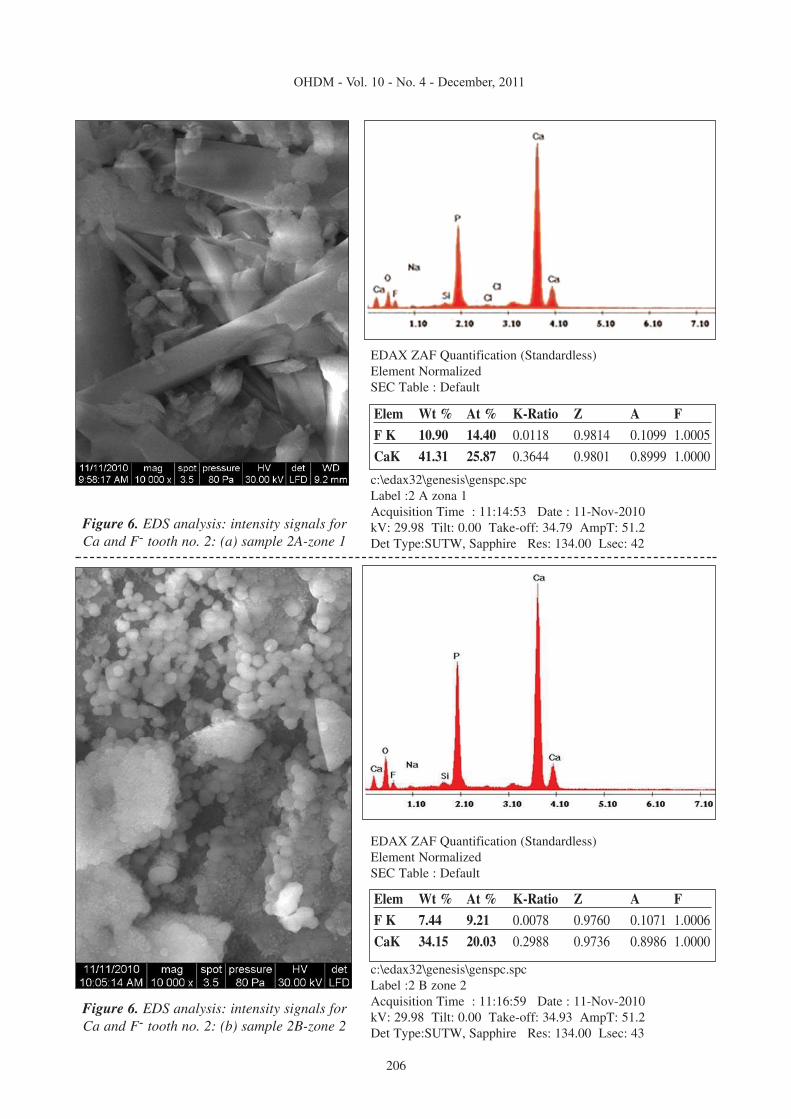
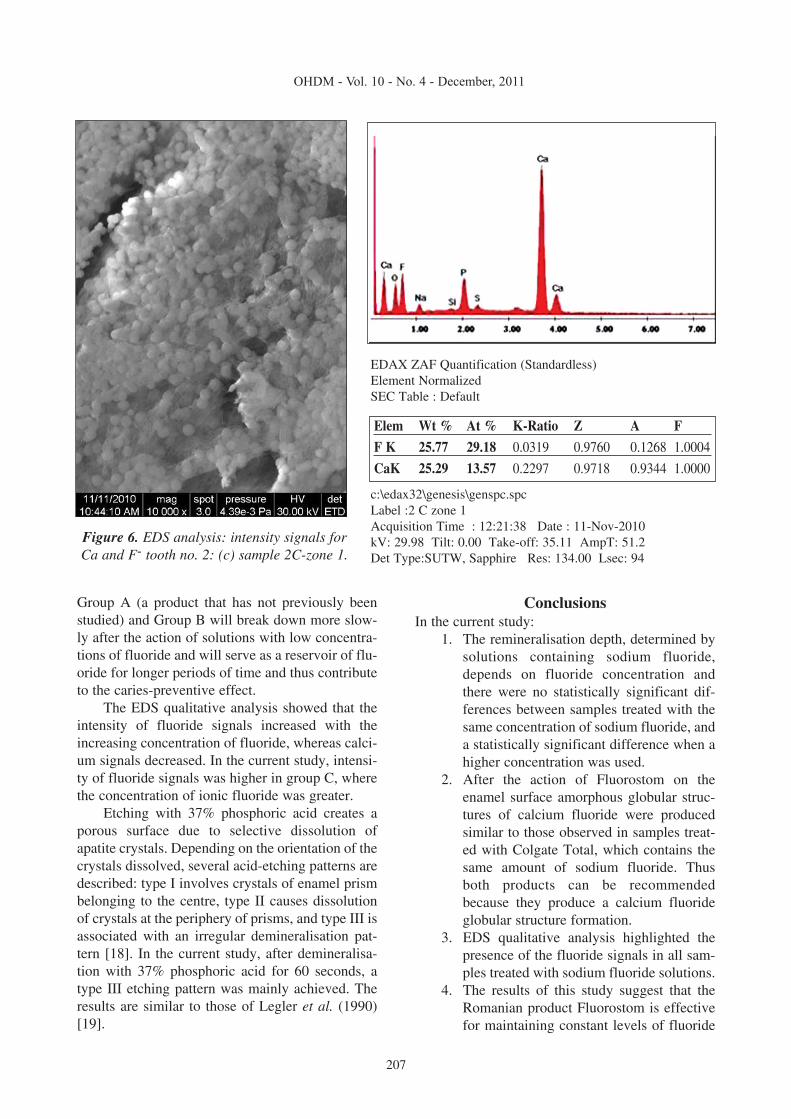
Elemental analysis of the sample by EDSThe EDS analysis highlighted the presence of cal-cium and fluoride ions in all analysed sections.After collecting EDS spectrum, an automatic iden-tification of items was carried out, followed by per-item quantifying, so the letter that appears aftereach item is the energy level at the time of collec-tion. The collection was made at three energy lev-els: K, L and M (weight-mass ratios, at-atomic per-centages) (Figure 6 a-c).
Calcium was the predominant element in allsections studied. The fluoride signals showed anupward trend in the samples treated with solutionswith higher concentration (group C) and signals forgroup A were similar to those in the group B. In theenamel of the control group, fluoride was below thelimit of the limit of detection.
The results of the one-way ANOVA test allowthe acceptance of the research hypothesis that thecalcium and fluoride would vary significantlyacross the three groups (P=0.0001) (Table 4).
DiscussionThe efficiency of fluoride ions present in mouthrinses has been demonstrated in recent in vitrostudies [6]. These results have been supported by invivo studies [3].
The scanning electron microscope has beenused by several authors [11,15,16] to assess thedemineralisation/remineralisation effect of fluo-ride-containing products. In most studies using ascanning electron microscope, samples have beencoated with metals such as gold or palladium toimprove image quality [11,15-17]. Harding et al.(1994) [17] observed samples using the scanningelectron microscope without coating so that theycould be observed again, if necessary, after thestudy ended. In the current study, this techniquewas used so that there would be an option of re-evaluation in the future.
Nelson et al. (1983) [16] suggested that theparticle size of calcium fluoride crystallites can bean important factor in determining the effectivenessof a topical fluoride agent. It is well known that forparticles in the nanometre range, the solubility ofcrystals decreases with increasing their size. Thus,calcium fluoride particles that are smaller would bemore soluble than larger crystals. Therefore, it canbe assumed that the higher globules observed in
204
OHDM - Vol. 10 - No. 4 - December, 2011
Sum of Squares df Mean Square F-test P-value
Ca Between-groups 518.18 2 259.09 16.27 0.000(<0.05)
Within-groups 429.71 27 15.91Total 947.90 29
F Between-groups 3.22 2 1.61 21.68 0.000(<0.05)
Within-groups 0.96 13 0.07Total 4.18 15
Table 4. ANOVA TEST: Elements (Ca, F) composition of the enamel
One-way ANOVA test, P<0.05
205
OHDM - Vol. 10 - No. 4 - December, 2011
Figure 5. Deposits of CaF2 on the enamel sur-face-tooth no. 2: (a) solution A; (b) solution B;
(c) solution C; (d) control (SEM 30.0kV, magnifi-cation X10 000); (e) higher magnification of (a)tooth no. 2, solution A (SEM 30.0kV, magnifica-
tion X20 000).
206
OHDM - Vol. 10 - No. 4 - December, 2011
EDAX ZAF Quantification (Standardless)Element NormalizedSEC Table : Default
c:\edax32\genesis\genspc.spcLabel :2 A zona 1Acquisition Time : 11:14:53 Date : 11-Nov-2010kV: 29.98 Tilt: 0.00 Take-off: 34.79 AmpT: 51.2Det Type:SUTW, Sapphire Res: 134.00 Lsec: 42
Elem Wt % At % K-Ratio Z A F
F K 10.90 14.40 0.0118 0.9814 0.1099 1.0005
CaK 41.31 25.87 0.3644 0.9801 0.8999 1.0000
EDAX ZAF Quantification (Standardless)Element NormalizedSEC Table : Default
c:\edax32\genesis\genspc.spcLabel :2 B zone 2Acquisition Time : 11:16:59 Date : 11-Nov-2010kV: 29.98 Tilt: 0.00 Take-off: 34.93 AmpT: 51.2Det Type:SUTW, Sapphire Res: 134.00 Lsec: 43
Elem Wt % At % K-Ratio Z A F
F K 7.44 9.21 0.0078 0.9760 0.1071 1.0006
CaK 34.15 20.03 0.2988 0.9736 0.8986 1.0000
Figure 6. EDS analysis: intensity signals forCa and F- tooth no. 2: (b) sample 2B-zone 2
Figure 6. EDS analysis: intensity signals forCa and F- tooth no. 2: (a) sample 2A-zone 1
Group A (a product that has not previously beenstudied) and Group B will break down more slow-ly after the action of solutions with low concentra-tions of fluoride and will serve as a reservoir of flu-oride for longer periods of time and thus contributeto the caries-preventive effect.
The EDS qualitative analysis showed that theintensity of fluoride signals increased with theincreasing concentration of fluoride, whereas calci-um signals decreased. In the current study, intensi-ty of fluoride signals was higher in group C, wherethe concentration of ionic fluoride was greater.
Etching with 37% phosphoric acid creates aporous surface due to selective dissolution ofapatite crystals. Depending on the orientation of thecrystals dissolved, several acid-etching patterns aredescribed: type I involves crystals of enamel prismbelonging to the centre, type II causes dissolutionof crystals at the periphery of prisms, and type III isassociated with an irregular demineralisation pat-tern [18]. In the current study, after demineralisa-tion with 37% phosphoric acid for 60 seconds, atype III etching pattern was mainly achieved. Theresults are similar to those of Legler et al. (1990)[19].
ConclusionsIn the current study:
1. The remineralisation depth, determined bysolutions containing sodium fluoride,depends on fluoride concentration andthere were no statistically significant dif-ferences between samples treated with thesame concentration of sodium fluoride, anda statistically significant difference when ahigher concentration was used.
2. After the action of Fluorostom on theenamel surface amorphous globular struc-tures of calcium fluoride were producedsimilar to those observed in samples treat-ed with Colgate Total, which contains thesame amount of sodium fluoride. Thusboth products can be recommendedbecause they produce a calcium fluorideglobular structure formation.
3. EDS qualitative analysis highlighted thepresence of the fluoride signals in all sam-ples treated with sodium fluoride solutions.
4. The results of this study suggest that theRomanian product Fluorostom is effectivefor maintaining constant levels of fluoride
207
OHDM - Vol. 10 - No. 4 - December, 2011
EDAX ZAF Quantification (Standardless)Element NormalizedSEC Table : Default
c:\edax32\genesis\genspc.spcLabel :2 C zone 1Acquisition Time : 12:21:38 Date : 11-Nov-2010kV: 29.98 Tilt: 0.00 Take-off: 35.11 AmpT: 51.2Det Type:SUTW, Sapphire Res: 134.00 Lsec: 94
Elem Wt % At % K-Ratio Z A F
F K 25.77 29.18 0.0319 0.9760 0.1268 1.0004
CaK 25.29 13.57 0.2297 0.9718 0.9344 1.0000
Figure 6. EDS analysis: intensity signals forCa and F- tooth no. 2: (c) sample 2C-zone 1.
in the enamel surface and has beneficialeffects on reducing the solubility and pro-moting the remineralisation of enamel.Unsurprisingly, as it contains the sameconcentration of sodium fluoride, the rem-ineralisation potential of Fluorostom wasthe same as that produced by ColgateTotal.
FundingTo accomplish this study, no external funds wereused. This study part of the Ph.D. project of the firstauthor.
Contributions of each author• CSN planned the conceptual model for the
study and its design, analysed the results,drafted and redrafted the paper, andapproved the final version.
• CIA planned and supervised the study, crit-ically reviewed its drafts, and approved thefinal version.
Statement of conflict of interestsAs far as the authors are aware, there are no con-flicts of interest.
208
OHDM - Vol. 10 - No. 4 - December, 2011
References1. Rølla G, Øgaard B, Cruz RA. Topical application of
fluorides on teeth. New concepts of mechanisms of interaction.Journal of Clinical Periodontology 1993; 20: 105-108.
2. Ripa LW, Leske GS, Sposato AL, Rebich Jr T.Supervised weekly rinsing with a 0.2% neutral NaF solution.Results after five years. Community Dentistry and OralEpidemiology 1983; 11: 1-6.
3. Navarro M, Monte Alto LA, Cruz RA, Prazeres J.Calcium fluoride uptake by human enamel after use of fluori-dated mouth rinses. Brazilian Dental Journal 2001; 12: 178-182.
4. Nuca C, Amariei C, Petcu L, Rosu DL. Study regard-ing the DMFT/S. deft/s and SiC caries indices in 6 and 12years-old children from Constanta city. Oral Health andDental Management in the Black Sea Countries 2007; VI(3):43-50.
5. Danila I, Amariei C, Nuca C, Bobu L. The RomanianNational Programme for Caries Prevention: The experience ofIasi and Constanta centres, Romania, 2000-2007. Oral Healthand Dental Management in the Black Sea Countries 2010; IX:88-97.
6. Takagi S, Liao H, Chow LC. Effect of a low-fluoride-content, two component rinse on fluoride uptake and on de–andremineralization of enamel lesions: an in vitro study. CariesResearch 2001; 35: 223-228.
7. White DJ. The comparative sensitivity of intra-oral, invitro, and animal models in the ‘profile’ evaluation of topicalfluorides. Journal of Dental Research 1992; 22: 27-36.
8. Chow LC, Takagi S, Frukhtbeyn S, Sieck BA, ParryEE, Liao NS, et al. Remineralization effect of a low-concentra-tion fluoride rinse in an intraoral model. Caries Research 2002;36: 136-141.
9. Chow LC, Takagi S, Carey CM. Sieck BA.Remineralization effects of a two-solution fluoride mouthrinse: an in situ study. Journal of Dental Research 2000; 79:991-995.
10. Raven SJ, Schäfer F, Duckworth RM, Gilbert RJ, ParrTA. Comparison between evaluation methods for the anticaries
efficacy of monofluorophosphate-containing dentifrices.Caries Research 1991; 25: 130-137.
11. Gerould CH. Electron microscope study of the mech-anism of a fluorine deposition in teeth. Journal of DentalResearch 1945; 24: 223-233.
12. Benediktsson S, Retief DH, Bradley EL, Switzer P.The effect of contact time of acidulated phosphate fluoride con-centration in human enamel. Archives of Oral Biology 1982;27: 567-572.
13. Saxegaard E, Rølla G. Kinetics of acquisition and lossof calcium fluoride by enamel in vivo. Caries Research 1989;23: 406-411.
14. Christoffersen J, Christoffersen M R, Kibalczyc W,Perdok WG. Kinetics of dissolution and growth of calcium flu-oride and effects of phosphate. Acta OdontologicaScandinavica 1988; 46: 325-336.
15. Duschner H, Götz H, Ogaard B. Fluoride-inducedprecipitates on enamel surface and subsurface areas 208visual-ized by electron microscopy and confocal laser scanningmicroscopy. European Journal of Oral Science 1997; 105:466-472.
16. Nelson DGA, Jongebloed WL, Arends J. Morphologyof enamel surfaces treated with topical fluoride agents: SEMConsiderations. Journal of Dental Research 1983; 62: 1201.
17. Harding AM, Zero DT, Featherstone JD, McCormackSM, Shields CP, Proskin HM. Calcium fluoride formation onsound enamel using fluoride solutions with and without lactate.Caries Research 1994; 28: 1-8.
18. Devanna R, Keluskar KM. Crystal growth vs. conven-tional acid etching: A comparative evaluation of etch patterns,penetration depths, and bond strengths. Indian Journal ofDental Research 2008; 19: 309-314.
19. Legler LR, Retief DH, Bradley EL. Effects of phos-phoric acid concentration and etch duration on enamel depth ofetch: An in vitro study. American Journal of Orthodontics andDentofacial Orthopedics 1990; 98: 154-160.