Comparative Study of Mangrove Litter Nitrogen Cycling to The
23
Procedia Environmental Sciences 13 (2012) 340 – 362 1878-0296 © 2011 Published by Elsevier B.V. Selection and/or peer-review under responsibility of School of Environment, Beijing Normal University. doi:10.1016/j.proenv.2012.01.033 Available online at www.sciencedirect.com The 18th Biennial Conference of International Society for Ecological Modelling Comparative study of mangrove litter nitrogen cycling to the adjacent estuary through modelling in pristine and reclaimed islands of Sundarban mangrove ecosystem, India S. Mandal a, b , S. Ray b* , P. B. Ghosh c . a Department of Zoology, T. D. B. College, Raniganj,713347, India. b Ecological Modelling Laboratory, Department of Zoology, Visva-Bharati University Santiniketan 731 235, India. c Institute of Engineering and Management, Y-12, Sector-V, Saltlake City, Kolkata, 700091, India. Abstract Sundarban mangrove ecosystem is consisted of many islands both virgin and reclaimed in nature. A seven compartment model featuring different forms of nitrogen in soil and water is applied on virgin island in order to compare for estimating several parameters with reclaimed island. The physical, chemical factors and other rate parameters are retained same as in reclaimed island model, published before. The study is carried out for over two years, primary and secondary data are used in the model belong to same time scale for both the islands. Loss rate of soil organic nitrogen as humic acid and fulvic acids is very sensitive parameter for both the systems. Model results depict that virgin island is detritus based system governed by leaching and microbial processes. Keywords: Hooghly - Matla estuary; Mangrove; Reclaimed; Saptamukhi; Virgin 1. Introduction Sundarban mangrove ecosystem is one of the fragile and dynamic mangrove systems of the world. Mangroves are characteristic feature of the sand flats, river banks and coastlines of the tropics and subtropics of the world. The community structure of mangrove and their distribution varies with alteration of environmental gradients. The Indian part of Sundarban consists of 102 islands, 70% are partly reclaimed and rest is virgin. In tropical and subtropical coastal regions of the world, mangroves play a vital role in providing habitats for coastal animals and birds as well as in serving as defense against natural calamity as indicated by Alongi [1] and Barbier et al. [2]. Creeks traversing the islands serve * Corresponding author, Tel.: +91 3463 261 268; fax: +91 3463 261 268 / 262 672 E-mail address: [email protected] (Santanu Ray). © 2011 Published by Elsevier B.V. Selection and/or peer-review under responsibility of School of Environment, Beijing Normal University.
description
Study of Mangrove
Transcript of Comparative Study of Mangrove Litter Nitrogen Cycling to The
Procedia Environmental Sciences 13 (2012) 340 – 362
1878-0296 © 2011 Published by Elsevier B.V. Selection and/or peer-review under responsibility of School of Environment, Beijing Normal University.doi:10.1016/j.proenv.2012.01.033
Available online at www.sciencedirect.com
Procedia Environmental
Sciences Procedia Environmental Sciences 8 (2011) 340–362
www.elsevier.com/locate/procedia
The 18th Biennial Conference of International Society for Ecological Modelling
Comparative study of mangrove litter nitrogen cycling to the adjacent estuary through modelling in pristine and reclaimed
islands of Sundarban mangrove ecosystem, India S. Mandala, b, S. Rayb*, P. B. Ghoshc.
aDepartment of Zoology, T. D. B. College, Raniganj,713347, India. bEcological Modelling Laboratory, Department of Zoology, Visva-Bharati University Santiniketan 731 235, India.
cInstitute of Engineering and Management, Y-12, Sector-V, Saltlake City, Kolkata, 700091, India.
Abstract
Sundarban mangrove ecosystem is consisted of many islands both virgin and reclaimed in nature. A seven compartment model featuring different forms of nitrogen in soil and water is applied on virgin island in order to compare for estimating several parameters with reclaimed island. The physical, chemical factors and other rate parameters are retained same as in reclaimed island model, published before. The study is carried out for over two years, primary and secondary data are used in the model belong to same time scale for both the islands. Loss rate of soil organic nitrogen as humic acid and fulvic acids is very sensitive parameter for both the systems. Model results depict that virgin island is detritus based system governed by leaching and microbial processes. © 2011 Published by Elsevier Ltd. Keywords: Hooghly - Matla estuary; Mangrove; Reclaimed; Saptamukhi; Virgin
1. Introduction
Sundarban mangrove ecosystem is one of the fragile and dynamic mangrove systems of the world. Mangroves are characteristic feature of the sand flats, river banks and coastlines of the tropics and subtropics of the world. The community structure of mangrove and their distribution varies with alteration of environmental gradients. The Indian part of Sundarban consists of 102 islands, 70% are partly reclaimed and rest is virgin. In tropical and subtropical coastal regions of the world, mangroves play a vital role in providing habitats for coastal animals and birds as well as in serving as defense against natural calamity as indicated by Alongi [1] and Barbier et al. [2]. Creeks traversing the islands serve
* Corresponding author, Tel.: +91 3463 261 268; fax: +91 3463 261 268 / 262 672 E-mail address: [email protected] (Santanu Ray).
© 2011 Published by Elsevier B.V. Selection and/or peer-review under responsibility of School of Environment, Beijing Normal University.
341S. Mandal et al. / Procedia Environmental Sciences 13 (2012) 340 – 362S. Mandal et al./ Procedia Environmental Sciences 8 (2011) 340–362 341
major conduits for tidal exchange of dissolved and particulate matter between the adjacent mangrove forest and coastal waters. Two islands are selected for comparative study of the impact of mangrove litterfall on nitrogen dynamics of the intertidal zone. Sagar island (reclaimed) is the largest island of Sundarban and is subjected to anthropogenic activities. These perturbations have direct or indirect impacts on mangrove system. As pointed out by Fu et al. [3] and Ramesh [4], growing anthropogenic activities are the driving force of environmental change affecting global hydrological and biogeochemical cycles. Lothian island (virgin) is an undisturbed island covered by dense mangrove forest and criss-crossed by creeks in between. Though the island is occupied by similar mangrove species as in Sagar island but the dynamics of organic and inorganic matter in soil and adjacent creeks are entirely different.
Several comparative studies are done on mangrove ecosystem by many authors [5, 6, 7, 8, 9, 10]. Two adjacent mangrove forests with different freshwater inputs differ in sediment chemistry or community structure due to variations in tidal range and topography as pointed out by Ayukai et al. [11]. Wolff [12] studied energy flow distributions, biomass and productivity in two tropical models of mangrove fringed estuaries in Gulf of Nicoya, at the Pacific shore, Costa Rica and Caete estuary, Brazil and found difference between food web structure in two estuaries. Leguerrier et al. [13] noted similar observations when they compared two intertidal mudflat food webs in Brouage Mudflat and Aiguillon Cove, France.
Kuwae et al. [14] measured dissolved inorganic nitrogen (DIN) flux across sediment-water interface in Banzu intertidal sandflat, Tokyo Bay, Japan and concluded that DIN is recycled within the sediment and microalgae present in the sediment plays an important role in release of DIN from the sediment. Chen and Twilley [15] studied the mangrove forest structure and nitrogen and phosphorus dynamics along Shark River estuary, Florida. They observed that the mangrove species vary along these nutrient gradients from the mouth of the estuary to upper estuary. Kristensen and Suraswadi [16] found that microbial mineralization of nutrient containing organic matter in the creek water and seepage of nutrient rich porewater from creek banks during falling tides are major processes behind nutrient availability in creeks of Bangrong mangrove forest, Thailand.
There are few published work related to mangroves of Sundarban [17, 18, 19, 20, 21, 22, 23]. Mukhopadhyay et al. [20] studied the diurnal variation in carbon dioxide emission in Lothian island but the authors did not comment on the microbial decomposition in soils. The present paper compares the microbial degradation rate between reclaimed and virgin island. Joshi and Ghosh [21] studied the forest structure of Lothian island and concluded that pH and soil salinity determines the distribution of mangrove species in the island. Ray [22] compared the benthic food web structures of Sagar island and Prentice island (another virgin island in Sundarban) through network analysis and found that the ecosystem of disturbed island is highly resilient to perturbations caused by anthropogenic activities. Most of the researches related to Sundarban are restricted to Sagar island and adjoining areas probably due to inaccessibility to other parts of Sundarban and lack of database of these islands. Beside input from river, DIN is mainly contributed by decomposition of mangrove litter fall in these islands.
Since DIN in the creeks is one of the governing component in maintain the grazing food chain and ecological balance of the system therefore, a comparative study between reclaimed and virgin island is needed to understand the dynamics of both the systems. The present account deals with modelling of seven states of nitrogen in soil and water {soil total nitogen (STN), soil organic nitrogen (SON), soil inorganic nitrogen (SIN), total organic nitrogen of water (WTON), particulate organic nitrogen of water (PON), dissloved organic nitrogen of water (DON) and dissolved inorganic nitrogen of water (DIN)}. All possible ecological factors those influence nitrogen dynamics in Sagar island are included in the model of Lothian island. The objectives are: (i) the application of model by Mandal et al. [23] in Lothian island in order to determine various parameters in this system, (ii) comparison of nitrogen dynamics in two systems.
2. Methods
342 S. Mandal et al. / Procedia Environmental Sciences 13 (2012) 340 – 362342 S. Mandal et al./ Procedia Environmental Sciences 8 (2011) 340–362
2.1. Study area
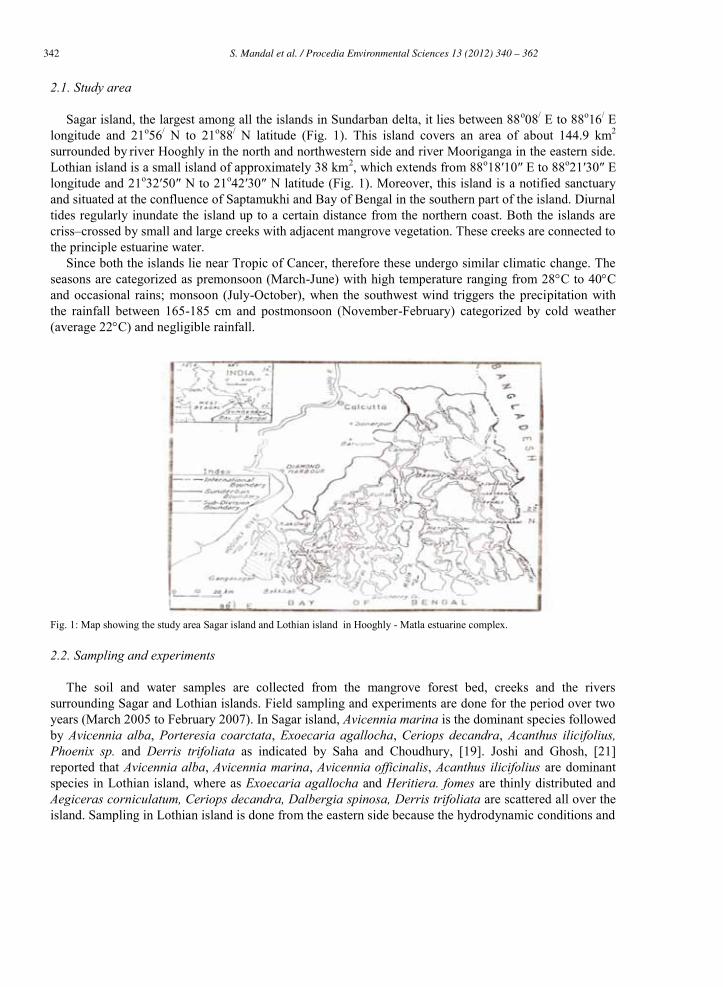
Sagar island, the largest among all the islands in Sundarban delta, it lies between 88o08/ E to 88o16/ E longitude and 21o56/ N to 21o88/ N latitude (Fig. 1). This island covers an area of about 144.9 km2 surrounded by river Hooghly in the north and northwestern side and river Mooriganga in the eastern side. Lothian island is a small island of approximately 38 km2, which extends from 88o18′10″ E to 88o21′30″ E longitude and 21o32′50″ N to 21o42′30″ N latitude (Fig. 1). Moreover, this island is a notified sanctuary and situated at the confluence of Saptamukhi and Bay of Bengal in the southern part of the island. Diurnal tides regularly inundate the island up to a certain distance from the northern coast. Both the islands are criss–crossed by small and large creeks with adjacent mangrove vegetation. These creeks are connected to the principle estuarine water.
Since both the islands lie near Tropic of Cancer, therefore these undergo similar climatic change. The seasons are categorized as premonsoon (March-June) with high temperature ranging from 28C to 40C and occasional rains; monsoon (July-October), when the southwest wind triggers the precipitation with the rainfall between 165-185 cm and postmonsoon (November-February) categorized by cold weather (average 22C) and negligible rainfall.
Fig. 1: Map showing the study area Sagar island and Lothian island in Hooghly - Matla estuarine complex.
2.2. Sampling and experiments
The soil and water samples are collected from the mangrove forest bed, creeks and the rivers surrounding Sagar and Lothian islands. Field sampling and experiments are done for the period over two years (March 2005 to February 2007). In Sagar island, Avicennia marina is the dominant species followed by Avicennia alba, Porteresia coarctata, Exoecaria agallocha, Ceriops decandra, Acanthus ilicifolius, Phoenix sp. and Derris trifoliata as indicated by Saha and Choudhury, [19]. Joshi and Ghosh, [21] reported that Avicennia alba, Avicennia marina, Avicennia officinalis, Acanthus ilicifolius are dominant species in Lothian island, where as Exoecaria agallocha and Heritiera. fomes are thinly distributed and Aegiceras corniculatum, Ceriops decandra, Dalbergia spinosa, Derris trifoliata are scattered all over the island. Sampling in Lothian island is done from the eastern side because the hydrodynamic conditions and
343S. Mandal et al. / Procedia Environmental Sciences 13 (2012) 340 – 362S. Mandal et al./ Procedia Environmental Sciences 8 (2011) 340–362 343
soil properties of western side are similar to Sagar island. Several nets of known dimension ( mm 11 ) are placed in the mangrove forest bed and litter is collected monthly to know the litter biomass ( bL ) per square meter. Litter nitrogen ( nL ) is estimated by standard Kjeldahl digestion followed by spectrophotometer method as described in Greenberg et al. [24]. Lb contributing per kilogram of soil is computed since total nitrogen present in litter directly goes into the soil.
In Sagar and Lothian islands, soil samples of every month are collected from the field stations at the depth of 8–10 in. (approximately) from the mangrove forest bed that is influenced by tidal currents. STN (mg kg−1) is determined by previously mentioned method. SIN (NH4 +, NO2 – and NO3 −) is estimated following methods described by Greenberg et al. [24]. SON is estimated using the difference between STN and SIN. Field data of STN, SON and SIN are used to calculate the conversion rates (Cr1) from STN to SON and (Cr2) from STN to SIN. Monthly data of oxidation–reduction potential (Rp) values of the soils and soil temperature (ST) are collected directly from the field using redox potential electrode and digital thermometer (EUROLAB-ST 9269) respectively.
Water samples are collected from the creeks at 0.5 metre (approx.) depth for chemical analysis. Estimation of NH4
+, NO2- and NO3
-, and DON follows methodology of Soloranzo, [25], Wood et al. [26] and De Medina et al. [27] respectively as these three components represent DIN pool. Water temperature ( TW ), Water pH ( pHW ) and dissolved oxygen ( oD ) are measured directly from the field using digital instrument (EUROLAB-ST 9269), pH meter (LUTRON-pH-206) and modified Winkler’s iodometric method respectively. The uptake rate of DIN by phytoplankton ( urP ) is taken from the previous works of Bhunia [17] and Biswas et al. [28].
2.3. The model
2.3.1. Model description
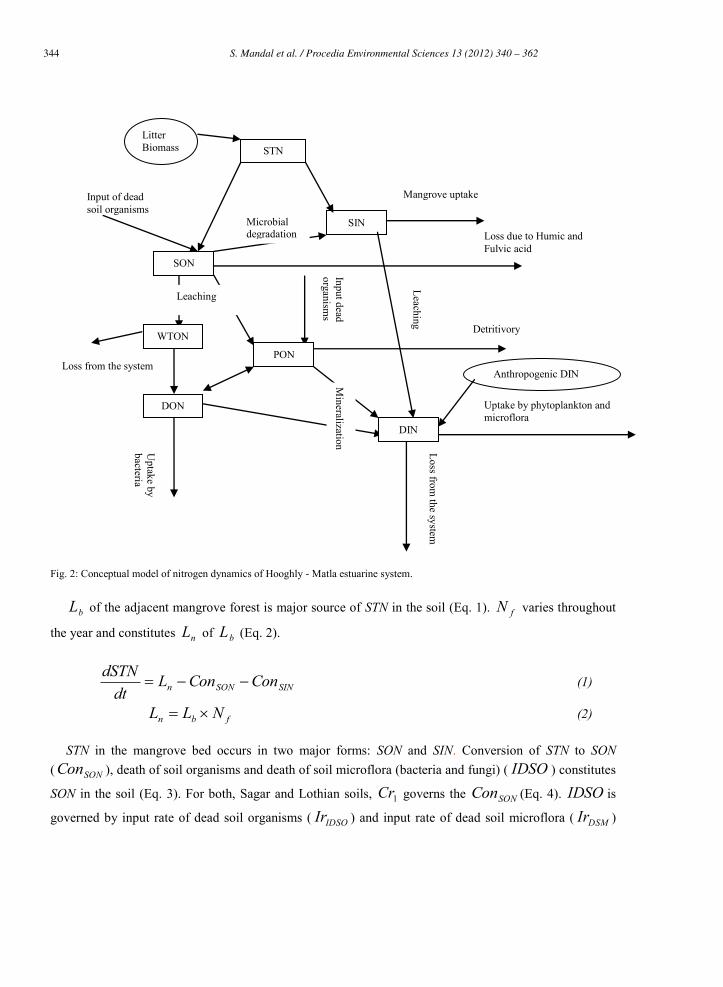
A seven compartment model (Fig. 2) is conceptualized using STELLA 6.0 computer software (High Performance Systems Inc.) and fourth- order Runge – Kutta method with a time step of 1 day is used for its integration. The differential equations (Eq.) used in the model are same as in Mandal et al. [23].
344 S. Mandal et al. / Procedia Environmental Sciences 13 (2012) 340 – 362344 S. Mandal et al./ Procedia Environmental Sciences 8 (2011) 340–362
Fig. 2: Conceptual model of nitrogen dynamics of Hooghly - Matla estuarine system.
bL of the adjacent mangrove forest is major source of STN in the soil (Eq. 1). fN varies throughout
the year and constitutes nL of bL (Eq. 2).
SINSONn ConConLdt
dSTN (1)
fbn NLL (2)
STN in the mangrove bed occurs in two major forms: SON and SIN. Conversion of STN to SON ( SONCon ), death of soil organisms and death of soil microflora (bacteria and fungi) ( IDSO ) constitutes
SON in the soil (Eq. 3). For both, Sagar and Lothian soils, 1Cr governs the SONCon (Eq. 4). IDSO is
governed by input rate of dead soil organisms ( IDSOIr ) and input rate of dead soil microflora ( DSMIr )
STN
SIN
Litter Biomass
Loss due to Humic and Fulvic acid
Microbial degradation
Mineralization
Detritivory
Leaching Leaching
Mangrove uptake
Uptake by
bacteria
Uptake by phytoplankton and microflora
Loss from the system
Input dead organism
s
Input of dead soil organisms
SON
WTON
PON
DON
DIN
Loss from the system Anthropogenic DIN
345S. Mandal et al. / Procedia Environmental Sciences 13 (2012) 340 – 362S. Mandal et al./ Procedia Environmental Sciences 8 (2011) 340–362 345
(Eq. 5). Some part of SON is degraded to SIN ( minSON ). Major portion of SON are changed into humic
acid and fulvic acid ( HAFA ), controlled by loss rate of SON as humic and fulvic acid ( HAFALr ) (Eq. 6) and remaining portion are leached into water as organic form and contribute to the WTON and PON pools.
SPONLeachSON ConHAFASONSONIDSOCondt
dSON min (3)
1CrSTNConSON (4)
DSMIDSO IrIrIDSO (5)
HAFALrSONHAFA (6)
Bergschneider [29] found that the occurrence of SIN in soil is regulated by conversion of STN to SIN ( SINCon ), minSON , loss due to uptake by mangrove ( LM ) and leaching of SIN to estuarine water
( LeachSIN ) (Eq. 7). Rp governs SINCon , therefore Rp dependent 2Cr is incorporated in the present
model (Eq. 8). Stanford et al. [30] found that minSON is a temperature dependent process which is regulated by the microbial degradation rate ( Mdr ) of the soil. A temperature factor for soil mineralization ( 10Q ) and soil temperature ( TS ) based equation (et) is used by Johnsson et al. [31] (Eq. 9
and 10). In this equation, optimal temperature ( TOpt ) is assumed to be 20◦C. Mfilinge et al. [32] advocated that major portion of SIN is utilized by mangrove trees for their growth, therefore loss rate of SIN due to mangrove uptake ( MLr ) is considered as forcing function in the model (Eq. 11). Remaining portion of SIN get leached (washing out of soluble constituents) into the estuarine water and supplements DIN pool.
LeachSIN SINLMSONCondt
dSIN min (7)
2CrSTNConSIN (8)
etMdrSONSON min (9)
OptTSTQet /10 (10)
MLrSINLM (11)
WTON is contributed by leaching of SON (Eq. 12). Leaching of SON to estuarine water ( LeachSON ) is
regulated by leaching rate of SON to WTON ( 1RLch ) (Eq. 13). WTON consists of PON and DON. Some
fraction of WTON moves out from the system ( lossWTON ).which depends on loss rate of WTON from
the system WTONLr (Eq. 14).
lossDONWPONLeach WTONConConSONdt
dWTON (12)
346 S. Mandal et al. / Procedia Environmental Sciences 13 (2012) 340 – 362346 S. Mandal et al./ Procedia Environmental Sciences 8 (2011) 340–362
1RLeach LchSONSON (13)
WTONloss LrWTONWTON (14)
Part of WTON is converted to PON ( WPONCon ) (Eq. 15). WPONCon is monitored by conversion rate
of WTON to WPON ( WPONCr ) (Eq. 16). PON input due to death of aquatic organisms ( PIDAO ) is
regulated by input rates of dead aquatic organisms ( PIDAOIr ) and dead microflora ( PDMIr ) (Eq. 17). PON to the estuarine system is added by invertebrate excretion (PIE) and by soil through washout, tidal inundations and degradation of organic matter from SON ( SPONCon ). SPONCon is regulated by a
conversion rate ( SPONCr ) (Eq. 18). In any aquatic system, mineralization of PON ( minPON ) is
temperature and dissolved oxygen dependent process (Eq. 19), TW and oD based equations that effects
the mineralization rate ( minr ) and affects the mineralization process ( minreN ) is used by Wei-Bing et al.
[33] (Eq. 20). Temperature effect ( Tf ) is a function of TW (Eq. 21). In the present model, oxygen effect
on biochemical reaction ( Dof ) is function of oD , which follows Michaelis-Menten kinetics, where
DoK is half saturation constant for oxygen limitation (Eq. 22). Majority of PON is used up by detritivores
( LD ), so DLr is incorporated as loss rate due to detritivory in the present model (Eq. 23). A small
fraction of PON moves out of the system ( PONLr ) and a portion of the same settles down ( setPON ),
both the processes are governed by loss rate of PON from the system ( PONLr ) and settling rate of PON
( PONSr ) respectively (Eq. 24 and 25). PIE is regulated by the input rate of invertebrate excretion ( IEIr ) (Eq. 26).
losssetSPONWPON PONPONPONLDConPIDAOCondt
dPON min
PIE (15) WPONWPON CrWTONCon (16)
PDMPIDAO IrIrPIDAO (17)
SPONSPON CrSONCon (18)
minmin reNPONPON (19)
DoTre ffrN minmin (20)
)20( TT WKT ef (21)
Doo
oDo KD
Df
(22)
DLrPONLD (23)
PONset SrPONPON (24)
347S. Mandal et al. / Procedia Environmental Sciences 13 (2012) 340 – 362S. Mandal et al./ Procedia Environmental Sciences 8 (2011) 340–362 347
PONloss LrPONPON (25)
IEIrPIE (26)
The concentration of DON in the system is maintained by DON input due to death of aquatic organisms and microflora ( DIDAO ), a portion of WTON ( DONCon ), degradation of DON to DIN
( degDON ), loss of DON from the system ( lossDON ) and utilization of DON by bacteria (Eq. 27).
DONCon is regulated by conversion rate of WTON to DON ( DONCr ) (Eq. 28). DIDAO is governed by
input rate of dead aquatic organism ( DIDAOIr ) and dead microflora ( DMIr ) (Eq. 29). Jorgensen and
Bendoricchio [34] found that degDON depends on hydrolysis (h) which is function of pHW and
minreN . Wei-Bing et al. [33] represented minreN as function of TW and oD in their model (Eq. 30).
Variation of loss rate of DON ( DONLr ) and bacterial utilization rate ( bacU ) are responsible for
lossDON from the system. (Eq. 31).
degDONDONDIDAOCondt
dDONlossDON (27)
DONDON CrWTONCon (28)
DMDIDAO IrIrDIDAO (29)
mindeg repH NWhDONDON (30)
bacDONloss ULrDONDON (31)
The abundance of DIN in estuarine water is balanced by contribution of PON, DON and SIN and utilization by phytoplankton and microflora (Eq. 32). Unutilized part of DIN gets out from the system ( lossDIN ), governed by a loss rate ( DINLr ) (Eq. 33). LeachSIN is controlled by leaching rate of SIN
( 2RLch ) (Eq. 34). In Sundarban mangrove ecosystem, utilization of DIN by phytoplankton ( PU ) and
microflora ( MU ) is regulated by phytoplankton uptake rate ( urP ) and microfloral uptake rate ( urM ) respectively (Eq. 35 and 36).
MlossPLeach UDINUPONDONSINdt
dDIN mindeg (32)
DINloss LrDINDIN (33)
2RLeach LchSINSIN (34)
urP PDINU (35)
urM MDINU (36)
348 S. Mandal et al. / Procedia Environmental Sciences 13 (2012) 340 – 362348 S. Mandal et al./ Procedia Environmental Sciences 8 (2011) 340–362
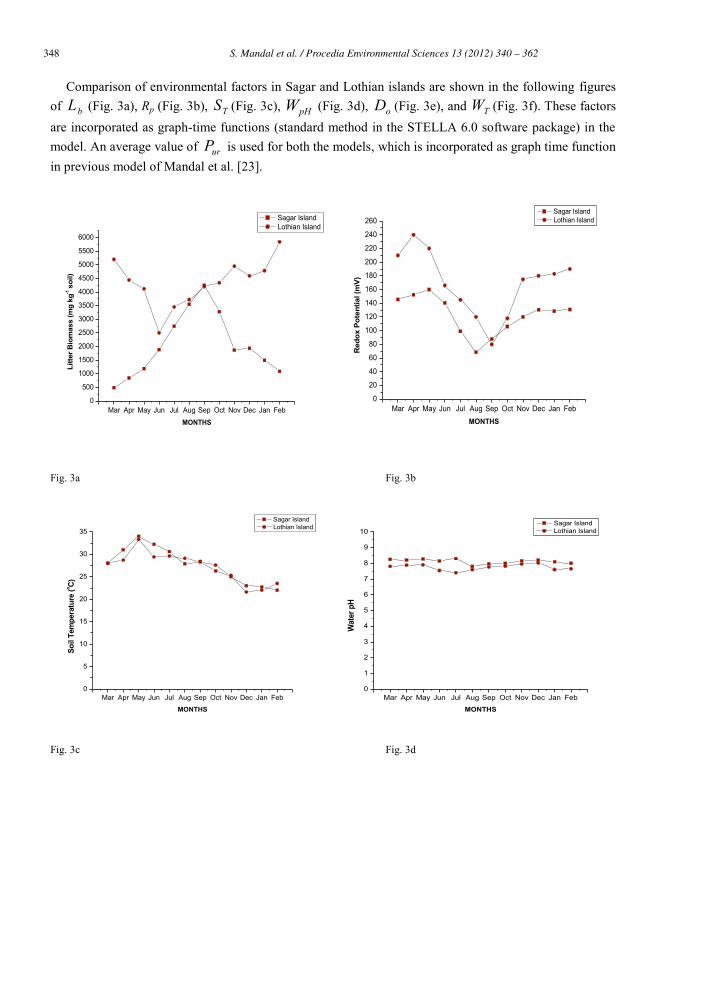
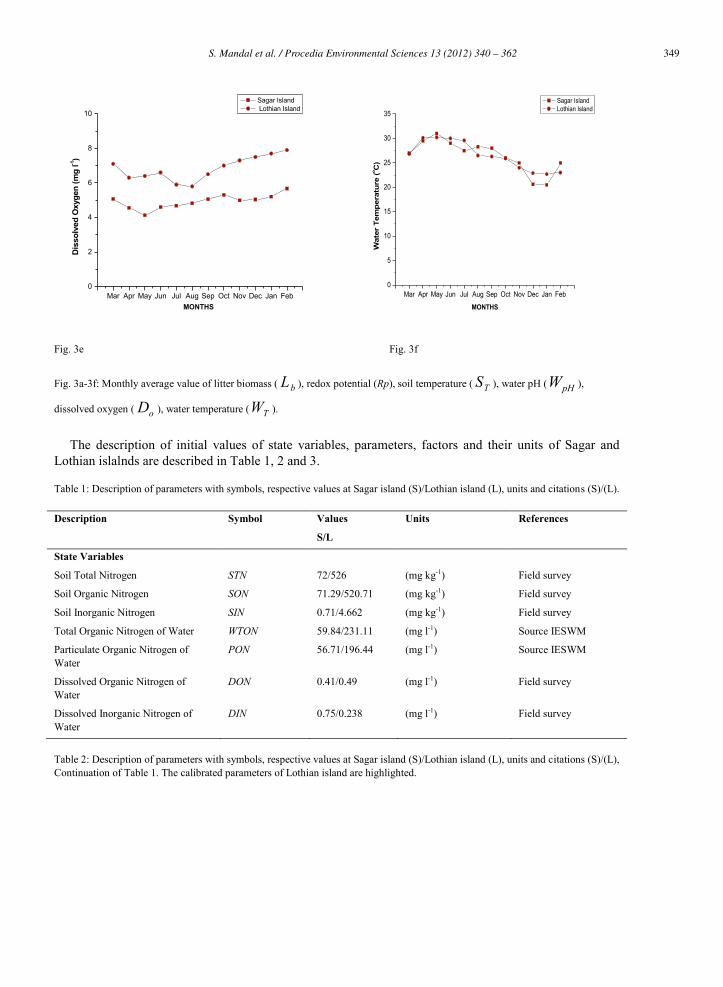
Comparison of environmental factors in Sagar and Lothian islands are shown in the following figures of bL (Fig. 3a), Rp (Fig. 3b), TS (Fig. 3c), pHW (Fig. 3d), oD (Fig. 3e), and TW (Fig. 3f). These factors are incorporated as graph-time functions (standard method in the STELLA 6.0 software package) in the model. An average value of urP is used for both the models, which is incorporated as graph time function in previous model of Mandal et al. [23].
Mar Apr May Jun Jul Aug Sep Oct Nov Dec Jan Feb0
500
1000
1500
2000
2500
3000
3500
4000
4500
5000
5500
6000
Litte
r Bio
mas
s (m
g kg
-1 s
oil)
MONTHS
Sagar Island Lothian Island
Mar Apr May Jun Jul Aug Sep Oct Nov Dec Jan Feb0
20
40
60
80
100
120
140
160
180
200
220
240
260
Red
ox P
oten
tial (
mV)
MONTHS
Sagar Island Lothian Island
Fig. 3a Fig. 3b
Mar Apr May Jun Jul Aug Sep Oct Nov Dec Jan Feb0
5
10
15
20
25
30
35
Soil
Tem
pera
ture
(o C)
MONTHS
Sagar Island Lothian Island
Mar Apr May Jun Jul Aug Sep Oct Nov Dec Jan Feb0
1
2
3
4
5
6
7
8
9
10
Wat
er p
H
MONTHS
Sagar Island Lothian Island
Fig. 3c Fig. 3d
349S. Mandal et al. / Procedia Environmental Sciences 13 (2012) 340 – 362S. Mandal et al./ Procedia Environmental Sciences 8 (2011) 340–362 349
Mar Apr May Jun Jul Aug Sep Oct Nov Dec Jan Feb0
2
4
6
8
10
Dis
solv
ed O
xyge
n (m
g l-1
)
MONTHS
Sagar Island Lothian Island
Mar Apr May Jun Jul Aug Sep Oct Nov Dec Jan Feb0
5
10
15
20
25
30
35
Wat
er T
empe
ratu
re (o C
)
MONTHS
Sagar Island Lothian Island
Fig. 3e Fig. 3f
Fig. 3a-3f: Monthly average value of litter biomass ( bL ), redox potential (Rp), soil temperature ( TS ), water pH ( pHW ),
dissolved oxygen ( oD ), water temperature ( TW ).
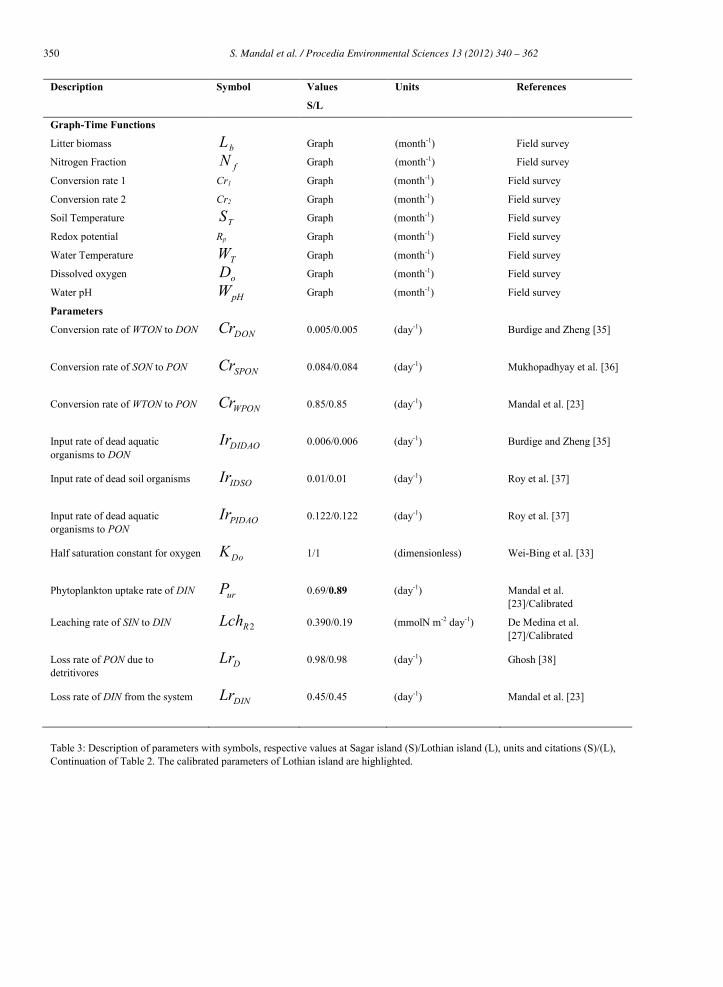
The description of initial values of state variables, parameters, factors and their units of Sagar and Lothian islalnds are described in Table 1, 2 and 3.
Table 1: Description of parameters with symbols, respective values at Sagar island (S)/Lothian island (L), units and citations (S)/(L).
Description Symbol Values
S/L
Units References
State Variables
Soil Total Nitrogen STN 72/526 (mg kg-1) Field survey
Soil Organic Nitrogen SON 71.29/520.71 (mg kg-1) Field survey
Soil Inorganic Nitrogen SIN 0.71/4.662 (mg kg-1) Field survey
Total Organic Nitrogen of Water WTON 59.84/231.11 (mg l-1) Source IESWM
Particulate Organic Nitrogen of Water
PON 56.71/196.44 (mg l-1) Source IESWM
Dissolved Organic Nitrogen of Water
DON 0.41/0.49 (mg l-1) Field survey
Dissolved Inorganic Nitrogen of Water
DIN 0.75/0.238 (mg l-1) Field survey
Table 2: Description of parameters with symbols, respective values at Sagar island (S)/Lothian island (L), units and citations (S)/(L), Continuation of Table 1. The calibrated parameters of Lothian island are highlighted.
350 S. Mandal et al. / Procedia Environmental Sciences 13 (2012) 340 – 362350 S. Mandal et al./ Procedia Environmental Sciences 8 (2011) 340–362
Description Symbol Values
S/L
Units References
Graph-Time Functions
Litter biomass bL Graph (month-1) Field survey
Nitrogen Fraction fN Graph (month-1) Field survey
Conversion rate 1 Cr1 Graph (month-1) Field survey
Conversion rate 2 Cr2 Graph (month-1) Field survey
Soil Temperature TS Graph (month-1) Field survey
Redox potential Rp Graph (month-1) Field survey
Water Temperature TW Graph (month-1) Field survey
Dissolved oxygen oD Graph (month-1) Field survey
Water pH pHW Graph (month-1) Field survey
Parameters
Conversion rate of WTON to DON DONCr 0.005/0.005
(day-1)
Burdige and Zheng [35]
Conversion rate of SON to PON SPONCr 0.084/0.084
(day-1)
Mukhopadhyay et al. [36]
Conversion rate of WTON to PON WPONCr 0.85/0.85
(day-1)
Mandal et al. [23]
Input rate of dead aquatic organisms to DON
DIDAOIr 0.006/0.006
(day-1)
Burdige and Zheng [35]
Input rate of dead soil organisms IDSOIr 0.01/0.01
(day-1)
Roy et al. [37]
Input rate of dead aquatic organisms to PON
PIDAOIr 0.122/0.122
(day-1)
Roy et al. [37]
Half saturation constant for oxygen DoK 1/1 (dimensionless)
Wei-Bing et al. [33]
Phytoplankton uptake rate of DIN urP 0.69/0.89 (day-1) Mandal et al. [23]/Calibrated
Leaching rate of SIN to DIN 2RLch 0.390/0.19
(mmolN m-2 day-1) De Medina et al. [27]/Calibrated
Loss rate of PON due to detritivores
DLr 0.98/0.98 (day-1)
Ghosh [38]
Loss rate of DIN from the system DINLr 0.45/0.45
(day-1)
Mandal et al. [23]
Table 3: Description of parameters with symbols, respective values at Sagar island (S)/Lothian island (L), units and citations (S)/(L), Continuation of Table 2. The calibrated parameters of Lothian island are highlighted.
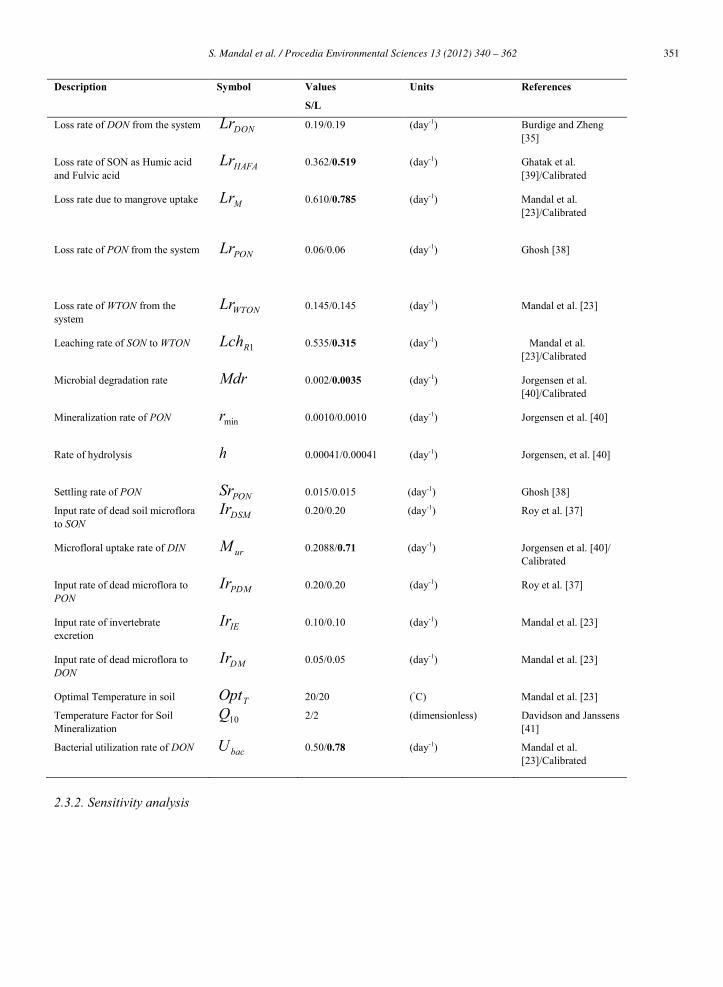
351S. Mandal et al. / Procedia Environmental Sciences 13 (2012) 340 – 362S. Mandal et al./ Procedia Environmental Sciences 8 (2011) 340–362 351
Description Symbol Values
S/L
Units References
Loss rate of DON from the system DONLr 0.19/0.19
(day-1)
Burdige and Zheng [35]
Loss rate of SON as Humic acid and Fulvic acid
HAFALr 0.362/0.519
(day-1)
Ghatak et al. [39]/Calibrated
Loss rate due to mangrove uptake MLr 0.610/0.785
(day-1)
Mandal et al. [23]/Calibrated
Loss rate of PON from the system PONLr 0.06/0.06 (day-1)
Ghosh [38]
Loss rate of WTON from the system
WTONLr 0.145/0.145
(day-1)
Mandal et al. [23]
Leaching rate of SON to WTON 1RLch 0.535/0.315 (day-1)
Mandal et al. [23]/Calibrated
Microbial degradation rate Mdr 0.002/0.0035
(day-1)
Jorgensen et al. [40]/Calibrated
Mineralization rate of PON minr 0.0010/0.0010
(day-1)
Jorgensen et al. [40]
Rate of hydrolysis h 0.00041/0.00041 (day-1)
Jorgensen, et al. [40]
Settling rate of PON PONSr 0.015/0.015 (day-1) Ghosh [38]
Input rate of dead soil microflora to SON
DSMIr 0.20/0.20 (day-1)
Roy et al. [37]
Microfloral uptake rate of DIN urM 0.2088/0.71 (day-1)
Jorgensen et al. [40]/ Calibrated
Input rate of dead microflora to PON
PDMIr 0.20/0.20 (day-1)
Roy et al. [37]
Input rate of invertebrate excretion
IEIr 0.10/0.10 (day-1)
Mandal et al. [23]
Input rate of dead microflora to DON
DMIr 0.05/0.05 (day-1)
Mandal et al. [23]
Optimal Temperature in soil TOpt 20/20 (◦C) Mandal et al. [23]
Temperature Factor for Soil Mineralization
10Q 2/2 (dimensionless) Davidson and Janssens [41]
Bacterial utilization rate of DON bacU 0.50/0.78 (day-1)
Mandal et al. [23]/Calibrated
2.3.2. Sensitivity analysis
352 S. Mandal et al. / Procedia Environmental Sciences 13 (2012) 340 – 362352 S. Mandal et al./ Procedia Environmental Sciences 8 (2011) 340–362
Sensitivity analysis is carried out for Sagar island as well as Lothian island to detect the sensitive parameter for both the systems. Sensitivity analysis is performed using the formula described in Jorgensen [42]: -
ppxxS /// (37)
where, S = Sensitivity, x = state variable (here STN, SON, SIN, WTON, DON, DIN and PON), p= parameter, x and p are change of initial values of state variables, parameters and forcing functions respectively at %10 level.
Secondary data source is used to calibrate the parameters, which are not possible to collect from the field. For this, first year data set is used for calibration followed by validation using second set data. Ranges (minimum to maximum) of these parameter values in different estuaries of elsewhere are collected from literature [20, 28, 38, 39, 40].
2.3.3. Model calibration and validation
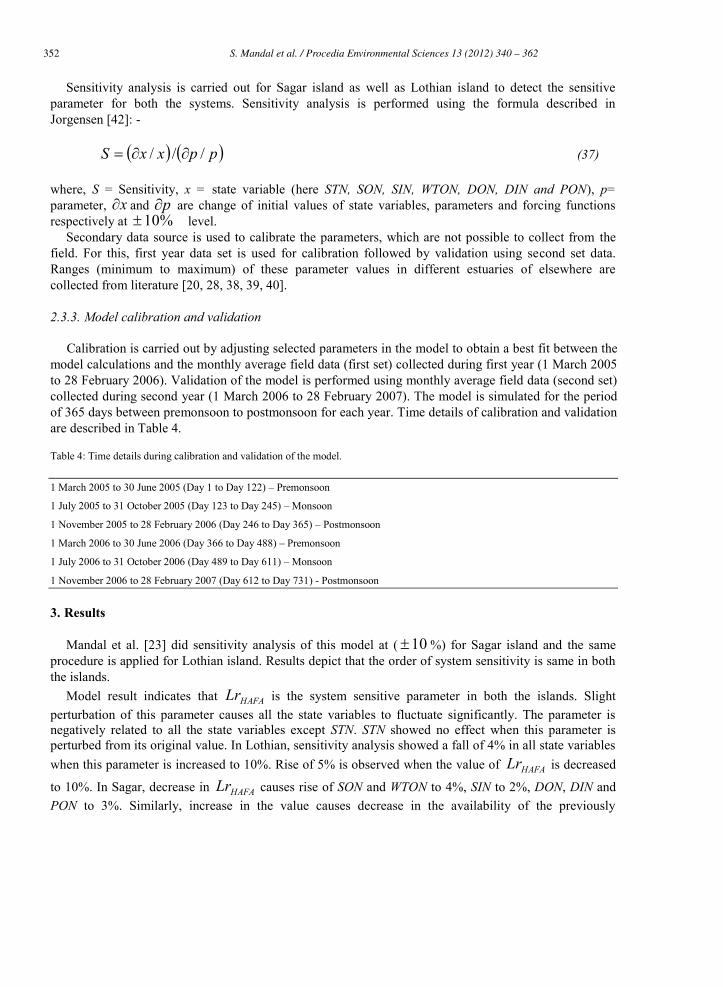
Calibration is carried out by adjusting selected parameters in the model to obtain a best fit between the model calculations and the monthly average field data (first set) collected during first year (1 March 2005 to 28 February 2006). Validation of the model is performed using monthly average field data (second set) collected during second year (1 March 2006 to 28 February 2007). The model is simulated for the period of 365 days between premonsoon to postmonsoon for each year. Time details of calibration and validation are described in Table 4.
Table 4: Time details during calibration and validation of the model.
1 March 2005 to 30 June 2005 (Day 1 to Day 122) – Premonsoon
1 July 2005 to 31 October 2005 (Day 123 to Day 245) – Monsoon
1 November 2005 to 28 February 2006 (Day 246 to Day 365) – Postmonsoon
1 March 2006 to 30 June 2006 (Day 366 to Day 488) – Premonsoon
1 July 2006 to 31 October 2006 (Day 489 to Day 611) – Monsoon
1 November 2006 to 28 February 2007 (Day 612 to Day 731) - Postmonsoon
3. Results
Mandal et al. [23] did sensitivity analysis of this model at ( 10 %) for Sagar island and the same procedure is applied for Lothian island. Results depict that the order of system sensitivity is same in both the islands.
Model result indicates that HAFALr is the system sensitive parameter in both the islands. Slight perturbation of this parameter causes all the state variables to fluctuate significantly. The parameter is negatively related to all the state variables except STN. STN showed no effect when this parameter is perturbed from its original value. In Lothian, sensitivity analysis showed a fall of 4% in all state variables when this parameter is increased to 10%. Rise of 5% is observed when the value of HAFALr is decreased
to 10%. In Sagar, decrease in HAFALr causes rise of SON and WTON to 4%, SIN to 2%, DON, DIN and PON to 3%. Similarly, increase in the value causes decrease in the availability of the previously
353S. Mandal et al. / Procedia Environmental Sciences 13 (2012) 340 – 362S. Mandal et al./ Procedia Environmental Sciences 8 (2011) 340–362 353
mentioned state variables by same percentage. STN pool is only sensitive to Cr1 for both the cases. If all the values are decreased by 10%, then a rise of 11% is observed in STN dynamics.
The availability of SON is directly proportional to TOpt and inversely proportional
to SPONCr , 1RLch , HAFALr and Mdr . Sensitivity results show 1RLch is the most sensitive parameter to
SON dynamics. In reclaimed island, increase of 1RLch by 10% causes SON to decrease by 6%. When this parameter is perturbed down to 10%, SON rises by 5%. In virgin island, SON reduced to 4%, when the value of 1RLch is increased to 10%. The content of SON in the soil rise by 3%, when 1RLch is reduced to 10%.
Model shows Mdr , 10Q , Cr2 , are directly proportional to SIN dynamics and TOpt , MLr , 1RLch ,
2RLch , HAFALr and SPONCr are inversely proportional to SIN dynamics. In Sagar island, TOpt is the most sensitive parameter to SIN dynamics. Increase of this parameter to 10% causes reduction in the content of SIN of soil by 8% whereas the availability increases by 9% of same state variable when the value of TOpt is decreased to 10%. In Lothain island, there are two important parameters; TOpt and
MLr , which are responsible for retention of SIN in soil. When these parameters are increased to 10% of their respective values, 8% fall in SIN content is noted. 8% rise is observed when both the parameter values are reduced to 10%.
DONCr , 1RLch , DMIr are directly proportional to DON dynamics and DONLr , bacU , WPONCr ,
HAFALr , SPONCr and WTONLr are inversely proportional to DON. For both the islands, DONCr is the most sensitive parameter governing DON dynamics. In Sagar island, if the value of the same is increased to 10%, abundance of DON rise by 9%. This rise is 7% in case of Lothian island. The availability of DON is decreased by 18% in Sagar and 9% in Lothian, when the value of parameter is perturbed down to 10%.
DIN of the estuary is contributed from SIN leaching and mineralization of PON and DON, therefore, the abundance of DIN is mostly affected by the parameters that influence SIN, PON and DON. Positive relation is observed between DIN and Cr2, DoK , 2RLch , Mdr , 10Q , minr and negative relation is
associated with 1RLch , DINLr , DLr , HAFALr , MLr , TOpt , urP and urM . urP and minr are most
sensitive parameters to DIN in Sagar island and Lothian island respectively. When the value of urP are decreased by 10%, DIN became abundant by 5%, a fall of 4% is observed when the parameter value is perturbed up by 10%. In Lothian island, the availability of DIN get reduced and rose to 5%, when the parameter is increased or decreased by 10%.
In reclaimed and virgin islands, 1RLch is the only parameter that is positively related to WTON.
WTONLr , HAFALr and WPONCr are negatively related to WTON. WPONCr is the most sensitive parameter to WTON in both the islands. Similar trend of rise and fall in WTON content is observed for both the islands. 9% fall and 10% rise is noted in WTON concentration when the value of parameter is increased and decreased by 10% respectively.
PON of estuary is positively sensitive to 1RLch , WPONCr , SPONCr and negatively sensitive to DLr ,
HAFALr and WTONLr . In reclaimed island, DLr is the most sensitive parameter to PON. If the value is decreased to 10%, 10% rise in PON dynamics is observed. In virgin island, 11% rise is observed when
DLr is perturbed down to 10%. Moreover, alteration of the value of 1RLch by 10% showed significant change (8% rise and 7%) in the availability of PON in virgin island.
354 S. Mandal et al. / Procedia Environmental Sciences 13 (2012) 340 – 362354 S. Mandal et al./ Procedia Environmental Sciences 8 (2011) 340–362
Litterfall from mangrove shows seasonal variations in both the islands (Fig. 3a). In Sagar island, the average wet weight of Lb during premonsoon is (978.25 ± 422 mg kg-1 of soil), monsoon (2401.75 ± 1122 mg kg-1 of soil) and postmonsoon (2832.45 ±1148 mg kg-1 of soil). In Lothian island, average wet weight is higher during postmonsoon (5041.25 ±551 mg kg-1 of soil) and lower during premonsoon (4065 ± 1137 mg kg-1 of soil) and monsoon (3927.5 ± 441 mg kg-1 of soil). The mangrove species in Sagar and Lothian island are almost same but the trend is different.
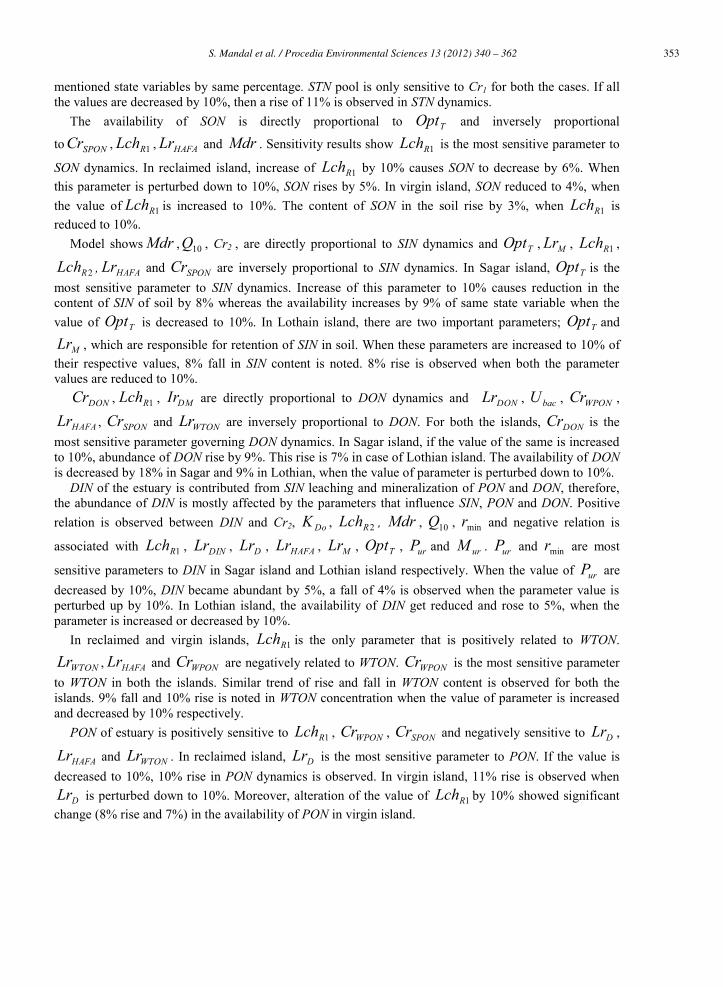
Dynamics of STN is studied throughout the year; the experimental results show higher values in monsoon (255 ± 24 mg kg-1), lower in premonsoon (105 ± 34 mg kg-1) and intermediate in postmonsoon (150.25 ± 36 mg kg-1). In Lothian island, higher values are observed in premonsoon (423.25 ± 96 mg kg-1) and lower values are observed during monsoon (347.25 ± 30 mg kg-1) and postmonsoon (404.25 ± 62 mg kg-1) The simulated results of first year and second year are in agreement with the observed results (Fig. 4a and 4b).
0 100 200 300 400 500 600 700 8000
100
200
300
400
500
600
0 100 200 300 400 500 600 700 8000
100
200
300
400
500
600 SAGAR ISLAND
DAYS
OBSERVED
SO
IL T
OTA
L N
ITR
OG
EN
(mg.
kg-1)
SIMULATED
0 100 200 300 400 500 600 700 8000
100
200
300
400
500
600
0 100 200 300 400 500 600 700 8000
100
200
300
400
500
600LOTHIAN ISLAND
OBSERVED
SO
IL T
OT
AL
NIT
RO
GE
N (
mg
.kg-1
)
DAYS
SIMULATED
Fig. 4a Fig. 4b
Fig. 4a and 4b: Simulated and observed results of STN during calibration (Day1 to Day 365) and validation (Day 366 to Day 731).
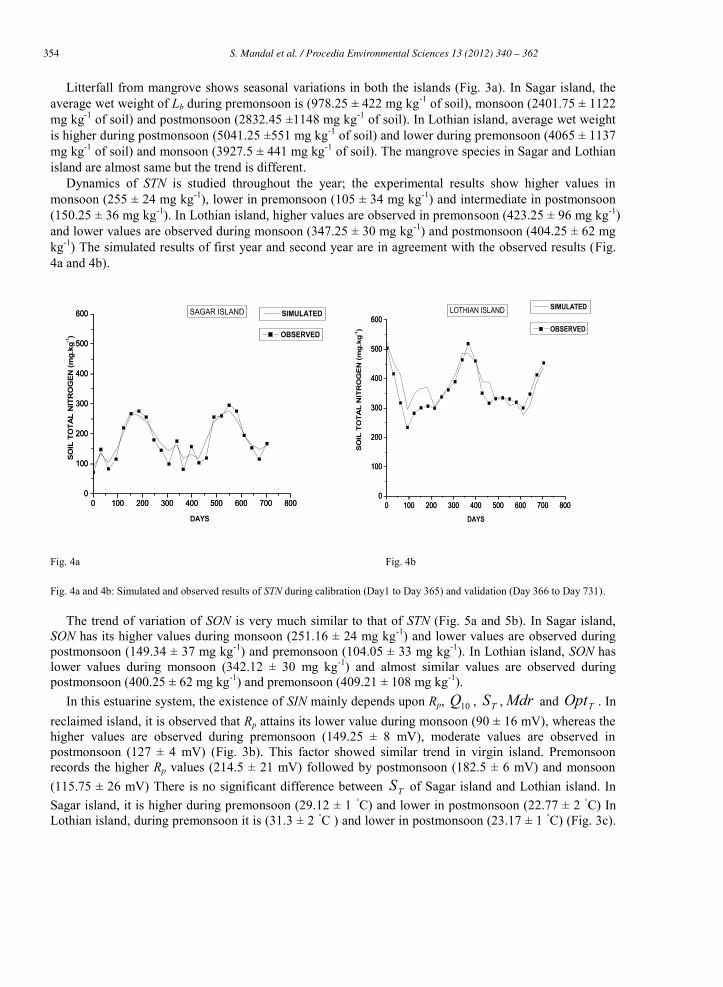
The trend of variation of SON is very much similar to that of STN (Fig. 5a and 5b). In Sagar island, SON has its higher values during monsoon (251.16 ± 24 mg kg-1) and lower values are observed during postmonsoon (149.34 ± 37 mg kg-1) and premonsoon (104.05 ± 33 mg kg-1). In Lothian island, SON has lower values during monsoon (342.12 ± 30 mg kg-1) and almost similar values are observed during postmonsoon (400.25 ± 62 mg kg-1) and premonsoon (409.21 ± 108 mg kg-1).
In this estuarine system, the existence of SIN mainly depends upon Rp, 10Q , TS , Mdr and TOpt . In reclaimed island, it is observed that Rp attains its lower value during monsoon (90 ± 16 mV), whereas the higher values are observed during premonsoon (149.25 ± 8 mV), moderate values are observed in postmonsoon (127 ± 4 mV) (Fig. 3b). This factor showed similar trend in virgin island. Premonsoon records the higher Rp values (214.5 ± 21 mV) followed by postmonsoon (182.5 ± 6 mV) and monsoon (115.75 ± 26 mV) There is no significant difference between TS of Sagar island and Lothian island. In Sagar island, it is higher during premonsoon (29.12 ± 1 ◦C) and lower in postmonsoon (22.77 ± 2 ◦C) In Lothian island, during premonsoon it is (31.3 ± 2 ◦C ) and lower in postmonsoon (23.17 ± 1 ◦C) (Fig. 3c).
355S. Mandal et al. / Procedia Environmental Sciences 13 (2012) 340 – 362S. Mandal et al./ Procedia Environmental Sciences 8 (2011) 340–362 355
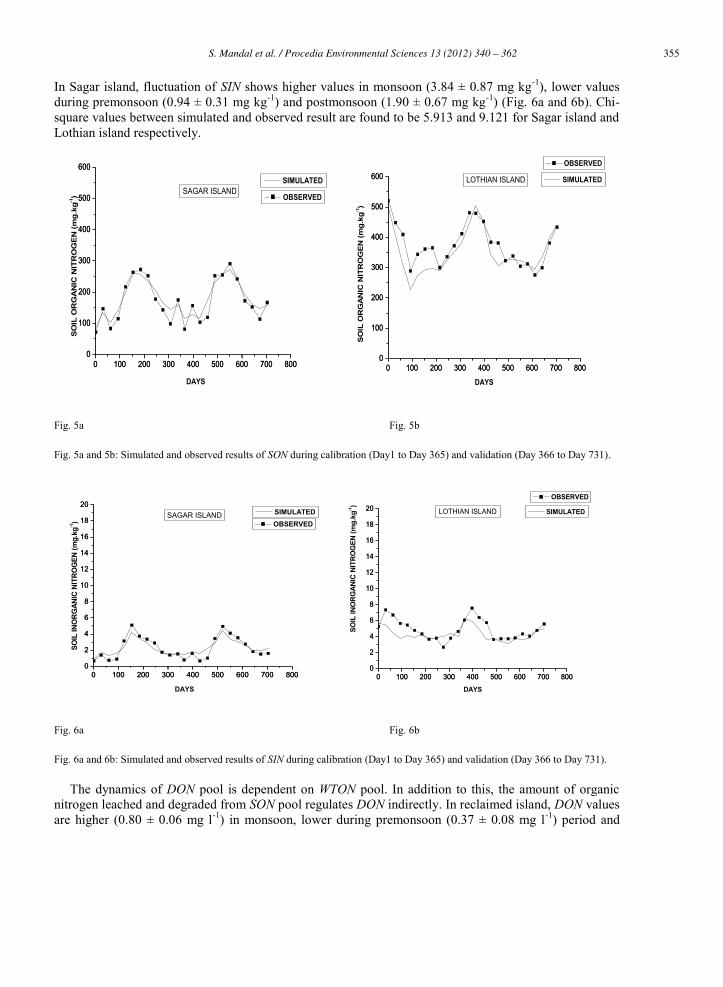
In Sagar island, fluctuation of SIN shows higher values in monsoon (3.84 ± 0.87 mg kg-1), lower values during premonsoon (0.94 ± 0.31 mg kg-1) and postmonsoon (1.90 ± 0.67 mg kg-1) (Fig. 6a and 6b). Chi-square values between simulated and observed result are found to be 5.913 and 9.121 for Sagar island and Lothian island respectively.
0 100 200 300 400 500 600 700 8000
100
200
300
400
500
600
0 100 200 300 400 500 600 700 8000
100
200
300
400
500
600
SAGAR ISLAND
SO
IL O
RG
AN
IC N
ITR
OG
EN
(mg.
kg-1) OBSERVED
DAYS
SIMULATED
0 100 200 300 400 500 600 700 8000
100
200
300
400
500
600
0 100 200 300 400 500 600 700 8000
100
200
300
400
500
600
SO
IL O
RG
AN
IC N
ITR
OG
EN
(mg.
kg-1)
DAYS
OBSERVED
LOTHIAN ISLAND SIMULATED
Fig. 5a Fig. 5b
Fig. 5a and 5b: Simulated and observed results of SON during calibration (Day1 to Day 365) and validation (Day 366 to Day 731).
0 100 200 300 400 500 600 700 8000
2
4
6
8
10
12
14
16
18
20
0 100 200 300 400 500 600 700 8000
2
4
6
8
10
12
14
16
18
20
SOIL
INO
RGAN
IC N
ITRO
GEN
(mg.
kg-1)
DAYS
SIMULATEDSAGAR ISLAND OBSERVED
0 100 200 300 400 500 600 700 8000
2
4
6
8
10
12
14
16
18
20
0 100 200 300 400 500 600 700 8000
2
4
6
8
10
12
14
16
18
20 LOTHIAN ISLAND
SOIL
INO
RG
ANIC
NIT
RO
GEN
(mg.
kg-1)
SIMULATED
DAYS
OBSERVED
Fig. 6a Fig. 6b
Fig. 6a and 6b: Simulated and observed results of SIN during calibration (Day1 to Day 365) and validation (Day 366 to Day 731).
The dynamics of DON pool is dependent on WTON pool. In addition to this, the amount of organic nitrogen leached and degraded from SON pool regulates DON indirectly. In reclaimed island, DON values are higher (0.80 ± 0.06 mg l-1) in monsoon, lower during premonsoon (0.37 ± 0.08 mg l-1) period and

356 S. Mandal et al. / Procedia Environmental Sciences 13 (2012) 340 – 362356 S. Mandal et al./ Procedia Environmental Sciences 8 (2011) 340–362
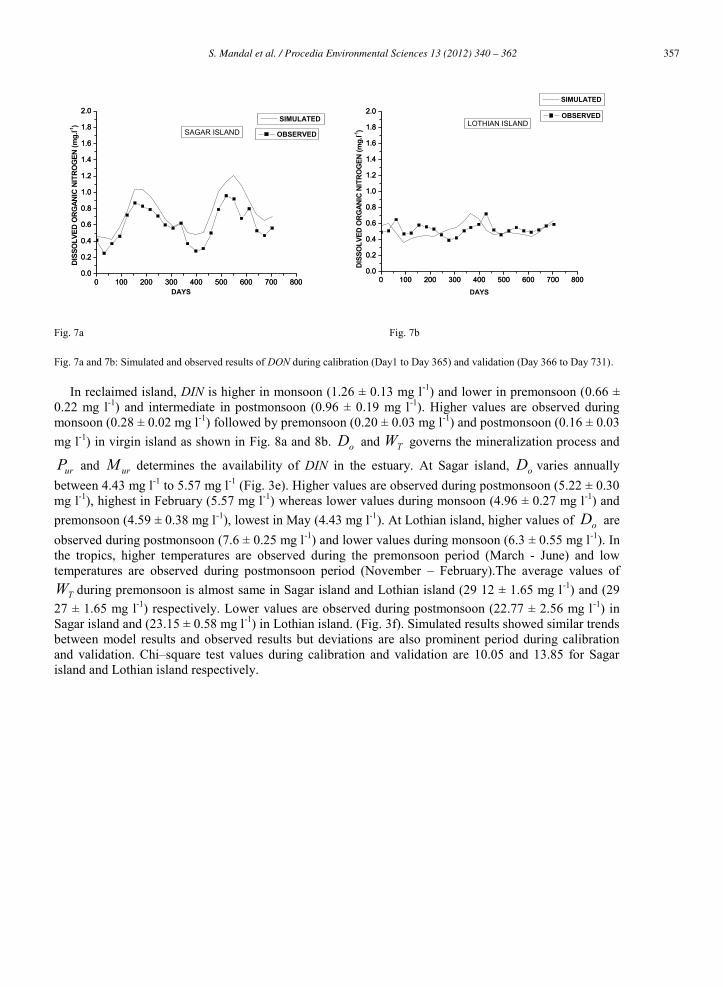
intermediate in postmonsoon (0.62 ± 0.06 mg l-1). In contrast, the higher values of DON are observed during premonsoon (0.55 ± 0.08 mg l-1) and monsoon (0.54 ± 0.04 mg l-1) in virgin and lower values are noted in postmonsoon (0.46 ± 0.08 mg l-1). Degradation of DON depends upon hydrolysis, which is controlled by pHW . In Sagar island, pHW fluctuates at very narrow range throughout the year (7.8 to 8.3), this range merges with Lothian island (7.4 to 8.02) (Fig. 3d). In Sagar island, this factor is higher during premonsoon (8.22 ± 0.05) and in Lothian island, it is higher during postmonsoon (7.80 ± 0.21). Lower values are observed in monsoon for both the islands. The model results are very much similar to that of observed results during calibration and validation (Fig. 7a and 7b). Chi – square values during calibration and validation are found to be 1.786 and 0.504 for Sagar island and Lothian island respectively.
357S. Mandal et al. / Procedia Environmental Sciences 13 (2012) 340 – 362S. Mandal et al./ Procedia Environmental Sciences 8 (2011) 340–362 357
0 100 200 300 400 500 600 700 8000.0
0.2
0.4
0.6
0.8
1.0
1.2
1.4
1.6
1.8
2.0
0 100 200 300 400 500 600 700 8000.0
0.2
0.4
0.6
0.8
1.0
1.2
1.4
1.6
1.8
2.0
SAGAR ISLAND OBSERVED
DISS
OLV
ED O
RGAN
IC N
ITRO
GEN
(mg.
l-1)
DAYS
SIMULATED
0 100 200 300 400 500 600 700 8000.0
0.2
0.4
0.6
0.8
1.0
1.2
1.4
1.6
1.8
2.0
0 100 200 300 400 500 600 700 8000.0
0.2
0.4
0.6
0.8
1.0
1.2
1.4
1.6
1.8
2.0
LOTHIAN ISLAND
DISS
OLV
ED O
RGAN
IC N
ITRO
GEN
(mg.
l-1)
OBSERVED
DAYS
SIMULATED
Fig. 7a Fig. 7b
Fig. 7a and 7b: Simulated and observed results of DON during calibration (Day1 to Day 365) and validation (Day 366 to Day 731).
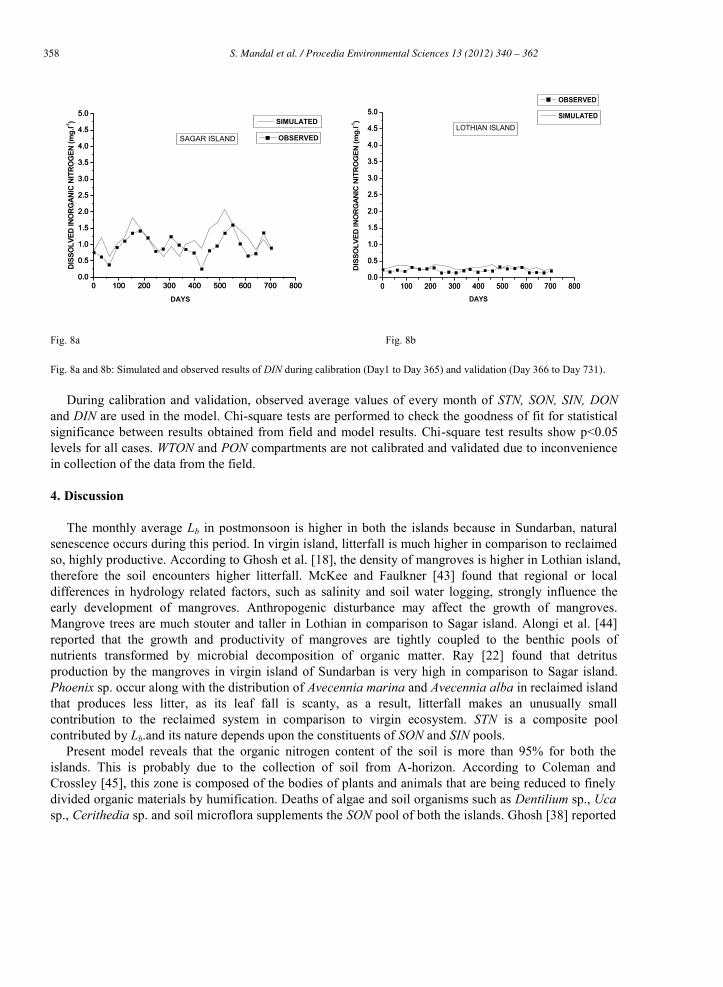
In reclaimed island, DIN is higher in monsoon (1.26 ± 0.13 mg l-1) and lower in premonsoon (0.66 ± 0.22 mg l-1) and intermediate in postmonsoon (0.96 ± 0.19 mg l-1). Higher values are observed during monsoon (0.28 ± 0.02 mg l-1) followed by premonsoon (0.20 ± 0.03 mg l-1) and postmonsoon (0.16 ± 0.03 mg l-1) in virgin island as shown in Fig. 8a and 8b. oD and TW governs the mineralization process and
urP and urM determines the availability of DIN in the estuary. At Sagar island, oD varies annually between 4.43 mg l-1 to 5.57 mg l-1 (Fig. 3e). Higher values are observed during postmonsoon (5.22 ± 0.30 mg l-1), highest in February (5.57 mg l-1) whereas lower values during monsoon (4.96 ± 0.27 mg l-1) and premonsoon (4.59 ± 0.38 mg l-1), lowest in May (4.43 mg l-1). At Lothian island, higher values of oD are observed during postmonsoon (7.6 ± 0.25 mg l-1) and lower values during monsoon (6.3 ± 0.55 mg l-1). In the tropics, higher temperatures are observed during the premonsoon period (March - June) and low temperatures are observed during postmonsoon period (November – February).The average values of
TW during premonsoon is almost same in Sagar island and Lothian island (29 12 ± 1.65 mg l-1) and (29 27 ± 1.65 mg l-1) respectively. Lower values are observed during postmonsoon (22.77 ± 2.56 mg l-1) in Sagar island and (23.15 ± 0.58 mg l-1) in Lothian island. (Fig. 3f). Simulated results showed similar trends between model results and observed results but deviations are also prominent period during calibration and validation. Chi–square test values during calibration and validation are 10.05 and 13.85 for Sagar island and Lothian island respectively.
358 S. Mandal et al. / Procedia Environmental Sciences 13 (2012) 340 – 362358 S. Mandal et al./ Procedia Environmental Sciences 8 (2011) 340–362
0 100 200 300 400 500 600 700 8000.0
0.5
1.0
1.5
2.0
2.5
3.0
3.5
4.0
4.5
5.0
0 100 200 300 400 500 600 700 8000.0
0.5
1.0
1.5
2.0
2.5
3.0
3.5
4.0
4.5
5.0
DISS
OLV
ED IN
ORG
ANIC
NIT
ROG
EN (m
g.l-1
) SIMULATED
SAGAR ISLAND
DAYS
OBSERVED
0 100 200 300 400 500 600 700 8000.0
0.5
1.0
1.5
2.0
2.5
3.0
3.5
4.0
4.5
5.0
0 100 200 300 400 500 600 700 8000.0
0.5
1.0
1.5
2.0
2.5
3.0
3.5
4.0
4.5
5.0
LOTHIAN ISLAND
DAYS
SIMULATED
DIS
SOLV
ED IN
OR
GA
NIC
NIT
RO
GEN
(mg.
l-1)
OBSERVED
Fig. 8a Fig. 8b
Fig. 8a and 8b: Simulated and observed results of DIN during calibration (Day1 to Day 365) and validation (Day 366 to Day 731).
During calibration and validation, observed average values of every month of STN, SON, SIN, DON and DIN are used in the model. Chi-square tests are performed to check the goodness of fit for statistical significance between results obtained from field and model results. Chi-square test results show p<0.05 levels for all cases. WTON and PON compartments are not calibrated and validated due to inconvenience in collection of the data from the field.
4. Discussion
The monthly average Lb in postmonsoon is higher in both the islands because in Sundarban, natural senescence occurs during this period. In virgin island, litterfall is much higher in comparison to reclaimed so, highly productive. According to Ghosh et al. [18], the density of mangroves is higher in Lothian island, therefore the soil encounters higher litterfall. McKee and Faulkner [43] found that regional or local differences in hydrology related factors, such as salinity and soil water logging, strongly influence the early development of mangroves. Anthropogenic disturbance may affect the growth of mangroves. Mangrove trees are much stouter and taller in Lothian in comparison to Sagar island. Alongi et al. [44] reported that the growth and productivity of mangroves are tightly coupled to the benthic pools of nutrients transformed by microbial decomposition of organic matter. Ray [22] found that detritus production by the mangroves in virgin island of Sundarban is very high in comparison to Sagar island. Phoenix sp. occur along with the distribution of Avecennia marina and Avecennia alba in reclaimed island that produces less litter, as its leaf fall is scanty, as a result, litterfall makes an unusually small contribution to the reclaimed system in comparison to virgin ecosystem. STN is a composite pool contributed by Lb.and its nature depends upon the constituents of SON and SIN pools.
Present model reveals that the organic nitrogen content of the soil is more than 95% for both the islands. This is probably due to the collection of soil from A-horizon. According to Coleman and Crossley [45], this zone is composed of the bodies of plants and animals that are being reduced to finely divided organic materials by humification. Deaths of algae and soil organisms such as Dentilium sp., Uca sp., Cerithedia sp. and soil microflora supplements the SON pool of both the islands. Ghosh [38] reported
359S. Mandal et al. / Procedia Environmental Sciences 13 (2012) 340 – 362S. Mandal et al./ Procedia Environmental Sciences 8 (2011) 340–362 359
that the clay content of the soil in Lothian is high which helps to retain the organic matter for long time. Model results showed higher HAFALr (0.519 day-1) in virgin system comparison to reclaimed one (0.362 day-1), which corroborates with the finding of Ghosh [38]. In Sagar island, higher values of SON during monsoon are due to lower microbial activities during this period. In contrast, Lothian island exhibit lower SON values during monsoon and higher microbial activity in soil. Lacerda et al. [46] analyzed soil samples from two different forests dominated by Avecennia schauriana and Rhizophora mangle in south-eastern Brazil. They concluded that the organic matter content of soil is high in Avecennia sp. dominated forest; simultaneously the organic matter degradation rate is also high. The present model showed similar result, Lothian island has higher SON as well as higher Mdr in comparison to Sagar island.
Alongi et al. [44] measured the rates and pathways of microbial decomposition of soil organic matter to determine human impact on biogeochemical activities of two disturbed Avecennia forests and two undisturbed Avecennia marina and Rhizophora apiculata forests in Vellar- Coleroon estuarine complex, India. They found that carbon oxidation by microbes is greater in undisturbed forest. Model estimation of Mdr shows higher value (0.0035 day-1) at Lothian in comparison to Sagar island (0.002 day-1). According to Alongi [47], redox of mangrove soil is controlled by number of factors, the composition, and concentration of the inorganic and organic components, tidal elevation, water content, microbial activity, and extent of anthropogenic input. Anaerobic conditions are usually found in soil during inundation as water fills the pore spaces, the rate at which oxygen can diffuse through the soil is drastically reduced. Sagar island is subjected to more tidal influence due to its geographic location. Model results of Lothain island showed lower leaching rates 1RLch (0.315 day-1) and 2RLch (0.19 day-1) in comparison to Sagar island (0.535 day-1) and (0.39 day-1) respectively. Thus, SIN values are higher in Lothian in comparison to Sagar island. Higher pR values in Lothian island proves greater microbial activity in soil, better penetration of oxygen in soil and suitable habitat for crabs, mudskippers and other soil detritivores. The present findings corroborates with statement of Nielsen et al. [48]. Both islands showed lower values of pR in monsoon, which is due to heavy rainfall during this period, which results water logging, as the clay particles are predominant in this area in comparison to silt particles. However, during premonsoon, higher air temperature enhances the diffusion of oxygen in soil which in turn increases the pR . Postmonsoon encounters moderate rainfall and clear climate thus pR values are moderate. For SIN (mainly consisted of NO3
-, NO2- and NH4
+) estimation, soil samples are collected at the depth of 8 to 10 inches which is oxidation prone zone. Experimental results of soil for both the islands showed dominance of NO3
- followed by NO2- and negligible amount of NH4
+. Alongi [47] reported that mangrove forests dominated by different species showed uptake of NH4
+ in greater amount followed by NO3
- and NO2-. MLr is higher in Lothian island which indicates better utilization of nutrient by the
mangroves in comparison to Sagar island. DON values are higher in Sagar island in comparison to Lothian island, this increase is probably due to
anthropogenic input of DON from Hooghly estuary. Dittmar and Lara [49] found that DON and DIN concentration in estuary ranged in the same order of magnitude. The present findings corroborate with the above statement. bacU is higher in Lothian (0.78 day-1) than Sagar island (0.50 day-1), this promotes decomposition process in Lothian island, thus faster detritus formation.
Generation of DIN within a mangrove forest may originate from microbial mineralization of dissolved and particulate organic matter in tidal water and leaching. Primary production by phytoplankton and suspended benthic microalgae, uptake by mangroves considerably reduce the DIN concentration of estuary and act as potential sink of inorganic nutrients. Model results indicate that DIN concentration at Sagar island is greater than Lothian island. Mukhopadhyay et al. [36] reported that the amount of anthropogenic DIN input from Hooghly estuary to the creeks of Sagar island varies between 0.257 mg l-1
to 0.390 mg l-1 annually. The lower DIN values in Lothian island is due to higher urP (0.89 day-1) and higher urM (0.71 day-1). At Sagar island, higher DIN values in monsoon period are not only due to huge
360 S. Mandal et al. / Procedia Environmental Sciences 13 (2012) 340 – 362360 S. Mandal et al./ Procedia Environmental Sciences 8 (2011) 340–362
water runoff with the increase of leaching rate in estuary but also decrease of uptake by phytoplankton as its biomass falls in this season as indicated by Mandal et al. [23].
In the present account, an attempt is made to catch a realistic picture of nitrogen dynamics in virgin island. Seven important parameters are estimated using this model, which are not known before. A more generalized view can be obtained if this model is run on other virgin islands of Sunarban mangrove ecosystem which are still inaccessible. The area selected for the study bears similar mangrove structure. Some interesting result may come out if this model is applied to other mangrove forest dominated by different species.
5. Conclusions
In reclaimed island, the production of detritus and its input from various sources is low due to deforestation. Nitrogen dynamics and productivity of mangroves of the Hooghly - Matla estuary is dependent on high mangrove litterfall. Moreover, the hydrodynamic conditions of Lothian island are more stable than Sagar island as indicated by slower leaching processes. Higher degradation rates and utilization rates by microbes indicate better decomposition process in Lothian island as a result more detritus formation takes place in soil and water of this island. Therefore, it can be concluded that detritus food chain dominates over grazing food chain in the virgin system. Higher uptake rate by phytoplankton in Lothian island indicates better utilization of DIN. Deforestation of mangroves and anthropogenic stress (agriculture, improper land use, improper aquaculture and burgeoning industrial input of organic matter and chemicals) are the principal cause low productivity at Sagar island. More emphasis should be given of the above mentioned aspects for proper conservation and restoration of mangrove ecosystem.
Acknowledgements
One of the authors (Sudipto Mandal) is thankful to the organizers of ISEM, 2011 to give him the opportunity for delivering the present work in Beijing, China. The authors (Sudipto Mandal and Santanu Ray) greatly acknowledge the support from University Grants Commission (Dr. D. S. Kothari Post Doctoral Fellowship) and CSIR, New Delhi (Project Ref. No. 37/1185/04/EMR-IIGovt. of India, New Delhi respectively to carry out this work. Thanks are due to Prof. Amalesh Choudhury for the valuable comments regarding reclaimed and virgin islands of Sundarban. Thanks are also due to the Department of Zoology, Visva-Bharati University, Institute of Environmental Studies and Wetland Management (IESWM), Saltlake, Kolkata, India and teaching and non-teaching staffs of T. D. B. College, Raniganj, India for giving all sorts of facilities to conduct this research. The author, Sudipto Mandal acknowledges Department of Science and Technology (DST), Government of India, for bearing travel grant, registration and other necessary fees required to visit China. We are also thankful to Ashis Jana for assistance in the collection of samples during field survey for this work.
References
[1] Alongi DM, Mangrove forests: resilience, protection from tsunamis, and responses to global climate change. Estuar Coast Shelf S 2008; 76: 1-13. [2] Barbier EB, Koch EW, Silliman BR, Hacker SD, Wolanski E, Primavera J, et al.. Coastal ecosystem based management with nonlinear ecological functions and values. Science 2008; 319:321–3.
361S. Mandal et al. / Procedia Environmental Sciences 13 (2012) 340 – 362S. Mandal et al./ Procedia Environmental Sciences 8 (2011) 340–362 361
[3] Fu CB, Kim J-W, Zhao ZC. Preliminary assessment of impacts of global change on Asia. In: Galloway JN, Melillo JM, editors. Asian change in the context of global climate change. Cambridge: Cambridge University Press; 1998, p. 308–42. [4] Ramesh R. Land use in coastal ecosystems and its implication on nutrient biogeochemistry. In: Ramesh R, Ramachandran S, editors. Coastal Urban Environments, New Delhi: Capital; 2003, p. 39–46. [5] Suzuki K, Sanger P. A phytosociological study of mangrove vegetation in Australia with a latitudinal comparison of east Asia. Mangrove Science 1996; 1: 9-27. [6] Chowdhury AK. Changes in mangrove forest soils: a comparison between cultured and naturally inundated conditions. Wetl Ecol Manag 2001; 9: 81-9. [7] Huxham M, Kimani E, Augley J. Mangrove fish: a comparison of community structure between forested and cleared habitats. Estuar Coast Shelf S 2004; 60: 637-47. [8] Tang Y, Yu S, Wu Y. A comparison of macrofauna communities in different mangrove assembleges. Zoological Research 2007; 28 (3): 255-64. [9] Chen L, Tam, NFY, Huang J, Zeng X, Meng X, Zhong C, et al.. Comparison of ecophysiological characteristics between introduced and indigenous mangrove species in China. Estuar Coast Shelf S 2008; 79: 644-52. [10] Luo Z, Sun OJ, Xu H. A comparison of species composition and stand structure between planted and natural mangrove forests in Shenzhen Bay South China. J Plant Ecol 2010; 3: 165-74. [11] Ayukai T, Miller D, Wolanksi E, Spagnol S. Fluxes of nutrients and dissolved and particulate organic matter in two mangrove creeks in northeastern Australia. Mangr Salt Marsh 1998; 2: 223–30. [12] Wolff M. Biomass flow structure and resource potential of two mangrove estuaries: insights from comparative modeling in Costa Rica and Brazil. Rev Biol Trop 2006; 54: 69-86. [13] Leguerrier D, Degre D, Niquil N. Network analysis and inter-ecosystem comparison of two intertidal mudflat food webs (Brouage Mudflat and Aiguillon Cove, SW France). Estuar Coast Shelf S 2007; 74: 403-18. [14] Kuwae T, Hosokawa Y, Eguchi N. Dissolved inorganic nitrogen cycling in Banzu intertidal sand-flat, Japan. Mangr Salt Marsh 1998; 2: 167-75. [15] Chen R, Twilley RR. Patterns of mangrove forest structure and soil nutrient dynamics along the Shark River Estuary, Florida. Estuaries 1999; 22: 955-70. [16] Kristensen E, Suraswadi P. Carbon, nitrogen and phosphorus dynamics in creek water of a southeast Asian mangrove forest. Hydrobiologia 2002; 474: 197-211. [17] Bhunia AB. Ecology of tidal creeks and mudflats of Sagar Island (Sunderbans) West Bengal. PhD dissertation, Calcutta University; 1979. [18] Ghosh PB, Singh BN, Chakraborty C, Saha A, Das RL. Mangrove litter production in a tidal creek of Lothian island of Sundarbans, India. Indian J Mar Sci 1990; 19: 292-3. [19] Saha S, Choudhury A. Vegetation analysis of restored and natural mangrove forest in Sagar Island, Sundarbans, east coast of India. Indian J Mar Sci 1995; 24: 133–6. [20] Mukhopadhyay SK, Biswas H, Das KL, De TK, Jana TK. Diurnal variation of carbon dioxide and methane exchange above Sundarbans mangrove forest, in NW coast of India. Indian J Mar Sci 2001; 30: 70-4. [21] Joshi H, Ghosh M. Forest structure and species distribution along soil salinity and pH gradient in mangrove swamps of the Sundarbans. Trop Ecol 2003; 44: 197-206. [22] Ray S. Comparative study of virgin and reclaimed islands of Sundarban mangrove ecosystem through network analysis. Ecol Model 2008; 215: 207-16. [23] Mandal S, Ray S, Ghosh PB. Modelling of the contribution of dissolve d inorganic nitrogen (DIN) from litterfall of adjacent mangrove forest to Hooghly–Matla estuar y, India. Ecol Model 2009; 220: 2988-3000. [24] Greenberg AE, Clesceri LS, Eaton, AD. (eds.), Standard methods for examination of water and wastewater. American Public Health Association, Washington, D. C., USA; 1992. [25] Soloranzo L, Determination of ammonia in natural waters by phenolhypochlorite method. Limnol Oceanogr 1969; 14: 799 – 801.
362 S. Mandal et al. / Procedia Environmental Sciences 13 (2012) 340 – 362362 S. Mandal et al./ Procedia Environmental Sciences 8 (2011) 340–362
[26] Wood ED, Armstrong FAJ, Richards FA. Determination of nitrate in sea water by cadmium – copper reduction to nitrite. J Mar Biol Assoc 1967; 47: 23–31. [27] De Medina HL, Marin JC, Gutierrez E, Morales J. Nitrogen mobility at the sediment-water interface of lake Maracaibo, Venezuela. Water Air Soil Poll 2003; 145: 341–57. [28] Biswas H, Dey M, Ganguly D, De TK, Ghosh S, Jana TK. Comparative analysis of phytoplankton composition and abundance over a two-decade period at the land–ocean boundary of a tropical mangrove ecosystem. Estuar Coast 2010; 33: 384-94. [29] Bergschneider ER. Determining an appropriate organic matter loading rate for a created coastal plain forested wetland. Masters Thesis, Virginia Polytechnic Institute and State University; 2005. [30] Stanford GM., Frere H, Schwaninger DH. Temperature coefficient of soil nitrogen mineralization. Soil Sci 1973; 115: 321–3. [31] Johnsson H, Bergstrom L, Jansson PE. Simulated nitrogen dynamics and losses in a layered agricultural soil. Agric Ecosyst Environ 1987; 18: 333–56. [32] Mfilinge PE, Atta N, Tsuchiya M. Nutrient dynamics and leaf litter decomposition in a subtropical mangrove forest at Oura Bay, Okinawa, Japan. Trees 2002; 16: 172–80. [33] Wei-Bing G, Lai-Ah W, Dong-Feng X. Modeling nitrogen and phosphorus cycles and dissolved oxygen in the Pearl River (Zhujiang) Estuary. Acta Oceanol Sin 2001; 20: 1-11. [34] Jorgensen SE, Bendoricchio G. Fundamentals of Ecological Modelling. Netherlands: Elsevier; 2001. [35] Burdige DJ, Zeng S. The biogeochemical cycling of dissolved organic nitrogen in estuarine sediments. Limnol Oceanogr 1998; 43: 1796–813. [36] Mukhopadhyay SK, Biswas H, De TK, Jana TK.. Fluxes of nutrients from the tropical river Hooghly at the land-ocean boundary of Sunderbans, NE Coast of Bay of Bengal. India J Marine Syst 2006; 62: 9–21. [37] Roy M, Mandal S, Ray S. Detrital ontogenic model including decomposer diversity. Ecol Model 2008; 215: 200–6. [38] Ghosh PB. Role of macrofauna in energy partitioning and nutrient recycling in a tidal creek of Sunderbans mangrove forest, India. In: Kumar A, editor. Ecology and Ethology of Aquatic Biota. New Delhi: Daya Publishing House; 2001, p. 90-7. [39] Ghatak H, Mukhopadhyay SK, Jana TK, Sen BK, Sen S. Interaction of Cu(II) and Fe(II) with mangal humic substances studied by synchronous flouroscence spectroscopy and potentiometric titration. Wetl Ecol Manag 2004; 12: 145-55. [40] Jorgensen LA, Jorgensen SE, Nielsen SN. ECOTOX, Ecological Modelling and Ecotoxicology. Netherlands: Elsevier; 2000. [41] Davidson EA, Janssens IA. Temperature sensitivity of soil carbondecomposition and feedbacks to climate change. Nature 2006; 440: 165–73. [42] Jorgensen SE, Fundamentals of Ecological Modelling. Netherlands: Elsevier; 1994. [43] McKee KL, Faulkner PL. Restoration of biogeochemical function in mangrove forests. Restor Ecol 2000; 8:247–59. [44] Alongi DM, Ramanathan AL, Kannan L, Tirendi F, Trott LA, Prasad MBK. Influence of human-induced disturbance on benthic microbial metabolism in the Pichavaram mangroves, Vellar–Coleroon estuarine complex, India. Mar Biol 2005; 147: 1033-44. [45] Coleman DC, Crossley Jr DA. Fundamental of Soil Ecology. San Diego, California, USA, Academic Press; 1996. [46] Lacerda LD, Ittekot V, Patchineelam SR. Biogeochemistry of mangrove soil organic matter: a comparison between Rhizophora and Avecennia soils in South-eastern Brazil. Estuar Coast Shelf S 1995; 40: 713-20. [47] Alongi DM. The energetics of mangrove forests. New York: Springer; 2009. [48] Nielsen MG, Christian K, Henriksen PG, Birkmose D. Respiration by mangrove ants Camponotus anderseni during nest submersion associated with tidal inundation in Northern Australia. Physiol Entomol 2006; 31:120–6. [49] Dittmar T, Lara RJ. Driving forces behind nutrient and organic matter dynamics in a mangrove tidal creek in North Brazil. Estuar Coast Shelf S 2001; 52: 249-59.