Comparative study of intraocular pressure measured by non ...
9
Indian Journal of Clinical and Experimental Ophthalmology 2020;6(1):41–49 Content available at: iponlinejournal.com Indian Journal of Clinical and Experimental Ophthalmology Journal homepage: www.innovativepublication.com Original Research Article Comparative study of intraocular pressure measured by non-contact, rebound and goldmann applanation tonometer and their correlation with corneal thickness and true IOP in a general population Santanu Das 1, *, Kiran Kumar L 1 1 Dept. of Opthalmology, Kempegowda Institute of Medical Sciences, Bengaluru, Karnanaka, India ARTICLE INFO Article history: Received 21-09-2019 Accepted 04-01-2020 Available online 17-03-2020 Keywords: Central corneal thickness Goldmann applanation tonometer Intraocular pressure Non-contact tonometer Rebound tonometer True IOP ABSTRACT Aim: To compare the Intraocular Pressure (IOP) measured by Non-contact tonometer (NCT), Rebound tonometer (RBT) and Goldmann Applanation tonometer (GAT) and their correlation with central corneal thickness (CCT) and true IOP. Reliability of each tonometer. Materials and Methods: 500 random patients aged 18 years and above were taken up for the study. Patients with anterior and posterior segment pathologies like corneal ulcer, leukoma, staphyloma, corneal lacerations, ectatic corneal conditions, corneal dystrophies, oedema, perforations, acute angle closure glaucoma, retinal detachments, vitreous haemorrhage and unwilling patients were excluded from the study. IOP was recorded using NCT, RBT and GAT after assessing the patient’s visual acuity. Following IOP measurement, central corneal thickness (CCT) of each patient was measured using pachymetry. All the data were collected and tabulated for statistical analysis to obtain results. Results: The mean CCT in males was 0.5350 mm and in females 0.5340 mm respectively. The mean IOP measured by NCT is 16.43 mm hg whereas the mean IOP measured by GAT is 15.43 mm hg. IOP measured by NCT is significantly higher than the IOP measured by GAT (p<0.001). When NCT and RBT are compared NCT values are significantly higher than that of RBT(p<0.001). Although the mean RBT IOP 15.83 mm hg is higher than the mean GAT IOP of 15.42 mm hg the values are not statistically significant. When correlated with CCT all the tonometers showed significant correlation with GAT showing the strongest correlation. NCT overestimates IOP in normal, thin and thicker corneas when compared to GAT and are statistically significant. RBT also overestimates in the normal and thick corneas when compared to GAT but their values are much closer to GAT values in thinner corneas. The IOP measured by all the 3 tonometers correlated with corrected IOP with NCT showing the best correlation followed by GAT. Conclusion: From the present study we can conclude that IOP measured by NCT and RBT is higher than GAT. NCT values are significantly higher than GAT values in thin and normal corneas whereas it overestimates more in thicker corneas. RBT values are significantly higher than that of GAT in normal and thick corneas. So, it is always advisable to measure the corrected IOP for each patient after considering the CCT. © 2020 Published by Innovative Publication. This is an open access article under the CC BY-NC-ND license (https://creativecommons.org/licenses/by/4.0/) 1. Introduction Glaucoma has been established as the second leading cause of blindness. The treatment of glaucoma focuses mainly on lowering intraocular pressure (IOP). The target IOP is often * Corresponding author. E-mail address: [email protected] (S. Das). set to a level 20% to 30% of IOP reduction, and consequent large IOP reduction beyond 30% or even 40% in cases of advanced glaucoma. Intraocular pressure represents a fundamental factor of ocular health and disease. Intraocular pressure is not only important in the diagnosis and management of glaucoma https://doi.org/10.18231/j.ijceo.2020.010 2395-1443/© 2020 Innovative Publication, All rights reserved. 41
Transcript of Comparative study of intraocular pressure measured by non ...
Indian Journal of Clinical and Experimental Ophthalmology 2020;6(1):41–49
Content available at: iponlinejournal.com
Indian Journal of Clinical and Experimental Ophthalmology
Journal homepage: www.innovativepublication.com
Original Research Article
Comparative study of intraocular pressure measured by non-contact, rebound andgoldmann applanation tonometer and their correlation with corneal thickness andtrue IOP in a general population
Santanu Das1,*, Kiran Kumar L1
1Dept. of Opthalmology, Kempegowda Institute of Medical Sciences, Bengaluru, Karnanaka, India
A R T I C L E I N F O
Article history:Received 21-09-2019Accepted 04-01-2020Available online 17-03-2020
Keywords:Central corneal thicknessGoldmann applanation tonometerIntraocular pressureNon-contact tonometerRebound tonometerTrue IOP
A B S T R A C T
Aim: To compare the Intraocular Pressure (IOP) measured by Non-contact tonometer (NCT), Reboundtonometer (RBT) and Goldmann Applanation tonometer (GAT) and their correlation with central cornealthickness (CCT) and true IOP.Reliability of each tonometer.Materials and Methods: 500 random patients aged 18 years and above were taken up for the study.Patients with anterior and posterior segment pathologies like corneal ulcer, leukoma, staphyloma, corneallacerations, ectatic corneal conditions, corneal dystrophies, oedema, perforations, acute angle closureglaucoma, retinal detachments, vitreous haemorrhage and unwilling patients were excluded from the study.IOP was recorded using NCT, RBT and GAT after assessing the patient’s visual acuity. Following IOPmeasurement, central corneal thickness (CCT) of each patient was measured using pachymetry. All thedata were collected and tabulated for statistical analysis to obtain results.Results: The mean CCT in males was 0.5350 mm and in females 0.5340 mm respectively. The meanIOP measured by NCT is 16.43 mm hg whereas the mean IOP measured by GAT is 15.43 mm hg. IOPmeasured by NCT is significantly higher than the IOP measured by GAT (p<0.001). When NCT andRBT are compared NCT values are significantly higher than that of RBT(p<0.001). Although the meanRBT IOP 15.83 mm hg is higher than the mean GAT IOP of 15.42 mm hg the values are not statisticallysignificant. When correlated with CCT all the tonometers showed significant correlation with GAT showingthe strongest correlation. NCT overestimates IOP in normal, thin and thicker corneas when comparedto GAT and are statistically significant. RBT also overestimates in the normal and thick corneas whencompared to GAT but their values are much closer to GAT values in thinner corneas. The IOP measuredby all the 3 tonometers correlated with corrected IOP with NCT showing the best correlation followed byGAT.Conclusion: From the present study we can conclude that IOP measured by NCT and RBT is higherthan GAT. NCT values are significantly higher than GAT values in thin and normal corneas whereas itoverestimates more in thicker corneas. RBT values are significantly higher than that of GAT in normal andthick corneas. So, it is always advisable to measure the corrected IOP for each patient after considering theCCT.
© 2020 Published by Innovative Publication. This is an open access article under the CC BY-NC-NDlicense (https://creativecommons.org/licenses/by/4.0/)
1. Introduction
Glaucoma has been established as the second leading causeof blindness. The treatment of glaucoma focuses mainly onlowering intraocular pressure (IOP). The target IOP is often
* Corresponding author.E-mail address: [email protected] (S. Das).
set to a level 20% to 30% of IOP reduction, and consequentlarge IOP reduction beyond 30% or even 40% in cases ofadvanced glaucoma.
Intraocular pressure represents a fundamental factor ofocular health and disease. Intraocular pressure is not onlyimportant in the diagnosis and management of glaucoma
https://doi.org/10.18231/j.ijceo.2020.0102395-1443/© 2020 Innovative Publication, All rights reserved. 41
42 Das and Kumar L / Indian Journal of Clinical and Experimental Ophthalmology 2020;6(1):41–49
but also in the assessment of postoperative course of allintraocular surgical interventions.
For almost 50 years GAT has been the gold standard forintraocular pressure measurement but its values are affectedby central corneal thickness, corneal curvature and axiallength, previous corneal surgeries like lasik, keratoplasty,astigmatism and corneal irregularities.
Goldmann applanation tonometer gives correct readingswhen corneal thickness is 500 to 525-micron metre.
Non-contact, rebound tonometer have been found to bereasonable options for screening but their values shouldalways be correlated with corneal thickness in clinicalpractice.
Several studies recently have found that thinner thanaverage corneas underestimate, while thicker than averagecorneas overestimate the true intraocular pressure. Thiseffect has been found to be in the effect of 1mmhg correctionfor every 25-micron metre deviation from a central cornealthickness of 550-micron metre.
Tonometry or the measurement of IOP, the pressure ofthe fluid inside the eye is usually the only modifiable factorin management of all types of glaucoma.
2. Aims and Objectives of the Study
1. To compare the intraocular pressure readings ofNon-contact, Rebound and Goldmann applanationtonometer.
2. To correlate IOP readings with corrected IOP (trueIOP).
3. To correlate intraocular pressure readings with centralcorneal thickness in a general population.
3. Materials and Methods
500 random patients (1000 eyes) attending the ophthalmol-ogy outpatient department above the age of 18 years fromdecember 2017 to July 2019 were included in this study.
After taking a proper informed consent a brief historyof the purpose of their visit was taken for all patients.Following history taking the distant visual acuity waschecked using the Snellen’s chart and the near visionwas checked using the Jaeger’s chart. Once the visiontesting was done if the patient had any refractive erroran Autorefractometer was used to find out the amount ofrefractive error followed by an appropriate correction wasgiven for all patients. Next slit lamp examination wasdone to rule out any anterior segment pathology. This wasfollowed by measurement of the keratometric value usingthe Autorefractometer.
Then the patient’s IOP was recorded first using thenon-contact tonometer followed by rebound tonometer andGoldmann applanation tonometer and all the values wererecorded in a proforma. The central corneal thicknessand the corrected IOP of each patient was recorded using
pachymetry.Following these dilated fundoscopy was done using
the indirect ophthalmoscope. The posterior segment wasevaluated using an ultrasound (B-Scan) if the patient hadany significant cataract or any other media opacities whichobscured the view of the retina.
3.1. Inclusion criteria
People aged 18 years to 90 years with no sex predilection.
3.2. Exclusion criteria
1. Patients with corneal opacities, corneal dystrophies,corneal perforations, infective pathologies like ulcers,leukoma, staphyloma, acute uveitis, corneal oedema,acute congestive glaucoma, corneal ectatic conditions,patients who have undergone Keratoplasty and Refractive surgeries.
2. Patients with posterior segment pathologies like retinaldetachment, vitreous haemorrhages.
3. Patients not willing to be part of study.
4. Results
Table 1: Number of male and female patients
Sex Number PercentagesMale 256 51.2Female 244 48.8Total 500 100.0
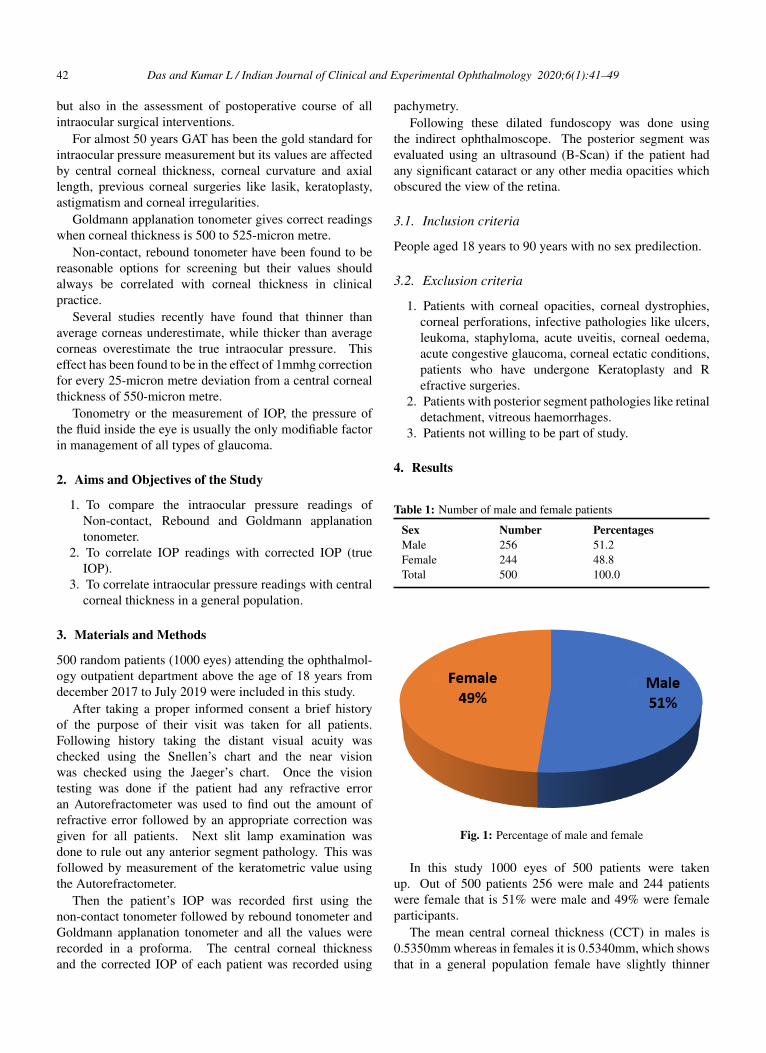
Fig. 1: Percentage of male and female
In this study 1000 eyes of 500 patients were takenup. Out of 500 patients 256 were male and 244 patientswere female that is 51% were male and 49% were femaleparticipants.
The mean central corneal thickness (CCT) in males is0.5350mm whereas in females it is 0.5340mm, which showsthat in a general population female have slightly thinner
Das and Kumar L / Indian Journal of Clinical and Experimental Ophthalmology 2020;6(1):41–49 43
Table 2: Mean CCT in men and women
Male Female P valueMean .5350mm .5340mm 0.041SD .02829 .02604
CCTs when compared to males but are not statisticallysignificant as shown in Table 2.
Table 3: Correlation between NCT IOP and RBT IOP
NCT (mmhg)
ReboundTonometry (mmhg)
p-value
Mean 16.43 15.83Std.Deviation
3.851 2.70 P<0.001
In this study the mean IOP measured by Non-Contacttonometer is 16.43 mm hg whereas the mean IOP measuredby Rebound Tonometer is 15.83 which is significantly lowerthan that of NCT(p<0.001).
Table 4: Correlation between NCT IOP and GAT IOP
NCT (mmhg)
GoldmannApplanationTonometry (mmhg)
p-value
Mean 16.43 15.42 p<0.001Std.Deviation
3.851 2.290
The mean IOP measured by the GAT which is consideredto be the goldstandard is 15.42 mm hg which is significantlylower than the mean IOP measured using NCT which is16.43 mm hg. Thus, when compared with Goldmann,NCT values are higher and are statistically significant in ourstudy.
Table 5: Correlation between RBT IOP and GAT IOP
ReboundTonometry(mm hg)
GoldmannapplanationTonometry (mmhg)
p-value
Mean 15.83 15.42 0.40Std.Deviation
7.866 2.290
When the values of RBT and GAT are compared thevalues of former are higher than that measured by later butare not statistically significant and are also closer to the IOPvalues obtained with GAT. The mean IOP measured by RBTis 15.83 mm hg whereas the mean IOP measured by GATis 15.42 mm hg. The difference between the mean IOPmeasured by RBT and that measured by GAT is far less thanthe difference in the IOP values measured by GAT and NCTand NCT and RBT.
From this intercomparability study we can say IOPvalues obtained using Rebound tonometer are much closerto GAT values which is the gold standard than that obtainedusing NCT.
When CCT was less than 520-micron metre the meanIOP measured using RBT and GAT were 17.02 mm hgand 16.90 mm hg. Although RBT values were higher thanGAT values but were not statistically significant as shown inTable 6.
Table 6: Correlation between RBT IOP and GAT IOP when CCTis <= 520 micron
Central Corneal Thickness <= 520-micron metreRBT GAT P value
IOP in mm hg 17.02 16.90< 0.15SD 3.01 2.76
Sample size 270 270
When the corneal thickness was between 520 –560micron metre, mean IOP measured by RBT and GATwere 15.20 mm hg and 14.91 mm hg. The RBT values werehigher than GAT and were statistically significant as shownin Table 7.
Table 7: Correlation between RBT and GAT IOP when CCT is520-560 micron
Central Corneal Thickness 520- 560micron metreRBT GAT P value
IOP in mm hg 15.20 14.91< 0.001SD 2.49 1.67
Sample size 498 498
When CCT was more than 560-micron metre mean RBTIOP was 16.56 mm hg which is higher than mean GAT valueof 15.41mm hg and are statistically significant as depictedin Table 8.
Table 8: Correlation between RBT and GAT IOP when CCT is >560 micron
Central Corneal Thickness > 560-micron metreRBT GAT P value
IOP in mm hg 16.56 15.41<0.05SD 3.06 3.16
Sample size 79 79
When CCT was less than 520-micron metre the meanIOP measured using NCT and GAT were 16.12 mm hg and16.90 mm hg. NCT values were lower than GAT and werestatistically significant.
When the corneal thickness was between 520 –560micron metre mean IOP measured by NCT and GATwere 16.23 mm hg and 14.91 mm hg. The NCT values werehigher than GAT and were statistically significant.
When CCT was more than 560-micron metre mean NCTIOP was 20.41 mm hg which is higher than mean GAT value
44 Das and Kumar L / Indian Journal of Clinical and Experimental Ophthalmology 2020;6(1):41–49
Table 9: Correlation between NCT and GAT IOP when CCT is<= 520micron metre
Central Corneal Thickness <= 520-micron metreNCT GAT P value
IOP in mm hg 16.12 16.90< 0.001SD 3.98 2.76
Sample size 270 270
Table 10: Correlation between GAT and NCT IOP when CCT is521-560 micron metre
Central Corneal Thickness 521- 560 micron metreNCT GAT P value
IOP in mm hg 16.23 14.91< 0.001SD 3.33 1.67
Sample size 498 498
of 15.41mm hg and are statistically significant as shown inTable 11.
Table 11: Correlation between NCT and GAT IOP when CCT is>560micron metre
Central Corneal Thickness > 560-micron metreNCT GAT P value
IOP in mm hg 20.41 15.41< 0.001SD 5.35 3.16
Sample size 79 79
NCT IOP values increase as the CCT increases whereasGAT IOP is highest when the CCT is less than 520-micronmetre. RBT and GAT over estimates the IOP values morewhen CCT is less than 520-micron metre whereas NCTvalues were less than that of RBT and GAT when CCT isless than 520-micron metre.
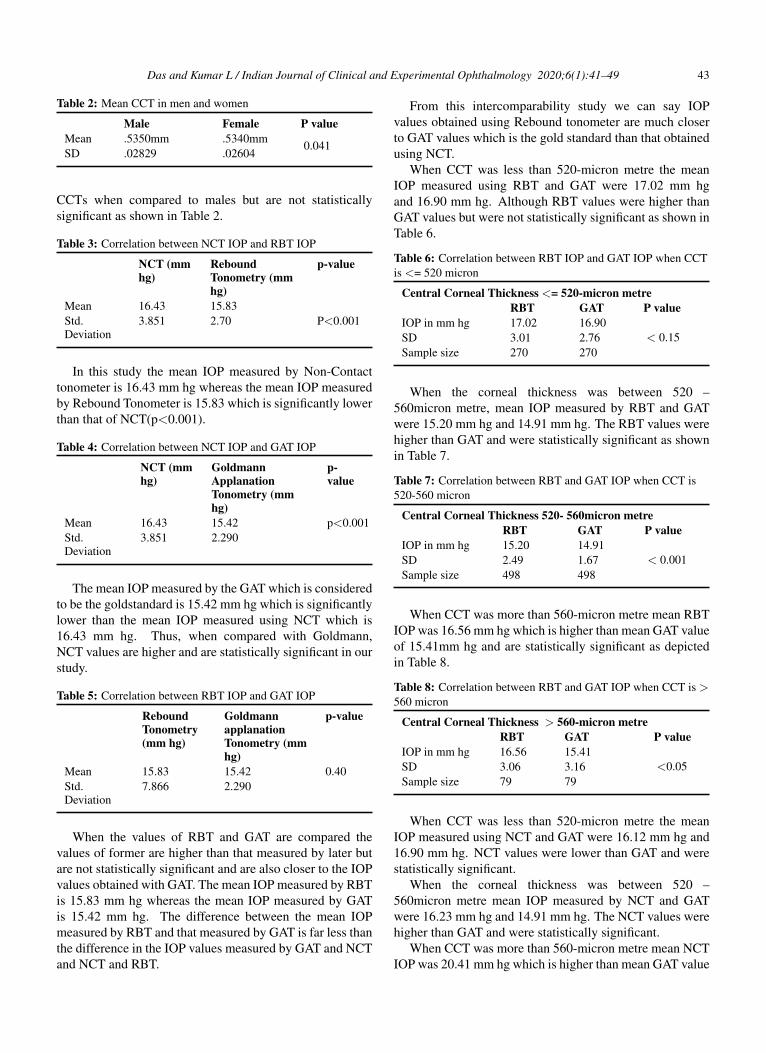
Fig. 2: Correlation between NCT IOP and CCT
Figure 2 is a scatter diagram showing the correlationbetween NCT and CCT. NCT values are correlating withCCT and is statistically significant.
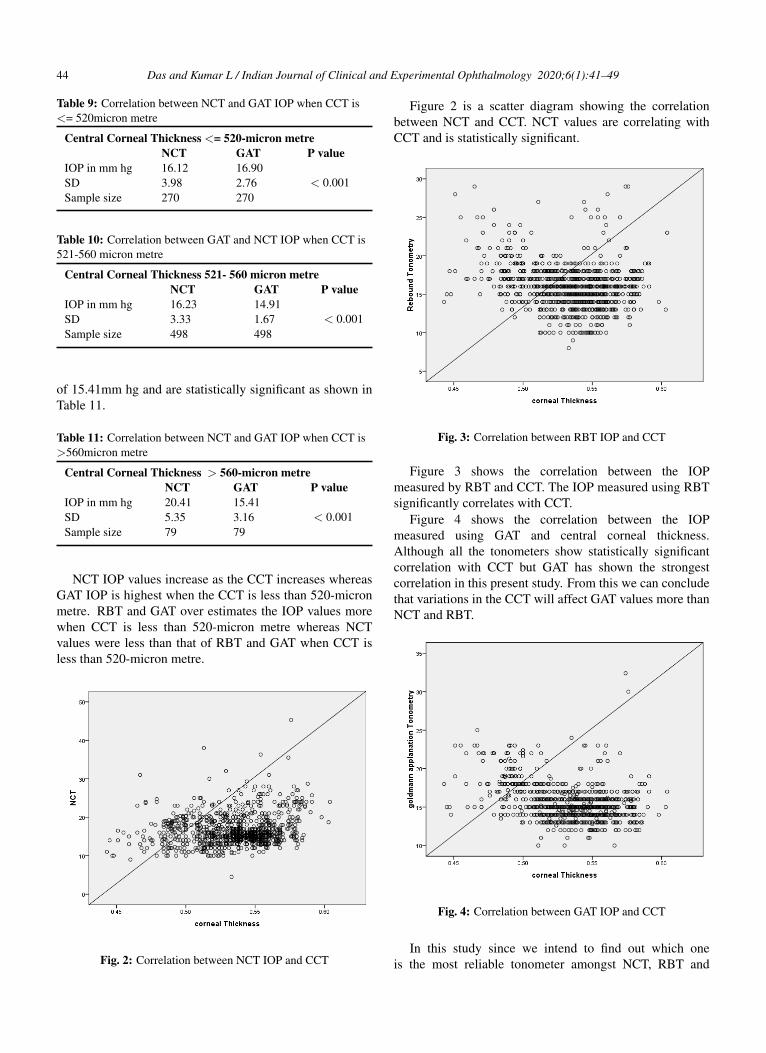
Fig. 3: Correlation between RBT IOP and CCT
Figure 3 shows the correlation between the IOPmeasured by RBT and CCT. The IOP measured using RBTsignificantly correlates with CCT.
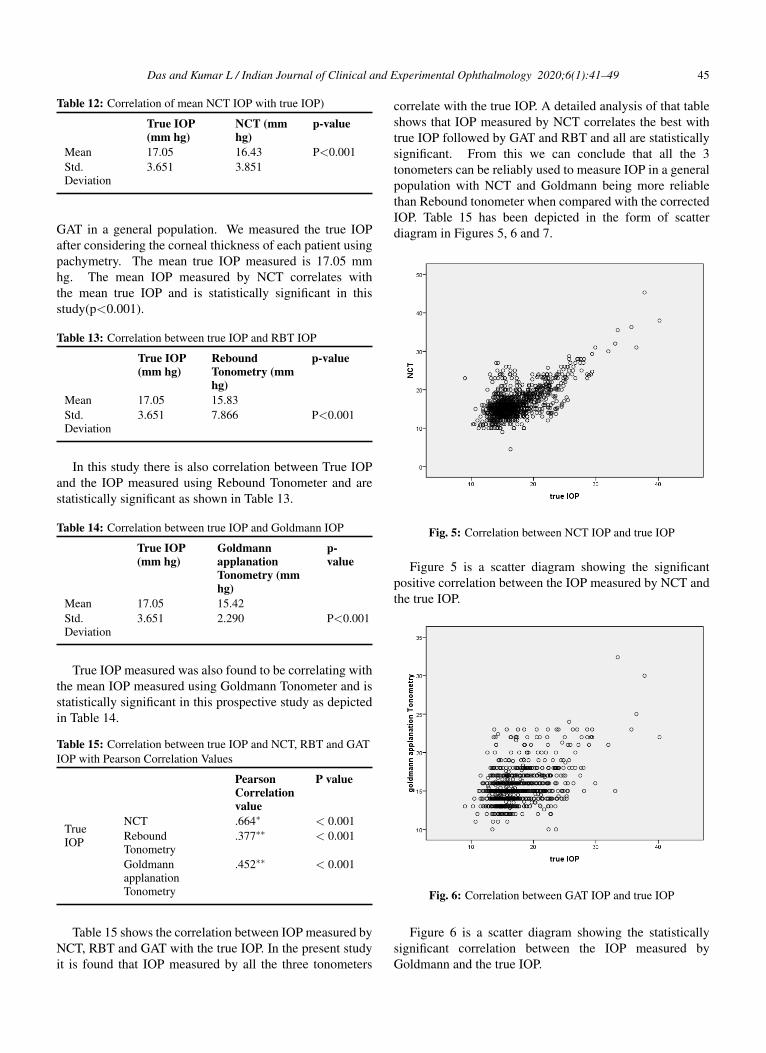
Figure 4 shows the correlation between the IOPmeasured using GAT and central corneal thickness.Although all the tonometers show statistically significantcorrelation with CCT but GAT has shown the strongestcorrelation in this present study. From this we can concludethat variations in the CCT will affect GAT values more thanNCT and RBT.
Fig. 4: Correlation between GAT IOP and CCT
In this study since we intend to find out which oneis the most reliable tonometer amongst NCT, RBT and
Das and Kumar L / Indian Journal of Clinical and Experimental Ophthalmology 2020;6(1):41–49 45
Table 12: Correlation of mean NCT IOP with true IOP)
True IOP(mm hg)
NCT (mmhg)
p-value
Mean 17.05 16.43 P<0.001Std.Deviation
3.651 3.851
GAT in a general population. We measured the true IOPafter considering the corneal thickness of each patient usingpachymetry. The mean true IOP measured is 17.05 mmhg. The mean IOP measured by NCT correlates withthe mean true IOP and is statistically significant in thisstudy(p<0.001).
Table 13: Correlation between true IOP and RBT IOP
True IOP(mm hg)
ReboundTonometry (mmhg)
p-value
Mean 17.05 15.83Std.Deviation
3.651 7.866 P<0.001
In this study there is also correlation between True IOPand the IOP measured using Rebound Tonometer and arestatistically significant as shown in Table 13.
Table 14: Correlation between true IOP and Goldmann IOP
True IOP(mm hg)
GoldmannapplanationTonometry (mmhg)
p-value
Mean 17.05 15.42Std.Deviation
3.651 2.290 P<0.001
True IOP measured was also found to be correlating withthe mean IOP measured using Goldmann Tonometer and isstatistically significant in this prospective study as depictedin Table 14.
Table 15: Correlation between true IOP and NCT, RBT and GATIOP with Pearson Correlation Values
PearsonCorrelationvalue
P value
TrueIOP
NCT .664∗ < 0.001ReboundTonometry
.377∗∗ < 0.001
GoldmannapplanationTonometry
.452∗∗ < 0.001
Table 15 shows the correlation between IOP measured byNCT, RBT and GAT with the true IOP. In the present studyit is found that IOP measured by all the three tonometers
correlate with the true IOP. A detailed analysis of that tableshows that IOP measured by NCT correlates the best withtrue IOP followed by GAT and RBT and all are statisticallysignificant. From this we can conclude that all the 3tonometers can be reliably used to measure IOP in a generalpopulation with NCT and Goldmann being more reliablethan Rebound tonometer when compared with the correctedIOP. Table 15 has been depicted in the form of scatterdiagram in Figures 5, 6 and 7.
Fig. 5: Correlation between NCT IOP and true IOP
Figure 5 is a scatter diagram showing the significantpositive correlation between the IOP measured by NCT andthe true IOP.
Fig. 6: Correlation between GAT IOP and true IOP
Figure 6 is a scatter diagram showing the statisticallysignificant correlation between the IOP measured byGoldmann and the true IOP.
46 Das and Kumar L / Indian Journal of Clinical and Experimental Ophthalmology 2020;6(1):41–49
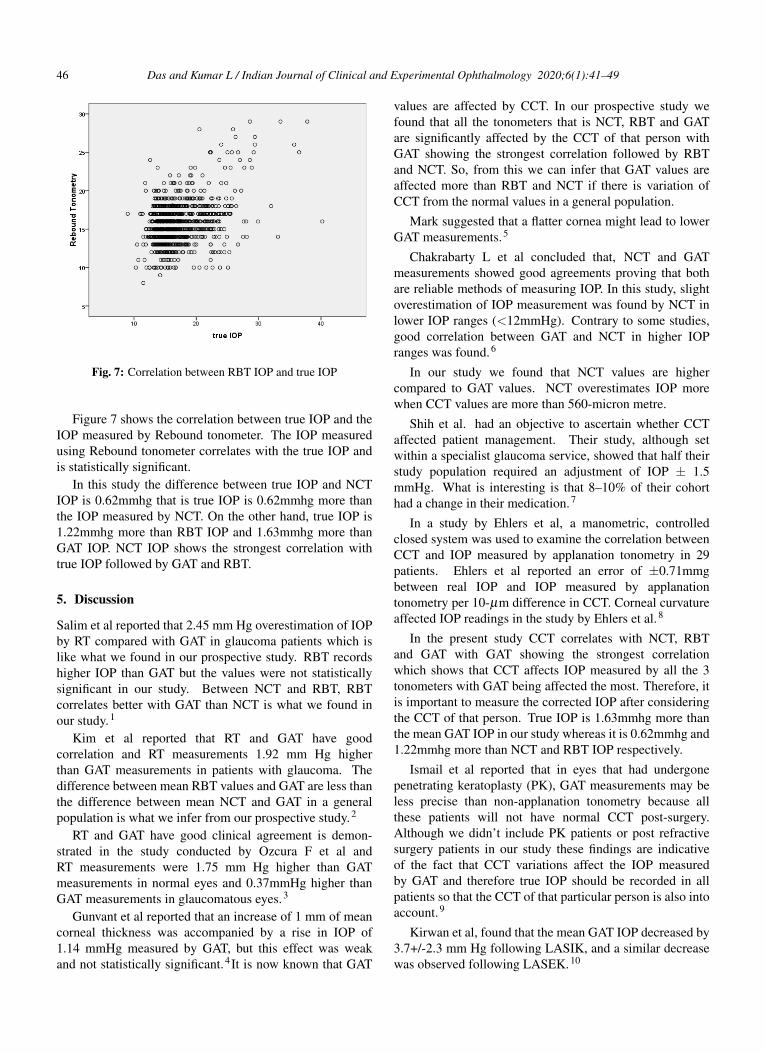
Fig. 7: Correlation between RBT IOP and true IOP
Figure 7 shows the correlation between true IOP and theIOP measured by Rebound tonometer. The IOP measuredusing Rebound tonometer correlates with the true IOP andis statistically significant.
In this study the difference between true IOP and NCTIOP is 0.62mmhg that is true IOP is 0.62mmhg more thanthe IOP measured by NCT. On the other hand, true IOP is1.22mmhg more than RBT IOP and 1.63mmhg more thanGAT IOP. NCT IOP shows the strongest correlation withtrue IOP followed by GAT and RBT.
5. Discussion
Salim et al reported that 2.45 mm Hg overestimation of IOPby RT compared with GAT in glaucoma patients which islike what we found in our prospective study. RBT recordshigher IOP than GAT but the values were not statisticallysignificant in our study. Between NCT and RBT, RBTcorrelates better with GAT than NCT is what we found inour study.1
Kim et al reported that RT and GAT have goodcorrelation and RT measurements 1.92 mm Hg higherthan GAT measurements in patients with glaucoma. Thedifference between mean RBT values and GAT are less thanthe difference between mean NCT and GAT in a generalpopulation is what we infer from our prospective study.2
RT and GAT have good clinical agreement is demon-strated in the study conducted by Ozcura F et al andRT measurements were 1.75 mm Hg higher than GATmeasurements in normal eyes and 0.37mmHg higher thanGAT measurements in glaucomatous eyes.3
Gunvant et al reported that an increase of 1 mm of meancorneal thickness was accompanied by a rise in IOP of1.14 mmHg measured by GAT, but this effect was weakand not statistically significant.4It is now known that GAT
values are affected by CCT. In our prospective study wefound that all the tonometers that is NCT, RBT and GATare significantly affected by the CCT of that person withGAT showing the strongest correlation followed by RBTand NCT. So, from this we can infer that GAT values areaffected more than RBT and NCT if there is variation ofCCT from the normal values in a general population.
Mark suggested that a flatter cornea might lead to lowerGAT measurements.5
Chakrabarty L et al concluded that, NCT and GATmeasurements showed good agreements proving that bothare reliable methods of measuring IOP. In this study, slightoverestimation of IOP measurement was found by NCT inlower IOP ranges (<12mmHg). Contrary to some studies,good correlation between GAT and NCT in higher IOPranges was found.6
In our study we found that NCT values are highercompared to GAT values. NCT overestimates IOP morewhen CCT values are more than 560-micron metre.
Shih et al. had an objective to ascertain whether CCTaffected patient management. Their study, although setwithin a specialist glaucoma service, showed that half theirstudy population required an adjustment of IOP ± 1.5mmHg. What is interesting is that 8–10% of their cohorthad a change in their medication.7
In a study by Ehlers et al, a manometric, controlledclosed system was used to examine the correlation betweenCCT and IOP measured by applanation tonometry in 29patients. Ehlers et al reported an error of ±0.71mmgbetween real IOP and IOP measured by applanationtonometry per 10-µm difference in CCT. Corneal curvatureaffected IOP readings in the study by Ehlers et al.8
In the present study CCT correlates with NCT, RBTand GAT with GAT showing the strongest correlationwhich shows that CCT affects IOP measured by all the 3tonometers with GAT being affected the most. Therefore, itis important to measure the corrected IOP after consideringthe CCT of that person. True IOP is 1.63mmhg more thanthe mean GAT IOP in our study whereas it is 0.62mmhg and1.22mmhg more than NCT and RBT IOP respectively.
Ismail et al reported that in eyes that had undergonepenetrating keratoplasty (PK), GAT measurements may beless precise than non-applanation tonometry because allthese patients will not have normal CCT post-surgery.Although we didn’t include PK patients or post refractivesurgery patients in our study these findings are indicativeof the fact that CCT variations affect the IOP measuredby GAT and therefore true IOP should be recorded in allpatients so that the CCT of that particular person is also intoaccount.9
Kirwan et al, found that the mean GAT IOP decreased by3.7+/-2.3 mm Hg following LASIK, and a similar decreasewas observed following LASEK.10
Das and Kumar L / Indian Journal of Clinical and Experimental Ophthalmology 2020;6(1):41–49 47
Milla et al. found an optimal agreement between DCTand GAT when the CCT was between 540 and 545 µm. Asthe CCT and the IOP increase, the difference between bothtonometers also increases.11
Iliev, Goldblum, Katsoulis et al concluded thatagreement of IOP readings between rebound and GAT wasmoderate to good. There was a systemic trend of RBTto higher readings +/- 3mm hg from GAT.CCT seems toinfluence IOP readings in rebound tonometry as it does inGAT.12
In our study RBT values although higher than thatrecorded with GAT are not statistically significant andvalues are closer to GAT measured IOP values whencompared with NCT.
S. Nagarajan et al concluded that both Schiotz andNCT showed significant correlation with the gold standardtechnique over a range of IOP and CCT with the Schiotztonometer performing better than NCT.
13
In two studies in which the Reichert NCT was used(Jorge et al. 2002; Jorge et al. 2003) in normalsubjects and patients with glaucoma, excellent agreementwith GAT measurements was observed which is contraryto what we found in our study where there was significantdifference between NCT and GAT readings with NCTreadings being significantly higher than GAT readings in ageneral population as CCT increases. NCT overestimatesmore in thicker corneas than GAT.14
In our study NCT IOP shows good correlation with thecorrected IOP followed by GAT and RBT.
However, Domke et al. 2006 noted that measurementsof Reichert NCT are conditioned by CCT. which is similarto our findings where NCT readings were influenced byCCT.15
NCT values were higher as CCT increases (for thickerCCTs) whereas RBT and GAT overestimates or showshigher IOP values when CCT is less than 520-micron metrewhich is what we found in our study.
It is well known that GAT is affected by CCT (Whitacreet al. 1993) , and some recent studies have shown similarresults for I-Care (Brusini et al. 2006; Iliev et al. 2006;Nakamura et al. 2006) which is in accordance to what wefound in our study.12,16–19
Tamcelik et al reported an overestimation of I-Careanalysis in the low GAT-measured IOPs, whereas I-Careunderestimated IOPs in high pressure ranges.20
A higher IOP with I-Care than with GAT has generallybeen found in most previous studies (Iliev et al. 2006;Nakamura et al.2006), although inconsistent results exist(Brusini et al. 2006).12,16,19
In another study, Tonnu et al. compared NCT, TPXL,and GAT and reported that all three devices showed homologous results.21
Parker et al. compared NCT and GAT and found resultswere concordant between the two devices which is different
from what we found in our large prospective study whereNCT values were significantly higher than GAT values.22
Farhood showed that NCT and GAT were not wellcorrelated, and NCT measurements gave higher IOP resultsregardless of the patient’s age or sex. When the GATmeasurement exceeded 24 mmHg, the difference in readingsbetween the two instruments increased. Farhood reportedthat lower the IOP measured by GAT, the more reliablethe corresponding NCT readings.23 This is in accordanceto what we reported in our study.
The NCT and TPXL are easier and faster to use thanGAT, but suspicions about their results still exist. Yilmazet al. found no significant differences between these threedevices in normotensive patients which is contrary to whatwe found in this study.24
Feng et al. also found the rebound and noncontacttonometry to overestimate IOP relative to GAT for thickerCCT.25
We also found that NCT overestimates IOP whencompared with GAT for CCT values greater than 560-micron metre.
There was a significant agreement between the RT andthe GAT measurements. RT can be considered as a reliablealternative when IOP measurement with GAT is not feasiblehas been stated by Kyung Sik Lee et al.26
Ozcura F et al found a weak and statistically insignificantcorrelation between CCT and IOP measurements in all typesof tonometers in all group.4
Lee SY et al said in their study central corneal thickness(CCT), corneal curvature (CC), and axial length (AXL)demonstrated significant correlation with GAT fluctuation inthe high IOP fluctuation group, and AXL showed significantcorrelation with DCT fluctuation in the low IOP fluctuationgroup. We only found CCT to significantly affect IOPreadings in all the 3 tonometers used by us namely NCT,RBT and GAT.27
Cook et al. conducted a meta-analytical study comparing8 tonometers and concluded that GAT continues to be thegold standard. It was observed that NCT was having leastdisagreement with GAT which is again contrary to what wefound in the present study.28
Munkwitz et al. observed that there was a moderateagreement between RT and GAT in normal to moderateelevated IOP, and a poor agreement in the higher IOPrange.29
Although NCT is also widely used the correlationobserved between measurements obtained using this typeof tonometry and conventional applanation tonometry hasnever been particularly good (Vernon 1995; Tonnu etal. 2005; Lafaut et al. 2007; Ogbuehi & Almubrad2008).21,30–33
Several studies have evaluated the RBT and most ofthese have detected slight overestimation with respect toGAT and a similar influence of corneal thickness on its
48 Das and Kumar L / Indian Journal of Clinical and Experimental Ophthalmology 2020;6(1):41–49
measures (Lopez Caballero et al. 2007; Pakrou et al. 2008;Johannesson et al. 2008; Abraham et al. 2008).34–37
Studies conducted by (Grieshaber MC et al, KamppeterBA et al, Kaufmann C et al) have reported a significantpositive correlation between GAT and CCT which is similarto our findings.38–40
On the other hand, studies conducted by Schneider Eet al, Kniestedt C et al, Ku JY et al found no correlationbetween GAT values and central corneal thickness which iscontrary to what we found.41–43
Y. Harada et al found central corneal thicknesssignificantly correlated with IOP measured by NCT and thatmeasured by GAT which is in accordance with our study.44
Punit Singh et al concluded that IOP measured by bothNCT and GAT was significantly correlated with CCT.NCT readings were significantly higher in the thickergroup (CCT>or=530 micron) than in the thinner group(CCT<530 micron). GAT readings had no differencebetween the thicker and thinner groups.45
In our study NCT overestimates IOP when CCT is morethan 560-micron metre whereas GAT overestimates IOPwhen CCT is less than 520-micron metre.
Babalola et al and Tonnu et al also showed that changesin IOP measured with NCT are more dependent on CCTthan IOP measured by Goldmann tonometer.
21,46
In our study IOP measured by GAT was found to be moreaffected by changes in CCT than NCT and RBT.
Behrooz Kouchaki et al found a linear relationshipbetween IOP and CCT.47
6. Conclusion
IOP measurement is one of the most important investigationthat an ophthalmologist will do in his daily practise. Ithas got immense importance as it is one of the risk factorsof glaucoma and is also the only modifiable risk factor inglaucoma. So, an accurate measurement of the IOP is ofparamount importance in the general population in order tosay whether the person is at risk of developing glaucoma.
Goldmann applanation tonometer has been the goldstandard for measuring IOP since it was discovered.Although it has been the gold standard it has its ownadvantage and disadvantages. Many other tonometers arethere which work on the applanation principle as well as onother principles but has not been able to replace Goldmannas the goldstandard.
It has been well documented in literature that Goldmannvalues are affected by CCT and there are disadvantages likechances of infection and there is a learning curve to mentiona few.
We conclude that NCT values were higher than thatof GAT and RBT and were statistically significant. NCTvalues were higher for thicker CCT whereas RBT and GATvalues were higher for thinner CCT. RBT values were alsohigher than that of GAT but the values were not statistically
significant. Also, the mean RBT IOP value was closer to themean GAT IOP value. Also, CCT significantly correlateswith all the three tonometer values with GAT showingthe strongest correlation. When compared with the trueIOP all the tonometers showed good correlation with NCTshowing the best correlation followed by GAT. So, from thepresent study we can conclude that all the 3 tonometersare reliable and can be used in the daily practice of anophthalmologist. When CCT was considered we found itaffected GAT readings the most followed by RBT and NCT.So, it is always advisable to calculate the corrected IOP inall patients so that we can get the exact IOP for a person.
7. Source of Funding
None.
8. Conflict of Interest
None.
References1. Salim S, Du H, Wan J. Comparison of Intraocular Pressure
Measurements and Assessment of Intraobserver and InterobserverReproducibility With the Portable ICare Rebound Tonometer andGoldmann Applanation Tonometer in Glaucoma Patients. JGlaucoma. 2013;22(4):325–329.
2. Kim KN, Jeoung JW, Park KH, Yang MK, Kim DM. Comparison ofthe new rebound tonometer with Goldmann applanation tonometer ina clinical setting. Acta Ophthalmol. 2013;91(5):392–396.
3. Ozcura F, Yildirim N, Sahin A, Colak E. Comparison of Goldmannapplanation tonometry, rebound tonometry and dynamic contourtonometry in normal and glaucomatous eyes. Int J Ophthalmol.2015;8(2):299–304.
4. Gunvant P, Baskaran M, Vijaya L, Joseph IS, Watkins RJ, et al. Effectof corneal parameters on measurements using the pulsatile ocularblood flow tonograph and Goldmann applanation tonometer. Br JOphthalmol. 2004;88(4):518–522.
5. Mark HH. Corneal curvature in applanation tonometry. Am JOphthalmol. 1973;76(2):223–224.
6. Chakrabarty L. Goldmann applanation tonometry versus non-contacttonometry: a comparative study. Int J Res Med Sci. 2016;4:4683–4687.
7. Shih CY, Graff-Zivin JS, Trokel SL, Tsai JC. Clinical significanceof central corneal thickness in the management of glaucoma. ArchOphthalmol. 2004;122:1270–1275.
8. Ehlers N, Bramsen T, Sperling S. Applanation tonometry and centralcorneal thickness. Acta Ophthalmol (Copen). 1975;53:34–43.
9. Ismail AR, Lamont M, Perera S, Khan-Lim D, Mehta R, et al.Comparison of IOP measurement using GAT and DCT in patients withpenetrating keratoplasties. Br J Ophthalmol. 2007;91(7):980–981.
10. Kirwan C, Keefe O, M. Measurement of intraocular pressure LASIKand LASEK patients using the Reichert Ocular Response Analyzerand Goldmann applanation tonometry. J Refract Surg. 2008;24:366–370.
11. Milla E, Duch S, Buchacra O, Masuet C. Poor agreement betweenGoldmann and Pascal tonometry in eyes with extreme pachymetry.Eye. 2009;23(3):536–542.
12. Iliev DME, Goldblum, Katsoulis C, Amstutz B, Frueh. Comparisonof rebound tonometry with GAT and correlation with CCT. Br JOphthalmol. 2006;90:833–835.
13. Nagarajan S, Velayutham V, Ezhumalai G. Comparative evaluationof applanation and indentation tonometers in a community
Das and Kumar L / Indian Journal of Clinical and Experimental Ophthalmology 2020;6(1):41–49 49
ophthalmology setting in Southern India. Saudi J Ophthalmol.2016;30(2):83–87.
14. Jorge J, Diaz-Rey JA, Gonzalez-Meijome JM, Almeida JB, ParafitaMA. Clinical performance of the Reichert AT550: a new non-contacttonometer. Ophthalmic Physiol Opt. 2002;22(6):560–564.
15. Domke N, Hager A, Wiegand W. Intraocular pressure andcorneal thickness. A comparison between non-contact tonometry andapplanation tonometry . Ophthalmologe. 2006;103(7):583–587.
16. Brusini P, Salvetat ML, Zeppieri M, Tosoni C, Parisi L. Comparisonof ICare Tonometer with Goldmann Applanation Tonometer inGlaucoma Patients. J Glaucoma. 2006;15(3):213–217.
17. Nakamura M, Darhad U, Tatsumi Y, Fujioka M, Kusuhara A, et al.Agreement of Rebound Tonometer in Measuring Intraocular PressureWith Three Types of Applanation Tonometers. Am J Ophthalmol .2006;142(2):332–334.
18. Whitacre MM, Stein RA, Hassanein K. The Effect of CornealThickness on Applanation Tonometry. Am J Ophthalmol.1993;115(5):592–596.
19. Whitacre MM, Stein R. Sources of error with use of Goldmann-typetonometers. Survey Ophthalmol. 1993;38(1):1–30.
20. Tamcelik N, Atalay E, Cicik E, Ozkok A. Comparability of I-carewith Goldmann and noncontact tonometer in a wide range of IOP andcentral corneal thickness. Ophthalmic Res. 2015;54:18–25.
21. Tonnu PA, Ho T, Newson T, Sheikh AE, Sharma K, et al. The influenceof central corneal thickness and age on intraocular pressure measuredby pneumotonometry, non-contact tonometry, the Tono-Pen XL, andGoldmann applanation tonometry. Br J Ophthalmol . 2005;89(7):851–854.
22. Parker VA, Herrtage J, Sarkies NJ. Clinical comparison of KeelerPulsair 3000 with Goldmann applanation tonometry. Br J Ophthalmol.2001;85:1301–1304.
23. Farhood Q. Comparative evaluation of intraocular pressure with anair-puff tonometer versus a Goldmann applanation tonometer. ClinOphthalmol. 2012;7:23–27.
24. Yilmaz I, Altan C, Aygit ED, Alagoz C, Baz O, et al. Comparisonof three methods of tonometry in normal subjects: Goldmannapplanation tonometer, non-contact airpuff tonometer, and Tono-PenXL. Clin Ophthalmol. 2014;8:1069–1074.
25. Feng C, Shian. Comparison of Intraocular Pressure MeasurementsObtained by Rebound, Noncontact, and Goldmann ApplanationTonometry in Children. Am J Ophthalmol;160:937–943.
26. Lee KS, Kim SK, Kim EK, Kim TI. Comparison of IntraocularPressure Measured by Non-Contact Tonometer, Rebound Tonometer,Tono-Pen, and Goldmann Applanation Tonometer. J KoreanOphthalmol Soc. 2014;55(1):47–53.
27. Lee SY, Bae HW, Kwon HJ, Seong GJ, Kim CY. Utility ofGoldmann applanation tonometry for monitoring intraocular pressurein glaucoma patients with a history of laser refractory surgery. PLoSONE. 2018;13(2):192344.
28. Cook JA, Botello AP, Elders A, Ali AF, Azuara-Blanco A, et al.Systematic Review of the Agreement of Tonometers with GoldmannApplanation Tonometry. Ophthalmol. 2012;119(8):1552–1557.
29. Munkwitz S, Elkarmouty A, Hoffmann EM, Pfeiffer N, ThiemeH. Comparison of the iCare rebound tonometer and the Goldmannapplanation tonometer over a wide IOP range. Graefes Arch Clin ExpOphthalmol. 2008;246(6):875–879.
30. Vernon SA. Reproducibility of Keeler Pulsair 2000 non-contacttonometer. Br J Ophthalmol. 1995;79:554–557.
31. Lafaut AS, malderen LV, Zeyen T. Is Pulse Synchronized Pneu-motonometry More Reproducible than Routine Pneumotonometry andMore in Agreement with Goldmann Applanation Tonometry? Eur JOphthalmol. 2007;17(2):178–182.
32. Ogbuehi KC, Almubrad TM. Accuracy and Reliability of theKeeler Pulsair EasyEye Non-Contact Tonometer. Optom Vis Sci.2008;85(1):61–66.
33. Ogbuehi KC. Assessment of the accuracy and reliability of the TopconCT80 non-contact tonometer. Clin Exp Optom. 2008;89:310–314.
34. Lopez-Caballero C, Contreras I, Munoz-Negrete FJ, Rebolleda G,Cabrejas L, Marcelo P. Rebound tonometry in a clinical setting.Comparison with applanation tonometry. Arch Soc Esp Oftalmol.2007;82:273–278.
35. Johannesson G, Hallberg P, Eklund A, Linden C. Pascal, ICareand Goldmann applanation tonometry - a comparative study. ActaOphthalmol. 2008;86(6):614–621.
36. Pakrou N, Gray T, Mills R, Landers J, Craig J. Clinical Comparisonof the Icare Tonometer and Goldmann Applanation Tonometry. JGlaucoma. 2008;17(1):43–47.
37. Abraham LM, Epasinghe NC, Selva D, Casson R. Comparison of theIcare rebound tonometer with the Goldmann applanation tonometer byexperienced and inexperienced tonometrists. Eye. 2008;22:503–506.
38. Grieshaber MC. Effect of Central Corneal Thickness on DynamicContour Tonometry and Goldmann Applanation Tonometry inPrimary Open-angle Glaucoma. Arch Ophthalmol. 2007;125(6):740–740.
39. Kamppeter BA, Jonas JB. Dynamic Contour Tonometry for Intraocu-lar Pressure Measurement. Am J Ophthalmol . 2005;140(2):318–320.
40. Kaufmann C, Bachmann LM, Thiel MA. Comparison of DynamicContour Tonometry with Goldmann Applanation Tonometry. InvestOphthalmol Vis Sci . 2004;45(9):3118–3121.
41. Schneider E, Grehn F. Intraocular Pressure Measurement-Comparisonof Dynamic Contour Tonometry and Goldmann ApplanationTonometry. J Glaucoma. 2006;15(1):2–6.
42. Kniestedt C, Lin S, Choe J. Clinical Comparison of Contour andApplanation Tonometry and Their Relationship to Pachymetry. ArchOphthalmol . 2005;123(11):1532–1537.
43. Ku JYF, Danesh-Meyer HV, Craig JP, Gamble GD, McGhee CNJ.Comparison of intraocular pressure measured by Pascal dynamiccontour tonometry and Goldmann applanation tonometry. Eye.2006;20(2):191–198.
44. Harada Y, Hirose N, Kubota T, Tawara A. The Influence ofCentral Corneal Thickness and Corneal Curvature on IntraocularPressure Measured by Different Tonometers; Non-Contact andGoldmann Applanation Tonometers. Invest Ophthalmol Vis Sci.2006;47(13):4457.
45. Singh P, Kothari R, Patel H. The influence of central cornealthickness on intraocular pressure, measured by different tonometers:Noncontact and Goldmann applanation tonometers. Natl J Med Res.2017;7(1).
46. Babalola OE, Kehinde AV, Iloegbunam AC, Akinbinu T, MoghaluC, Onuoha I. A comparison of the Goldmann applanation andnon-contact (Keeler Pulsair EasyEye) tonometers and the effect ofcentral corneal thickness in indigenous African eyes. Physiol Opt.2009;29(2):182–188.
47. Kouchaki B, Hashemi H, Yekta A, khabazkhoob M. Comparison ofcurrent tonometry techniques in measurement of intraocular pressure.J Curr Ophthalmol. 2017;29(2):92–97.
Author biography
Santanu Das Final Year Post Graduate
Kiran Kumar L Associate Professor
Cite this article: Das S, Kumar L K. Comparative study ofintraocular pressure measured by non-contact, rebound andgoldmann applanation tonometer and their correlation with cornealthickness and true IOP in a general population. Indian J Clin ExpOphthalmol 2020;6(1):41-49.