Comparative Profiling of Metastatic 4T1- vs. Non ...
19
ORIGINAL RESEARCH published: 17 December 2019 doi: 10.3389/fimmu.2019.02928 Frontiers in Immunology | www.frontiersin.org 1 December 2019 | Volume 10 | Article 2928 Edited by: Benjamin Frey, University of Erlangen Nuremberg, Germany Reviewed by: Reiner Strick, University Hospital Erlangen, Germany Michaela Jung, Goethe University Frankfurt, Germany *Correspondence: Jonas Steenbrugge [email protected] † These authors share last authorship Specialty section: This article was submitted to Cancer Immunity and Immunotherapy, a section of the journal Frontiers in Immunology Received: 04 September 2019 Accepted: 28 November 2019 Published: 17 December 2019 Citation: Steenbrugge J, Vander Elst N, Demeyere K, De Wever O, Sanders NN, Van Den Broeck W, Dirix L, Van Laere S and Meyer E (2019) Comparative Profiling of Metastatic 4T1- vs. Non-metastatic Py230-Based Mammary Tumors in an Intraductal Model for Triple-Negative Breast Cancer. Front. Immunol. 10:2928. doi: 10.3389/fimmu.2019.02928 Comparative Profiling of Metastatic 4T1- vs. Non-metastatic Py230-Based Mammary Tumors in an Intraductal Model for Triple-Negative Breast Cancer Jonas Steenbrugge 1,2,3 *, Niels Vander Elst 1 , Kristel Demeyere 1 , Olivier De Wever 3,4 , Niek N. Sanders 3,5 , Wim Van Den Broeck 6 , Luc Dirix 2 , Steven Van Laere 2† and Evelyne Meyer 1,3† 1 Laboratory of Biochemistry, Department of Pharmacology, Toxicology and Biochemistry, Faculty of Veterinary Medicine, Ghent University, Merelbeke, Belgium, 2 Translational Cancer Research Unit Antwerp, Center for Oncological Research, General Hospital Sint-Augustinus, Wilrijk, Belgium, 3 Cancer Research Institute Ghent, Ghent, Belgium, 4 Laboratory of Experimental Cancer Research, Department of Human Structure and Repair, Ghent University, Ghent, Belgium, 5 Laboratory of Gene Therapy, Department of Nutrition, Genetics and Ethology, Faculty of Veterinary Medicine, Ghent University, Merelbeke, Belgium, 6 Department of Morphology, Faculty of Veterinary Medicine, Ghent University, Merelbeke, Belgium The transition of ductal carcinoma in situ (DCIS) to invasive carcinoma (IC) in breast cancer can be faithfully reproduced by the intraductal mouse model. Envisaging to use this model for therapeutic testing, we aimed to in-depth characterize the tumor immunity associated with the differential progression of two types of intraductal tumors. More specifically, we focused on triple-negative breast cancer (TNBC) and intraductally inoculated luciferase-expressing metastatic 4T1 and locally invasive Py230 cells in lactating mammary glands of syngeneic BALB/c and C57BL/6 female mice, respectively. Although the aggressive 4T1 cells rapidly formed solid tumors, Py230 tumors eventually grew to a similar size through enhanced proliferation. Yet, ductal tumor cell breakthrough and metastasis occurred earlier in the 4T1- compared to the Py230-based intraductal model and was associated with high expression of matrix metalloproteinase (MMP)-9, vascular endothelial growth factor (VEGF), chitinase 3-like 1 (CHI3L1) and lipocalin 2 (LCN2) as well as an increased influx of immune cells (mainly macrophages, neutrophils and T-cells). Moreover, activated cytotoxic T-cells, B-cells and programmed death-1 (PD-1)-positive cells were more prominent in the 4T1-based intraductal model in line with enhanced pro-inflammatory cytokine and gene expression profiles. Py230-based tumors showed a more immunosuppressed anti-inflammatory profile with a high amount of regulatory T-cells, which may account for the decreased T-cell activation but increased proliferation compared to the 4T1-based tumors. Taken together, our results highlight the differential immunological aspects of aggressive metastatic and non-aggressive intraductal progression of 4T1- vs. Py230-based tumors, providing a base for future studies to explore therapy using these intraductal TNBC models. Keywords: triple-negative breast cancer, intraductal model, 4T1 mammary tumor cells, Py230 mammary tumor cells, tumor immunology
Transcript of Comparative Profiling of Metastatic 4T1- vs. Non ...

ORIGINAL RESEARCHpublished: 17 December 2019
doi: 10.3389/fimmu.2019.02928
Frontiers in Immunology | www.frontiersin.org 1 December 2019 | Volume 10 | Article 2928
Edited by:
Benjamin Frey,
University of Erlangen
Nuremberg, Germany
Reviewed by:
Reiner Strick,
University Hospital Erlangen, Germany
Michaela Jung,
Goethe University Frankfurt, Germany
*Correspondence:
Jonas Steenbrugge
†These authors share last authorship
Specialty section:
This article was submitted to
Cancer Immunity and Immunotherapy,
a section of the journal
Frontiers in Immunology
Received: 04 September 2019
Accepted: 28 November 2019
Published: 17 December 2019
Citation:
Steenbrugge J, Vander Elst N,
Demeyere K, De Wever O,
Sanders NN, Van Den Broeck W,
Dirix L, Van Laere S and Meyer E
(2019) Comparative Profiling of
Metastatic 4T1- vs. Non-metastatic
Py230-Based Mammary Tumors in an
Intraductal Model for Triple-Negative
Breast Cancer.
Front. Immunol. 10:2928.
doi: 10.3389/fimmu.2019.02928
Comparative Profiling of Metastatic4T1- vs. Non-metastaticPy230-Based Mammary Tumors in anIntraductal Model for Triple-NegativeBreast CancerJonas Steenbrugge 1,2,3*, Niels Vander Elst 1, Kristel Demeyere 1, Olivier De Wever 3,4,
Niek N. Sanders 3,5, Wim Van Den Broeck 6, Luc Dirix 2, Steven Van Laere 2† and
Evelyne Meyer 1,3†
1 Laboratory of Biochemistry, Department of Pharmacology, Toxicology and Biochemistry, Faculty of Veterinary Medicine,
Ghent University, Merelbeke, Belgium, 2 Translational Cancer Research Unit Antwerp, Center for Oncological Research,
General Hospital Sint-Augustinus, Wilrijk, Belgium, 3Cancer Research Institute Ghent, Ghent, Belgium, 4 Laboratory of
Experimental Cancer Research, Department of Human Structure and Repair, Ghent University, Ghent, Belgium, 5 Laboratory
of Gene Therapy, Department of Nutrition, Genetics and Ethology, Faculty of Veterinary Medicine, Ghent University,
Merelbeke, Belgium, 6Department of Morphology, Faculty of Veterinary Medicine, Ghent University, Merelbeke, Belgium
The transition of ductal carcinoma in situ (DCIS) to invasive carcinoma (IC) in breast
cancer can be faithfully reproduced by the intraductal mouse model. Envisaging to
use this model for therapeutic testing, we aimed to in-depth characterize the tumor
immunity associated with the differential progression of two types of intraductal tumors.
More specifically, we focused on triple-negative breast cancer (TNBC) and intraductally
inoculated luciferase-expressing metastatic 4T1 and locally invasive Py230 cells in
lactating mammary glands of syngeneic BALB/c and C57BL/6 female mice, respectively.
Although the aggressive 4T1 cells rapidly formed solid tumors, Py230 tumors eventually
grew to a similar size through enhanced proliferation. Yet, ductal tumor cell breakthrough
and metastasis occurred earlier in the 4T1- compared to the Py230-based intraductal
model and was associated with high expression of matrix metalloproteinase (MMP)-9,
vascular endothelial growth factor (VEGF), chitinase 3-like 1 (CHI3L1) and lipocalin 2
(LCN2) as well as an increased influx of immune cells (mainly macrophages, neutrophils
and T-cells). Moreover, activated cytotoxic T-cells, B-cells and programmed death-1
(PD-1)-positive cells were more prominent in the 4T1-based intraductal model in line
with enhanced pro-inflammatory cytokine and gene expression profiles. Py230-based
tumors showed a more immunosuppressed anti-inflammatory profile with a high amount
of regulatory T-cells, which may account for the decreased T-cell activation but increased
proliferation compared to the 4T1-based tumors. Taken together, our results highlight
the differential immunological aspects of aggressive metastatic and non-aggressive
intraductal progression of 4T1- vs. Py230-based tumors, providing a base for future
studies to explore therapy using these intraductal TNBC models.
Keywords: triple-negative breast cancer, intraductal model, 4T1 mammary tumor cells, Py230 mammary tumor
cells, tumor immunology

Steenbrugge et al. Intraductal Tumor Progression and Immunology
INTRODUCTION
Breast cancer is the most frequently diagnosed and deadlycancer in women (1). At the initial stage, breast tumors typicallyremain inside the mammary ducts (i.e., ductal carcinoma in situ,DCIS), but then may quickly become invasive in the surroundingfat tissue and metastasize to distant organs. Although theimmune system is primed to attack tumor cells during thisdisease process, it mostly fails to stop the overall breast tumorprogression. It stands for reason that immunotherapy, that aimsat restoring the anti-tumor immune response, may be effectivein quenching breast cancer (2). Mouse models that replicatehuman breast cancer play an essential role in the preclinicalscreening of such drugs. To this end, we and others haveshown that inoculation of mammary tumor cells in the murinemammary ductal environment, also referred to as the mouseintraductal (MIND) model, provides a significant advantageover the classical fat pad model as it allows to monitor diseaseprogression from early DCIS to invasive carcinoma (IC) (3–10).Recently, we at first identified the stimulatory role of macrophagepolarization in ductal breakthrough and metastatic progressionin triple-negative breast cancer (TNBC) using a model basedon intraductal inoculation of 4T1 mammary tumor cells insyngeneic BALB/cmice, suggesting that macrophage polarizationis a potential immunotherapeutic target (4). Nevertheless, a morethorough knowledge of tumor immunological processes duringthe in situ, invasive and metastatic phases of breast cancerdevelopment is warranted to further validate this innovativeintraductal model as a screening tool for therapy.
In the current study, we characterized the immune landscapewithin the intraductal model, focusing on TNBC. Morespecifically, we intraductally inoculated and compared thegrowth and tumor immunology of the aggressive BALB/c-derived 4T1 cell line vs. the slowly growing C57BL/6-derivedPy230 cell line both in a syngeneic background. We here identifythat Py230 tumor cells are able to catch up with 4T1 tumors by 6weeks (w) post-inoculation (p.i.) through an enhanced cellularproliferation, but show no systemic advancement at that time.As tumor cells invaded through the ductal barrier, the tumormicroenvironment significantly changed and showed increasedimmune cell influx. The different tumor outgrowth was alsoassociated with a differential tumor immunology as 4T1 primarytumors were more pro-inflammatory showing high amounts ofactivated cytotoxic T-cells and immune-stimulating cytokines,and Py230 primary tumors were more anti-inflammatorycontaining a high number of regulatory T-cells, weak cytotoxicT-cell activation, and increased immunosuppressive cytokines.Taken together, the 4T1- and Py230-based intraductal modelrepresent a different type of TNBC outgrowth and immunemicroenvironment that can be explored as preclinical tool fortesting therapeutic strategies.
MATERIALS AND METHODS
MiceWild-type BALB/c and C57BL/6 mice were purchased fromEnvigo. Albino NF-κB luc/Tyr−/− C57BL/6 mice, which carry
a heterozygous nuclear factor-kappa B (NF-κB) luc transgeneand lack the tyrosinase-expressing gene responsible for coatcolor, were a kind gift from Harald Carlsen (11). No geneticdrift was observed during the period of the study based ona 384 single nucleotide polymorphism (SNP) panel performedby Charles River Genetic Testing Services. Animals wereconventionally housed with access to food and water ad libitum.All animal research was conducted in accordance with therecommendations in the Guide for the Care and Use ofLaboratory Animals of the National Institutes of Health andapproved by the Committee on the Ethics of Animal Experimentsof The Faculty of Veterinary Medicine at Ghent University(approval numbers: EC2015/127, EC2016/56, and EC2017/80).
4T1 and Py230 Cell CultureBALB/c-derived 4T1 mammary tumor cells constitutivelyexpressing firefly luciferase were a kind gift from Prof.Clare Isacke (Breakthrough Breast Cancer Research Centre,London, UK). These cells resemble the aggressive metastaticcharacteristics of human TNBC [lacking expression of estrogenreceptor (ER), progesterone receptor (PR) and human epidermalgrowth factor receptor 2 (HER2)] (12, 13). Py230 mammarytumor cells were purchased from the American Type CultureCollection (ATCC). These cells were originally derived fromspontaneous tumors in MMTV-PyMT transgenic mice witha C57BL/6 background and have been used to model TNBC(14). Cell lines were maintained at 37◦C and 5% CO2 inDulbecco’s Modified Eagle’s Medium (DMEM) supplementedwith 10% heat-inactivated fetal bovine serum (FBS), 100 U/mlpenicillin and 100µg/ml streptomycin (Thermo Fisher Scientific,Waltham, MA, USA) for 4T1 cells and Ham’s F-12K (Kaighn’s)Medium (Thermo Fisher Scientific) supplemented with 0.1%MITO+ Serum Extender (Corning), 5% heat-inactivated FBS,100 U/ml penicillin and 100µg/ml streptomycin (Thermo FisherScientific) for Py230 cells. Cultured cells were harvested using0.25% trypsin-ethylenediaminetetraacetic acid (EDTA) (ThermoFisher Scientific), washed through centrifugation (805 g for5min) and resuspended in phosphate buffered saline (PBS)(Thermo Fisher Scientific). A Bürcker chamber was used to countthe number of harvested cells.
Intraductal Tumor Cell InoculationLactating female mice were intraductally inoculated in the thirdmammary gland with either 5 × 10⁴ 4T1 or 1 × 10⁵ Py230mammary tumor cells under inhalation anesthesia (mixture of 2–3% isoflurane and oxygen). To become lactating, 8-w-old femaleand male mice were mated and pups were weaned 10 daysafter delivery. 4T1 and Py230 cells suspended in a mixture of1:10 PBS and Matrigel R© were inoculated through the mammaryteat canal 1 h after weaning using a 32-gauge blunt needlein a BALB/c and C57BL/6 background, respectively, to obtainimmunocompetent models.
Analysis of Primary Tumor Growth andMetastases4T1 and Py230 primary tumor volumes were analyzed weekly asa measurement of primary tumor growth using a digital caliper.
Frontiers in Immunology | www.frontiersin.org 2 December 2019 | Volume 10 | Article 2928
Steenbrugge et al. Intraductal Tumor Progression and Immunology
The growth of 4T1 primary tumors was also monitored byimaging 4T1-derived bioluminescence at the primary tumor site.Bioluminescence in the Py230 intraductally inoculated NF-κBluciferase reporter mice was monitored at the primary tumor siteas a measurement of NF-κB activity and inflammation in primarytumors. To acquire the images, mice were intraperitoneally (i.p.)injected with 200 µl D-luciferin in PBS (at a concentration of2 mg/100 µl, Gold Biotechnology, St. Louis, MO) and placedin an IVIS lumina II system (PerkinElmer, Zaventem, Belgium)approximately 10min later under inhalation anesthesia. 4T1-derived bioluminescence in axillary lymph node, lung and livermetastases as well as NF-κB-derived bioluminescence in axillarylymph nodes were acquired through ex vivo imaging. Therefore,mice were i.p. injected with a mixture of 100 mg/kg ketamine(Ketamidor, Ecuphar nv/sa, Oostkamp, Belgium) and 10 mg/kgxylazine (Xylazini Hydrochloridum, Val d’Hony-Verdifarm,Beringen, Belgium) for sedation and sacrificed through cervicaldislocation. Organs were subsequently isolated and screenedfor bioluminescence. Spleens were also isolated and weighed.Bioluminescence signals were quantified by dividing the total fluxwith the selected area using living image analysis software 3.2.
Flow Cytometric Immunophenotyping ofPrimary Tumor Immune Populations4T1 and Py230 primary tumors were isolated from intraductallyinoculated mice following scarification. To obtain a single cellsuspension, primary tumors were chopped into small fragmentsand transferred into a gentleMACSCTube containing an enzymemix of 2.35ml RPMI 1640 (Thermo Fisher Scientific), 100 µlEnzyme D, 50 µl Enzyme R and 12.5 µl Enzyme A (enzymesderived from a commercially available Tumor dissociation kitfrom Miltenyi Biotec, Leiden, The Netherlands). The C Tubeswere attached onto a gentleMACS Dissociator, subjected to thegentleMACS Program m_impTumor_02 for 37 s and incubatedfor 40min at 37◦C with continuous rotation at 40 rpm foroptimal enzymatic digestion. The C Tubes were then subjectedto the gentleMACS Program m_impTumor_03 twice for 37 s,after which the cell suspensions were allowed to settle and runon the m_impTumor_01 for 60 s to increase the cell yield. Cellswere pelleted through a short spin up to 300 g and applied to a70µm cell strainer. Washing of the cell strainer with 10ml ofRPMI 1640, pelleting of the cells through centrifugation at 800 gfor 7min and resuspension of the cells into 1ml of RPMI 1640created a final cell suspension that was used for further analysis.
Cells were counted on a flow cytometer (Cytoflex, Analis,Ghent, Belgium) by bringing 100µl of the final cell suspension ina well of a 96 well plate. Cellular viability was also evaluated in thiswell by adding 2µl propidium iodide (PI, 50µg/ml) to the 100µlsuspension. The remaining 900µl of the final cell suspension waspelleted at 800 g for 7min and dissolved at a concentration of 2×10⁶ cells/ml in FcR blocking reagent diluted 1:10 in FACS buffer(PBS with 1% bovine serum albumin (BSA), 2.5mM EDTA, and0.01% sodium azide). For staining of the cells, 100 µl of themixture (corresponding with 2 × 10⁵ cells) was brought in eachwell of a 96 well plate, cells were pelleted at 800 g for 5min andincubated for 30min at 4◦C in a 100 µl cocktail of antibodies
supplemented in FACS buffer. Following antibodies and dilutionswere used: anti-CD45-biotin (1:200, clone 30-F11, Thermo FisherScientific), anti-F4/80-APC (1:20, clone CI:A3-1, Bio-Rad, CA,USA), anti-Ly6G-APC (1:10, clone 1A8, Miltenyi Biotec), anti-CD3ε-FITC (1:50, clone 145-2C11, BioLegend, CA, USA), anti-CD4-PE (1:80, clone GK1.5, BioLegend), anti-CD8a-APC (1:80,clone 53-6.7, BioLegend). Staining with secondary streptavidin-PE (1:333, Thermo Fisher Scientific) or streptavidin-eFluor 450(1:80, Thermo Fisher Scientific) was performed to detect anti-CD45-biotin. Therefore, cells were pelleted again at 800 g for5min, washed with FACS buffer and incubated for 30min at4◦C in 100 µl of streptavidin antibody supplemented in FACSbuffer. Isotype-matched and auto-fluorescence controls wereused for identification and quantification of staining positivity.After the cellular stainings, cells were pelleted again at 800 g for5min, washed twice with FACS buffer and analyzed with a flowcytometer. All acquired data were processed using CytExpertv2.0.0.153 software (Beckman Coulter, Inc., California, USA).Compensation for spectral overlap between fluorochromes wasperformed using an automatic calibration technique of thesoftware and subsequently evaluated individually with a matrix.
Histology and ImmunohistochemistryTissues were isolated, fixed for 24 h at room temperature (RT)in 3.5% buffered formaldehyde and embedded in paraffin.Tissue sections of 5µm were deparaffinized, rehydrated andthen stained with hematoxylin and eosin (H&E). Followingdehydration, tissue sections were mounted with a cover glass forfurther analysis.
Immunohistochemical stainings relied on antigen retrieval ofdeparaffinized 2–3µm thick tissue sections with citrate buffer[pH 6, 10mM tri-sodium citrate (Santa Cruz Biotechnology,Heidelberg, Germany); for Ki67, CD31, carbonic anhydrase 9(CAIX), CD45, CD163, CD11c Ly6G, CD3ε, CD8a, CD4, FoxP3,granzyme B, programmed death-1 (PD-1), and CD19], or Tris-EDTA buffer [pH 9, 10mM Tris, 1mM EDTA (Thermo FisherScientific); for cytokeratin 5] supplemented with 0.05% Tween-20 (Sigma-Aldrich, Bornem, Belgium) at 95◦C for 30min underpressure in a Decloaking Chamber NxGen (Biocare Medical,CA, USA). After cooling down to RT for 30min, slides wereincubated in a microscope slide box with tris-buffered saline(TBS)-wetted paper at 20 rpm on an orbital shaker for furtherincubation steps. 0.6%H2O2 inmethanol (for CD8a) or 3%H2O2
in methanol (all other targets) was applied on the sections for10min as an endogenous peroxidase block, followed by serum-free protein block for 10min. Primary antibodies were dilutedin Antibody diluent (Dako) and applied for 1 h at RT. Followingprimary antibodies and dilutions were used: anti-cytokeratin5 (1:100, clone EP1601Y, Abcam, Cambridge, UK) anti-Ki67(1:50, clone SP6, Thermo Fisher Scientific), anti-CD31 (1:2000,clone EPR17259, Abcam), anti-CAIX (1:1000, clone NB100-417, Novus Biologicals, Littleton, CO, USA), anti-CD45 (1:1000,clone 30-F11, Thermo Fisher Scientific), anti-CD163 (1:500,clone EPR19518, Abcam), anti-CD11c (1:100, clone D1V9Y,Cell Signaling Technology, Leiden, The Netherlands), anti-Ly6G (1:1000, clone 1A8, BioLegend), anti-CD3ε (1:1000, cloneEPR20752, Abcam), anti-CD8a (1:50, clone 4SM15, Thermo
Frontiers in Immunology | www.frontiersin.org 3 December 2019 | Volume 10 | Article 2928
Steenbrugge et al. Intraductal Tumor Progression and Immunology
Fisher Scientific), anti-CD4 (1:1000, clone 4SM95, Thermo FisherScientific), anti-FoxP3 (1:100, clone FJK-16s, Thermo FisherScientific), anti-granzyme B (1:1000, polyclonal, Abcam), anti-PD-1 (1:1000, clone EPR20665, Abcam) and anti-CD19 (1:1000,clone 6OMP31, Thermo Fisher Scientific). Secondary antibodieswere subsequently applied for 30min at RT. Following secondaryantibodies were used: Rat-on-mouse HRP-Polymer (BiocareMedical) for CD45, Ly6G, CD8a, CD4, FoxP3, and CD19, andDako EnVision+ Rabbit (Dako) for cytokeratin 5, Ki67, CD31,CAIX, CD163, CD11c, CD3ε, granzyme B, and PD-1. To detectpositive staining, sections were treated with a buffer containing
3,3′-diaminobenzidine (DAB) for 10min at RT. Counterstaining
was performed by applying hematoxylin for 5min. Rinsing of theslides between all incubations relied on TBS applied 3 times for2min. For quantification of the stainings, color deconvolutionand automatic counting was applied through ImageJ. Ki67proliferation indices were determined using ImageJS (15).
Analysis of Cytokine and Protein LevelsTo extract proteins, isolated primary tumors and spleens werehomogenized and lysed with lysis buffer supplemented withprotease inhibitors [1% Nonidet P-40, 10mM Tris-HCl atpH 7.4, 200mM NaCl, 5mM EDTA, 10% glycerol, 100µMphenylmethylsulfonyl (PMSF), 1mM oxidized L-glutathione (allfrom Sigma-Aldrich), 0.15µM aprotinin and 2.1µM leupeptin(Roche, Mannheim, Germany)] as previously described (4).Serum was derived from blood which was collected throughcardiac puncture, allowed to clot at 37◦C for 30min andcentrifuged at 17,000 g for 1 h at 4◦C. The levels of 10 selectedcytokines (BAFF, G-CSF, IFN-γ, IL-1β, IL-4, IL-6, IL-10, MCP-1,MIP-2, and TNF-α) were measured through Luminex MultiplexAssays (Thermo Fisher Scientific) in primary tumor lysates(50 µg of protein) and sera (1:4 diluted in assay diluent).Enzyme-linked immunosorbent assay (ELISA) was used tomeasure CHI3L1 and LCN2 levels (MouseQuantikine ELISAKit,Biotechne, Minneapolis, MN, USA) in primary tumor lysates,sera and spleen lysates, and the levels of MMP-9, VEGF (MouseQuantikine ELISA Kit, Biotechne) and TGF-β1 (Mouse uncoatedELISA Kit, Thermo Fisher Scientific) in primary tumor lysatesand sera with absorbances at 550 nm subtracted from those at450 nm for correction. ELISA data were analyzed by means ofDeltasoft JV (BioMetallics Incorporated).
RNA-Seq AnalysisRNA was isolated from 4T1 and Py230 tumors at 3 different timepoints (i.e., 1, 3, and 6w p.i.) using in house developed protocols(16). All analyses were done in triplicate. In addition, Matrigel R©
controls were included for each intraductal model and timepoint, yielding a total of 36 samples. RNA quality and quantitywere analyzed using the Agilent BioAnalyzer and the NanoDrop,respectively, according the manufacturer’s instructions. RNAsequencing was done in collaboration with Oxford Genomicsusing Illumina’s TruSeq chemistry. Briefly, 100 ng of totalRNA was subjected to a stranded library preparation, andlibraries were sequenced (i.e., paired-end; read length of 75bp) on a HiSeq4000 using 2 lanes aiming for 10 million readsper sample. This allows accurate assessment of the expression
levels of the 50% most strongly expressed genes (coefficientof variation between 10 replicates inferior to 5%), whichcorresponds to genes having at least 10 associated reads in therespective libraries. Reads were mapped to the mouse referencegenome (mm10) using STAR. Read counts were generatedusing the summariseOverlaps function from the BioConductorpackage GenomicAlignments. Raw counts were normalized andanalyzed for differential expression using the DESeq2 packagein BioConductor. Regression models were set up to allowevaluation of expression differences between the 4T1- and Py230-based intraductal model at each time point and plain timeeffects were accounted for using the Matrigel R© control samples.Significant differences were considered when nominal P-valueswere inferior to 5%. Lists of differentially expressed genes weretranslated into biological concepts (i.e., hallmark category ofthe molecular signatures database from the Broad Institute)using gene set enrichment analysis (GSEA). Therefore, mousegene symbols were first translated into their human homologsusing the getLDS function from the biomaRt package inBioConductor. Heatmaps in Figures 10, 11 were generated usingthe online tool Heatmapper (17) and in Supplementary Figure 5
using R.
Statistical AnalysisAnalysis of Variance (ANOVA) tests with Tukey’s post-hoctests and unpaired Student’s t-tests were performed usingPrism (GraphPad) to calculate P-values and determine statisticalsignificant differences (P < 0.05). Log10 normalization wasperformed to normalize data when necessary.
RESULTS
DCIS to IC Progression Is More Aggressivein the 4T1- Compared to the Py230-BasedIntraductal Model as Reflected by Localand Systemic Disease MarkersTo establish the immunocompetent 4T1- and Py230-basedintraductal model, BALB/c-derived 4T1 mammary tumor cellsand C57BL/6-derived Py230 mammary tumor cells wereintraductally inoculated in lactating syngeneic mice. Primarytumor volume measurements indicated that 4T1 cells grewmore aggressively than Py230 cells inside the mammary glandsand established larger primary tumors between 1 and 5wp.i. (Figure 1A). In contrast, Py230 cells grew exponentiallyand at 6w p.i. the Py230 and 4T1 primary tumor volumesno longer differed (Figure 1A). As the 4T1 tumor cells wereluminescently traceable, in vivo imaging allowed to verifytheir invasive primary tumor growth and showed that theyexpanded across the mammary gland and the surroundingtissue (Supplementary Figure 1A). H&E histology of primarytumors at 1, 3, and 6w p.i. confirmed DCIS to IC progressionin both the 4T1- and Py230-based intraductal model, with4T1 cells displaying both enhanced and earlier invasion at3w p.i. (Figure 1B). Corroborating this key finding, increaseddisruption of the myoepithelial cell layer by 4T1 cells at 3 wp.i. was verified based on decreased cytokeratin 5 positivity
Frontiers in Immunology | www.frontiersin.org 4 December 2019 | Volume 10 | Article 2928

Steenbrugge et al. Intraductal Tumor Progression and Immunology
FIGURE 1 | Tumor growth, ductal breakthrough and tumor proliferation in the 4T1- compared to Py230-based intraductal model. 4T1 and Py230 mammary tumor
cells were intraductally inoculated in syngeneic lactating dams and primary tumor progression was monitored. (A) Weekly primary tumor volume measurements up to
6w p.i. (4T1 primary tumors: n = 52 at 1w p.i., n = 36 at 2 and 3w p.i., n = 18 at 4, 5, and 6w p.i.; Py230 primary tumors: n = 43 at 1w p.i., n = 33 at 2 and 3w
p.i., n = 23 at 4 and 5w p.i., n = 29 at 6w p.i.). (B) H&E histology of Py230 and 4T1 primary tumors at 1, 3, and 6w p.i. Scale bars = 50µm. Data in (A) are
presented as the means ± standard error of the mean (SEM). NS, not significant. **P < 0.01, ***P < 0.001.
FIGURE 2 | Ductal breakthrough and tumor proliferation in the 4T1- compared to Py230-based intraductal model. Immunohistochemistry for the myoepithelial cell
marker cytokeratin 5 and cell proliferation marker Ki67 on sections of Py230 and 4T1 primary tumors at 1, 3, and 6w p.i. (n = 5 at each time point for both 4T1 and
Py230 primary tumors). A Ki67 proliferation index was determined of Py230 and 4T1 primary tumors at 1, 3, and 6w p.i. by calculating the fraction of Ki67+ nuclei
among all nuclei using ImageJS (15). All nuclei are marked in blue and Ki67+ nuclei are marked in red. Scale bars = 50µm. Data are presented as the means ± SEM.
NS, not significant. *P < 0.05, **P < 0.01, ***P < 0.001.
in 4T1 compared to Py230 primary tumors (Figure 2). Ki67staining confirmed the increased tumor cell proliferation in4T1 compared to Py230 primary tumors at 1 w p.i., butnot at 3 and 6w p.i. (Figure 2). Moreover, calculation ofthe Ki67 proliferation index (i.e., the percentage of Ki67stained nuclei relative to all nuclei in the primary tumor)showed that, in marked contrast to the index at 1w p.i.,
Py230 primary tumors were more proliferative than 4T1primary tumors by 3w p.i. (Figure 2), supporting the earlierfinding that Py230 tumors are able to catch up with 4T1tumor growth.
Additionally, distant metastases in the 4T1- and Py230-basedintraductal model were investigated at 6w p.i. by H&E histologyand ex vivo imaging. H&E histology showed metastases in
Frontiers in Immunology | www.frontiersin.org 5 December 2019 | Volume 10 | Article 2928

Steenbrugge et al. Intraductal Tumor Progression and Immunology
axillary lymph nodes, lungs and liver from 4T1, but not fromPy230 tumor-bearing mice (Supplementary Figure 1B). Ex vivoimaging confirmed the presence of 4T1-derived bioluminescencein these three organs (Supplementary Figure 1B). MMP-9and VEGF, proteins that are important for tumor metastasisthrough extracellular matrix degradation and angiogenesis,respectively, were measured locally in primary tumors andsystemically in serum, identifying increased MMP-9 levels at1, 3, and 6w p.i. (Figure 3A) and increased VEGF levelsat 3 as well as 6 w p.i. (Figure 3B) in the 4T1- comparedto the Py230-based intraductal model. However, MMP-9 andVEGF levels in primary tumors and serum did not increaseto the same extent. The fold induction of the mean MMP-9 and VEGF levels in the 4T1- compared to the Py230-based model showed remarkable differences in primary tumors(Supplementary Figures 2A,B). More specifically, MMP-9 wasmore strongly induced at 1w p.i. compared to VEGF, whereasat 3 w p.i. VEGF was more strongly induced compared to MMP-9 (Supplementary Figures 2A,B). At 6w p.i., MMP-9 was againmore strongly induced compared to VEGF, albeit to a lesserextent than at 1w p.i. (Supplementary Figures 2A,B). In serum,the fold induction of MMP-9 in the 4T1- compared to the Py230-based model was only clearly higher compared to that of VEGFat 6w p.i. (Supplementary Figures 2A,C). CD31 stainings inprimary tumors corroborated the increased angiogenesis at 3and 6w p.i. in the 4T1-based intraductal model (Figure 3C).
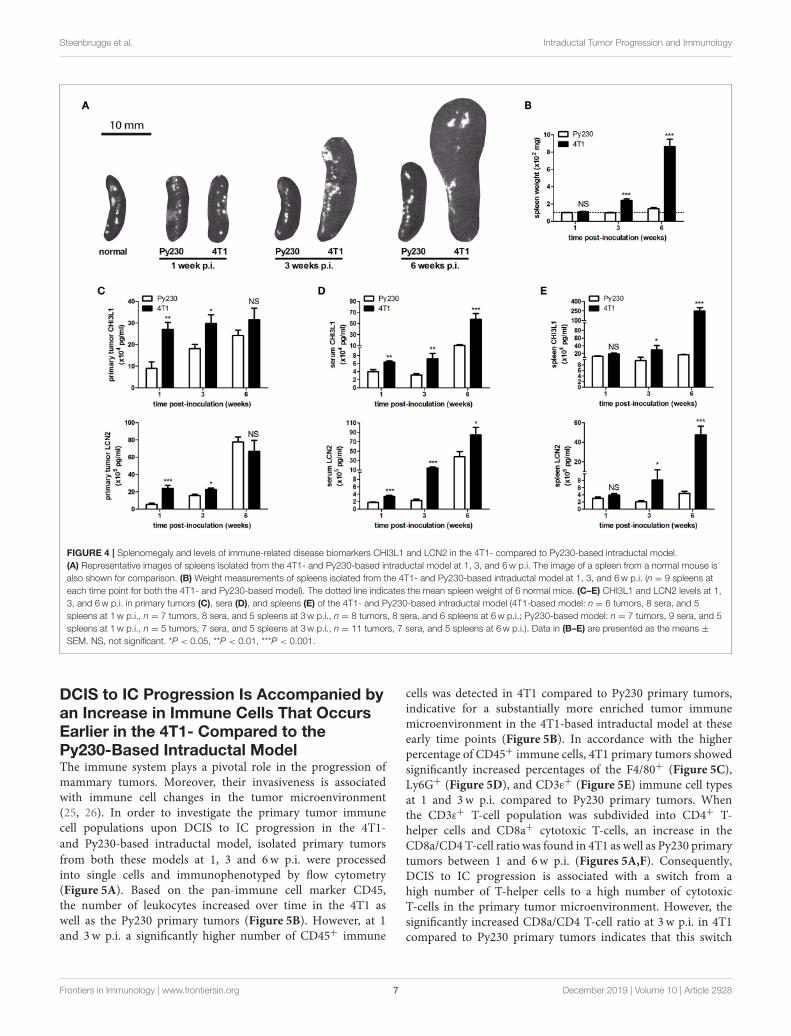
However, based on stainings for the hypoxia marker CAIX(18, 19) the increased angiogenesis did not result in a decreaseof hypoxia. More specifically, 4T1 primary tumors showed aprogressive increase in CAIX positivity from 1 to 6w p.i., whereasthe slower progressing Py230 primary tumors showed fewerCAIX staining (Figure 3C). The increased tumor progressionin the 4T1-based intraductal model was accompanied with amore progressive splenomegaly compared to the Py230-basedintraductal model based on spleen weight measurements at 1,3, and 6w p.i. (Figures 4A,B), indicative for enhanced systemicdisease as well as leukemoid reactions (20, 21). Two immuno-oncological biomarkers for disease monitoring in mice (3, 4) andbreast cancer patients (22–24), CHI3L1 and LCN2, corroboratedthe 4T1 disease progression and showed significantly increasedlevels in 4T1 compared to Py230 primary tumors at 1 and3w p.i., but not at 6 w p.i. (Figure 4C), when 4T1 and Py230primary tumors reached similar volumes. In serum, on theother hand, CHI3L1 and LCN2 were significantly increasedat 1, 3, and 6w p.i. in the 4T1- compared to the Py230-based intraductal model (Figure 4D), reflecting the enhancedmetastatic progression of 4T1 tumor cells following intraductalinoculation. CHI3L1 and LCN2 levels in spleens corroborated theincreased splenomegaly at 3 and 6w p.i. in the 4T1- comparedto the Py230-based intraductal model (Figure 4E) and furtherindicated the presence of enhanced leukocyte reactions in the 4T1tumor-bearing mice.
FIGURE 3 | MMP-9 and VEGF levels, tumor vascularity and hypoxia in the 4T1- compared to Py230-based intraductal model. Primary tumor and serum MMP-9 (A)
and VEGF (B) levels at 1, 3, and 6w p.i. in the 4T1- and Py230-based intraductal model (4T1-based model: n = 7 tumors and 10 sera at 1w p.i., n = 7 tumors and 9
sera at 3w p.i., n = 8 tumors and 9 sera at 6w p.i.; Py230-based model: n = 7 tumors and 10 sera at 1w p.i., n = 5 tumors and 7 sera at 3w p.i., n = 11 tumors and
7 sera at 6w p.i.). (C) Immunohistochemistry for the endothelial cell marker CD31 and hypoxia marker CAIX on sections of 4T1 and Py230 primary tumors at 1, 3, and
6w p.i. (n = 5 at each time point for both 4T1 and Py230 primary tumors). Scale bars = 50µm. Data are presented as the means ± SEM. NS, not significant.
*P < 0.05, **P < 0.01, ***P < 0.001.
Frontiers in Immunology | www.frontiersin.org 6 December 2019 | Volume 10 | Article 2928
Steenbrugge et al. Intraductal Tumor Progression and Immunology
FIGURE 4 | Splenomegaly and levels of immune-related disease biomarkers CHI3L1 and LCN2 in the 4T1- compared to Py230-based intraductal model.
(A) Representative images of spleens isolated from the 4T1- and Py230-based intraductal model at 1, 3, and 6w p.i. The image of a spleen from a normal mouse is
also shown for comparison. (B) Weight measurements of spleens isolated from the 4T1- and Py230-based intraductal model at 1, 3, and 6w p.i. (n = 9 spleens at
each time point for both the 4T1- and Py230-based model). The dotted line indicates the mean spleen weight of 6 normal mice. (C–E) CHI3L1 and LCN2 levels at 1,
3, and 6w p.i. in primary tumors (C), sera (D), and spleens (E) of the 4T1- and Py230-based intraductal model (4T1-based model: n = 6 tumors, 8 sera, and 5
spleens at 1w p.i., n = 7 tumors, 8 sera, and 5 spleens at 3w p.i., n = 8 tumors, 8 sera, and 6 spleens at 6w p.i.; Py230-based model: n = 7 tumors, 9 sera, and 5
spleens at 1w p.i., n = 5 tumors, 7 sera, and 5 spleens at 3w p.i., n = 11 tumors, 7 sera, and 5 spleens at 6w p.i.). Data in (B–E) are presented as the means ±
SEM. NS, not significant. *P < 0.05, **P < 0.01, ***P < 0.001.
DCIS to IC Progression Is Accompanied byan Increase in Immune Cells That OccursEarlier in the 4T1- Compared to thePy230-Based Intraductal ModelThe immune system plays a pivotal role in the progression ofmammary tumors. Moreover, their invasiveness is associatedwith immune cell changes in the tumor microenvironment(25, 26). In order to investigate the primary tumor immunecell populations upon DCIS to IC progression in the 4T1-
and Py230-based intraductal model, isolated primary tumors
from both these models at 1, 3 and 6w p.i. were processedinto single cells and immunophenotyped by flow cytometry(Figure 5A). Based on the pan-immune cell marker CD45,the number of leukocytes increased over time in the 4T1 aswell as the Py230 primary tumors (Figure 5B). However, at 1and 3w p.i. a significantly higher number of CD45+ immune
cells was detected in 4T1 compared to Py230 primary tumors,indicative for a substantially more enriched tumor immunemicroenvironment in the 4T1-based intraductal model at theseearly time points (Figure 5B). In accordance with the higherpercentage of CD45+ immune cells, 4T1 primary tumors showedsignificantly increased percentages of the F4/80+ (Figure 5C),Ly6G+ (Figure 5D), and CD3ε+ (Figure 5E) immune cell typesat 1 and 3w p.i. compared to Py230 primary tumors. Whenthe CD3ε+ T-cell population was subdivided into CD4+ T-helper cells and CD8a+ cytotoxic T-cells, an increase in theCD8a/CD4 T-cell ratio was found in 4T1 as well as Py230 primarytumors between 1 and 6w p.i. (Figures 5A,F). Consequently,DCIS to IC progression is associated with a switch from ahigh number of T-helper cells to a high number of cytotoxicT-cells in the primary tumor microenvironment. However, thesignificantly increased CD8a/CD4 T-cell ratio at 3 w p.i. in 4T1compared to Py230 primary tumors indicates that this switch
Frontiers in Immunology | www.frontiersin.org 7 December 2019 | Volume 10 | Article 2928

Steenbrugge et al. Intraductal Tumor Progression and Immunology
FIGURE 5 | Flow cytometric immunophenotyping of tumor immune populations in the 4T1- compared to Py230-based intraductal model. Primary tumors were
isolated from the 4T1- and Py230-based intraductal model at 1, 3, and 6w p.i. and dissociated into a single cell suspension. Distinct immune cell types in the single
cell suspension were quantified by flow cytometry. (A) Gating strategy for analysis of single cells and expression of CD45, F4/80, Ly6G, CD3ε, CD8a, and CD4. (B–F)
Positivity for CD45 (pan-immune cells) as a percentage of total single cells (B), positivity for F4/80 (macrophages) (C), Ly6G (neutrophils) (D), and CD3ε (T-cells) (E) as
a percentage of CD45+ cells, and the ratio of CD8a+ cells (cytotoxic T-cells) and CD4+ cells (T-helper cells) (F) at 1, 3, and 6w p.i. in primary tumors isolated from the
4T1- and Py230-based intraductal model (4T1 primary tumors: n = 4 at each time point; Py230 primary tumors: n = 4 at 1w p.i., n = 3 at 3 and 6w p.i.). F4/80+,
Ly6G+, and CD3ε+ fraction of total leukocytes in Py230 (G) and 4T1 (H) primary tumors at 1, 3, and 6w p.i. Data in (B–F) are presented as the means ± SEM, data in
(G,H) are presented as the means. NS, not significant. *P < 0.05, **P < 0.01, ***P < 0.001.
occurs earlier in the 4T1-based intraductal model. Investigationof the changes in proportion of immune cells over time in the4T1- and Py230-based intraductal model showed that F4/80+
macrophages were the most abundant immune cell type at 1 and3w p.i., and that Ly6G+ neutrophils and CD3ε+ T-cells caughtup with the macrophage numbers by 6w p.i. (Figures 5G,H).More specifically, in 4T1 primary tumors, each of these threeimmune cell types comprised about 30% of the total immune cellsat this end point, together approximating 90% of the primarytumor immunophenotype (Figure 5G). In marked contrast, inthe Py230-based primary tumors, F4/80+ macrophages remainedthe predominant immune cell type (34%) at 6w p.i., althoughclosely followed in numbers by Ly6G+ neutrophils (16%) andCD3ε+ T-cells (24%), together approximating 75% of the primarytumor immunophenotype (Figure 5H).
Immunohistochemical CD45 stainings corroborated theimmunophenotyping by identifying an increased number of
immune cells over time in the tumor stroma, but also immunecells infiltrating into the tumor tissue at 3 and 6w p.i. (Figure 6),when tumor cells became invasive. The 4T1 primary tumorsshowed significantly increased CD45 positivity at 1 and 3wp.i. and equal CD45 positivity at 6 w p.i. compared to Py230primary tumors. Similarly, CD163 stainings demonstrated aprogressive increase of tumor-associated macrophages (TAMs)in the surrounding primary tumor stroma, with 4T1 primarytumors showing significantly higher CD163 positivity at 1 and3w p.i., but not at 6 w p.i. compared to Py230 primary tumors(Figure 6). Also CD11c and Ly6G stainings for tumor-associateddendritic cells (TADCs) and tumor-associated neutrophils(TANs), respectively, increased over time in primary tumorsections of both models, with 4T1 primary tumors showingsignificantly increased positivity for both markers at 1 and 3wp.i., but not at 6 w p.i. compared to Py230 primary tumors(Figure 6). Moreover, whereas Ly6G stainings were located
Frontiers in Immunology | www.frontiersin.org 8 December 2019 | Volume 10 | Article 2928

Steenbrugge et al. Intraductal Tumor Progression and Immunology
FIGURE 6 | Immunohistochemical analysis of innate immune cell populations in primary tumors of the 4T1- compared to Py230-based intraductal model.
Immunohistochemistry for the pan-immune cell marker CD45, the tumor-associated macrophage marker CD163, the dendritic cell marker CD11c and the neutrophil
marker Ly6G on sections of 4T1 and Py230 primary tumors at 1, 3, and 6w p.i. (n = 5 at each time point for both 4T1 and Py230 primary tumors). Dashed inserts
and arrowheads indicate the few Ly6G+ cells at 1w p.i. in both 4T1 and Py230 primary tumors and at 3w p.i. in Py230 primary tumors. Black scale bar = 50µm, red
scale bar = 20µm. Data are presented as the means ± SEM. NS, not significant. *P < 0.05, ***P < 0.001.
within the primary tumor area at all times, CD11c stainings forTADCs were initially located in the tumor stroma at 1w p.i.and subsequently invaded the primary tumor core by 3 and 6wp.i. Regarding the adaptive immune cells, immunohistochemistryshowed significant increase in CD3ε stainings for tumor-infiltrating lymphocytes (TILs), in CD8a stainings for cytotoxicT-cells, and in CD4 stainings for T-helper cells in the primarytumor area of the 4T1- compared to Py230-based modelat 1 and 3w p.i., but not at 6 w p.i. (Figure 7A). FoxP3stainings for immunosuppressive regulatory T-cells significantlyincreased in the Py230 compared to 4T1 primary tumors at6 w p.i. (Figure 7B).
More Aggressive Tumor Progression in the4T1- Compared to the Py230-BasedIntraductal Model Is Characterized by anEnhanced Inflammation and CytotoxicT-Cell ActivityMammary tumor progression is highly influenced byinflammatory responses derived from activated immunecells in the tumor microenvironment. This inflammation is
tightly controlled by inflammatory transcription factors such asNF-κB (27). NF-κB luciferase reporter mice allow to measure
the host NF-κB activation upon tumor progression and visualize
mammary gland inflammation through bioluminescenceimaging (11, 28, 29). Py230 cells were intraductally inoculatedin these reporter mice and weekly monitoring identified thathost NF-κB activity at the primary tumor site exponentiallyincreased over time, although there was a distinctive signalonly at 6 w p.i. (Supplementary Figures 3A,B). Isolated axillarylymph nodes from the mice at 6 w p.i. also showed significantlyhigher NF-κB-derived luminescence compared to 1 and 3w p.i.(Supplementary Figures 3C,D), indicative for an increasinginflammation in response to the advancing primary tumor.
Local and systemic cytokine profiling allowed amore in-depthinvestigation into the inflammation in the intraductal model.4T1 primary tumors showed significantly increased levels ofpro-inflammatory cytokines B-cell activating factor (BAFF),granulocyte colony-stimulating factor (G-CSF), interferon(IFN)-γ, interleukin (IL)-1β, monocyte chemoattractant protein(MCP)-1, macrophage inflammatory protein (MIP)-2, andtransforming growth factor (TGF)-β1 at 1, 3, and 6w p.i.,and IL-6 and tumor necrosis factor (TNF)-α at 3 and 6w
Frontiers in Immunology | www.frontiersin.org 9 December 2019 | Volume 10 | Article 2928

Steenbrugge et al. Intraductal Tumor Progression and Immunology
FIGURE 7 | Immunohistochemical analysis of adaptive immune cell populations in primary tumors of the 4T1- compared to Py230-based intraductal model.
(A) Immunohistochemistry for the T-cell marker CD3ε, the cytotoxic T-cell marker CD8a and the T-helper cell marker CD4 on sections of 4T1 and Py230 primary
tumors at 1, 3, and 6w p.i. (n = 5 at each time point for both 4T1 and Py230 primary tumors). (B) Immunohistochemistry for the regulatory T-cell marker FoxP3 on
sections of 4T1 and Py230 primary tumors at 6w p.i. (n = 5 at each time point for both 4T1 and Py230 primary tumors). Dashed inserts and arrowheads indicate the
few CD3ε+ and CD8a+ cells at 1w p.i. in both 4T1 and Py230 primary tumors and at 3w p.i. in Py230 primary tumors, the few CD4+ cells at 1, 3, and 6w p.i. in both
4T1 and Py230 primary tumors, and the few FoxP3+ cells at 6w p.i. in 4T1 and Py230 primary tumors. Black scale bar = 50µm, red scale bar = 20µm. Data are
presented as the means ± SEM. NS, not significant. *P < 0.05, **P < 0.01, ***P < 0.001.
p.i. compared to Py230 primary tumors (Figures 8A–C). Incontrast, IL-4 and IL-10 levels were significantly higher in
Py230 compared to 4T1 primary tumors at all 3 time points(Figures 8A–C). Analysis of cytokine levels in serum provided
similar results as in primary tumors with significantly higher
BAFF, G-CSF, MCP-1, MIP-2, and TGF-β1 levels at 1, 3, and 6wp.i. for the 4T1- compared to the Py230-based intraductal model(Supplementary Figures 4A–C). IFN-γ, IL-6, and TNF-α serumlevels were detectable only at 3 and 6w p.i. and also significantlyincreased in the 4T1- compared to the Py230-based intraductalmodel (Supplementary Figures 4A–C).
Cytokine production and release is linked to immune cellactivation in the tumor microenvironment, which can betargeted with immunotherapy. Especially cytotoxic (CD8a+) T-cells are an important immunotherapeutic target due to theirtumor-killing function. Therefore, comparative evaluation of thecytotoxic T-cell activity in primary tumors of both intradutcalmodels is of major added value before these models can be used
as therapeutic screening tools. Immunohistochemical stainingsfor granzyme B and PD-1, both markers for activated cytotoxicT-cells, showed increased positivity in 4T1 compared to Py230primary tumors at 1, 3, and 6w p.i. (Figure 8D). The latter keyobservation is in accordance with the higher pro-inflammatorycytokine levels in the 4T1- compared to the Py230-basedintraductal model. CD19 stainings further revealed the presenceand increase of activated B-cells at 3 and 6w p.i. in 4T1, but notin Py230 primary tumors (Supplementary Figure 4D).
RNA-Seq Verifies Immunological andProliferative Changes Upon TumorProgression in the 4T1- Compared to thePy230-Based Intraductal ModelIn order to investigate the changes in both intraductal modelsupon tumor progression at the genetic level, sequencing wasperformed on RNA isolated from snap frozen 4T1 and Py230
Frontiers in Immunology | www.frontiersin.org 10 December 2019 | Volume 10 | Article 2928

Steenbrugge et al. Intraductal Tumor Progression and Immunology
FIGURE 8 | Cytokine levels and immunohistochemical analysis of cytotoxic T-cell activity in primary tumors of the 4T1- compared to Py230-based intraductal model.
Cytokine levels at 1w p.i. (A), 3w p.i. (B), and 6w p.i. (C) in primary tumors of the 4T1- and Py230-based intraductal model (4T1 primary tumors: n = 7 at 1 and 3w
p.i., n = 8 at 6w p.i.; Py230 primary tumors: n = 7 at 1w p.i., n = 5 at 3w p.i., n = 11 at 6w p.i.). (D) Immunohistochemistry for the activated cytotoxic T-cell markers
granzyme B and PD-1 (n = 5 at each time point for both 4T1 and Py230 primary tumors). Dashed inserts and arrowheads indicate the few PD-1+ cells at 1w p.i. in
both 4T1 and Py230 primary tumors and at 3w p.i. in Py230 primary tumors. Black scale bar = 50µm, red scale bar = 20µm. Data are presented as the means ±
SEM. NS, not significant. *P < 0.05, **P < 0.01, ***P < 0.001.
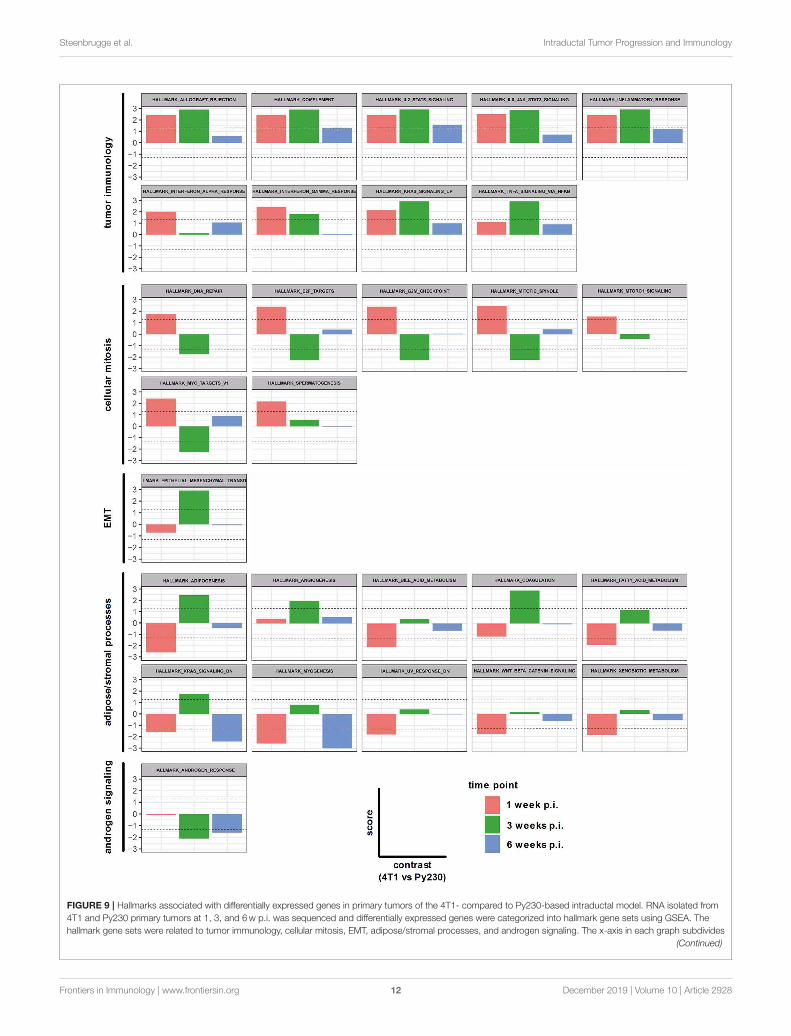
intraductally inoculated primary tumors at 1, 3 and 6w p.i.The differentially expressed genes in the 4T1 vs. Py230 primarytumor datasets at the 3 different time points were categorizedinto 28 hallmark gene sets using GSEA. Nine hallmarks couldbe related to tumor immunology and collectively showed adecreased expression over time (allograft rejection, complement,IL2-STAT5 signaling, IL-6-JAK-STAT3 signaling, inflammatoryresponse, IFN-α response, IFN-γ response, KRAS signaling up,and TNF-α signaling via NF-κB) (Figure 9). More specifically, all9 tumor immunology-related gene sets remained upregulated in4T1 compared to Py230 primary tumors across the 3 time points,but only significantly at 1 and/or 3w p.i. Other gene sets couldbe related to cellular mitosis and tumor progression, includingDNA repair, E2F targets, G2M checkpoint, mitotic spindle,MTORC1 signaling, MYC targets V1 and spermatogenesis(Figure 9). Whereas at 1 w p.i. all gene sets were significantlyupregulated, at 3 w p.i. they became significantly downregulatedor showed a strong decrease compared to 1w p.i. in 4T1compared to Py230 primary tumors, indicative for decreasedtumor proliferation. At 6w p.i., the gene sets went backto baseline, highlighting the similar tumor size in 4T1 andPy230 primary tumors. In contrast to the cellular mitosis genesets, the hallmark epithelial-mesenchymal transition (EMT)was significantly upregulated at 3w p.i. in 4T1 compared toPy230 primary tumors (Figure 9), indicative for metastatic
progression. Gene sets involved in adipose/stromal processeswithin the mammary gland (adipogenesis, angiogenesis, bileacid metabolism, coagulation, fatty acid metabolism, KRASsignaling dn, myogenesis, UV response dn, WNT-β-cateninsignaling, and xenobiotic metabolism) were downregulated orweakly expressed at 1w p.i., but became upregulated at 3wp.i. in 4T1 compared to Py230 primary tumors (Figure 9),indicating that at the time 4T1 tumor cells were less proliferativecompared to Py230 tumor cells, the surrounding stroma andfat tissue were more active in the 4T1- compared to thePy230-based intraductal model. The hallmark androgen responsealso showed a significantly upregulated expression in Py230tumors at 3 and 6w p.i. (Figure 9), indicating that androgensignaling is important in invasive Py230 tumors. Hierarchicalclustering of the hallmarks in a heatmap with the differentprimary tumor samples at the different time points confirmedthat tumor immunology hallmarks are most represented in4T1 primary tumors, with the highest representation at 1wp.i., and cellular mitosis hallmarks are most representedin 4T1 primary tumors at 6 w p.i. and in Py230 primarytumors at 3 and 6w p.i. (Supplementary Figure 5). Geneexpression of RNA samples derived from Matrigel R©-onlyintraductally injected lactating BALB/c and C57BL/6 mice at1, 3, and 6w p.i. were also included as a control and showeda strong representation of stromal/adipose-related hallmarks
Frontiers in Immunology | www.frontiersin.org 11 December 2019 | Volume 10 | Article 2928
Steenbrugge et al. Intraductal Tumor Progression and Immunology
FIGURE 9 | Hallmarks associated with differentially expressed genes in primary tumors of the 4T1- compared to Py230-based intraductal model. RNA isolated from
4T1 and Py230 primary tumors at 1, 3, and 6w p.i. was sequenced and differentially expressed genes were categorized into hallmark gene sets using GSEA. The
hallmark gene sets were related to tumor immunology, cellular mitosis, EMT, adipose/stromal processes, and androgen signaling. The x-axis in each graph subdivides
(Continued)
Frontiers in Immunology | www.frontiersin.org 12 December 2019 | Volume 10 | Article 2928

Steenbrugge et al. Intraductal Tumor Progression and Immunology
FIGURE 9 | the gene set expression in 4T1 compared to Py230 primary tumors at 1, 3, and 6w p.i. The y-axis in each graph indicates the score (corresponding with
the P-value in log10 scale) for the gene set expression in 4T1 compared to Py230 primary tumors. More specifically, a positive score identifies that the gene set is higher
expressed in 4T1 than in Py230 primary tumors, whereas a negative score identifies the opposite. The dashed lines indicate the minimal level of significance (= 0.05 or
1.3 in log10 scale) and allow to identify whether the difference in expression of the hallmark gene set between 4T1 and Py230 primary tumors is statistically significant.
FIGURE 10 | Differential expression of T-cell receptors in primary tumors of the 4T1- compared to Py230-based intraductal model. Heatmap displaying expression
levels of selected genes involved in co-stimulatory/co-inhibitory T-cell receptors in three independent 4T1 and Py230 primary tumor samples at 1w p.i. (A), 3w p.i.
(B), and 6w p.i. (C). (D) Heatmap displaying the log2 fold change in mean gene expression of the selected co-stimulatory/co-inhibitory T-cell receptors in 4T1 and
Py230 primary tumor samples at 1, 3, and 6w p.i. The selection of the T-cell receptor genes was based on the gene list from the NanoString Mouse PanCancer
Immune Profiling Panel and a publication by Yu et al. (30). Hierarchical clustering was performed using Pearson distance.
(Supplementary Figure 5), indicative for an active involutionprocess following lactation. The control samples did not showupregulation of immunological hallmarks, which suggests thatthe injection method and Matrigel R© have minimal influence ontumor immunology.
Next, a specific gene set for co-stimulatory and co-inhibitoryT-cell receptors was investigated at 1, 3, and 6w p.i. in 4T1and Py230 primary tumors. Individual heatmaps were generatedfor the expression levels at each time point and every heatmapindicated increased T-cell receptor expression in most, but notall 4T1 compared to Py230 primary tumors (Figures 10A–C).Yet, the difference in T-cell receptor gene expression betweenthe 4T1 and Py230 primary tumors decreased over time(Figure 10D). Furthermore, gene sets for antigen presentation,macrophage polarization and cytokines/cytokine receptors were
also investigated. Based on the heatmap, differential expressionof genes involved in antigen presentation strongly decreased at6w p.i. in 4T1 compared to Py230 primary tumors (Figure 11A).Gene expression data also showed that 4T1 primary tumorschange from an anti-inflammatory at 1w p.i. to a pro-inflammatory macrophage gene signature at 6 w p.i. comparedto Py230 primary tumors (Figure 11B). This finding was furthersupported by upregulation of pro- and downregulation of anti-inflammatory cytokines and their receptors at 6 w p.i. in 4T1compared to Py230 primary tumors (Figure 11C).
DISCUSSION
Inoculation of murine mammary tumor cells in the teat ductis increasingly accepted as an alternative to the classical fat pad
Frontiers in Immunology | www.frontiersin.org 13 December 2019 | Volume 10 | Article 2928

Steenbrugge et al. Intraductal Tumor Progression and Immunology
FIGURE 11 | Differential expression of antigen presentation, macrophage polarization and cytokines/cytokine receptor gene sets in primary tumors of the 4T1-
compared to Py230-based intraductal model. Heatmaps displaying the log2 fold change in mean gene expression of selected genes involved in antigen presentation,
macrophage polarization and cytokines/cytokine receptors in 4T1 and Py230 primary tumor samples at 1, 3, and 6w p.i. The selection of the genes was based on the
gene list from the NanoString Mouse PanCancer Immune Profiling Panel and a publication by Yu et al. (30). Genes that characterize pro-inflammatory and
anti-inflammatory macrophage polarization were selected based on a publication by Jablonski et al. (31). Hierarchical clustering was performed using Pearson
distance.
inoculation for studying breast cancer. The added value of suchintraductally established tumors is that they grow from withinthe mammary ducts and first undergo ductal breakthrough priorto their invasion of the mammary fat pad and their metastasisto other organs, which more closely resembles the diseaseprocess in humans (3–5). The use of fully immunocompetentsyngeneic mice further allows to study the influence of theimmune system, which has recently been recognized to playa key role in mammary tumor progression (25, 26). In thiscontext, we have previously shown that macrophages are criticalregulators of the DCIS to IC progression and stimulate metastasisin the 4T1-based syngeneic intraductal model for TNBC (4).With the current comparative study, we aimed to gain deeperinsight in the immunological changes underlying aggressive4T1 vs. non-aggressive Py230 intraductal tumor progression,providing further characterization of the intraductal model
prior to its envisaged use for evaluation of novel breastcancer therapeutics.
Following intraductal inoculation, 4T1 tumor cells initiallygrew faster and showed earlier ductal breakthrough than Py230tumor cells, reproducibly metastasizing to axillary lymph nodes,lungs and livers at 6 w p.i., in marked contrast to the absence ofmetastases in the Py230-based intraductal model. Although it wasnot checked how long it takes for the Py230-based intraductalmodel to induce detectable metastases, previous studies reportedthat it may take up to 20 weeks for the development of Py230lung metastases (14). Indeed, the Py230 tumor cell line is notsusceptible to EMT, being an important feature to gain migratoryand hence metastatic capacity (32, 33).
At 6w p.i., 4T1 and Py230 primary tumors had a similar size,which could be explained by their marked difference in Ki67positivity and Ki67 proliferation index, reflecting a decreased
Frontiers in Immunology | www.frontiersin.org 14 December 2019 | Volume 10 | Article 2928
Steenbrugge et al. Intraductal Tumor Progression and Immunology
proliferation of 4T1 in time compared to Py230 primary tumors.Indeed, 4T1 tumors are typically only highly proliferative at theedges being a hallmark of their aggressive invasive and metastaticcharacter (34) while their core remains poorly proliferative dueto a lack of essential nutrients and oxygen (30). Our data furtherdemonstrated that Py230 tumors were able to catch up with4T1 tumor growth by proliferating both at the tumor core andthe edges. Complementary RNA-seq analysis could attributethis decreased proliferation of 4T1 compared to Py230 primarytumors to the significant downregulation of genes involved incellular mitosis at 3 w p.i. At that time point, a significantupregulation of genes involved in EMT and adipogenic/stromalprocesses indicated that 4T1 cells focus on both EMT andstromal development for metastasis rather than on primarytumor growth compared to Py230 cells. The increased expressionof genes related to adipogenesis and stromal processes can also beexplained by the fact that both 4T1 and Py230 cells were injectedin actively involuting mammary glands. Lactation makes the teatorifice accessible for intraductal inoculation without surgery ormicroscopic guidance (3, 5). Moreover, it offers a representativemodel for pregnancy-associated breast cancer, which is associatedwith high mortality rates in young women and has remainedunderstudied till date (35, 36).
The aggressive metastatic progression of the 4T1-basedtumors was further associated with increased local and systemiclevels of MMP-9, an essential matrix degrading protein that pavesthe way for invasion, and of VEGF, which is an important driverof blood vessel development for sustaining oxygen and nutrientsupply and for transporting tumor cells to distant organs. Ofrelevance, the kinetic variation of MMP-9 and VEGF levels intheir local fold inductions showed a remarkable resemblancewith the differential primary tumor growth between the TNBCmodels and the RNA-seq data. Indeed, at 1 w p.i., when 4T1primary tumors were significantly more proliferative than Py230primary tumors and cellular mitosis hallmarks were significantlyincreased in 4T1 compared to Py230 primary tumors, the MMP-9 levels were also more induced, allowing the fast expansionand ductal breakthrough of 4T1 tumor cells. However, at 3 wp.i., 4T1 primary tumors had become more oriented towardadipose/stromal processes, including angiogenesis, resulting ina significant induction of VEGF. In line with these results,the hallmark angiogenesis was most strongly and significantlyupregulated at 3w p.i. in 4T1 compared to Py230 primarytumors, as shown in the RNA-seq data. At 6w p.i., localMMP-9 was again more induced compared to VEGF, whichmay correspond with enhanced matrix degradation to allowmetastatic progression. However, this late MMP-9 inductionwas lower than the early one at 1w p.i., which may be dueto the similar tumor sizes and cellular mitosis at 6 w p.i. in4T1- vs. Py230-based primary tumors. In marked contrast, theVEGF induction at 6w p.i remained similar to that at 1 wp.i., corroborating the 4T1- vs. the Py230-based primary tumorRNA-seq data for the hallmark angiogenesis. The increased foldinduction of MMP-9 compared to VEGF at 6w p.i. in serum wasin line with the increased systemic disease at that endpoint in the4T1- compared to the Py230-based TNBC model as also shownby the enhanced metastasis and splenomegaly data.
Similar to VEGF levels, CD31 positivity identified enhancedvascularity in the 4T1-based intraductal model. CAIX positivityreflected the increased hypoxia in 4T1 primary tumorscorroborating the decreased proliferation in the 4T1 tumorcore, which the 4T1 tumor cells try to alleviate by stimulatingangiogenesis for enhanced oxygen and nutrient supply, andby increasing CAIX production for pH regulation (19). Analternative hypoxia biomarker is pimonidazole, which needsto be injected 1–2 h before scarification of the tumor-bearingmice and has been regarded as more superior because ofthis exogenous use in contrast to the endogenously producedCAIX (37, 38). Yet, several studies have reported a goodagreement and only minor variations between both thesehypoxia stainings on tumor sections from different cancer types,including breast cancer (39). Upon side-by-side comparison ofCAIX and pimonidazole stainings on 4T1 tumor sections in ourgroup, we also observed similar patterns and tumor hypoxia(data not shown). In marked contrast to 4T1 primary tumors,Py230 tumors showed only limited CAIX and CD31 positivity,indicative for a more oxygen-enriched and nutritious tumorenvironment enhancing cell viability and proliferation both atthe tumor core and edges, stimulating a fast and controlledtumor outgrowth. In line with our results, Yang et al. alsocategorized 4T1 tumors as highly angiogenic and invasive, butweakly proliferative compared to other mammary tumor celllines following orthotopic immunocompetent inoculation in themammary fat pad (40).
Progressing 4T1 tumors are associated with severesplenomegaly due to granulocytic hyperplasia (20, 21). Ourresults also showed how spleen sizes significantly increasedover time in the 4T1-based intraductal model, whereas inthe Py230-based intraductal model spleens remained almostat a normal size, suggesting differential leukemoid reactionsin both models. CHI3L1 and LCN2, two immune-relatedbiomarkers used for monitoring intraductal tumor progression(3, 4) and breast cancer patient prognosis (22–24), confirmedthe differential tumor progression and immunology withdifferential levels in spleens, primary tumors and serum ofboth models. Immunophenotyping identified an increase ofimmune cells in the 4T1 and Py230 primary tumors thatcorresponded to the ductal mammary tumor progression ineach intraductal model, corroborating previous studies thatassociated immune cell infiltration with tumor cell invasion inbreast cancer (41, 42). Both the abundance, localization and typeof immune cell populations were further investigated throughimmunohistochemistry. Most immune cells surrounded themammary tumors, including CD163+ TAMs. These TAMsare one of the most abundant type of immune cells in 4T1and Py230 primary tumors at 1 w p.i., corroborating previousstudies in mice and humans (30, 42) and highlighting theirinvolvement in DCIS to IC progression as shown recently by ourgroup (4). Others have also shown that macrophage depletionreduces tumor growth and invasion at early stages (43–46).Over time, more Ly6G+ TANs and CD3ε+ TILs were foundwithin the primary tumor mass. The role of these cell typesin DCIS to IC transition is not well-known, yet both pro- andanti-tumor properties have been attributed to them (47–49).
Frontiers in Immunology | www.frontiersin.org 15 December 2019 | Volume 10 | Article 2928

Steenbrugge et al. Intraductal Tumor Progression and Immunology
CD11c+ TADCs were also increasingly found over time withinthe tumor mass in both intraductal models and are important inT-cell activation through their antigen presenting function. AsCD11c+ TADCs and TILs are strongly correlated in TNBC (50),the increase in TADCs corroborates with an upregulation ofCD3ε+, CD8a+, and CD4+ cells in primary tumors. Moreover,as both 4T1 and Py230 tumors were infiltrated with TILs, andmore specifically immunoreactive CD8a+ cytotoxic T-cells andCD4+ T-helper cells, they can be classified as so called “hot”tumors (51). Yet, FoxP3+ regulatory T-cells were upregulated inPy230 compared to 4T1 primary tumors, highlighting a stronglyimmunosuppressed and proliferative microenvironment in thePy230-based model. The progressive NF-κB activation in Py230primary tumors and draining axillary lymph nodes corroboratedthe increases in tumor immune cell populations over time.
Cytokine profiles further corroborated the enhanced localand systemic leukemoid responses in the 4T1- compared toPy230-based intraductal model. More specifically, 4T1 primarytumors showed a stimulated pro-inflammatory cytokine profileincluding IL-1β, IL-6, IFN-γ, and TNF-α, suggesting a cytotoxicimmune microenvironment with T-cell activation. Althoughincreased TGF-β1 levels in the 4T1-based intraductal modelmight indicate immunosuppression, they can also be attributedto 4T1 tumor invasion (52). In marked contrast, Py230primary tumors showed a stimulated anti-inflammatory cytokineprofile including increased IL-10 and IL-4 levels at all timepoints, corroborating the enhanced regulatory T-cell positivityand immunosuppressive properties of Py230 primary tumors.Moreover, based on granzyme B and PD-1 positivity, 4T1tumors showed significantly stronger activation of cytotoxic T-cells compared to Py230 tumors, in line with the differentialcytokine profiles.
An important remaining question is what regulates anddetermines the immunological differences between bothintraductal TNBC models. An important tumor cell extrinsicfactor that should not be neglected and could have influencedthe tumor immunology is the mouse strain-dependent immunebias. Indeed, BALB/c mice are notoriously Th2 skewed andproduce potent antibody responses, which is one of the reasonsthat this is the strain of choice for hybridoma production, allergystudies and anti-parasite studies (30, 53–55). On the other hand,C57BL/6 mice are much more Th1 prone, which is the reasonwhy this strain is frequently used for viral and tumor studies(30, 53–55). Yet, the current study shows that C57BL/6-derivedPy230 primary tumors are more immunosuppressive comparedto BALB/c-derived 4T1 primary tumors, demonstrating thattumor cell intrinsic or other extrinsic factors overruled thestrain-specific immunity in regulating the mammary tumorimmune responses and phenotype. Of note, other frequentlyused C57BL/6-derived tumor cell lines are known to be highlyinflammatory compared to BALB/c-derived tumors (40, 56),demonstrating that not every tumor in C57BL/6 mice is lessinflammatory and again suggesting that intrinsic/extrinsic factorsplay a key role in shaping tumor immunity in mouse models. Thespecific environment in which tumor cells grow can also highlyimpact on the tumor immunology and immunotherapeuticresponses (30). To this end, orthotopic implantation of tumor
cells has been reported to establish a highly immunosuppressivetumor phenotype that is less responsive to immunotherapycompared to subcutaneously implanted tumors (30, 57). Sincethe mammary ducts are considered as the truly orthotopicinjection site for mammary tumor cells (5, 8), the intraductalmodel is most likely to resemble the correct immunophenotypeassociated with implanted mammary tumor cell lines and alsomimic tumor immunology and therapeutic responses observedin patients. Furthermore, it may be a concern that only 4T1cells carried a luciferase reporter gene, which as a foreign genecould influence the differential tumor immunology between the4T1- and Py230-based intraductal model. However, previousreports have shown that luciferase is a very weak antigen anddoes not significantly alter tumor progression (58, 59). Moreover,4T1 cells are also intrinsically weakly immunogenic and have alimited mutational burden (40, 58).
Further corroborating the cytokine profiles and the reportsthat T-cell activation may decrease tumor proliferation, RNA-seq also identified increased tumor-associated immune responsesin 4T1 compared to Py230 primary tumors. However, therewas a decreasing trend over time in all immunology-relatedgene sets, indicating that Py230 primary tumors were catchingup with 4T1 tumor immunology. This finding was alsohighlighted by gene sets for T-cell receptors and antigenpresentation, showing a decrease over time in differentialgene expression between 4T1 and Py230 primary tumors.Interestingly, CD274, also referred to as the immune checkpointprotein programmed death-ligand 1 (PD-L1), was one of thefew genes that remained upregulated at 6w p.i. compared to1w p.i., suggesting that the PD-L1 axis plays a critical role in4T1 tumor progression. The latter increase in expression alsocorroborates the increased protein levels of IFN-γ, an importantinducer for PD-L1 (60). Nevertheless, Mosely et al. reportedthat anti-PD-L1 treatment of 4T1 tumors fails to induce aneffective therapeutic response (56). Upon further investigationthese authors identified that granulocytic myeloid-derivedsuppressor cells (MDSCs) were present in high numbers inthese 4T1 primary tumors, highlighting excessive granulocytosisin the 4T1-based intraductal model (56). The decreasedexpression of anti-inflammatory and increased expression ofpro-inflammatory cytokines and macrophage markers over timein 4T1 compared to Py230 primary tumors again confirmedthat Py230 tumors are highly immunosuppressed and likely willbe even more refractory to checkpoint inhibitors. It can besuggested that in order to overcome immunosuppression andallow effective immunotherapy in both intraductal models forTNBC, an additional layer of treatment may be required, suchas chemotherapy, radiotherapy, agonists of T-cell co-stimulatoryreceptors or vaccines (56, 61, 62). Alternatively, Li et al. recentlyreported that TNBC can be eradicated by targeting glycosylatedPD-L1, inducing both immune re-activation as well as 4T1 tumorcell killing (63). The current study also showed a remarkableupregulation of genes related to androgen signaling in Py230primary tumors, indicating that androgens play an importantrole in intraductal Py230 tumor outgrowth (64). It can thereforebe suggested that inhibition of androgen receptor signalingmay provide a beneficial therapeutic effect in the Py230-based
Frontiers in Immunology | www.frontiersin.org 16 December 2019 | Volume 10 | Article 2928
Steenbrugge et al. Intraductal Tumor Progression and Immunology
intraductal model for TNBC. Of relevance and in line with thishypothesis, a subset of TNBC patients shows high expression ofthe androgen receptor and remains difficult to treat, but showsgood responses to anti-androgen therapy (65).
Taken together, the 4T1- and Py230-based intraductalmodel are characterized by a different tumor outgrowth andassociated tumor microenvironment. More specifically, whereas4T1 tumors are aggressively metastatic and show high levels ofEMT, hypoxia and inflammation, Py230 tumors remain locallyinvasive and show high proliferation and immunosuppression.These differential models may broadly represent the clinicallyobserved TNBC diversity and together provide a powerful toolto evaluate immunotherapy and therapeutic combinations in atruly orthotopic environment at both early (DCIS) or late stage(IC) breast carcinoma.
DATA AVAILABILITY STATEMENT
The RNA-seq data has been uploaded to GEO (Gene-ExpressionOmnibus)—the accession number is GSE140192. Other raw datasupporting the conclusions of this manuscript will be madeavailable by the authors, without undue reservation, to anyqualified researcher.
ETHICS STATEMENT
The animal study was reviewed and approved by the Committeeon the Ethics of Animal Experiments of The Faculty of VeterinaryMedicine at Ghent University (approval numbers: EC2015/127,EC2016/56 and EC2017/80).
AUTHOR CONTRIBUTIONS
JS, SV, and EM concepted and designed the study. JS, NV, and KDacquired the data. JS, NV, KD, and SV analyzed and interpretedthe data. JS drafted the manuscript. OD, NS, WV, LD, SV, andEM critically revised the manuscript. JS, NV, KD, OD, NS, WV,LD, SV, and EM gave their approval of the final manuscript.
FUNDING
This work was supported by an Emmanuel van der Schuerenresearch grant from Kom op tegen Kanker (Stand upto Cancer), the Flemish Cancer Society, the ResearchFoundation Flanders (FWO, grant n◦ G.0621.10) andGhent University.
ACKNOWLEDGMENTS
We kindly acknowledge Lobke De Bels (Department ofMorphology, Faculty of Veterinary Medicine, Ghent University,
Merelbeke, Belgium) for her assistance with histologyand immunohistochemistry.
SUPPLEMENTARY MATERIAL
The Supplementary Material for this article can be foundonline at: https://www.frontiersin.org/articles/10.3389/fimmu.2019.02928/full#supplementary-material
Supplementary Figure 1 | In vivo imaging of 4T1 primary tumor progression and
identification of metastases in the 4T1- and Py230-based intraductal model. (A)
Representative image of the in vivo bioluminescence as a measurement of primary
tumor growth in 4T1 intraductally inoculated mice at 1, 3, and 6w p.i. (B) H&E
histology for the identification of metastases in axillary lymph nodes, lungs, and
liver from 4T1 and Py230 intraductally inoculated mice at 6w p.i. Dashed inserts
show a magnification of tumor tissue in the 4T1-based intraductal model and
normal tissue in the Py230-based intraductal model. White dashed lines in the
axillary lymph node image derived from the 4T1-based intraductal model indicate
the border between normal and tumor tissue. Black scale bar = 100µm; red scale
bar = 50µm. Representative images of ex vivo bioluminescence derived from 4T1
metastases at 6w p.i. in axillary lymph nodes, lungs, and liver are also shown.
Supplementary Figure 2 | Fold induction of MMP-9 and VEGF levels in the 4T1-
compared to Py230-based intraductal model. (A) Table showing the mean
MMP-9 and VEGF levels measured in primary tumors and serum of the 4T1- and
Py230-based intraductal model at 1, 3, and 6w p.i. as displayed in Figures 3A,B.
The relative fold induction of mean MMP-9 and VEGF levels at each time point in
4T1- compared to Py230-derived primary tumors and serum was calculated and
displayed in red. (B,C) Graphs displaying the calculated fold induction of mean
MMP-9 and VEGF levels at 1, 3, and 6w p.i. in primary tumors (B) and serum (C)
of the 4T1- compared to the Py230-based intraductal model.
Supplementary Figure 3 | Host NF-κB activity upon progression of intraductally
inoculated Py230 tumor cells in NF-κB reporter mice. (A) Representative image of
the in vivo bioluminescence as a measurement of host NF-κB activation in Py230
intraductally inoculated NF-κB reporter mice at 1, 3, and 6w p.i. (B) Host NF-κB
activation in Py230 primary tumors up to 6w p.i. based on weekly measurements
of the total flux density at the inoculation sites (n = 20 tumors at 1w p.i., n = 10
tumors at all other time points). (C) Representative image of the ex vivo
bioluminescence in axillary lymph nodes of Py230 intraductally inoculated NF-κB
reporter mice at 1, 3, and 6w p.i. (D) Host NF-κB activation in axillary lymph
nodes of Py230 intraductally inoculated NF-κB reporter mice at 1, 3, and 6w p.i.
based on measurements of the total flux density (n = 4 axillary lymph nodes at 1
and 3w p.i., n = 5 axillary lymph nodes at 6w p.i.). Data are presented as the
means ± SEM. ∗P < 0.05, ∗∗P < 0.01, ∗∗∗P < 0.001.
Supplementary Figure 4 | Serum cytokine levels in the 4T1- compared to
Py230-based intraductal model and immunohistochemical analysis of activated
B-cells in 4T1 primary tumors. Cytokine levels at 1w p.i. (A), 3w p.i. (B), and 6w
p.i. (C) in serum of the 4T1- and Py230-based intraductal model (BAFF, G-CSF,
IFN-γ, IL-6, MCP-1, MIP-2, TNF-α: n = 5 at each time point and for both 4T1 and
Py230 sera; TGF-β1: n = 8 for 4T1 and n = 5 for Py230 at each time point). (D)
Immunohistochemistry for the activated B-cell marker CD19 on sections of 4T1
and Py230 primary tumors at 1, 3, and 6w p.i. (n = 5 at each time point for both
4T1 and Py230 primary tumors). Scale bar = 50µm. Data are presented as the
means ± SEM. NS, not significant. ∗P < 0.05, ∗∗P < 0.01, ∗∗∗P < 0.001.
Supplementary Figure 5 | Heatmap related to the hallmarks identified in
Figure 9. The heatmap displays the expression of the hallmarks from Figure 9 in
4T1 and Py230 primary tumors and Matrigel®-only inoculated mammary glands at
1, 3, and 6w p.i. (n = 3 at each time point for 4T1 and Py230 primary tumors and
Matrigel®-only inoculated BALB/c- and C57BL/6-derived mammary glands).
Hierarchical clustering was performed using Euclidean distance.
REFERENCES
1. Bray F, Ferlay J, Soerjomataram I, Siegel RL, Torre LA, Jemal
A. Global cancer statistics 2018: GLOBOCAN estimates of
incidence and mortality worldwide for 36 cancers in 185
countries. CA Cancer J Clin. (2018) 68:394–424. doi: 10.3322/caac.
21492
2. Spellman A, Tang SC. Immunotherapy for breast cancer: past,
present, and future. Cancer Metastasis Rev. (2016) 35:525–46.
doi: 10.1007/s10555–016-9654–9
Frontiers in Immunology | www.frontiersin.org 17 December 2019 | Volume 10 | Article 2928

Steenbrugge et al. Intraductal Tumor Progression and Immunology
3. Steenbrugge J, Breyne K, Denies S, Dekimpe M, Demeyere K, De Wever O,
et al. Comparison of the adipose and luminal mammary gland compartment
as orthotopic inoculation sites in a 4T1-based immunocompetent preclinical
model for triple-negative breast cancer. J Mammary Gland Biol Neoplasia.
(2016) 21:113–22. doi: 10.1007/s10911–016-9362–7
4. Steenbrugge J, Breyne K, Demeyere K, De Wever O, Sanders NN, Van
Den Broeck W, et al. Anti-inflammatory signaling by mammary tumor cells
mediates prometastatic macrophage polarization in an innovative intraductal
mouse model for triple-negative breast cancer. J Exp Clin Cancer Res. (2018)
37:191. doi: 10.1186/s13046–018-0860-x
5. Boiy R, Steenbrugge J, Van Deun J, Hendrix A, Meyer E, De Wever
O. Transparent reporting of experimental parameters in assays measuring
phenotypic steps in metastasis. Clin Exp Metastasis. (2018) 35:715–5.
doi: 10.1007/s10585–018-9944–4
6. Behbod F, Kittrell FS, LaMarca H, Edwards D, Kerbawy S, Heestand JC,
et al. An intraductal human-in-mouse transplantation model mimics the
subtypes of ductal carcinoma in situ. Breast Cancer Res. (2009) 11:R66.
doi: 10.1186/bcr2358
7. Russell TD, Jindal S, Agunbiade S, Gao D, Troxell M, Borges
VF, et al. Myoepithelial cell differentiation markers in ductal
carcinoma in situ progression. Am J Pathol. (2015)185:3076–89.
doi: 10.1016/j.ajpath.2015.07.004
8. Sflomos G, Dormoy V, Metsalu T, Jeitziner R, Battista L, Scabia V, et al.
A preclinical model for ERα-positive breast cancer points to the epithelial
microenvironment as determinant of luminal phenotype and hormone
response. Cancer Cell. (2016) 29:407–22. doi: 10.1016/j.ccell.2016.02.002
9. Ghosh A, Sarkar S, Banerjee S, Behbod F, Tawfik O, McGregor D, et al.
MIND model for triple-negative breast cancer in syngeneic mice for quick
and sequential progression analysis of lung metastasis. PLoS ONE. (2018)
13:e0198143. doi: 10.1371/journal.pone.0198143
10. Atiya HI, Dvorkin-Gheva A, Hassell J, Patel S, Parker RL, Hartstone-Rose
A, et al. Intraductal adaptation of the 4T1 mouse model of breast cancer
reveals effects of the epithelial microenvironment on tumor progression and
Metastasis.Anticancer Res. (2019) 39:2277–87. doi: 10.21873/anticanres.13344
11. CarlsenH,Moskaug JO, FrommSH, Blomhoff R. In vivo imaging of NF-kappa
B activity. J Immunol. (2002) 168:1441–6. doi: 10.4049/jimmunol.168.3.1441
12. Tao K, FangM, Alroy J, Sahagian GG. Imagable 4T1model for the study of late
stage breast cancer. BMCCancer. (2008) 8:228. doi: 10.1186/1471–2407-8–228
13. Kaur P, Nagaraja GM, Zheng H, Gizachew D, Galukande M, Krishnan S,
et al. A mouse model for triple-negative breast cancer tumor-initiating cells
(TNBC-TICs) exhibits similar aggressive phenotype to the human disease.
BMC Cancer. (2012) 12:120. doi: 10.1186/1471–2407-12–120
14. Bao L, Cardiff RD, Steinbach P, Messer KS, Ellies LG. Multipotent luminal
mammary cancer stem cells model tumor heterogeneity. Breast Cancer Res.
(2015) 17:137. doi: 10.1186/s13058–015-0615-y
15. Almeida JS, Iriabho EE, Gorrepati VL, Wilkinson SR, Gruneberg A, Robbins
DE, et al. ImageJS: personalized, participated, pervasive, and reproducible
image bioinformatics in the web browser. J Pathol Inform. (2012) 3:25.
doi: 10.4103/2153–3539.98813
16. Van Laere S, Van der Auwera I, Van den Eynden GG, Fox SB, Bianchi F,
Harris AL, et al. Distinct molecular signature of inflammatory breast cancer
by cDNA microarray analysis. Breast Cancer Res Treat. (2005) 93:237–46.
doi: 10.1007/s10549–005-5157-z
17. Babicki S, Arndt D, Marcu A, Liang Y, Grant JR, Maciejewski A, et al.
Heatmapper: web-enabled heat mapping for all. Nucleic Acids Res. (2016)
44:W147–53. doi: 10.1093/nar/gkw419
18. Lou Y, Preobrazhenska O, auf dem Keller U, Sutcliffe M, Barclay L, McDonald
PC, et al. Epithelial-mesenchymal transition (EMT) is not sufficient for
spontaneous murine breast cancer metastasis. Dev Dyn. (2008) 237:2755–68.
doi: 10.1002/dvdy.21658
19. Lou Y, McDonald PC, Oloumi A, Chia S, Ostlund C, Ahmadi A, et al.
Targeting tumor hypoxia: suppression of breast tumor growth and metastasis
by novel carbonic anhydrase IX inhibitors. Cancer Res. (2011) 71:3364–76.
doi: 10.1158/0008–5472.CAN-10–4261
20. DuPre SA, Hunter KW Jr. Murine mammary carcinoma 4T1
induces a leukemoid reaction with splenomegaly: association with
tumor-derived growth factors. Exp Mol Pathol. (2007) 82:12–24.
doi: 10.1016/j.yexmp.2006.06.007
21. Liu M, Jin X, He X, Pan L, Zhang X, Zhao Y. Macrophages support splenic
erythropoiesis in 4T1 tumor-bearing mice. PLoS ONE. (2015) 10:e0121921.
doi: 10.1371/journal.pone.0121921
22. Johansen JS, Jensen BV, Roslind A, Nielsen D, Price PA. Serum YKL-40, a new
prognostic biomarker in cancer patients? Cancer Epidemiol Biomarkers Prev.
(2006) 15:194–202. doi: 10.1158/1055–9965.EPI-05–0011
23. Bauer M, Eickhoff JC, Gould MN, Mundhenke C, Maass N, Friedl A.
Neutrophil gelatinase-associated lipocalin (NGAL) is a predictor of poor
prognosis in human primary breast cancer. Breast Cancer Res Treat. (2008)
108:389–97. doi: 10.1007/s10549–007-9619–3
24. Provatopoulou X, Gounaris A, Kalogera E, Zagouri F, Flessas I, Goussetis
E, et al. Circulating levels of matrix metalloproteinase-9 (MMP-9),
neutrophil gelatinase-associated lipocalin (NGAL) and their complex
MMP-9/NGAL in breast cancer disease. BMC Cancer. (2009) 9:390.
doi: 10.1186/1471–2407-9–390
25. Quail DF, Joyce JA. Microenvironmental regulation of tumor progression and
metastasis. Nat Med. (2013) 19:1423–37. doi: 10.1038/nm.3394
26. Binnewies M, Roberts EW, Kersten K, Chan V, Fearon DF, Merad M, et al.
Understanding the tumor immune microenvironment (TIME) for effective
therapy. Nat Med. (2018) 24:541–50. doi: 10.1038/s41591–018-0014-x
27. Taniguchi K, Karin M. NF- κB, inflammation, immunity and cancer: coming
of age. Nat Rev Immunol. (2018) 18:309–24. doi: 10.1038/nri.2017.142
28. Notebaert S, Carlsen H, Janssen D, Vandenabeele P, Blomhoff R, Meyer
E. In vivo imaging of NF-kappaB activity during Escherichia coli-
induced mammary gland infection. Cell Microbiol. (2008) 10:1249–58.
doi: 10.1111/j.1462–5822.2008.01123.x
29. Breyne K, Cool SK, Demon D, Demeyere K, Vandenberghe T, Vandenabeele P,
et al. Non-classical proIL-1beta activation during mammary gland infection
is pathogen-dependent but caspase-1 independent. PLoS ONE. (2014)
9:e105680. doi: 10.1371/journal.pone.0105680
30. Yu JW, Bhattacharya S, Yanamandra N, Kilian D, Shi H, Yadavilli S,
et al. Tumor-immune profiling of murine syngeneic tumor models as
a framework to guide mechanistic studies and predict therapy response
in distinct tumor microenvironments. PLoS ONE. (2018) 13:e0206223.
doi: 10.1371/journal.pone.0206223
31. Jablonski KA, Amici SA, Webb LM, Ruiz-Rosado Jde D, Popovich
PG, Partida-Sanchez S, et al. Novel markers to delineate murine
M1 and M2 macrophages. PLoS ONE. (2015) 10:e0145342.
doi: 10.1371/journal.pone.0145342
32. Mittal V. Epithelial mesenchymal transition in tumor metastasis. Annu Rev
Pathol. (2018) 13:395–412. doi: 10.1146/annurev-pathol-020117–043854
33. Lu W, Kang Y. Epithelial-mesenchymal plasticity in cancer progression and
metastasis. Dev Cell. (2019) 49:361–74. doi: 10.1016/j.devcel.2019.04.010
34. Pulaski B.A., Ostrand-Rosenberg S. Mouse 4T1 breast tumor model. Curr
Protoc Immunol. (2001) 20:2. doi: 10.1002/0471142735.im2002s39
35. Schedin P. Pregnancy-associated breast cancer and metastasis. Nat Rev
Cancer. (2006) 6:281–91. doi: 10.1038/nrc1839
36. McDaniel SM, Rumer KK, Biroc SL, Metz RP, Singh M, Porter W,
et al. Remodeling of the mammary microenvironment after lactation
promotes breast tumor cell metastasis. Am J Pathol. (2006) 168:608–20.
doi: 10.2353/ajpath.2006.050677
37. Aguilera KY, Brekken RA. Hypoxia Studies with Pimonidazole in vivo. Bio
Protoc. (2014) 4:e1254. doi: 10.21769/BioProtoc.1254
38. Bao B, Groves K, Zhang J, Handy E, Kennedy P, Cuneo G, et al. In vivo
imaging and quantification of carbonic anhydrase IX expression as an
endogenous biomarker of tumor hypoxia. PLoS ONE. (2012) 7:e50860.
doi: 10.1371/journal.pone.0050860
39. Tafreshi NK, Lloyd MC, Proemsey JB, Bui MM, Kim J, Gillies RJ, et al.
Evaluation of CAIX and CAXII expression in breast cancer at varied O2 levels:
CAIX is the superior surrogate imaging biomarker of tumor hypoxia. Mol
Imaging Biol. (2016) 18:219–31. doi: 10.1007/s11307–015-0885-x
40. Yang Y, Yang HH, Hu Y, Watson PH, Liu H, Geiger TR, et al.
Immunocompetent mouse allograft models for development of therapies
to target breast cancer metastasis. Oncotarget. (2017) 8:30621–43.
doi: 10.18632/oncotarget.15695
41. Ruffell B, Au A, Rugo HS, Esserman LJ, Hwang ES, Coussens LM. Leukocyte
composition of human breast cancer. Proc Natl Acad Sci USA. (2012)
109:2796–801. doi: 10.1073/pnas.1104303108
Frontiers in Immunology | www.frontiersin.org 18 December 2019 | Volume 10 | Article 2928

Steenbrugge et al. Intraductal Tumor Progression and Immunology
42. Gil Del Alcazar CR, Huh SJ, EkramMB, Trinh A, Liu LL, Beca F, et al. Immune
escape in breast cancer during in situ to invasive carcinoma transition. Cancer
Discov. (2017) 7:1098–115. doi: 10.1158/2159–8290.CD-17–0222
43. Lin EY, Nguyen AV, Russell RG, Pollard JW. Colony-stimulating factor 1
promotes progression of mammary tumors to malignancy. J Exp Med. (2001)
193:727–40. doi: 10.1084/jem.193.6.727
44. Rumney RMH, Coffelt SB, Neale TA, Dhayade S, Tozer GM, Miller G. PyMT-
Maclow: a novel, inducible, murine model for determining the role of CD68
positive cells in breast tumor development. PLoS ONE. (2017) 12:e0188591.
doi: 10.1371/journal.pone.0188591
45. Carron EC, Homra S, Rosenberg J, Coffelt SB, Kittrell F, Zhang
Y, et al. Macrophages promote the progression of premalignant
mammary lesions to invasive cancer. Oncotarget. (2017) 8:50731–46.
doi: 10.18632/oncotarget.14913
46. Linde N, Casanova-Acebes M, Sosa MS, Mortha A, Rahman A, Farias E, et al.
Macrophages orchestrate breast cancer early dissemination and metastasis.
Nat Commun. (2018) 9:21. doi: 10.1038/s41467–017-02481–5
47. Ostrand-Rosenberg S. Immune surveillance: a balance between protumor
and antitumor immunity. Curr Opin Genet Dev. (2008) 18:11–8.
doi: 10.1016/j.gde.2007.12.007
48. Uribe-Querol E, Rosales C. Neutrophils in cancer: two sides of the same coin.
J Immunol Res. (2015) 2015:983698. doi: 10.1155/2015/983698
49. Nelson AC, Machado HL, Schwertfeger KL. Breaking through to the
other side: microenvironment contributions to DCIS initiation and
progression. J Mammary Gland Biol Neoplasia. (2018) 23:207–21.
doi: 10.1007/s10911–018-9409-z
50. Lee H, Lee HJ, Song IH, Bang WS, Heo SH, Gong G, et al. CD11c-positive
dendritic cells in triple-negative breast cancer. In vivo. (2018) 32:1561–9.
doi: 10.21873/invivo.11415
51. Chen DS, Mellman I. Elements of cancer immunity and the cancer-immune
set point. Nature. (2017) 541:321–30. doi: 10.1038/nature21349
52. McEarchern JA, Kobie JJ, Mack V, Wu RS, Meade-Tollin L, Arteaga
CL, et al. Invasion and metastasis of a mammary tumor involves
TGF-beta signaling. Int J Cancer. (2001) 91:76–82. doi: 10.1002/1097--
0215(20010101)91:1<76::AID-IJC1012>3.0.CO;2--8
53. Watanabe H, Numata K, Ito T, Takagi K, Matsukawa A. Innate immune
response in Th1- and Th2-dominant mouse strains. Shock. (2004) 22:460–6.
doi: 10.1097/01.shk.0000142249.08135.e9
54. Yagi J, Arimura Y, Takatori H, Nakajima H, Iwamoto I, Uchiyama T. Genetic
background influences Th cell differentiation by controlling the capacity for
IL-2-induced IL-4 production by naive CD4+ T cells. Int Immunol. (2006)
18:1681–90. doi: 10.1093/intimm/dxl102
55. Trunova GV, Makarova OV, Diatroptov ME, Bogdanova IM, Mikchailova
LP, Abdulaeva SO. Morphofunctional characteristic of the immune system
in BALB/c and C57BL/6 mice. Bull Exp Biol Med. (2011) 151:99–102.
doi: 10.1007/s10517–011-1268–1
56. Mosely SI, Prime JE, Sainson RC, Koopmann JO, Wang DY, Greenawalt
DM, et al. Rational selection of syngeneic preclinical tumor models for
immunotherapeutic drug discovery. Cancer Immunol Res. (2017) 5:29–41.
doi: 10.1158/2326–6066.CIR-16–0114
57. Devaud C, Westwood JA, John LB, Flynn JK, Paquet-Fifield S, Duong CP,
et al. Tissues in different anatomical sites can sculpt and vary the tumor
microenvironment to affect responses to therapy.Mol Ther. (2014) 22:18–27.
doi: 10.1038/mt.2013.219
58. Rakhmilevich AL, Janssen K, Hao Z, Sondel PM, Yang NS. Interleukin-
12 gene therapy of a weakly immunogenic mouse mammary carcinoma
results in reduction of spontaneous lung metastases via a T-cell-independent
mechanism. Cancer Gene Ther. (2000) 7:826–38. doi: 10.1038/sj.cgt.7700176
59. Petkov SP, Heuts F, Krotova OA, Kilpelainen A, Engstrom G, Starodubova
ES, et al. Evaluation of immunogen delivery by DNA immunization using
non-invasive bioluminescence imaging. Hum Vaccin Immunother. (2013)
9:2228–36. doi: 10.4161/hv.25561
60. Mandai M, Hamanishi J, Abiko K, Matsumura N, Baba T, Konishi I. Dual
faces of IFNγ in cancer progression: a role of PD-L1 induction in the
determination of pro- and antitumor immunity. Clin Cancer Res. (2016)
22:2329–34. doi: 10.1158/1078–0432.CCR-16–0224
61. Medler TR, Cotechini T, Coussens LM. Immune response to cancer therapy:
mounting an effective antitumor response and mechanisms of resistance.
Trends Cancer. (2015) 1:66–75. doi: 10.1016/j.trecan.2015.07.008
62. Lechner MG, Karimi SS, Barry-Holson K, Angell TE, Murphy KA, Church
CH, et al. Immunogenicity of murine solid tumor models as a defining feature
of in vivo behavior and response to immunotherapy. J Immunother. (2013)
36:477–89. doi: 10.1097/01.cji.0000436722.46675.4a
63. Li CW, Lim SO, Chung EM, Kim YS, Park AH, Yao J, et al. Eradication of
triple-negative breast cancer cells by targeting glycosylated PD-L1. Cancer
Cell. (2018) 33:187–201 e10. doi: 10.1016/j.ccell.2018.01.009
64. Giovannelli P, Di Donato M, Auricchio F, Castoria G, Migliaccio A.
Androgens induce invasiveness of triple negative breast cancer cells
through AR/Src/PI3-K complex assembly. Sci Rep. (2019) 9:4490.
doi: 10.1038/s41598–019-41016–4
65. Gerratana L, Basile D, Buono G, De Placido S, Giuliano M, Minichillo
S, et al. Androgen receptor in triple negative breast cancer: a potential
target for the targetless subtype. Cancer Treat Rev. (2018) 68:102–10.
doi: 10.1016/j.ctrv.2018.06.005
Conflict of Interest: The authors declare that the research was conducted in the
absence of any commercial or financial relationships that could be construed as a
potential conflict of interest.
Copyright © 2019 Steenbrugge, Vander Elst, Demeyere, De Wever, Sanders, Van
Den Broeck, Dirix, Van Laere and Meyer. This is an open-access article distributed
under the terms of the Creative Commons Attribution License (CC BY). The use,
distribution or reproduction in other forums is permitted, provided the original
author(s) and the copyright owner(s) are credited and that the original publication
in this journal is cited, in accordance with accepted academic practice. No use,
distribution or reproduction is permitted which does not comply with these terms.
Frontiers in Immunology | www.frontiersin.org 19 December 2019 | Volume 10 | Article 2928