Comparative Population Genomics and Biophysical Modeling ...
17
Nova Southeastern University Nova Southeastern University NSUWorks NSUWorks Biology Faculty Articles Department of Biological Sciences 2-7-2020 Comparative Population Genomics and Biophysical Modeling of Comparative Population Genomics and Biophysical Modeling of Shrimp Migration in the Gulf of Mexico Reveals Current-Mediated Shrimp Migration in the Gulf of Mexico Reveals Current-Mediated Connectivity Connectivity Laura Timm Florida International University; University of Colorado-Anschutz Medical Campus Lys M. Isma Florida International Laboratory Matthew Johnston Nova Southeastern University, [email protected] Heather D. Bracken-Grissom Florida International University Follow this and additional works at: https://nsuworks.nova.edu/cnso_bio_facarticles Part of the Biology Commons NSUWorks Citation NSUWorks Citation Timm, Laura; Lys M. Isma; Matthew Johnston; and Heather D. Bracken-Grissom. 2020. "Comparative Population Genomics and Biophysical Modeling of Shrimp Migration in the Gulf of Mexico Reveals Current-Mediated Connectivity." Frontiers in Marine Science 7, (19): 1-16. doi:10.3389/fmars.2020.00019. This Article is brought to you for free and open access by the Department of Biological Sciences at NSUWorks. It has been accepted for inclusion in Biology Faculty Articles by an authorized administrator of NSUWorks. For more information, please contact [email protected].
Transcript of Comparative Population Genomics and Biophysical Modeling ...

Nova Southeastern University Nova Southeastern University
NSUWorks NSUWorks
Biology Faculty Articles Department of Biological Sciences
2-7-2020
Comparative Population Genomics and Biophysical Modeling of Comparative Population Genomics and Biophysical Modeling of
Shrimp Migration in the Gulf of Mexico Reveals Current-Mediated Shrimp Migration in the Gulf of Mexico Reveals Current-Mediated
Connectivity Connectivity
Laura Timm Florida International University; University of Colorado-Anschutz Medical Campus
Lys M. Isma Florida International Laboratory
Matthew Johnston Nova Southeastern University, [email protected]
Heather D. Bracken-Grissom Florida International University
Follow this and additional works at: https://nsuworks.nova.edu/cnso_bio_facarticles
Part of the Biology Commons
NSUWorks Citation NSUWorks Citation Timm, Laura; Lys M. Isma; Matthew Johnston; and Heather D. Bracken-Grissom. 2020. "Comparative Population Genomics and Biophysical Modeling of Shrimp Migration in the Gulf of Mexico Reveals Current-Mediated Connectivity." Frontiers in Marine Science 7, (19): 1-16. doi:10.3389/fmars.2020.00019.
This Article is brought to you for free and open access by the Department of Biological Sciences at NSUWorks. It has been accepted for inclusion in Biology Faculty Articles by an authorized administrator of NSUWorks. For more information, please contact [email protected].
ORIGINAL RESEARCHpublished: 07 February 2020
doi: 10.3389/fmars.2020.00019
Frontiers in Marine Science | www.frontiersin.org 1 February 2020 | Volume 7 | Article 19
Edited by:
Tracey T. Sutton,
Nova Southeastern University,
United States
Reviewed by:
Alastair Brown,
University of Southampton,
United Kingdom
Ann I. Larsson,
University of Gothenburg, Sweden
*Correspondence:
Laura E. Timm
Specialty section:
This article was submitted to
Deep-Sea Environments and Ecology,
a section of the journal
Frontiers in Marine Science
Received: 31 July 2019
Accepted: 13 January 2020
Published: 07 February 2020
Citation:
Timm LE, Isma LM, Johnston MW and
Bracken-Grissom HD (2020)
Comparative Population Genomics
and Biophysical Modeling of Shrimp
Migration in the Gulf of Mexico
Reveals Current-Mediated
Connectivity. Front. Mar. Sci. 7:19.
doi: 10.3389/fmars.2020.00019
Comparative Population Genomicsand Biophysical Modeling of ShrimpMigration in the Gulf of MexicoReveals Current-MediatedConnectivityLaura E. Timm 1,2*, Lys M. Isma 1, Matthew W. Johnston 3 and Heather D. Bracken-Grissom 1
1CRUSTOMICS Laboratory, Department of Biological Sciences, Institute of Water and Environment, Florida International
University, North Miami, FL, United States, 2 Evolutionary Genomics Laboratory, Department of Biochemistry and Molecular
Genetics, University of Colorado-Anschutz Medical Campus, Aurora, CO, United States, 3Oceanic Ecology Laboratory,
Halmos College of Natural Sciences and Oceanography, Nova Southeastern University, Dania Beach, FL, United States
The Gulf of Mexico experiences frequent perturbations, both natural and anthropogenic.
To better understand the impacts of these events, we must inventory natural variability
within the ecosystem, communities, species, and populations, and contextualize
these findings in relation to physical features. Here, we present an integrated study
of comparative population genomics and biophysical oceanography. Targeting three
species of mesopelagic shrimp common to the Gulf of Mexico midwater (Acanthephyra
purpurea, Systellaspis debilis, and Robustosergia robusta), we analyzed genetic diversity
and population connectivity as proxies for species health and resilience, respectively.
We also simulated a range of vertical migratory behaviors for the shrimp to infer the
relationship between diel vertical migration and horizontal transmission between the Gulf
of Mexico and the greater Atlantic Ocean. This study aims to establish biological baselines
and characterize these values in terms of the prevailing oceanographic feature of the
midwater: the Gulf Loop Current. Generally, the oplophorid species (A. purpurea and S.
debilis) exhibit lower genetic diversity and higher interpopulation homogeneity compared
to the sergestid (R. robusta). Biophysical simulations suggest the differences in vertical
migratory regimes between these two groups have important implications for horizontal
transport out of the Gulf of Mexico. Because of the difference in vertical migration
patterns, access to the Gulf Loop Current varies across taxa and impacts inter-basin
migration. Our findings suggest a negative correlation between surface abundance and
genetic diversity in these three shrimp species. We hypothesize that this correlation may
be due to the relationships between surface abundance and access to the fastest moving
waters of the Gulf Loop Current.
Keywords: genetic diversity, connectivity, biophysical oceanographic modeling, diel vertical migration, midwater
shrimp, Gulf Loop Current, Gulf of Mexico, Bear Seamount

Timm et al. Population Connectivity in Midwater Shrimp
INTRODUCTION
The Gulf of Mexico experiences frequent environmentalperturbations. In the past decade alone, the region has beenstruck by two major hurricanes: Hurricane Ike in 2008 (Krausand Lin, 2009) and Hurricane Harvey in 2017 (van Olderborghet al., 2017). Additionally, three major oil spills have impactedthe region: the Deepwater Horizon Oil Spill in 2010 (Beyeret al., 2016), the Shell Brutus Platform Spill in 2016, and anadditional pipeline rupture 40 miles south of the Louisianacoastal city of Venice in 2017 (Nelson and Grubesic, 2018).The Gulf of Mexico also hosts a hyper-diverse mesopelagic zone(Sutton et al., 2017) and is described as a unique biogeographicecoregion, distinct from the Caribbean Sea, Sargasso Sea, andgreater Atlantic Ocean (Backus et al., 1977; Gartner, 1988).The frequent perturbations, both natural and anthropogenic,may have a drastic impact on the Gulf mesopelagic given itsunique biological community and connections (St. John et al.,2016). Research efforts must focus on diagnosing Gulf health,contextualizing health in relation to the Gulf ’s relationship tothe greater Atlantic, and understanding the role(s) of majoroceanographic features on inter-basin population connectivity.
Genetic diversity and genetic connectivity, common metricstargeted in population genomics, provide especially valuableinformation about enigmatic species, serving as establishedproxies for species health and resilience, respectively (Hellberget al., 2002; Hughes and Stachowicz, 2004; Danovaro et al., 2008;Cowen and Sponaugle, 2009). Genetic diversity is measured asthe number of alleles present within a population or species.A population’s or species’ ability to adapt to new or changingenvironments is closely tied to higher genetic diversity (Hughesand Stachowicz, 2004; Danovaro et al., 2008; Cowen andSponaugle, 2009). Thus, local adaptation can be crucial to apopulation’s maintained health in the face of environmentaldisturbances. The movement and distribution of genes withinor between systems is described by population connectivity.Population connectivity can be characterized as inter-populationgene flow or migration, or the historical demography ofpopulations, such as recent separation or re-mixing of distinctpopulations and/or changes to population size (Cowen et al.,2007). The ecological implications of these population dynamicsare crucial to species resilience: following a localized perturbationevent, gene flow between geographically separated populationscan provide a functional genetic reservoir outside the disturbedarea (Hellberg et al., 2002; Cowen and Sponaugle, 2009).
This study focuses on population genomics and biophysical
connectivity of three mesopelagic crustacean species in relation
to the Gulf Loop Current (GLC) and associated eddies, the
principal mixing features in the Gulf of Mexico. Generally, theGLC enters the Gulf of Mexico through the Yucatan Channel andexits through the Florida Straits, occupying the upper (surface to∼800m) water column (Oey et al., 2005; Hamilton et al., 2014).The GLC is characterized by relatively warm, fast-moving waterwith speeds as swift as 1.7m s−1 (Forristall et al., 1992) in surfacewaters (e.g., the top 100m of the water column; Hamilton et al.,2014), decreasing to a maximum speed of 0.4m s−1 between100 and 200m depth, and continuing to slow with depth. Below
1,000m depth, water movement is generally considered to beindependent of the Gulf Loop Current (Oey et al., 2005; Hamiltonet al., 2014). Recent work focused on characterizing water massesin the Gulf presents evidence of distinctly structured microbialcommunities associated with mesoscale features (Johnston et al.,2019). Given that the Loop Current has been associated withlower biomass and abundances of pelagic organisms (Biggs, 1992;Biggs and Muller-Karger, 1994; Zimmerman and Biggs, 1999;Wells et al., 2017), it is not unrealistic to conclude the currenthas real, biologically significant impacts on the diversity anddistribution of pelagic fauna within the Gulf.
Many midwater organisms exhibit diel vertical migratorybehavior, occupying deeper water during the day andmoving intoepipelagic/surface water at night (Loose and Dawidowicz, 1994;Brierley, 2014). This behavior results in substantial, diel increasesin surface abundances for a number of “midwater” species.However, differences in migratory behavior (ranging from“non-migratory,” wherein depth-discrete abundances remainunchanged over a solar cycle, to different degrees of migratory)can be described in terms of migratory regimes (Brierley,2014). Recently, a population genetics/genomics study ofthree mesopelagic cephalopod species, representing a range ofmigratory regimes, found evidence for a correlation betweensurface abundance and inter-basin population dynamics in theGulf of Mexico and the greater Atlantic Ocean (Timm et al.,2020). The authors posit that this putative relationship betweensurface abundance and inter-basin population dynamics is dueto the division of these regimes into concomitant “tiers” of accessto the Gulf Loop Current. Here, we seek to further investigatethis trend through the addition of biophysical modeling ofmigration regimes and the population genomics analysis of threecrustacean species.
All three species targeted in this study (Figure 1) verticallymigrate to some degree, but exhibit contrasting life histories,specifically in reproductive behavior and generation time. Theoplophorids Acanthephyra purpurea (Milne-Edwards, 1881a)and Systellaspis debilis (Milne-Edwards, 1881b) brood theireggs (Herring, 1967, 1974a,b) and can live multiple years(Ramirez Llodra, 2002). The sergestid species, Robustosergiarobusta (Smith, 1882) reproduces by releasing fertilized eggsinto the water column (Vereshchaka, 2009) and lives ∼15mo (based on studies of co-occurring sergestid species, seeGenthe, 1969; Uchida and Baba, 2008). Additionally, surveyshave indicated that R. robusta diel vertical migratory behaviordiffers geographically (Foxton, 1970; Donaldson, 1975; Frogliaand Giannini, 1982; Froglia and Gramitto, 2000; Vereshchaka,2009) and ontologically: larvae migrate into shallower watersthan juveniles, which in turn migrate into shallower watersthan adults (Flock and Hopkins, 1992). Such ontological shiftsin diel vertical migratory behavior have also been found inA. purpurea and S. debilis (Roe, 1984; De Robertis, 2002).These insights into diel vertical migration make Gulf-specificobservations of vertical migratory behavior necessary for bothoplophorid species (Burdett et al., 2017) and R. robusta (Frank,pers. comm.). Combined with our increased understanding ofthe complexities of the Gulf Loop Current (Johnston et al.,2019) and the short lifespan of R. robusta, this behavior
Frontiers in Marine Science | www.frontiersin.org 2 February 2020 | Volume 7 | Article 19

Timm et al. Population Connectivity in Midwater Shrimp
FIGURE 1 | Three species of mesopelagic shrimp targeted in this study,
including the oplophorids (A) Acanthephyra purpurea (Milne-Edwards, 1881a)
(photo credit: Dr. T.-Y. Chan) and (B) Systellaspis debilis (Milne-Edwards,
1881b) (photo credit: Dr. Danté Fenolio), and the sergestid (C) Robustosergia
robusta (Smith, 1882) (photo credit: Dr. Danté Fenolio). Discrete depth
abundances are reported for A. purpurea and S. debilis (D,E), respectively
(Burdett et al., 2017) and R. robusta (F) (Frank, pers. comm.). Relative
abundances, indicated by bar length, are plotted by depth (in meters) and
solar cycle (“Day” is represented by gray bars to the left; “Night” is represented
by black bars to the right).
may have an amplified impact on population dynamics. Inshort, we expect this study to yield great insight into theinterplay between behavior and population dynamics in theGulf midwater.
The research presented here seeks fine-scale resolution toidentify differences in diversity and connectivity (the latter,both genetic and biophysical) in non-model organisms acrossrelatively small geographic distances. To quantify geneticdiversity and inter-basin gene flow with the greatest powerrealistically available, we utilized a powerful next-generationsequencing (NGS) method, double digest Restriction siteAssociated DNA sequencing (ddRADseq, as described byPeterson et al., 2012). This approach allowed us to query arepresentative, reproducible fraction of the genome and generateorders of magnitude more data with greater statistical powerthan traditional population genetics studies have done (Daveyand Blaxter, 2010; Peterson et al., 2012; Reitzel et al., 2013;Catchen et al., 2017). Next, we employed a biophysical dispersalmodel to simulate the migration behaviors and subsequentresidency within the Gulf of Mexico of both diel migrators andnon-migrators. The model integrated ocean circulation in theupper 1,500m of the water column from the Hybrid CoordinateOcean Model (HYCOM) and passive dispersal (exclusive of dielmigrations) of particles representing our study species. The goalwas to emulate the overall displacement effect of swift surfacewaters on migrators vs. non-migrators. Integrating the resultsfrom these two approaches, genetic and biophysical, allowed usto objectively define migration regimes and test for regime effecton population genomics across species.
Our study represents a comparative, integrative NGS andbiophysical modeling investigation into the role of behaviorand oceanography on population dynamics in three speciesof crustacean ubiquitous in the mesopelagic Gulf. This study
utilizes a dual approach to infer biological resilience in the Gulfand model the role of the Gulf Loop Current in maintainingthis resilience. To accomplish this goal we (1) quantify geneticdiversity in each species and compare between the Gulf and BearSeamount in the northern Atlantic; (2) characterize populationconnectivity between the Gulf and greater Atlantic from ahybrid population genomics-biophysical modeling perspective;(3) correlate surface abundance with diversity and connectivity;and (4) improve our understanding of crustacean health andresilience in the region, specifically in the context of species-and/or population-specific diel vertical migratory behavior andthe major oceanographic feature of the region, the GulfLoop Current.
MATERIALS AND METHODS
Adult specimens of A. purpurea, S. debilis, and R. robusta werecollected from the northern Gulf of Mexico during the wet(August) and dry (May) seasons of 2015 and 2016 as part ofthe Gulf of Mexico Research Initiative (GOMRI)-funded DeepPelagic Nekton Dynamics of the Gulf of Mexico (DEEPEND)project on the R/V Point Sur (Figure 2). During the DEEPENDcruises, every collection site was sampled twice: a day sample(entire water column from 0 to 1,500m depth, sampled at noon)and a night sample (0–1,500m depth, sampled at midnight). Gulfsamples were collected with a Multiple Opening/Closing Net andEnvironmental Sensing System (MOC-10) rigged with six 3-mmmesh nets, allowing for collected specimens to be assigned toa depth bin (0–200m, 200–600m, 600–1,000m, 1,000–1,200m,and 1,200–1,500m; the sixth net sampled from 0 to 1,500m). In2016, samples of A. purpurea and S. debilis were also collectedfrom the Florida Straits aboard the R/VWalton Smith.Maximumsampling depth in the Florida Straits was determined by waterdepth and trawls ran every few hours. For this cruise, specimenswere collected with a 9 m2 Tucker trawl fitted with a cod-endcapable of closure at-depth, allowing for discrete depth sampling.All three species were collected from Bear Seamount in theNorthern Atlantic in 2014 as part of the Deepwater Systematicsproject, funded by the NMFS Northeast Fisheries Science Centerand conducted on the R/V Pisces. Samples were collected fromBear Seamount with a modified Irish herring trawl.
All samples were identified to species and collected as whole-specimens, either in 70% EtOH or a RNA-stabilizing buffer, andstored at −20◦C onboard the vessel before being transferred to a−80◦C freezer in the Florida International University CrustaceanCollection (FICC). Collected samples were then given a uniquevoucher ID in the FICC database, including all relevant collectiondata. Muscle tissue was plucked for each specimen and storedin 70% EtOH or a RNA-stabilizing buffer, in accordance withhow the whole-specimen was originally collected, and stored in a−80◦C freezer. Voucher specimens were preserved in 70% EtOHand deposited in the FICC. In total, 247 samples of A. purpureawere collected, 218 samples of S. debilis, and 95 samples of R.robusta. For each species, a subset of individuals was selected toprovide adequate representation for each sampling locality (BearSeamount, Florida Straits, and the Gulf of Mexico). These subsets
Frontiers in Marine Science | www.frontiersin.org 3 February 2020 | Volume 7 | Article 19

Timm et al. Population Connectivity in Midwater Shrimp
FIGURE 2 | A map of sites sampled from the Gulf of Mexico, the Florida Straits, and Bear Seamount in the Atlantic Ocean.
and metadata associated with each specimen are included in thisstudy are detailed in Supplemental Information 1.
DNA Extraction and Sample BarcodingDNA was extracted with the DNeasy Blood and Tissue Kit(Qiagen), following the protocol provided by the manufacturer.Due to the high quality of DNA necessary for robust ddRADseqdata, several quality control measures were taken, many of whichare detailed in O’Leary et al. (2018). First, the amount of DNAwas ascertained with the Qubit dsDNA High Sensitivity Assay(Thermo Fisher). Next, DNA extractions were visualized on a 2%agarose gel with GelRed (Biotium) run for 90min at 100V toensure the presence of exclusively high molecular weight DNA.Samples with<500 ng DNA and/or a preponderance of degradedDNA were excluded from library preparation.
Finally, every individual eligible for ddRADseq librarypreparation was barcoded with the 16S ribosomal subunit, 16S(A. purpurea and S. debilis) or cytochrome oxidase subunit I, COI(R. robusta). Because these barcodes were used solely to confirmtaxonomic species identification (and not for downstream
analyses), genes were selected based on ease of amplificationfor each species (that is, universal primers were effective).Polymerase Chain Reaction (PCR) occurred in 25-µl volumes:12.5 µl GoTaq DNA Polymerase (Promega), 1 µl of each primer,8.5 µl of sterile distilled water, and 2 µl of template DNA.The primer combinations, sequences, and references, as well asannealing temperatures and amplicon length (in base pairs) arepresented in Supplemental Information 2. All PCR productswere visualized on a 1% agarose gel in the same manner as theDNA extractions.
Amplicons were cleaned and sequenced at the Genewizsequencing facility in Newark, NJ, USA. Quality filtering ofraw reads, contig assembly, ambiguity determination, primerremoval, and alignment withMAFFT (Katoh and Standley, 2013)occurred in Geneious v.9.3 (Kearse et al., 2012). The alignmentwas visually inspected for errors in MEGA7 (Kumar et al., 2016)before determining the reading frame and codon position of COI.
Cleaned, aligned sequences were queried against the NCBIGenBank database using the Basic Local Alignment Search Tool(BLAST) for standard nucleotide. Before querying, we confirmed
Frontiers in Marine Science | www.frontiersin.org 4 February 2020 | Volume 7 | Article 19

Timm et al. Population Connectivity in Midwater Shrimp
that all three species were present in the database for the locus wesequenced (16S or COI). A barcode was considered amatch whenthe percent identity of the match was ≥99%. Only individualswhose taxonomic identification was supported by BLAST resultswere included in ddRADseq library preparation.
Next-Generation Sequencing WithddRADseqLibrary PreparationDouble digest RADseq libraries were successfully prepared for96 individuals of A. purpurea, 96 individuals of S. debilis,and 95 individuals of R. robusta. Reduced representationlibraries were prepared according to the double digest RADseq(ddRADseq) method (Peterson et al., 2012). Generally, enzymetrials were completed to determine the appropriate enzymecombinations and size selection windows. DNA was digestedwith a combination of two enzymes (New England Biolabs) andcustom barcoded adapters were synthesized and ligated to thefragments resulting from double digest. Once barcoded, samplescould be pooled into sublibraries, which were size selected ona PippinPrep (Sage Science). Specific enzyme combinations,custom barcoded adapter sequences, and size selection schemesare reported in Supplemental Information 3. Size selectedfragments were then amplified via PCR with Phusion Hi-FidelityPolymerase (Thermo Scientific), which also incorporated indices(i7) and Illumina adapters into the fragments and allowed forpooling of sublibraries into the final libraries; 12 sublibraries perlibrary and one library per species. The final libraries were qualitychecked on an Agilent BioAnalyzer 2100 (Agilent Technologies)before the library was sent for sequencing on an IlluminaNextSeq, SE75 high output, at the Georgia Genomics Facility atthe University of Georgia.
Quality Filtering and Data AssemblyRaw sequence files were processed with the STACKS v1.45(Catchen et al., 2013) pipeline on the FIU High PerformanceComputing Cluster (HPCC). In process_radtags, reads weredemultiplexed, cleaned (-c), and quality-filtered (-q). The ustacksprogram aligned identical reads within each individual, thenthese consensus reads were cataloged in cstacks. All putativeloci were queried against this catalog with sstacks beforerxstacks corrected individual genotype calls according to theaccumulated population data. Here, “population” is determinedby the collection location of each specimen; for example, allspecimens collected from the Gulf of Mexico were labeled asmembers of the “Gulf” population. Finally, the populationsprogram output a file of aligned, putatively unlinked single-nucleotide polymorphisms (SNPs). Two requirements had to bemet for a given SNP to be called: first, the minimum read depth(-m = 5) had to be met; second, the SNP needed to be found in25% of the individuals of a population (-r = 0.25) for the SNP tobe called for that population. After SNPs were called accordingto these parameters, two additional requirements needed to bemet for a given SNP to be retained: the SNP had to be presentin all populations (Bear Seamount, Florida Straits, and Gulf)and, to increase the likelihood of excluding linked loci, only onerandom SNP was called per locus (–write_random_snp). These
parameter settings were chosen to exclude reads originatingfrommitochondrial and ribosomal sequences (relative to nuclearsequence, these are generally considered to differ substantiallyin frequency, thus these are functionally removed with the stackdepth parameter) and to prevent the inclusion of paralogs (alsocontrolled with stack depth).
Each file of aligned SNPs then underwent an iterative missingdata filter. Loci with >95% missing data were removed, followedby individuals with >95% missing data. This was repeated with90% missing data, then 85%, and so on. This was repeated untilonly 10% missing data was allowed by locus and individual oruntil ∼500 loci remained. This “500 SNP” rule was necessaryin the case of the oplophorids A. purpurea and S. debilis, asstrict filtering resulted in data sets reduced to unusably smallsizes. This is likely the result of very large genome sizes: theamount of data returned from the Illumina NextSeq is relativelyfixed, therefore larger genomes will yield smaller amounts ofconsistently reproducible reads across individuals. Finally, weused BayeScan v2.1 (Foll and Gaggiotti, 2008) to identify FSToutliers within each filtered data set. Any loci identified as outlierswere removed. Sample sizes for each species following qualityfiltering are reported in Table 1.
Molecular Data AnalysisSeveral genetic diversity indices were calculated in GENODIVEv2.0b23 (Meirmans and Van Tienderen, 2004), includingobserved heterozygosity (Ho), the inbreeding coefficient (GIS),and expected heterozygosity (He, which was calculated from theHo and GIS values). Jackknifing over loci was used to calculatestandard deviation.
GENODIVE was also used to measure populationdifferentiation (FST) and calculate hierarchical Analyses ofMolecular Variance (AMOVAs, including FIT and FIS) withthe Infinite Allele Model. Both analyses were run under 999permutations to assess significance. For the AMOVAs, missingdata were replaced with randomly drawn alleles determined byoverall allele frequencies.
We employed the Bayesian program STRUCTURE v2.3.4(Pritchard et al., 2000) to test for population structure withinthe data. Seven K-values were tested (K = 1–7) 10 times eachunder the admixture model. Following a burn-in of 20,000generations, 200,000 Markov Chain Monte Carlo generationsran. In STRUCTURE HARVESTER v0.6.94 (Earl and VonHoldt,2012), STRUCTURE results were collated and ad hoc posteriorprobability models (Pritchard et al., 2000) and the Evannomethod (Evanno et al., 2005) were used to infer the optimalK value. STRUCTURE HARVESTER also generated CLUsterMatching and Permutation Program (CLUMPP) files forindividuals and populations. These files were input into CLUMPPv1.1.2 (Jakobsson and Rosenberg, 2007), resulting in input filescompatible with distruct v1.1 (Rosenberg, 2004) and facilitatingthe visualization of estimated membership coefficients.
Two additional, non-model based methods were alsoemployed for inferring and visualizing population structure:multi-dimensional scaling (MDS) plots and PrincipleComponent Analyses (PCAs) were rendered for each dataset using the R packages MASS (Venables and Ripley, 2002)
Frontiers in Marine Science | www.frontiersin.org 5 February 2020 | Volume 7 | Article 19

Timm et al. Population Connectivity in Midwater Shrimp
TABLE 1 | Sample sizes and diversity indices, including observed heterozygosity (Ho) and expected heterozygosity (He), for the three targeted species: Acanthephyra
purpurea, Systellaspis debilis, and Robustosergia robusta.
N Ho He AMOVA Results
Overall Atlantic FL
straits
Gulf Overall Atlantic FL
straits
Gulf Overall Atlantic FL
straits
Gulf FIT FIS FST
A. purpurea 86 17 15 54 0.057 0.058 0.063 0.044 0.122 0.116 0.127 0.114 83.9% 16.1%* 0.0%
S. debilis 91 8 14 69 0.054 0.070 0.039 0.048 0.094 0.080 0.093 0.098 80.6% 19.4%* 0.0%
R. robusta 37 10 – 27 0.089 0.090 – 0.089 0.104 0.105 – 0.104 71.9% 11.9%* 16.2%*
Results of the hierarchical AMOVAs conducted to characterize genetic variation among individuals (FIT = 71.9%−83.9%), among individuals within populations (FIS = 11.9%−19.4%),
and among populations (FST = 0%−16.2%). The Infinite Allele Model was used with 999 permutations to assess statistical significance, which is reported in parentheses. Any missing
data was replaced with randomly drawn alleles determined by the overall allele frequencies of the data set. AMOVA results indicate the vast majority of variance is due to differences
between individuals (FIT ), regardless of the region from which they were sampled. *p < 0.05.
and adegenet (Jombart and Ahmed, 2011), respectively.These methods are very similar, however MDS preservesdistance/dissimilarity between data points while PCA preservescovariance within the data.
Biophysical Oceanographic SimulationsTo further assess the potential population connectivity betweenthe Gulf of Mexico (GOM) and greater Atlantic for the threetarget species, R. robusta, A. purpurea, and S. debilis, weran a suite of simulations representing both migrating andnon-migrating deep-sea fauna (hereafter “particles”) using aderivation of a particle-tracking, Lagrangian biophysical modelpreviously used to study the dispersal of marine organisms(Johnston and Bernard, 2017; Riegl et al., 2018). The purpose wasto assess if strong surface circulation had an overall effect on thediffusion of diel migrators vs. non-migrators outside of the GOM(i.e., a proxy for connectivity to the greater Atlantic). Please seeSupplemental Information 4 for a complete description of themodel logic following theOverview, Design concepts, andDesign(ODD) protocol as per (Grimm et al., 2006, 2010; Grimm andRailsback, 2005). The following is an abbreviated description ofthe simulations that were run, including their parameterization.
The primary “model domain” spanned 98–76.5◦W longitudeand 18–35◦N latitude, encompassing the entire GOM and theEastern Florida Shelf northward to 35◦N. Ocean condition datafor the simulations were derived from the GOM 1/25◦ resolutionHybrid Current Ocean Model (HYCOM). HYCOM simulationdata are high resolution approximations of water flow that havebeen used in many previous studies that rely on particle-trackingbiophysical models (e.g., Kool et al., 2010; Johnston and Purkis,2015; Johnston and Bernard, 2017). We used three-dimensionaldaily snapshot (i.e., at 00:00 UTM) HYCOM data for the upper1,500m of the water column for the year 2015 and ran 60-daysimulations, commencing on January 1, 2015. The year 2015was chosen as it was a typical, representative year in the GOMwhen the Gulf Loop Current (GLC) was in an extended stateand 2015 also corresponds to the start of the sampling periodby the DEEPEND Consortium which provided the samples forour genetic analysis. It should be noted that during the GLC’sextended state is when connectivity outside of the GOM shouldbe at its maximum and connectivity would expectedly be lowerwhen the GLC is in a retracted state.
At the start of each simulation, we released five particlesat each of the 46 stations (total n = 230 per simulation) inthe DEEPEND sample grid in the northern GOM (Figure 3),a quantity we deemed sufficient to demonstrate the potentialfor individual retention and/or export out of the GOM. Weran 15 simulations (see Supplemental Information 5 for asummary of all simulations) to represent non-migrating particles(hereafter the “non-migratory simulations”), with releases at100m water depth increments, spanning 1,500 to 100m. Thesesimulations emulated the dispersal of particles that do notmigrate vertically and inhabit discrete depths.We next ran a suiteof 105 simulations over all possible combinations of diel verticalmigration patterns (hereafter the “migratory simulations”) from1, 500 to 100m in 100m increments (i.e., from 1,500 to 1,400m,from 1,500 to 1,300m, from 1,400 to 1,300m, from 1,400 to1,200m, and so on) to represent the range of diel migratorybehaviors (see Supplemental Information 6 for the animationshowing migrators vs. non-migrators).
During each simulation, particles were reliant upon waterflow for dispersal, with the exception of the inclusion of asmall percentage of stochasticity to represent eddy diffusivityand small-scale animal movement (see SI for the specifics).Migratory particles underwent a diel migration from the depthsto the surface waters to the depths over a 4-hr span in eachdirection. Morning migrations downwards began at 5:00 a.m. atthe starting depth and ended at 9:00 a.m. at the bottom depth,as specified in Supplemental Information 5. Eveningmigrationsstarted from the bottom depth at 5:00 p.m. and ended in shallowwaters at 9:00 p.m. Particles were tracked for 60 days, duringwhich we corrected their position hourly and recorded theircumulative horizontal displacement distance. For the purposesof determining connectivity outside of the GOM, we consideredthose particles that were transported east of −80◦ to be exportedfrom theGOMand into the western Atlantic. Finally, we summedboth the total particle movements for each simulation and thosemovements which occurred outside of the GOM to calculateretention and export percentages. We also averaged the overallcumulative distance traveled of each particle for each simulationto demonstrate the horizontal dispersal distance per scenario.Though we were primarily interested here in the outputs thatrepresented the specific behaviors of R. robusta, A. purpurea, andS. debilis, the suite of simulations we completed may be useful in
Frontiers in Marine Science | www.frontiersin.org 6 February 2020 | Volume 7 | Article 19

Timm et al. Population Connectivity in Midwater Shrimp
FIGURE 3 | Snapshots of the biophysical modeling simulation at day 1 (A), day 20 (B), and day 60 (C). Particles that exhibit diel vertical migration (“Migrators”) from
900m to 200m are in pink. Particles that do not exhibit this behavior, instead residing at 900m (blue, “Deep Non-migrators”) or 100m (orange, “Shallow
Non-migrators”), are also depicted.
Frontiers in Marine Science | www.frontiersin.org 7 February 2020 | Volume 7 | Article 19
Timm et al. Population Connectivity in Midwater Shrimp
the future to study the connectivity of other diel migrating andnon-migrating deep-sea fauna in the GOM.
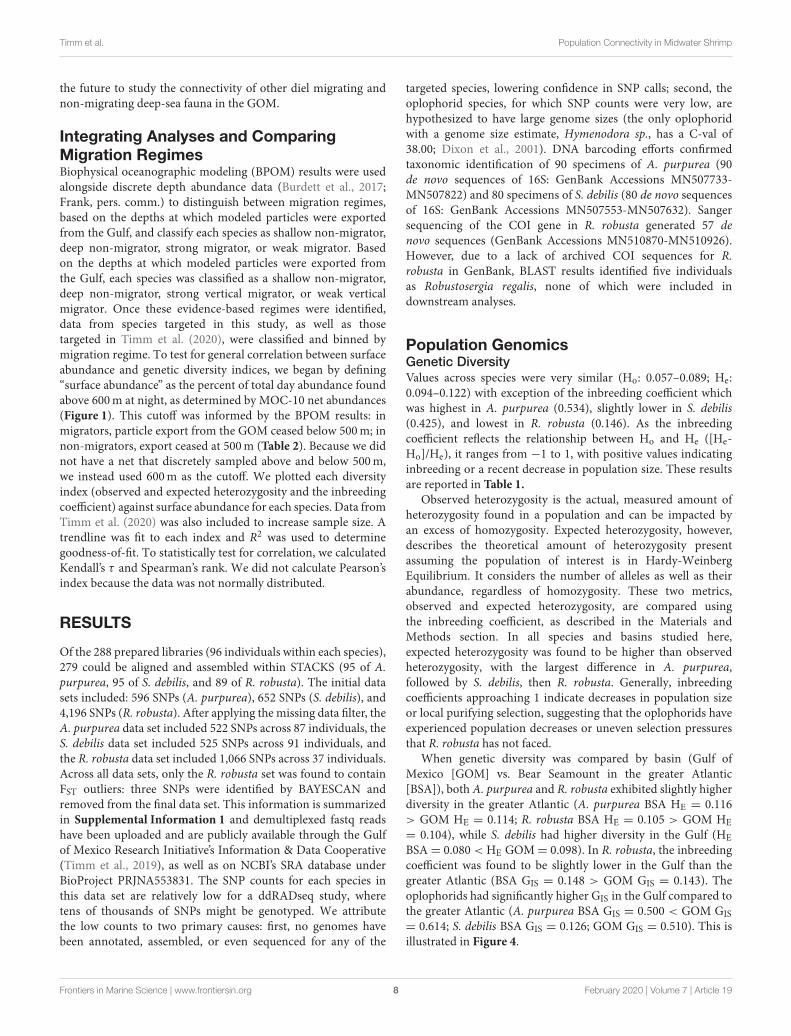
Integrating Analyses and ComparingMigration RegimesBiophysical oceanographic modeling (BPOM) results were usedalongside discrete depth abundance data (Burdett et al., 2017;Frank, pers. comm.) to distinguish between migration regimes,based on the depths at which modeled particles were exportedfrom the Gulf, and classify each species as shallow non-migrator,deep non-migrator, strong migrator, or weak migrator. Basedon the depths at which modeled particles were exported fromthe Gulf, each species was classified as a shallow non-migrator,deep non-migrator, strong vertical migrator, or weak verticalmigrator. Once these evidence-based regimes were identified,data from species targeted in this study, as well as thosetargeted in Timm et al. (2020), were classified and binned bymigration regime. To test for general correlation between surfaceabundance and genetic diversity indices, we began by defining“surface abundance” as the percent of total day abundance foundabove 600m at night, as determined by MOC-10 net abundances(Figure 1). This cutoff was informed by the BPOM results: inmigrators, particle export from the GOM ceased below 500m; innon-migrators, export ceased at 500m (Table 2). Because we didnot have a net that discretely sampled above and below 500m,we instead used 600m as the cutoff. We plotted each diversityindex (observed and expected heterozygosity and the inbreedingcoefficient) against surface abundance for each species. Data fromTimm et al. (2020) was also included to increase sample size. Atrendline was fit to each index and R2 was used to determinegoodness-of-fit. To statistically test for correlation, we calculatedKendall’s τ and Spearman’s rank. We did not calculate Pearson’sindex because the data was not normally distributed.
RESULTS
Of the 288 prepared libraries (96 individuals within each species),279 could be aligned and assembled within STACKS (95 of A.purpurea, 95 of S. debilis, and 89 of R. robusta). The initial datasets included: 596 SNPs (A. purpurea), 652 SNPs (S. debilis), and4,196 SNPs (R. robusta). After applying the missing data filter, theA. purpurea data set included 522 SNPs across 87 individuals, theS. debilis data set included 525 SNPs across 91 individuals, andthe R. robusta data set included 1,066 SNPs across 37 individuals.Across all data sets, only the R. robusta set was found to containFST outliers: three SNPs were identified by BAYESCAN andremoved from the final data set. This information is summarizedin Supplemental Information 1 and demultiplexed fastq readshave been uploaded and are publicly available through the Gulfof Mexico Research Initiative’s Information & Data Cooperative(Timm et al., 2019), as well as on NCBI’s SRA database underBioProject PRJNA553831. The SNP counts for each species inthis data set are relatively low for a ddRADseq study, wheretens of thousands of SNPs might be genotyped. We attributethe low counts to two primary causes: first, no genomes havebeen annotated, assembled, or even sequenced for any of the
targeted species, lowering confidence in SNP calls; second, theoplophorid species, for which SNP counts were very low, arehypothesized to have large genome sizes (the only oplophoridwith a genome size estimate, Hymenodora sp., has a C-val of38.00; Dixon et al., 2001). DNA barcoding efforts confirmedtaxonomic identification of 90 specimens of A. purpurea (90de novo sequences of 16S: GenBank Accessions MN507733-MN507822) and 80 specimens of S. debilis (80 de novo sequencesof 16S: GenBank Accessions MN507553-MN507632). Sangersequencing of the COI gene in R. robusta generated 57 denovo sequences (GenBank Accessions MN510870-MN510926).However, due to a lack of archived COI sequences for R.robusta in GenBank, BLAST results identified five individualsas Robustosergia regalis, none of which were included indownstream analyses.
Population GenomicsGenetic DiversityValues across species were very similar (Ho: 0.057–0.089; He:0.094–0.122) with exception of the inbreeding coefficient whichwas highest in A. purpurea (0.534), slightly lower in S. debilis(0.425), and lowest in R. robusta (0.146). As the inbreedingcoefficient reflects the relationship between Ho and He ([He-Ho]/He), it ranges from −1 to 1, with positive values indicatinginbreeding or a recent decrease in population size. These resultsare reported in Table 1.
Observed heterozygosity is the actual, measured amount ofheterozygosity found in a population and can be impacted byan excess of homozygosity. Expected heterozygosity, however,describes the theoretical amount of heterozygosity presentassuming the population of interest is in Hardy-WeinbergEquilibrium. It considers the number of alleles as well as theirabundance, regardless of homozygosity. These two metrics,observed and expected heterozygosity, are compared usingthe inbreeding coefficient, as described in the Materials andMethods section. In all species and basins studied here,expected heterozygosity was found to be higher than observedheterozygosity, with the largest difference in A. purpurea,followed by S. debilis, then R. robusta. Generally, inbreedingcoefficients approaching 1 indicate decreases in population sizeor local purifying selection, suggesting that the oplophorids haveexperienced population decreases or uneven selection pressuresthat R. robusta has not faced.
When genetic diversity was compared by basin (Gulf ofMexico [GOM] vs. Bear Seamount in the greater Atlantic[BSA]), both A. purpurea and R. robusta exhibited slightly higherdiversity in the greater Atlantic (A. purpurea BSA HE = 0.116> GOM HE = 0.114; R. robusta BSA HE = 0.105 > GOM HE
= 0.104), while S. debilis had higher diversity in the Gulf (HE
BSA = 0.080 < HE GOM= 0.098). In R. robusta, the inbreedingcoefficient was found to be slightly lower in the Gulf than thegreater Atlantic (BSA GIS = 0.148 > GOM GIS = 0.143). Theoplophorids had significantly higher GIS in the Gulf compared tothe greater Atlantic (A. purpurea BSA GIS = 0.500 < GOM GIS
= 0.614; S. debilis BSA GIS = 0.126; GOM GIS = 0.510). This isillustrated in Figure 4.
Frontiers in Marine Science | www.frontiersin.org 8 February 2020 | Volume 7 | Article 19

Timm et al. Population Connectivity in Midwater Shrimp
TABLE 2 | Characterization of each species by migratory regime based on biophysical oceanographic modeling (BOM) (export ceases for migrators below 600m and
non-migrators below 500m) and recorded diel vertical migratory behavior (difference in depth-discrete abundance by solar cycle and proportion of individuals above or
below the BOM export depths).
Species Taxonomic Group Migratory Regime Justification
Acanthephyra purpurea Crustacea Migrator: strong difference in solar cycle, majority of ind above 600m at night &
below during day
Systellaspis debilis Crustacea Migrator: strong difference in solar cycle, majority of ind above 600m at night &
below during day
Robustosergia robusta Crustacea Migrator: weak difference in solar cycle, plurality of ind above 600m at night &
majority below during day
Cranchia scabra Cephalopoda Non-migrator:
shallow
no difference in solar cycle, majority of ind above 600 m
Pyroteuthis margaritifera Cephalopoda Migrator: weak difference in solar cycle, plurality of ind above 200m at night &
majority below during day
Vampyroteuthis infernalis Cephalopoda Non-migrator: deep no difference in solar cycle, majority of ind below 600 m
Justification for each characterization is included.
FIGURE 4 | Diversity metrics (observed heterozygosity Ho, expected heterozygosity He, and inbreeding coefficient Gis) are compared between collection localities:
Bear Seamount in the Atlantic (BSA), Florida Straits (FLS), and the Gulf of Mexico (GOM) for (A) Acanthephyra purpurea, (B) Systellaspis debilis, and (C)
Robustosergia robusta (note the change in y-axis scale).
Population Differentiation and StructureAMOVA results, reported in Table 1, indicate a lack ofpopulation differentiation between basins in the oplophorids:FIT ranged from 80.6% in S. debilis to 83.9% in A. purpureaand the rest of molecular variance was accounted for by FIS(19.4% in S. debilis and 16.1% in A. purpurea). The majorityof variance in R. robusta was from FIT (71.9%), however theremainder was comprised of FIS (11.9%) and FST (16.2%),indicating statistically significant genetic differentiation betweenthe Gulf and the Atlantic.
STRUCTURE results strongly support and aptly illustrate theAMOVA results for each species (Figure 5). For the oplophorids,optimal K was determined to be 2; for R. robusta, K = 3 wasdeemed optimal. In the oplophorids, the admixture of ancestralpopulations within each individual is nearly identical across BSA,the Florida Straits, and the GOM, while there is some variationwithin each sampling locality. R. robusta, however, exhibits adramatic difference in admixture proportion between the GOMand BSA. While admixture from all three ancestral populationsis present in every individual, the individuals from the Atlanticconsist of nearly equal admixture from populations 1 and 2,with the majority from population 3, while individuals from theGulf have a very small proportion of admixture from population
3, nearly identical proportions of admixture from population1 as seen in BSA, and the vast majority of admixture frompopulation 2.
The PCAs and MDSs present these results another way: bothoplophorid species have all individuals fall into a single cluster,regardless of collection locality. Conversely, the populationdifferentiation seen in the AMOVA results for R. robusta, as wellas the STRUCTURE analysis, is made further evident in the PCAand MDS: both plots show two distinct clusters, one containingindividuals from Bear Seamount in the northern Atlantic and theother containing Gulf specimens. Results from PCA andMDS aredepicted in Figure 5.
Biophysical Oceanographic SimulationsIn the non-migratory simulations, dispersal out of the GOM(and inferred external connectivity to the greater Atlantic)primarily occurred in particles that were resident in waterdepths of 600m or shallower (Table 2 and Figure 3). Thepercentage range of particle movements outside of the GOM wasa minimum of 0.14% for those residing at 600m to a maximumof 15.72% for those found at 100m water depth. Averagehorizontal dispersal distance for the non-migrating particlesranged from 422.03 km (1,500m residents) to 2,558.25 km
Frontiers in Marine Science | www.frontiersin.org 9 February 2020 | Volume 7 | Article 19

Timm et al. Population Connectivity in Midwater Shrimp
FIGURE 5 | DISTRUCT plots (top), Principal Component Analyses (PCAs; middle), and multidimensional scaling (MDS) heat maps (bottom) for Acanthephyra
purpurea, Systellaspis debilis, and Robustosergia robusta. Collection localities are denoted “BSA” for Bear Seamount in the north Atlantic, “FLS” for the Florida Straits,
and “GOM” for the Gulf of Mexico., The first two principal components shown for each species are as follows: A. purpurea PC1 = 3.5%, PC2 = 3.1%, S. debilis PC1
= 2.7%, PC2 = 2.5%, and R. robusta PC1 = 5.9%, PC2 = 3.6%.
(100m residents), demonstrating that those residing at shallowerdepths were dispersed much greater distances than thoseinhabiting the deep.
For the migratory simulations, dispersal out of the GOMwas associated with those migrations that occurred from thedeepest depths (e.g., 1,500–1,000m) to a minimum of 500m
water depth, with increases in both the percentage of exportand horizontal dispersal distance in depths shallower than
500m.When migrating frommidwater depths (e.g., 900–200m),
increases in the percentage of export and horizontal distancewere again seen with shallower migrations, however almost all
midwater simulations showed some level of export from the
GOM. The maximum export percentage measured was 14.94%and the maximum horizontal displacement was 3,824.88 km,both in particles that migrated from 200 to 100m water depthon a diel cycle.
Integrating Analyses and ComparingMigration RegimesBPOM identified minimum depths for export out of the Gulf ofMexico for both migrators (500m) and non-migrators (600m).These values, along with discrete depth abundances calculatedfrom MOC-10 capture, were used to characterize each of the sixspecies (Table 2): the three species of mesopelagic shrimp andthree species of mesopelagic cephalopod included from Timmet al. (2020). Generally, a negative correlation between surfaceabundance and genetic diversity was statistically supported(Figure 6). Across analyses, correlation was strongest betweensurface abundance and observed heterozygosity (R2 = 0.868,rs = −0.942, τ statistically significant; Table 3). Correlationbetween surface abundance and expected heterozygosity wasweaker (R2 = 0.494, rs = −0.543, τ not statistically significant;Table 3). Inbreeding coefficient was not found to be correlated to
Frontiers in Marine Science | www.frontiersin.org 10 February 2020 | Volume 7 | Article 19

Timm et al. Population Connectivity in Midwater Shrimp
FIGURE 6 | Graph relating genetic diversity (inbreeding coefficient [GIS] in blue, expected heterozygosity [He] in red, and observed heterozygosity [Ho] in purple) to
abundance in the surface/epipelagic (here, we define this as above 600m) across midwater invertebrate species with differing diel vertical migratory behaviors. We
find an indirect relationship, with diversity decreasing as the percent of individuals found in the surface/epipelagic increases. This correlation is strongest in Ho (R2=
0.87) compared to He (R2= 0.49) and GIS (R2
= 0.073). Robustosergia robusta, Pyroteuthis margaritifera, Cranchia scabra, and Systellaspis debilis photo credit: Dr.
Danté Fenolio. Vampyroteuthis infernalis photo credit: David Wrobel. Acanthephyra purpurea photo credit: Dr. T.-Y. Chan.
TABLE 3 | Results of testing for correlation between surface/epipelagic
abundance (“SA,” here defined as above 600m) and three diversity metrics:
inbreeding coefficient (GIS), expected heterozygosity (He), and observed
heterozygosity (Ho).
R2 Spearman Kendall
SA x Gis 0.073 −0.543* Not sig
SA x He 0.494 −0.543* Not sig
SA x Ho 0.868 −0.942* Sig
R2 is taken from the trendline and has been discussed in a previous figure. As our data are
not normally distributed, correlation was tested with Spearman’s rs and Kendall’s τ (non-
parametric tests). Spearman’s rs ranges from−1 (strong negative/indirect correlation) to
1 (strong positive/direct correlation) with values closer to 0 indicating weak correlation.
When |rs| > 0.5, the correlation is considered strong. Here, this is indicated with *.
Kendall’s τ is compared to a critical value. When |τ | > critical value, correlation is not
significant (“Not sig„” in table). When |τ | </= critical value, correlation is significant (“Sig”).
surface abundance (R2 = 0.073, rs = −0.543, τ not statisticallysignificant; Table 3).
DISCUSSION
Through the integrated analysis of genomic proxies, namelydiversity and connectivity, and biophysical models, we arebeginning to address a persistent data gap in the mesopelagicGulf by establishing biological baselines. We investigated howgenetic diversity is organized between the Gulf of Mexico andthe greater Atlantic, including the Florida Straits. Betweenbasins, expected and observed heterozygosity paralleled eachother well in each species, with the exception of S. debilisin the north Atlantic, wherein the two were nearly equal,greatly decreasing the inbreeding coefficient. In the oplophorids,inbreeding was lower in samples collected from Bear Seamountin the greater Atlantic compared to the Gulf, with the FloridaStraits being nearly equal to Bear Seamount (in the case of A.purpurea) or significantly higher than the Gulf (in the case of
S. debilis). This may be indicative of Gulf-localized perturbationor purifying selection affecting the oplophorids. However, thelow inbreeding coefficient, high diversity, and small inter-basindiversity differences seen in R. robusta suggest quite differentpopulation dynamics.
To better understand the processes maintaining thesecontrasting dynamics, we investigated how this inter-basinorganization is maintained through population structure andgenetic connectivity and also modeled physical connectivity.Here again, we found a notable difference between theoplophorids and R. robusta. The oplophorids exhibited highpopulation connectivity, indicating historical and current geneflow. Results of population structure analyses indicate eachoplophorid species consists of a single population spanningthe Gulf, Florida Straits, and the north Atlantic. Individualsfrom these populations are comprised of admixture from twoancestral populations of each species. R. robusta, however,exhibits significant population differentiation between basins.Analyses of population structure indicate this is coupled withdifferent patterns of admixture from three ancestral populations,forming two distinct genetic signatures. Both of these results wereechoed in our biophysical model results: the strong migrators(i.e., the oplophorids) were flushed from the Gulf while the weakmigrators (i.e., R. robusta) were retained in the Gulf over thesimulation timeframe (Table 2 and Figure 3).
High connectivity and little population structure inoplophorids, evidenced by high FIT, low FST, and results ofstructure analyses, may constrain genetic diversity throughpurifying selection: in both species, a single population mustcontend with two very different basins and environments(Backus et al., 1977; Gartner, 1988; Sutton et al., 2017). Anypotential local or basin-specific adaptations must also be fitfor the other basin. Additionally, in the case of S. debilis, itseems the entire inter-basin population is impacted by localperturbations: a localized die-off in the Gulf of Mexico canbe seen in the overall population (Gulf and northwestern
Frontiers in Marine Science | www.frontiersin.org 11 February 2020 | Volume 7 | Article 19

Timm et al. Population Connectivity in Midwater Shrimp
Atlantic, see Table 1 FIS results). R. robusta, however, exhibitsthe highest diversity and lowest inbreeding of species includedin this study. This may be attributable to a larger number ofancestral populations (three, instead of two in the oplophorids)or potentially local adaptation to the Gulf of Mexico and theAtlantic Ocean, relatively independently. Random geneticdrift within each basin may also explain the results wesee. Relatively high, statistically significant FST, indicatingpopulation differentiation between basins, could suggest localadaptation following the recent separation and isolation oftwo distinct subspecies. However, more work is needed tofully address this, specifically a comprehensive phylogenyof sergestids.
Previous work investigating genetic connectivity between theGulf of Mexico and the greater Atlantic has largely focused onshark species with high potential dispersal distances. Researchinto population connectivity in Atlantic sharpnose sharksand sandbar sharks (conducted with mitochondrial RFLP andallozymes) found a single continuous population in both cases(Heist et al., 1995, 1996; Heist and Gold, 1999). A study ofblacktip sharks (incorporating microsatellite data as well as themitochondrial control region) identified population structurebetween the basins and largely attributed this to female sharkpreference for their own natal nursery grounds for parturition(Keeney et al., 2005). A study of genetic connectivity of thecoral Montastraea cavernosa collected from across the Atlanticidentified three populations; one of which (the Caribbean-North Atlantic) spans Bear Seamount and the Gulf of Mexico(Nunes et al., 2009). The authors attribute this connectivity tolarval dispersal across long distances, while acknowledging thedifficulties of modeling dispersal purely in terms of current-mediated transport. They cite larval lifespan, predation, micro-environmental fluctuations, and active swimming behavior ascomplicating variables in modeling larval dispersal via currents;all of which may also apply to the shrimp species targeted inthis study.
Across the analyses presented here, results exhibited fairlyclear distinctions between two taxonomic groups that representdistant evolutionary histories: the oplophorids A. purpurea andS. debilis, and the sergestid R. robusta. These two groups differin many ways, including reproductive behavior and strengthof diel vertical migration. Brooding behavior, exhibited by theoplophorids, may contribute greatly to connectivity betweenbasins by facilitating inter-basin migration: while fecunditymay differ by reproductive strategy (Ramirez Llodra, 2002),brooded young tend to have a better chance of survivorship(MacIntosh et al., 2014). Moreover, a survey of R. robusta,which releases fertilized eggs without brooding, from 1992describes an ontological shift in diel vertical migration strength,with juvenile shrimp exhibiting stronger migration behaviorthan adults (Flock and Hopkins, 1992). As such, though larvaeof R. robusta may have better access to the fastest movingwaters of the Gulf Loop Current, they may also be lesslikely to survive and contribute to the effective population.The authors have noted this anecdotally: on research cruisesto the Florida Straits, adults of A. purpurea, S. debilis, andsergestids known to exhibit strong diel vertical migration
(Flock and Hopkins, 1992) were quite abundant, but adultsof R. robusta were functionally absent and non-migratingsergestid larvae were neither collected nor noted. However,as mentioned, this requires confirmation. Statistical analysisof size distributions along the depth gradient is needed toclarify the role of larvae as migrants connecting the Gulfand Atlantic. While larvae can be critical for populationconnectivity in marine species (Palumbi, 2003; Gaines et al.,2007; Cowen and Sponaugle, 2009), there is also strongevidence that potential dispersal is rarely correlated with realizeddispersal (Shanks, 2009).
Despite the potentially confounding variables identifiedin determining dispersal through current-mediated transport(e.g., disparity between potential and realized dispersal,oversimplifying active swimming behaviors, and ignoring theimportance of rare individuals dispersing long distances; seeShanks, 2009 for a more thorough discussion), biophysicalmodeling can be used in concert with genetic evidence toimprove our understanding of the dynamic relationshipsbetween marine organisms and their environment (Liggins et al.,2013). This integrative approach has been used to differentiatebetween broad-ranged natural populations and exotic introducedpopulations in the globally-distributed moon jellyfish genus,Aurelia (Dawson et al., 2005). Combining thorough empiricalgenetic sampling with biophysical modeling of dispersal has alsoproved valuable in explaining population structure in the highlydispersive spiny lobster, Panulirus argus (Truelove et al., 2017).
Our study particularly focused on diel vertical migrationof adults, resultant surface/epipelagic abundance and transporton swift surface currents, and population dynamics. Includingdata from Timm et al. (2020), we find a trend of highsurface abundance associated with low (if not absent) populationdifferentiation between basins. However, this relationshipappears to be binary. More stringent, statistical testing,across as many species as possible is needed to properlyinvestigate this putative relationship. Genetic diversity showsmuch higher variability, allowing for statistical testing ofcorrelation. Generally, an indirect/negative correlation wasfound, with higher surface abundance associated with lowergenetic diversity. This relationship was clearest in observedheterozygosity, though still present in expected heterozygosity.It was nearly absent in the inbreeding coefficient. In thecontext of our simulation results, we suspect species withhigher surface abundance have better access to the Gulf LoopCurrent, promoting inter-basin migration and homogenizingthe population.
Testing for an effect of migration regime, informed by discretedepth abundance observations combined with oceanographicmodeling, provides compelling evidence that vertical migrationbehavior alone is not sufficient to explain differences in geneticdiversity across these species. Generally, modeling indicatedan increase in export from the Gulf of Mexico into thegreater Atlantic and an increase in dispersal distance assimulated particles reached shallower depths. Indeed, we find thatminimum depth reached by each species during a diel cycle maybe particularly indicative of access to the Gulf Loop Current andability to migrate between basins.
Frontiers in Marine Science | www.frontiersin.org 12 February 2020 | Volume 7 | Article 19

Timm et al. Population Connectivity in Midwater Shrimp
In many ways, this study only begins to uncover themechanisms driving and maintaining natural variability inthe mesopelagic species inhabiting the Gulf of Mexico andbetween the Gulf and the greater Atlantic. The establishmentof baselines for genetic diversity and connectivity is crucial tounderstanding the Gulf and for future appraisal of damagesfollowing disturbance events. We hypothesize that specificdifferences in population dynamics may be explained by accessto the Gulf Loop Current: populations with higher abundancein the surface or epipelagic potentially have greater access to thefastest moving waters of the Gulf Loop Current. It can be logicallyreasoned that this access could maintain a single populationspanning the Gulf and Atlantic in the strong vertical migrators,homogenizing if not functionally preventing local adaptation andpopulation differentiation.
The results presented here, contextualized in termsof environment (the Gulf Loop Current) and life history(reproductive strategy and diel vertical migratory behavior),serve as the first glimpse of the natural variability present inthe Gulf midwater and begin to describe potential drivers ofthis variability. First, we find that genetically, the oplophoridsincluded in this study, A. purpurea and S. debilis, each form asingle population spanning the eastern Gulf of Mexico and thenorthwest Atlantic. While this is associated with lower diversity,suggesting a lack of natural variability within each populationand raising some concern over these species’ health, it alsoindicates unimpeded gene flow between basins, a result alsoindicated in our model simulations. This is a good prognosis forgenetic rescue potential and resilience in the Gulf. Robustosergiarobusta, however, shows an opposite trend: high diversity,indicative of natural variability and species health, and geneticpopulation differentiation between basins with low physicalconnectivity suggests lower potential for genetic rescue—astrategy for replenishing lost genetic diversity following alocalized environmental perturbation (Mussmann et al., 2017).The unique genetic signatures of each basin may mean that,despite gene flow between basins, diversity lost within one basinmay not be easily replaced through inter-basin migration.
FUTURE DIRECTIONS
In light of the immense difficulties associated with deep-seaspecimen collection (especially of deep, non-migrating species),we recognize that continued collection efforts are needed toincrease sample sizes. Additionally, before attempts to modelsurface abundance-genetic diversity correlation are undertaken,the correlation should be tested in more species. As fishesrepresent a major proportion of the mesopelagic biomassand are generally better studied, a similar study to the onepresented here, focused on fish species, could substantiallyimprove our understanding of the state and flux of geneticdiversity in the mesopelagic Gulf of Mexico. When model testingbegins, pervasive depth-dependent environmental variables(i.e., salinity, temperature, hydrostatic pressure, dissolvedoxygen concentration, and chlorophyll concentration) should beconsidered as well as physical oceanographic parameters, such
as water velocity and direction in relation to the Florida Straits,and biological traits such as active retention within the GOM viadirectional swimming during diel vertical migration.
DATA AVAILABILITY STATEMENT
All data are publicly available through the Gulf of MexicoResearch Initiative Information & Data Cooperative(GRIIDC) at https://data.gulfresearchinitiative.org(doi: 10.7266/n7-3p3y-g470) and from NCBI(BioProject PRJNA553831).
AUTHOR CONTRIBUTIONS
LT and HB-G contributed conception and design of thestudy. Population genomics data generation and analysis wasconducted by LT and LI. MJ carried out the biophysical modelingcomponent of the study. MJ and LT worked together to integratethe results from population genomics and biophysical modeling.LT wrote the manuscript, with the exception of the biophysicalmodeling sections, which were written by MJ. All authorscontributed to the revision process, have read, and approvethis manuscript.
FUNDING
This research was made possible in part by a grant from TheGulf of Mexico Research Initiative to the Deep Pelagic NektonDynamics of the Gulf of Mexico (DEEPEND) Consortium, aswell as a Division of Environmental Biology National ScienceFoundation (NSF) grant awarded to HB-G (DEB#1556059).Samples from Bear Seamount were collected through theDeepwater Systematics project, funded by the NMFS NortheastFisheries Science Center. Funding was also provided by theFlorida International University (FIU) Presidential Fellowship,the FIU Doctoral Evidence Acquisition Fellowship, and the FIUDissertation Year Fellowship.
ACKNOWLEDGMENTS
We would like to specially thank Dr. Tammy Frank and Dr.Rosanna Milligan for their support in sample collection andstatistical analysis, as well as Mr. Jorge Perez-Moreno and Mr.Charles Golightly for support in initial sample processing. Wealso thank LT’s Ph.D. committee: Dr. José Eirin-Lopez, Dr.Mauricio Rodriguez-Lanetty, Dr. Eric von Wettberg, and Dr.Wensong Wu. We especially thank Dr. Emily Warschefsky,Dr. Joseph Ahrens, and Mr. Jordon Rahaman for advice andfeedback on ddRADseq library prep and data assembly. Finally,we thank the reviewers for feedback on earlier versions of thismanuscript. The work presented here is part of LT’s doctoraldissertation (Timm, 2018) and is publicly available online. Thisis contribution #174 from the Coastlines and Oceans Division ofthe Institute of Environment at Florida International University.
Frontiers in Marine Science | www.frontiersin.org 13 February 2020 | Volume 7 | Article 19
Timm et al. Population Connectivity in Midwater Shrimp
SUPPLEMENTARY MATERIAL
The Supplementary Material for this article can be foundonline at: https://www.frontiersin.org/articles/10.3389/fmars.2020.00019/full#supplementary-material
Supplemental Information 1 | Metadata for all samples included in this study,
including: the Illumina i7 index and custom barcode combination, listed under
“Idx-BC,” sample ID (HBG number), species, date and basin of collection, as well
as the Station ID and coordinates for the collection site, and the depth range from
which the sample was collected. The gene targeted for Sanger sequencing, to be
used for DNA barcoding to confirm taxonomic identification, was either the 16S
small ribosomal subunit (16S) or cytochrome c oxidase subunit I (COI). This is
reported under “Gene” and the associated GenBank Accession number is
also listed.
Supplemental Information 2 | The primer pairs and annealing temperatures
associated with PCR amplification of two mitochondrial genes targeted for DNA
barcoding of samples included in the ddRADseq library preparations.
Supplemental Information 3 | Details of ddRADseq protocol for each species,
including enzymes, custom-made barcoded-adapter sequences, and size
selection schemes. Both strands of each adapter are given (1.1 and 1.2) in the 5′
to 3′
direction. These strands are annealed prior to ligation to the ddRADseq
fragments. The barcode section of the adapter is underlined. Note that the
overhang in the 1.1 strands differs between the “oplo” and the “flex” adapters.
Illumina i7 adapters were also used, specifically index 1, 3, 7, 12, 13, 16, 21, 24,
29, 37, 42, and 43.
Supplemental Information 4 | This model description follows the Overview,
Design concepts, and Details (ODD) protocol for describing individual- and
agent-based models (Grimm and Railsback, 2005; Grimm et al., 2006) and
consists of seven elements. The first three elements provide an overview of the
model, the fourth element explains general concepts underlying the model’s
design, and the remaining three elements provide details of the
model processes.
Supplemental Information 5 | Summary of the dispersal of migrators and
non-migrators within and outside of the GOM.
Supplemental Information 6 | Three-dimensional animation of the dispersal of
migrating species vs. non-migrating species spanning 80 days. Blue dots
represent non-migrating animals at 900m depth and pink represent animals with a
diel vertical migration range of 200m to 900m depth.
REFERENCES
Backus, R. H., Craddock, J. E., Haedrich, R. L., and Robison, B. H. (1977).
Atlantic mesopelagic zoogeography. Fish. Western N. Atlantic 7, 266–287
doi: 10.1575/1912/4359
Beyer, J., Trannum, H. C., Bakke, T., Hodson, P. V., and Collier, T. K. (2016).
Environmental effects of the Deepwater Horizon oil spill: a review.Mar. Pollut.
Bull. 110, 28–51. doi: 10.1016/j.marpolbul.2016.06.027
Biggs, D. C. (1992). Nutrients, plankton, and productivity in a warm-core
ring in the western Gulf of Mexico. J. Geophys. Res. 2, 2143–2154.
doi: 10.1029/90JC02020
Biggs, D. C., and Muller-Karger, F. E. (1994). Ship and satellite observations of
chlorophyll stocks in interacting cyclone-anticyclone eddy pairs in the western
Gulf of Mexico. J. Geophys. Res.4, 7371–7384. doi: 10.1029/93JC02153
Brierley, A. S. (2014). Diel vertical migration. Curr. Biol. 24, R1074–R1076.
doi: 10.1016/j.cub.2014.08.054
Burdett, E. A., Fine, C. D., Sutton, T. T., Cook, A. B., and Frank, T. M.
(2017). Geographic and depth distributions, ontogeny, and reproductive
seasonality of decapod shrimps (Caridea: Oplophoridae) from the northeastern
Gulf of Mexico. Bull. Mar. Sci. 93, 743–767. doi: 10.5343/bms.2016.
1083
Catchen, J., Hohenlohe, P. A., Bassham, S., Amores, A., and Cresko, W. A. (2013).
Stacks: an analysis tool set for population genomics. Mol. Ecol. 22, 3124–3140.
doi: 10.1111/mec.12354
Catchen, J. M., Hohenlohe, P. A., Bernatchez, L., Funk, W. C., Andrews, K. R.,
and Allendorf, F. W. (2017). Unbroken: RADseq remains a powerful tool for
understanding the genetics of adaptation in natural populations.Mol. Ecol. Res.
17, 362–365. doi: 10.1111/1755-0998.12669
Cowen, R. K., Gawarkiewicz, G., Pineda, J., Thorrold, S. R., and Werner, F.
(2007). Population connectivity in marine systems. Oceanography 20, 14–21.
doi: 10.5670/oceanog.2007.26
Cowen, R. K., and Sponaugle, S. (2009). Larval dispersal and
marine population connectivity. Ann. Rev. Mar. Sci. 1, 443–466.
doi: 10.1146/annurev.marine.010908.163757
Danovaro, R., Gambi, C., Dell’Anno, A., Corinaldesi, C., Fraschetti, S., Vanreusel,
A., et al. (2008). Exponential decline of deep-sea ecosystem functioning linked
to benthic biodiversity loss. Curr. Biol. 18, 1–8. doi: 10.1016/j.cub.2007.11.056
Davey, J. L., and Blaxter, M. W. (2010). RADseq: next-generation population
genetics. Brief. Funct. Genom. 9, 416–423. doi: 10.1093/bfgp/elq031
Dawson, M. N., Gupta, A. S., and England, M. H. (2005). Coupled biophysical
global ocean model and molecular genetic analyses identify multiple
introductions of cryptogenic species. Proc. Natl. Acad. Sci. U.S.A. 102,
11968–11973. doi: 10.1073/pnas.0503811102
De Robertis, A. (2002). Size-dependent visual predation risk and the timing of
vertical migration: an optimization model. Limnol. Oceanogr. 47, 925–933.
doi: 10.4319/lo.2002.47.4.0925
Dixon, D. R., Dixon, L. R. J., Wilson, J. T., and Pascoe, P. L. (2001).
Chromosomal and nuclear characteristics of deep-sea hydrothermal-vent
organisms: correlates of increased growth rate. Mar. Biol. 139, 251–255.
doi: 10.1007/s002270100564
Donaldson, H. A. (1975). Vertical distribution and feeding of sergestid
shrimps (Decapoda: Natantia) collected near Bermuda. Mar. Biol. 31, 37–50.
doi: 10.1007/BF00390646
Earl, D. A., and VonHoldt, B. M. (2012). STRUCTURE HARVESTER: a website
and program for visualizing STRUCTURE output and implementing the
Evanno method. Conserv. Gene. Res. 4, 359–361. doi: 10.1007/s12686-011-
9548-7
Evanno, G., Regnaut, S., and Goudet, J. (2005). Detecting the number of clusters of
individuals using the software STRUCTURE: a simulation study.Mol. Ecol. 14,
2611–2620. doi: 10.1111/j.1365-294X.2005.02553.x
Flock, M. E., and Hopkins, T. L. (1992). Species composition, vertical distribution,
and food habits of the sergestid shrimp. J. Crustacean Biol. 12, 210–223.
doi: 10.2307/1549076
Foll, M., and Gaggiotti, O. (2008). A genome-scan method to identify selected
loci appropriate for both dominant and codominant markers: a Bayesian
perspective. Genetics 180, 977–993. doi: 10.1534/genetics.108.092221
Forristall, G. Z., Schaudt, K. J., and Cooper, C. K. (1992). Evolution and kinematics
of a loop current eddy in the Gulf of Mexico during 1985. J. Geophys. Res. 97,
2173–2184. doi: 10.1029/91JC02905
Foxton, P. (1970). The vertical distribution of pelagic decapods (Crustacea:
Natantia) collected on the Sond cruise 1965 II. the Penaeidea
and general discussion. J. Mar. Biol. Assoc. U.K. 50, 961–1000.
doi: 10.1017/S0025315400005907
Froglia, C., and Giannini, S. (1982). Osservazioni sugli spostamenti verticali
nictemerali di Sergestes arcticus kroyer e Sergia robusta (Smith) (Crustacea,
Decapoda, Sergestidae) nel Mediterraneo occidentale. Atti Del Convegno Delle
Unità Operative Afferenti Ai Sottoprogetti Risorse Biologiche e Inquinamento
Marino. 1, 311–319.
Froglia, C., and Gramitto, M. E. (2000). A new pelagic shrimp of the genus Sergia
(Decapoda, Sergestidae) from the Atlantic Ocean. J. Crustacean Biol. 20, 71–77.
doi: 10.1163/1937240X-90000009
Gaines, S., Gaylord, B., Gerber, L., Hastings, A., and Kinlan, B. (2007). Connecting
places: the ecological consequences of dispersal in the sea. Oceanography 20,
90–99. doi: 10.5670/oceanog.2007.32
Gartner, J. V. (1988). The lanternfishes (Pisces: Myctophidae) of the eastern Gulf
of Mexico. Fish. Bull. 85, 81–98.
Frontiers in Marine Science | www.frontiersin.org 14 February 2020 | Volume 7 | Article 19

Timm et al. Population Connectivity in Midwater Shrimp
Genthe, H. C. (1969). The reproductive biology of Sergestes similis (Decapoda,
Natantia).Mar. Biol. 2, 203–217. doi: 10.1007/BF00351142
Grimm, V., Berger, U., Bastiansen, F., Eliassen, S., Ginot, V., Giske, J., et al. (2006).
A standard protocol for describing individual-based and agent-based models.
Ecol. Model. 198, 115–126. doi: 10.1016/j.ecolmodel.2006.04.023
Grimm, V., Berger, U., DeAngelis, D. L., Polhill, J. G., Giske, J., and Railsback,
S. F. (2010). The ODD protocol: a review and first update. Ecol. Model. 221,
2760–2768. doi: 10.1016/j.ecolmodel.2010.08.019
Grimm, V., and Railsback, S. F. (2005). Individual-Based Modeling and Ecology.
Princeton, NJ: Princeton Unviersity Press.
Hamilton, P., Donohue, K., Hall, C., Leben, R., Quian, H., Sheinbaum, J., et al.
(2014). Observations and Dynamics of the Loop Current. OCS Study BOEM
5015-006. New Orleans, LA.
Heist, E. J., and Gold, J. R. (1999). Microsatellite DNA variation in sandbar sharks
(Carcharhinus plumbeus) from the Gulf of Mexico and Mid-Atlantic Bight.
Copeia 1999, 182–186. doi: 10.2307/1447399
Heist, E. J., Graves, J. E., and Musick, J. A. (1995). Population genetics
of the sandbar shark (Carcharhinus plumbeus) in the Gulf of Mexico
and Mid-Atlantic Bight. Copeia 1995, 555–562. doi: 10.2307/14
46752
Heist, E. J., Musick, J., and Graves, J. E. (1996). Mitochondrial DNA diversity
and divergence among sharpnose sharks, Rhizoprionodon terraenovae, from the
Gulf of Mexico and Mid-Atlantic Bight. Fish. Bull. 94, 664–668.
Hellberg, M. E., Burton, R. S., Neigel, J. E., and Palumbi, S. R. (2002).
Genetic assessment of connectivity among marine populations. Bull. Mar. Sci.
70, 273–290.
Herring, P. J. (1967). Observations on the early larvae of three species of
Acanthephyra (Crustacea, Decapoda, Caridea). Deep Sea Res. Oceanogr. 14,
325–329. doi: 10.1016/0011-7471(67)90075-7
Herring, P. J. (1974a). Observations on the embryonic development of
some deep-living decapod crustaceans, with particular reference to
species of Acanthephyra. Mar. Biol. 25, 25–33. doi: 10.1007/BF003
95105
Herring, P. J. (1974b). Size, density and lipid content of some decapod eggs.
Deep-Sea Res. Oceanograp. Abst. 21, 91–94. doi: 10.1016/0011-7471(74)90023-0
Hughes, A. R., and Stachowicz, J. J. (2004). Genetic diversity enhances the
resistance of a seagrass ecosystem to disturbance. Proc. Natl. Acad. Sci. U.S.A.
101, 8998–9002. doi: 10.1073/pnas.0402642101
Jakobsson, M., and Rosenberg, N. A. (2007). CLUMPP: a cluster matching and
permutation program for dealing with label switching and multimodality
in analysis of population structure. Bioinformatics 23, 1801–1806.
doi: 10.1093/bioinformatics/btm233
Johnston, M. W., and Bernard, A. M. (2017). A bank divided: quantifying
a spatial and temporal connectivity break between the Campeche
Bank and the northeastern Gulf of Mexico. Mar. Biol. 164:12.
doi: 10.1007/s00227-016-3038-0
Johnston, M. W., Milligan, R. J., Easson, C. G., DeRada, S., English, D. C., Penta,
B., et al. (2019). An empirically validated method for characterizing pelagic
habitats in the Gulf of Mexico using ocean model data. Limnol. Oceanograp.
17, 363–375. doi: 10.1002/lom3.10319
Johnston, M. W., and Purkis, S. J. (2015). A coordinated and sustained
international strategy is required to turn the tide on the Atlantic lionfish
invasion.Mar. Ecol. Prog. Ser. 533, 219–235. doi: 10.3354/meps11399
Jombart, T., and Ahmed, I. (2011). Adegenet 1.3-1: New tools for the
analysis of genome-wide SNP data. Bioinformatics 27, 3070–3071.
doi: 10.1093/bioinformatics/btr521
Katoh, K., and Standley, D. M. (2013). MAFFT multiple sequence alignment
software version 7: improvements in performance and usability.Mol. Biol. Evol.
30, 772–780. doi: 10.1093/molbev/mst010
Kearse, M., Moir, R., Wilson, A., Stones-Havas, S., Cheung, M., Sturrock, S.,
et al. (2012). Geneious basic: an integrated and extendable desktop software
platform for the organization and analysis of sequence data. Bioinformatics 28,
1647–1649. doi: 10.1093/bioinformatics/bts199
Keeney, D. B., Heupel, M. R., Hueter, R. E., and Heist, E. J. (2005). Microsatellite
and mitochondrial DNA analyses of the genetic structure of blacktip shark
(Carcharhinus limbatus) nurseries in the northwestern Atlantic, Gulf ofMexico,
and Caribbean Sea. Mol. Ecol. 14, 1911–1923. doi: 10.1111/j.1365-294X.2005.0
2549.x
Kool, J. T., Paris, C. B., Andréfouët, S., and Cowen, R. K. (2010). Complex
migration and the development of genetic structure in subdivided populations:
an example from Caribbean coral reef ecosystems. Ecography 33, 597–606.
doi: 10.1111/j.1600-0587.2009.06012.x
Kraus, N. C., and Lin, L. (2009). Hurricane Ike along the upper Texas coast: an
introduction. Shore Beach. 77, 3–8.
Kumar, S., Stecher, G., and Tamura, K. (2016). MEGA7: Molecular evolutionary
genetics analysis version 7.0 for bigger datasets.Mol. Biol. Evol. 33, 1870–1874.
doi: 10.1093/molbev/msw054
Liggins, L., Treml, E. A., and Riginos, C. (2013). Taking the plunge: an introduction
to undertaking seascape genetic studies and using biophysical models. Geo.
Comp. 7, 173–196. doi: 10.1111/gec3.12031
Loose, C. J., and Dawidowicz, P. (1994). Trade-offs in diel vertical migration
by zooplankton: the costs of predator avoidance. Ecology 75, 2255–2263.
doi: 10.2307/1940881
MacIntosh, H., de Nys, R., and Whalan, S. (2014). Contrasting life histories in
shipworms: growth, reproductive development and fecundity. J. Exp. Mar. Biol.
Ecol. 459, 80–86. doi: 10.1016/j.jembe.2014.05.015
Meirmans, P. G., and Van Tienderen, P. H. (2004). GENOTYPE and GENODIVE:
two programs for the analysis of genetic diversity of asexual organisms. Mol.
Ecol. Notes 4, 792–794. doi: 10.1111/j.1471-8286.2004.00770.x
Milne-Edwards, A. (1881a). “Compte rendu sommaire d’une exploration
zoologique faite dans l’Atlantique, a bord du navire le Travailleu,” in Comptes
Rendus Hebdomadaires de Séances de l’Académie des Sciences, Vol. 93 (Paris),
931–936.
Milne-Edwards, A. (1881b). Description de quelques crustacés macroures
provenant des grandes profondeurs de la Mer des Antilles. Ann. Sci. Nat. 6,
1–15.
Mussmann, S. M., Douglas, M. R., Anthonysamy, W. J. B., Davis, M. A., Simpson,
S. A., Louis, W., et al. (2017). Genetic rescue, the greater prairie chicken and
the problem of conservation reliance in the anthropocene. R. Soc. Open Sci.
4:160736. doi: 10.1098/rsos.160736
Nelson, J. R., and Grubesic, T. H. (2018). The implications of oil exploration off the
Gulf Coast of Florida. J. Mar. Sci. Eng. 6, 1–21. doi: 10.3390/jmse6020030
Nunes, F., Norris, R. D., and Knowlton, N. (2009). Implications of isolation and
low genetic diversity in peripheral populations of an amphi-Atlantic coral.Mol.
Ecol. 18, 4283–4297. doi: 10.1111/j.1365-294X.2009.04347.x
Oey, L.-Y., Ezer, T., and Lee, H.-C. (2005). “Loop current, rings, and related
circulation in the Gulf of Mexico: a review of numerical models and future
challenges,” in Circulation in the Gulf of Mexico: Observations and Models, eds
W. Sturges and A. Lugo-Fernandez (Washington, DC: American Geophysical
Union), 31–56.
O’Leary, S. J., Puritz, J. B., Willis, S. C., Hollenbeck, C. M., and Portnoy,
D. S. (2018). These aren’t the loci you’re looking for: principles of
effective SNP filtering for molecular ecologists. Mol. Ecol. 27, 3193–3206.
doi: 10.1111/mec.14792
Palumbi, S. R. (2003). Population genetics, demographic connectivity,
and the design of marine reserves. Ecol. Appl. 13, S146–S158.
doi: 10.1890/1051-0761(2003)013<0146:PGDCAT>2.0.CO;2
Peterson, B. K., Weber, J. N., Kay, E. H., Fisher, H. S., and Hoekstra, H. E. (2012).
Double digest RADseq: an inexpensive method for de novo SNP discovery
and genotyping in model and non-model species. PLoS ONE 7:e37135.
doi: 10.1371/journal.pone.0037135
Pritchard, J. K., Stephens, M., and Donnelly, P. (2000). Inference of population
structure using multilocus genotype data. Genetics 155, 945–959.
Ramirez Llodra, E. (2002). Fecundity and life-history strategies in marine
invertebrates. Adv. Mar. Biol. 43, 87–170. doi: 10.1016/S0065-2881(02)43004-0
Reitzel, A. M., Herrera, S., Layden, M. J., Martindale, M. Q., and Shank, T.
M. (2013). Going where traditional markers have not gone before: utility
of and promise for RAD sequencing in marine invertebrate phylogeography
and population genomics. Mol. Ecol. 22, 2953–2970. doi: 10.1111/mec.
12228
Riegl, B., Johnston, M., Purkis, S., Howells, E., Burt, J., Steiner, S. C. C., et al. (2018).
Population collapse dynamics in Aropora downingi, an Arabian/Persian Gulf
ecosystem-engineering coral, linked to rising temperature. Glob. Change Biol.
24, 2447–2462. doi: 10.1111/gcb.14114
Roe, H. S. J. (1984). The diel migrations and distributions within a
mesopelagic community in the north east Atlantic (2): vertical migration
Frontiers in Marine Science | www.frontiersin.org 15 February 2020 | Volume 7 | Article 19

Timm et al. Population Connectivity in Midwater Shrimp
and feeding of mysids and decapod Crustacea. Prog. Oceanogr. 13, 269–318.
doi: 10.1016/0079-6611(84)90011-9
Rosenberg, N. A. (2004). DISTRUCT: A program for the graphical
display of population structure. Mol. Ecol. Notes 4, 137–138.
doi: 10.1046/j.1471-8286.2003.00566.x
Shanks, A. L. (2009). Pelagic larval duration and dispersal distance revisited. Biol.
Bull. 216, 373–385. doi: 10.1086/BBLv216n3p373
Smith, S.I. (1882). Reports on the Results of Dredging Under the Supervisión of
Alexander Agassiz, on the East Coast of the United States During the Summer
of 1880, by the U.S. Coast Survey Steamer “Blake”, Commander J.R. Bartlett,
U.S.N., Commanding. Bulletin of the Museum of comparative Zoology at
Harvard College, Vol. 10, 1–108.
St. John, M. A., Borja, A., Chust, G., Heath, M., Grigorov, I., Mariani, P., et al.
(2016). A dark hole in our understanding of marine ecosystems and their
services: perspectives from the mesopelagic community. Front. Mar. Sci. 3:31.
doi: 10.3389/fmars.2016.00031
Sutton, T. T., Clark, M. R., Dunn, D. C., Halpin, P. N., Rogers, A. D.,
Guinotte, J., et al. (2017). A global biogeographic classification of the
mesopelagic zone. Deep-Sea Res. Part I Oceanogr. Res. Pap. 126, 85–102.
doi: 10.1016/j.dsr.2017.05.006
Timm, L. E. (2018). Evolutionary and population dynamics of crustaceans
in the Gulf of Mexico (doctoral dissertation). Miami, FL: Florida
International University.
Timm, L. E., Bracken-Grissom, H. D., Sosnowski, A., Breitbart, M., Vecchione, M.,
and Judkins, H. (2020). Population connectivity of three deep-sea cephalopod
species between the Gulf of Mexico and northwestern Atlantic Ocean.Deep Sea
Res. I. 103222. doi: 10.1016/j.dsr.2020.103222
Timm, L. E., Isma, L. M., and Bracken-Grissom, H. D. (2019). Single-locus
barcodes and demultiplexed ddRADseq data for comparative population
genomic analysis of the mesopelagic shrimp species Acanthephyra purpurea,
Systellaspis debilis, and Robustosergia robusta. Gulf of Mexico Research
Initiative Information and Data Cooperative (GRIIDC), Harte Research
Institute, Texas A&M University – Corpus Christi. doi: 10.7266/n7-3p3y-g470
Truelove, N. K., Kough, A. S., Behringer, D. C., Paris, C. B., Box, S. J., Preziosi,
R. F., et al. (2017). Biophysical connectivity explains population genetic
structure in a highly dispersive marine species. Coral Reefs 36, 233–244.
doi: 10.1007/s00338-016-1516-y
Uchida, H., and Baba, O. (2008). Fishery management and the pooling
arrangement in the Sakuraebi Fishery in Japan. Case Studies Fish. Self
Governance 504, 175–190.
van Olderborgh, G. J., van der Wiel, K., Sebastian, A., Singh, R., Arrighi, J., Otto,
F., et al. (2017). Attribution of extreme rainfall from Hurricane Harvey, August
2017. Environ. Res. Lett. 12:124009. doi: 10.1088/1748-9326/aa9ef2
Venables, W. N., and Ripley, B. D. (2002). Modern Applied Statistics With S, 4th
Edn. New York, NY: Springer.
Vereshchaka, A. L. (2009). Revision of the genus Sergestes (Decapoda:
Dendrobranchiata: Sergestidae): taxonomy and distribution. Galathea Rep.
22, 7–104.
Wells, R. J. D., Rooker, J. R., Quigg, A., and Wissel, B. (2017). Influence of
mesoscale oceanographic features on pelagic food webs in the Gulf of Mexico.
Mar. Biol. 164, 1–11. doi: 10.1007/s00227-017-3122-0
Zimmerman, R. A., and Biggs, D. C. (1999). Patterns of distribution of sound-
scattering zooplankton in warm- and cold-core eddies in the Gulf of Mexico,
from a narrowband acoustic doppler current profiler survey. J. Geophys. Res.
Oceans 104, 5251–5262. doi: 10.1029/1998JC900072
Conflict of Interest: The authors declare that the research was conducted in the
absence of any commercial or financial relationships that could be construed as a
potential conflict of interest.
The reviewer AL declared a past co-authorship with one of the authors MJ
to the handling editor.
Copyright © 2020 Timm, Isma, Johnston and Bracken-Grissom. This is an open-
access article distributed under the terms of the Creative Commons Attribution
License (CC BY). The use, distribution or reproduction in other forums is permitted,
provided the original author(s) and the copyright owner(s) are credited and that the
original publication in this journal is cited, in accordance with accepted academic
practice. No use, distribution or reproduction is permitted which does not comply
with these terms.
Frontiers in Marine Science | www.frontiersin.org 16 February 2020 | Volume 7 | Article 19