
In-Plane Shear-Axial Strain Coupling Formulation for Shear ...

INVESTIGACION Revista Mexicana de Fısica57 (2011) 518–523 DICIEMBRE 2011
Comparative measurement of in plane strain by shearography and electronicspeckle pattern interferometry
A. Martıneza, J.A. Rayasa, R. Corderob, and F. LabbecaCentro de Investigaciones enOptica,
Loma del Bosque 115, Col. Lomas del Campestre, Leon, Guanajuato Mexico,Tel. (477) 4414200; Fax (477) 4414209e-mail: [email protected]; [email protected]
bUniversidad de Santiago de Chile,Ave. Bernardo O’higgins 3363, Santiago, Chile,
e-mail: [email protected] Tecnica Federico Santa Marıa,
Ave. Espana 1680, Valparaıso, Chilee-mail: [email protected]
Recibido el 15 de junio de 2011; aceptado el 19 de octubre de 2011
In this work, an optical setup that gives the possibility of using either ESPI or ESPSI has been implemented to assess in-plane strains inducedon a composite sample. First, in-plane ESPI was used to measure displacement fields, which later allowed us to evaluate the correspondingstrain fields. Next, we applied ESPSI to measure the derivative of in-plane surface displacements (the strains). The experimental resultsobtained by applying both techniques (ESPI and ESPSI) were compared. We found that the difference between the strain fields obtained byESPSI and ESPI was roughly a constant. This result was expected since, although ESPI allows computing absolute strain values, the strainsmeasured by ESPSI are relative to a reference that must be measured using an additional method. Once calibrated the system ESPSI, theESPI could no longer be used. The strain field obtained in ESPSI is corrected by the sum of constant value calculated.
Keywords: Electronic speckle pattern interferometry; shearography; strain.
PACS: 06.20.-f; 07.60.Ly; 06.60 Mr; 06.90.+v
1. Introduction
Over recent decades, many new composites have been de-veloped, some with very valuable properties. By carefullychoosing the reinforcement, the matrix and the manufactur-ing process that brings them together, engineers can tailorthe properties of the material to meet specific requirements.They can, for example, make the composite sheet very strongin one direction by aligning the fibers that way, but weakerin another direction where strength is not so important. Theycan also select properties such as resistance to heat, chemicalsand weathering by choosing an appropriate matrix material.The greatest advantage of composite materials is strength andstiffness combined with lightness.
The demand for higher quality and structural reliabilitycalls for better techniques for nondestructive evaluation ofstresses in a structure. Optical methods such as ElectronicSpeckle Pattern Shearing Interferometry (ESPSI, also knownas shearography) [1] and electronic speckle pattern interfer-ometry (ESPI) [2] are of considerable interest because oftheir full-field and noncontact features. Among them, ESPSIallows direct measurement of surface displacement deriva-tives, and is a practical method that has received wide indus-trial acceptance for nondestructive testing.
Electronic Speckle Pattern Shearing Interferometry isvery similar to electronic speckle pattern interferometry, andit is typically used for nondestructive testing in material anal-
ysis and strain measurement [3]. The shearography methodis less susceptible to environmental noise, and operating theequipment typically requires less technical understanding. Itis generally used qualitatively because additional informationand processing are required to determine the absolute valueof the deformation.
This technique has been extended to measure larger dis-placement values [4] (about 216µm), and also used to studyperiodically induced deformations [5].
ESPSI can be divided into out-of-plane displacement gra-dient measurement and in-plane displacement gradient mea-surement. A combination of system ESPI and ESPSI to out-of-plane displacement gradient measurement has been imple-mented but the values found from both techniques have notbeen compared [6-8].
The determination of the reference value (constant) wasmeasurement too by using a square grid printed by serigraphyover the illuminated surface of the specimen [3].
This work describes the above mentioned inspection tech-niques and examines the strain map results obtained fromphase stepped ESPSI and ESPI techniques applied to com-posite material samples that had a hole in the sample center.In particular, the results from the ESPSI are compared withthe reference ESPI results to determine how well they corre-late, which ultimately attempts to determine the suitability ofthe ESPSI technique as an alternative ESPI inspection tech-nique. By applying appropriate phase stepping techniques

COMPARATIVE MEASUREMENT OF IN PLANE STRAIN BY SHEAROGRAPHY AND ELECTRONIC SPECKLE. . . 519
FIGURE 1. Arrangement of ESPI interferometer to measure dis-placement in the direction of the y-axis.
during the process, followed by suitable phase unwrappingalgorithms and reconstruction processes, captured fringe pat-terns can be reconstructed to represent quantifiable wholefield surface strain.
2. Theory
2.1. Electronic speckle pattern interferometry
In ESPI, a speckle pattern is formed by illuminating the sur-face of the test object with two collimated wave fronts formedby an interferometer which has laser light as its source. Aschematic of the system is shown in Fig. 1. Wave fronts1and2 are symmetrically inclined at an angleθ to the surfacenormal to the test object on theyz-plane. The unloaded testobject is imaged by a CCD video camera directed along thez-axisand on the plane of the collimated wave fronts. Thesewave fronts are scattered at the surface of the object and formtwo separate speckle patterns that interfere on the film planeof the CCD camera. The CCD camera captures this interfer-ence pattern, which is then processed by the ESPI test soft-ware and is stored as a reference pattern on the computer.When the object is subsequently loaded, the test area under-goes deformation and the collimated wave fronts are againscattered, resulting in a change in the speckle patterns. This,in turn, causes a change in the interference pattern, which isagain imaged on the faceplate of the CCD camera and storedin memory. The ESPI test software is then used to process thetwo stored interference patterns so as to display the resultinginterferogram of alternate light and dark fringes on a videomonitor. The interferogram is representative of the displace-ment of the test object. Then the displacement field is givenby [9]:
v (x, y) = ϕ (x, y)λ
4π sin θ, (1)
whereλ is the wavelength of the laser light,θ the angle ofinclination of the coherent wave front with respect to thesurface normal on theyz-plane, andϕ is the relative phasechange between the two states.
FIGURE 2. Principle of digital speckle shearography, a schematicsetup.
2.2. Electronic Speckle Pattern Shearing Interferome-try
A schematic diagram of an optical arrangement of obliqueillumination and normal observation is shown in Fig. 2. Acollimated beam lying on they-z planeand making an an-gleθ with respect to the observation direction illuminates theobject. A zoom video lens and a Michelson interferometricsetup are used for imaging and shearing. To simplify the anal-ysis, we assume that the illumination beam is collimated andthe zoom lens is close to telecentric. In the setup, phase step-ping is provided by one of the mirrors (PZM) in the Michel-son interferometer. A small tilt to mirror M4 introduces a lat-eral shift∆y perpendicular to the observation direction. Thetwo laterally sheared wave fronts interfere with each otheron the target of the CCD camera and produce the resultantspeckle pattern
I (x, y) = |A (x, y) + A (x, y + ∆y)|2 , (2)
whereA is the complex amplitude at the detecting plane.Hence, the acquired irradiance depends on the scatteringproperties of two small areas centered atp (q) andp (q + ∆q)on the object, where∆q is the shear vector on the object [1].When the object deforms, a new speckle patternI ′(x, y) isacquired. If it is assumed that only small deformations arepresent, the phase change∆ϕy(x, y) betweenI(x, y) andI ′(x, y) is given by [10]
∆ϕ1y =
2π
λ
[sin θ
∂v
∂y+ (1 + cos θ)
∂w
∂y
]·∆y , (3)
whereλ is the wavelength of the light,v is the in-plane dis-placement generated by the deformation,θ is the angle be-tween the direction of illumination and the direction of ob-servation,w is the out-of-plane displacement, and∆yis themagnitude of the shear along the y direction (Fig. 3, beam 1).
Similarly, one can write the equation of relative phasedifference when laser illumination is supplied by beam 2
Rev. Mex. Fis.57 (2011) 518–523
520 A. MARTINEZ, J.A. RAYAS, R. CORDERO, AND F. LABBE
FIGURE 3. Optical setup: M1 through M5: mirrors; C: camera; S:specimen; BS1 and BS2: Beam splitters; L: laser; I: expanded laserbeam;θ: incident angle. The pulling direction was y.
(Fig. 3). The phase change introduced by the displacementof the object is expressed by [10]:
∆ϕ2y =
2π
λ
[− sin θ
∂v
∂y+ (1 + cos θ)
∂w
∂y
]·∆y (4)
The relative phase change between the phase contoursrepresented by Eqs. 3 and 4 is given by
∆ϕ1y −∆ϕ2
y =4π
λ
(sin θ
∂v
∂y
)·∆y (5)
3. Experimental part
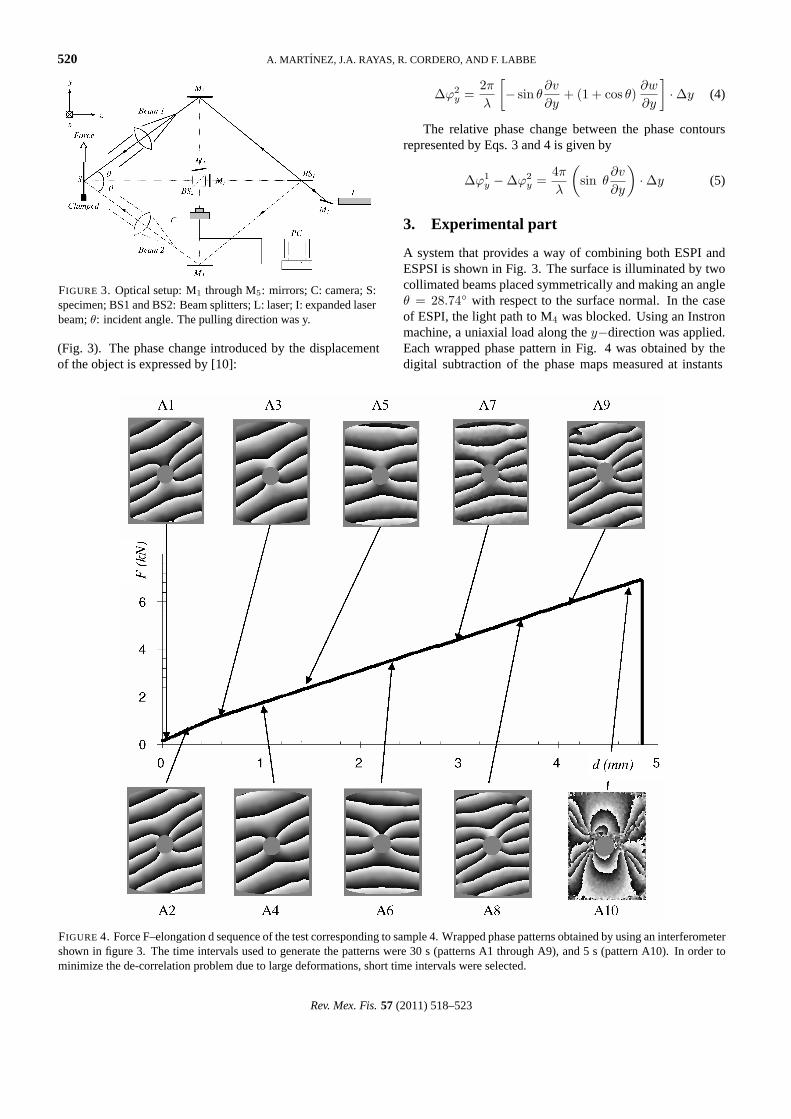
A system that provides a way of combining both ESPI andESPSI is shown in Fig. 3. The surface is illuminated by twocollimated beams placed symmetrically and making an angleθ = 28.74◦ with respect to the surface normal. In the caseof ESPI, the light path to M4 was blocked. Using an Instronmachine, a uniaxial load along they−direction was applied.Each wrapped phase pattern in Fig. 4 was obtained by thedigital subtraction of the phase maps measured at instants
FIGURE 4. Force F–elongation d sequence of the test corresponding to sample 4. Wrapped phase patterns obtained by using an interferometershown in figure 3. The time intervals used to generate the patterns were 30 s (patterns A1 through A9), and 5 s (pattern A10). In order tominimize the de-correlation problem due to large deformations, short time intervals were selected.
Rev. Mex. Fis.57 (2011) 518–523
COMPARATIVE MEASUREMENT OF IN PLANE STRAIN BY SHEAROGRAPHY AND ELECTRONIC SPECKLE. . . 521
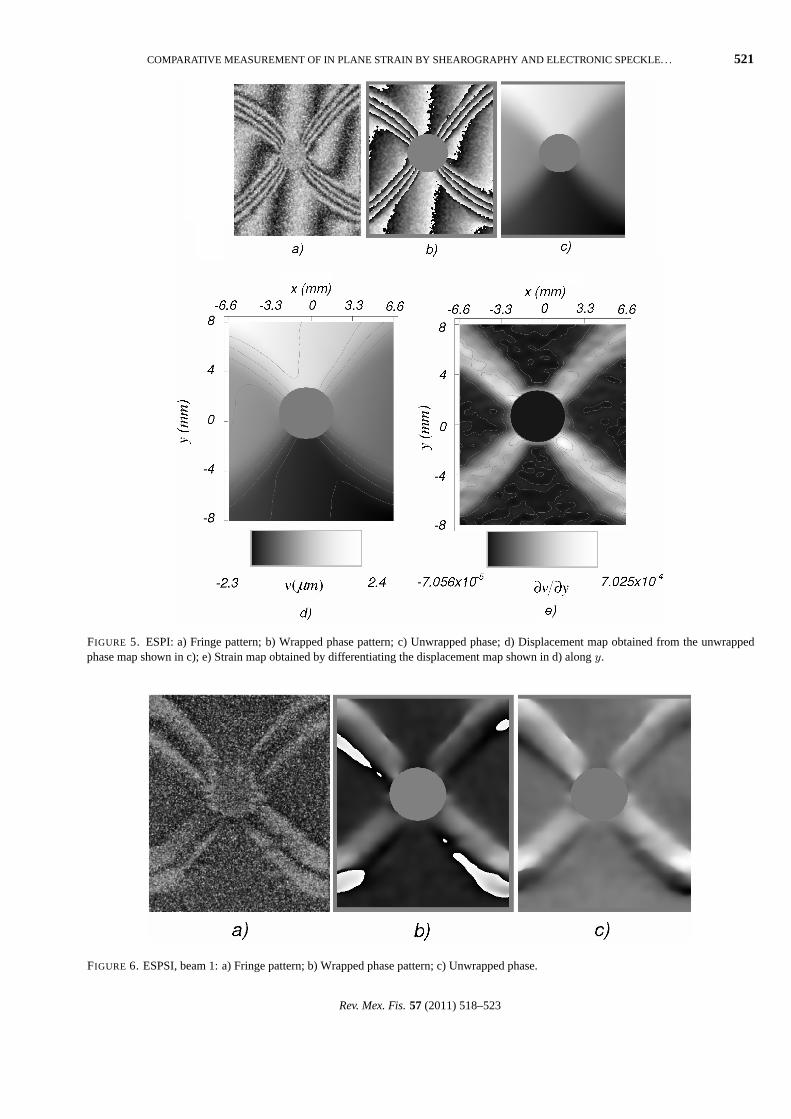
FIGURE 5. ESPI: a) Fringe pattern; b) Wrapped phase pattern; c) Unwrapped phase; d) Displacement map obtained from the unwrappedphase map shown in c); e) Strain map obtained by differentiating the displacement map shown in d) alongy.
FIGURE 6. ESPSI, beam 1: a) Fringe pattern; b) Wrapped phase pattern; c) Unwrapped phase.
Rev. Mex. Fis.57 (2011) 518–523

522 A. MARTINEZ, J.A. RAYAS, R. CORDERO, AND F. LABBE
FIGURE 7. ESPSI, beam 2: a) Fringe pattern; b) Wrapped phase pattern; c) Unwrapped phase.
separated in time by an interval∆t. The first of these phasemaps was measured at the load stage indicated in the plot; forexample, the first phase map that allowed us to generate thewrapped phase pattern A4 was captured when sample elon-gationd was equal to 1 mm (see Fig. 4). The second specklepattern was recorded 30 s later. The elongation correspondingto the second speckle pattern cannot be indicated separatelyin Fig. 4 because the time interval used to generate the phasepattern was relatively small (the testing machine worked at aspeed of 40µm min−1). Except A10, all the other wrappedphase patterns were generated using the same time interval.
Figure 5 shows an example of data exploitation which isafter A9 and before A10. To get the strain field from the dis-placement fields, the next evaluation step is the determinationof the displacements derivatives. Deriving v in they direc-tion yields the strain (unit elongation)εy directly. In Fig 5e,this strain distribution is shown. The strain fields are obtainedby numerical differentiation, where the length of the deriva-tive interval∆y is 416µm. It is a well known fact that noisein the data is severely amplified by differentiation. Therefore,a low-pass filter (mean filter) was applied to smooth the sur-faces of Fig. 5c) before performing numerical differentiationto get the strains. The direct approach to numerical differen-tiation is to compute finite differences by:
εy =∂v(x, y)
∂y≈ v(xi, yj+1)− v(xi, yj)
yj+1 − yj. (6)
The displacement mapsv exhibit a circular hole at thecentral region of the plate (Fig. 5d)). To avoid these discon-tinuities across the boundary of the hole, the derivative wasnot calculated in the central circular region of the sample. Inthis case, the derivative values were substituted by derivativevalues obtained near to the hole’s neighbourhood.
The use of ESPI and ESPSI was achieved by switchingon the appropriate illumination beams. The frames relative tothe deformed object state are subsequently recorded and sub-tracted from their corresponding initial patterns. The imagesresulting from ESPI and ESPSI were then digitally processed.Fringe patterns were captured by means of a CCD camera of
640×480 pixels and 8 bits. In this work, the four phase shiftalgorithm [2] was used to calculate the phase. Figures 6 and7 show the experimental results rendered by the ESPSI con-figuration in the cases of illumination with beams 1 and 2respectively. The fringes pattern is showed in Figs. 6a) y7a). Figs. 6b) and 7b) show wrapped phase maps whichare between values of (-π, π). These values are scaled be-tween(0, 255) gray levels to visualize like an image. Thewhite areas correspond to high values of the wrapper (nearvalues toπ which corresponds to255 or white area). Theunwrapped phase maps were obtained by the classical tech-nique [11] which are showed in Figs. 6c) and 7c).
FIGURE 8. In-plane strain∂v/∂y obtained through ESPSI.
Rev. Mex. Fis.57 (2011) 518–523

COMPARATIVE MEASUREMENT OF IN PLANE STRAIN BY SHEAROGRAPHY AND ELECTRONIC SPECKLE. . . 523
Figure 8 shows the strain derivative distribution obtainedby applying Eq. (5).
When comparing Fig. 8 and 5e), we found that the differ-ence between the strain fields obtained by ESPSI and ESPIwas roughly a constant. This result was expected since, al-though ESPI allows computing absolute strain values, thestrains measured by ESPSI are relative to a reference thatmust be measured using an additional method (see [3] fordetails).
4. Conclusions
A stable and reliable dual-function system is proposed; itallows combining both ESPI and ESPSI into a single unit,and is an inexpensive alternative to available commercial sys-tems. The primary advantages are the possibility of obtaininginformation both about an object’s displacement and about itsgradient as well as ESPI permits to calibrate the shearographysystem. From the resulting images generated by using bothESPI and ESPSI, the strain fields can be efficiently measured.In the case of ESPI, the strains are computed by differenti-ating the displacement fields retrieved from fringe patternsgenerated by interferometry when applying load to a sample;errors affecting ESPI measurements may result from both thepresence of rigid body displacements resulting from excita-
tion, and also from sensitivity to external disturbances suchas vibrations. In the case of ESPSI the strains are directlyretrieved from the fringe patterns, which carry informationon the gradients of the relative displacement induced by thedeformation of the sample; ESPSI has less sensitivity to dis-turbances linked to rigid body displacements and vibration,and therefore, it can be usedin situ to detect defects in non-destructive inspections.
The experimental results obtained by applying both tech-niques (ESPI and ESPSI) were compared. As expected, wefound that the difference between the strain fields obtainedby ESPSI and ESPI was roughly a constant.
Acknowledgements
Authors wish to thank economical support from Consejo Na-cional de Ciencia y Tecnologıa (CONACYT Mexico). Theexperimental results are part of the bilateral project betweenMexico-Chile: Analysis of deformation mechanisms to fruitcuticle using laser interferometry techniques. CONACYT-CONICYT project. The support of CONICYT (FONDE-CYT Preis 1090471, ANILLO Preis ACT98 and ANILLOPreis ACT95), UTFSM (DGIP Preis 250915) and USACH(DICYT, academic exchange program) is gratefully acknowl-edged.
1. W. Steinchen, L. Yang,Digital shearography(Bellingham,Washington USA: SPIE Press, 2003).
2. T. Kreis, Holographic interferometry(Bremen, Germany:Akademie Verlag 1996) 261-263 and 123-132.
3. F. Labbe, R. Cordero, A. Martınez, and R. Rodrıguez-Vera,Measurement Science Technology16 (2005) 1677-1683.
4. R.A. Martınez-Celorio, G.H. Kaufmann, and G. Mendiola,Op-tical Engineering39 (2000) 751-757.
5. P.D. Ruiz, A. Davila, G. Mendiola, G. Kaufmann,Optical En-gineering40 (2001) 318-324.
6. B. Bhaduri, N. Krishna Mohan, M.P. Kothiyal, and R.S. Sirohi,Optics Express14 (2006) 11598-11607.
7. D. Francis, R.P. Tatam and R.M. Groves,Measurement Scienceand Technology21 (2010) 102001.
8. P.A. Fomitchov and S. Krishnaswamy,Measurement Scienceand Technology8 (1997) 581–583.
9. A. Martınez, R. Rodrıguez-Vera, J.A. Rayas, and H.J. Puga,Optics Communications223(2003) 239-246.
10. P.K. Rastogi,Journal of Modern Optics43 (1996) 1577-1581.
11. D. Malacara, M. Servın, and Z. Malacara,Interferogram Analy-sis for Optical Testing(Boca Raton, FL.: Taylor&Francis, Sec-ond Edition, 2005) pp. 493-500.
Rev. Mex. Fis.57 (2011) 518–523


![PLANE STRAIN PROBLEMS IN SECOND-ORDER ELASTICITY THEORY · PDF filePLANE STRAIN PROBLEMS IN SECOND-ORDER ... Green and Shield [4], ... Plane strain problems in second-order elasticity](https://static.fdocuments.net/doc/165x107/5aa819c67f8b9ac5258b68be/plane-strain-problems-in-second-order-elasticity-theory-strain-problems-in-second-order.jpg)


![C5.2 Elasticity and Plasticity [1cm] Lecture 5 Plane strain](https://static.fdocuments.net/doc/165x107/625d199f7a3aa731631d9e64/c52-elasticity-and-plasticity-1cm-lecture-5-plane-strain.jpg)