Comparative life cycle assessment of certified and non ... and non-certified wood... · Comparative...
20
Quantis© LCA of certified and non-certifiable wood December 19, 2012 Page 1 Comparative life cycle assessment of certified and non-certified wood Final Report Prepared for: PEFC Prepared by: Quantis An De Schryver Cécile Guignard Vincent Rossi Sébastien Humbert December 19, 2012
Transcript of Comparative life cycle assessment of certified and non ... and non-certified wood... · Comparative...
Quantis© LCA of certified and non-certifiable wood
December 19, 2012 Page 1
Comparative life cycle assessment of
certified and non-certified wood
Final Report
Prepared for: PEFC
Prepared by: Quantis
An De Schryver
Cécile Guignard
Vincent Rossi
Sébastien Humbert
December 19, 2012
Quantis© LCA of certified and non-certifiable wood
December 19, 2012 Page 2
Quantis is a leading life cycle assessment (LCA) consulting firm specialized in supporting companies to
measure, understand and manage the environmental impacts of their products, services and operations.
Quantis is a global company with offices in the United States, Canada, Switzerland and France and
employs close to 70 people, amongst which several are internationally renowned experts in the LCA
field.
Quantis offers cutting-edge services in environmental footprinting (multiple indicators including carbon,
water and biodiversity), eco design, sustainable supply chains and environmental communication.
Quantis also provides innovative LCA software, Quantis SUITE 2.0, which enables organizations to
evaluate, analyze and manage their environmental footprint with ease. Fuelled by its close ties with the
scientific community and its strategic research collaborations, Quantis has a strong track record in
applying its knowledge and expertise to accompany clients in transforming LCA results into decisions
and action plans. More information can be found at www.quantis-intl.com.
This report has been prepared by the Swiss office of Quantis. Please direct all questions regarding this
report to Quantis Switzerland or directly to Sebastien Humbert ([email protected],
+41-79-754-7566).
Quantis Switzerland
Parc scientifique EPFL
Bât D
1015 Lausanne
Tel: +41 21 693 91 92
www.quantis-intl.com
Quantis© LCA of certified and non-certifiable wood
December 19, 2012 Page 3
PROJECT INFORMATION
Project Title Comparative life cycle assessment of certified and non-certified wood
Version 1.1 (final version, containing feedbacks and inputs from PEFC)
Contracting organization
PEFC International
Liability Statement Information contained in this report has been compiled from and/or computed
from sources believed to be credible. Application of the data is strictly at the
discretion and the responsibility of the reader. Quantis is not liable for any loss
or damage arising from the use of the information in this document.
Project team An De Schryver, Project manager and scientific expert
Cécile Guignard, Senior life cycle analyst ([email protected])
Vincent Rossi, Senior life cycle analyst ([email protected])
Sébastien Humbert, Quality control and scientific expert
([email protected], +41-79-754-7566)
Client Contacts Sarah Price, Head of projects and development PEFC
PEFC International 10, Route de l'Aéroport, Case Postale 636 1215 Geneva - Switzerland +41 (22) 799 4540
Associated files This report is associated with the processes modeled in Quantis SUITE 2.0
Quantis© LCA of certified and non-certifiable wood
December 19, 2012 Page 4
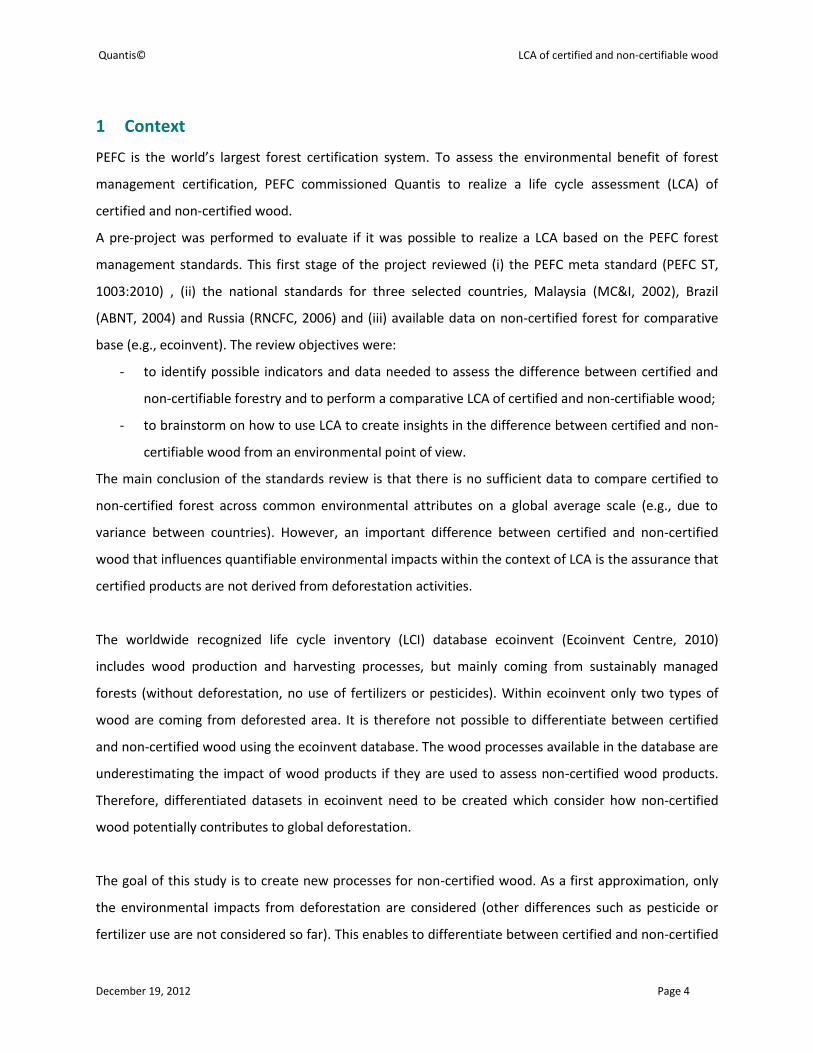
1 Context
PEFC is the world’s largest forest certification system. To assess the environmental benefit of forest
management certification, PEFC commissioned Quantis to realize a life cycle assessment (LCA) of
certified and non-certified wood.
A pre-project was performed to evaluate if it was possible to realize a LCA based on the PEFC forest
management standards. This first stage of the project reviewed (i) the PEFC meta standard (PEFC ST,
1003:2010) , (ii) the national standards for three selected countries, Malaysia (MC&I, 2002), Brazil
(ABNT, 2004) and Russia (RNСFC, 2006) and (iii) available data on non-certified forest for comparative
base (e.g., ecoinvent). The review objectives were:
- to identify possible indicators and data needed to assess the difference between certified and
non-certifiable forestry and to perform a comparative LCA of certified and non-certifiable wood;
- to brainstorm on how to use LCA to create insights in the difference between certified and non-
certifiable wood from an environmental point of view.
The main conclusion of the standards review is that there is no sufficient data to compare certified to
non-certified forest across common environmental attributes on a global average scale (e.g., due to
variance between countries). However, an important difference between certified and non-certified
wood that influences quantifiable environmental impacts within the context of LCA is the assurance that
certified products are not derived from deforestation activities.
The worldwide recognized life cycle inventory (LCI) database ecoinvent (Ecoinvent Centre, 2010)
includes wood production and harvesting processes, but mainly coming from sustainably managed
forests (without deforestation, no use of fertilizers or pesticides). Within ecoinvent only two types of
wood are coming from deforested area. It is therefore not possible to differentiate between certified
and non-certified wood using the ecoinvent database. The wood processes available in the database are
underestimating the impact of wood products if they are used to assess non-certified wood products.
Therefore, differentiated datasets in ecoinvent need to be created which consider how non-certified
wood potentially contributes to global deforestation.
The goal of this study is to create new processes for non-certified wood. As a first approximation, only
the environmental impacts from deforestation are considered (other differences such as pesticide or
fertilizer use are not considered so far). This enables to differentiate between certified and non-certified
Quantis© LCA of certified and non-certifiable wood
December 19, 2012 Page 5
wood, without and with deforestation respectively. A global average approach is taken, meaning that
when buying non-certified wood products there is no active encouragement against deforestation as
there is no traceability to prove otherwise.
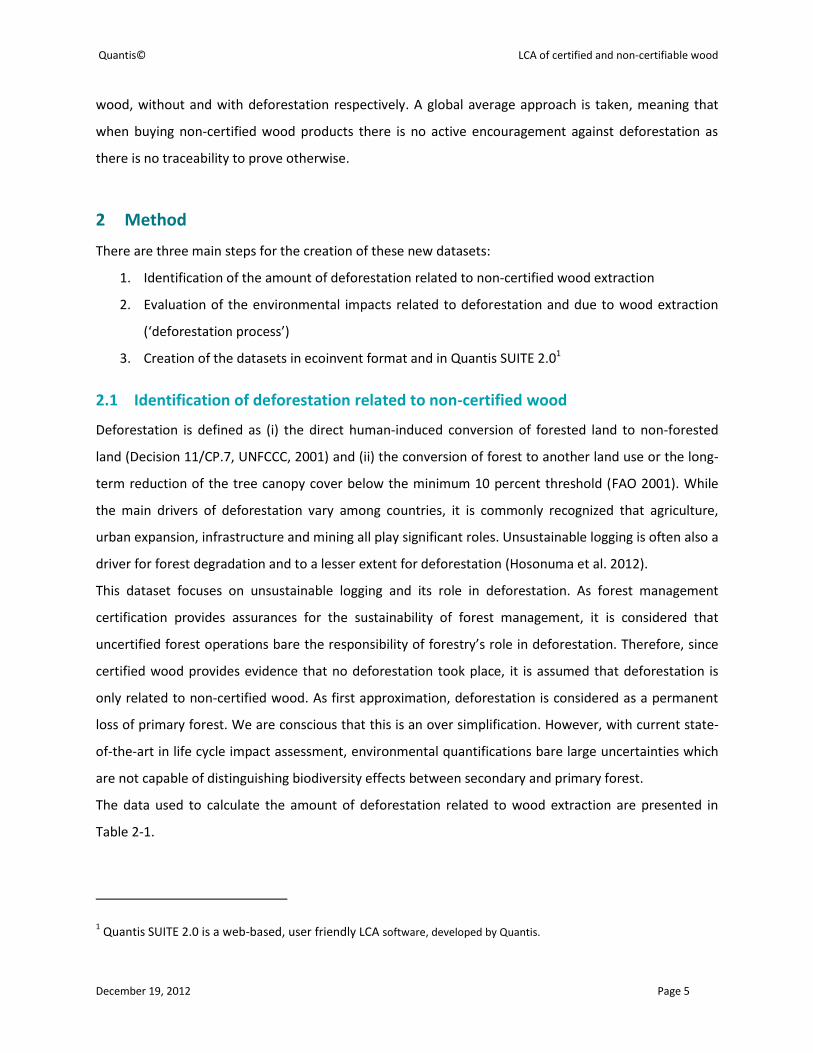
2 Method
There are three main steps for the creation of these new datasets:
1. Identification of the amount of deforestation related to non-certified wood extraction
2. Evaluation of the environmental impacts related to deforestation and due to wood extraction
(‘deforestation process’)
3. Creation of the datasets in ecoinvent format and in Quantis SUITE 2.01
2.1 Identification of deforestation related to non-certified wood
Deforestation is defined as (i) the direct human-induced conversion of forested land to non-forested
land (Decision 11/CP.7, UNFCCC, 2001) and (ii) the conversion of forest to another land use or the long-
term reduction of the tree canopy cover below the minimum 10 percent threshold (FAO 2001). While
the main drivers of deforestation vary among countries, it is commonly recognized that agriculture,
urban expansion, infrastructure and mining all play significant roles. Unsustainable logging is often also a
driver for forest degradation and to a lesser extent for deforestation (Hosonuma et al. 2012).
This dataset focuses on unsustainable logging and its role in deforestation. As forest management
certification provides assurances for the sustainability of forest management, it is considered that
uncertified forest operations bare the responsibility of forestry’s role in deforestation. Therefore, since
certified wood provides evidence that no deforestation took place, it is assumed that deforestation is
only related to non-certified wood. As first approximation, deforestation is considered as a permanent
loss of primary forest. We are conscious that this is an over simplification. However, with current state-
of-the-art in life cycle impact assessment, environmental quantifications bare large uncertainties which
are not capable of distinguishing biodiversity effects between secondary and primary forest.
The data used to calculate the amount of deforestation related to wood extraction are presented in
Table 2-1.
1 Quantis SUITE 2.0 is a web-based, user friendly LCA software, developed by Quantis.
Quantis© LCA of certified and non-certifiable wood
December 19, 2012 Page 6
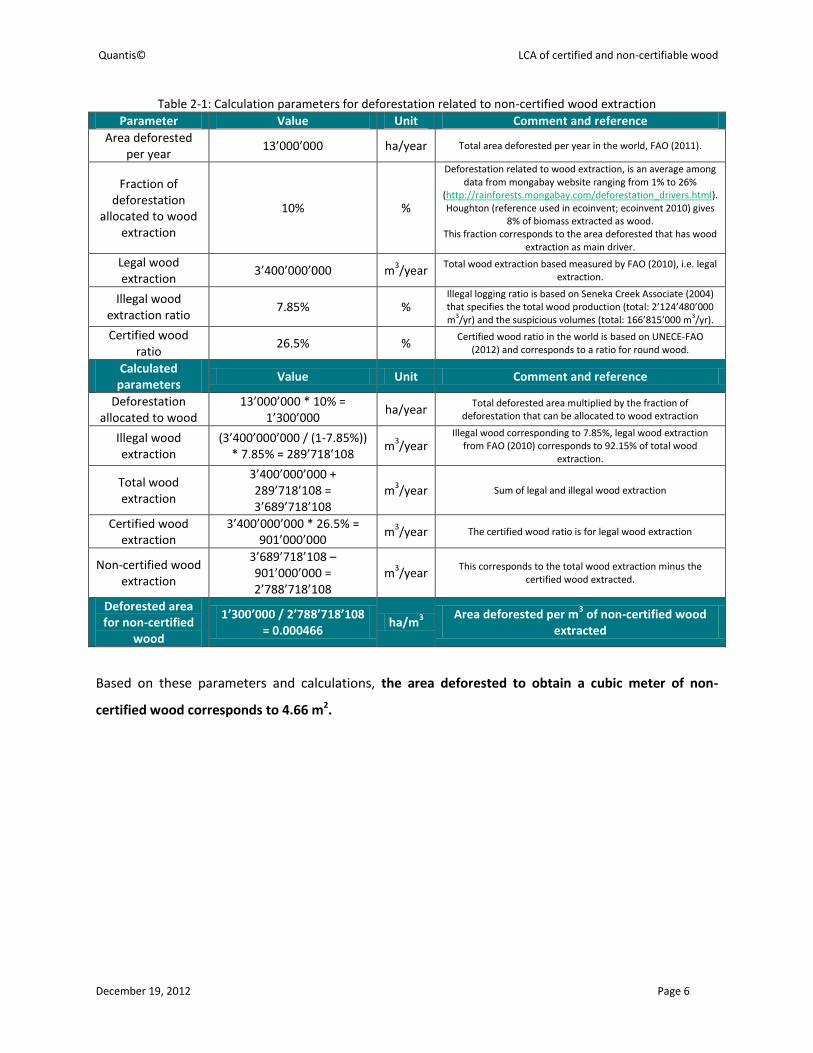
Table 2-1: Calculation parameters for deforestation related to non-certified wood extraction
Parameter Value Unit Comment and reference
Area deforested per year
13’000’000 ha/year Total area deforested per year in the world, FAO (2011).
Fraction of deforestation
allocated to wood extraction
10% %
Deforestation related to wood extraction, is an average among data from mongabay website ranging from 1% to 26%
(http://rainforests.mongabay.com/deforestation_drivers.html). Houghton (reference used in ecoinvent; ecoinvent 2010) gives
8% of biomass extracted as wood. This fraction corresponds to the area deforested that has wood
extraction as main driver.
Legal wood extraction
3’400’000’000 m3/year
Total wood extraction based measured by FAO (2010), i.e. legal extraction.
Illegal wood extraction ratio
7.85% % Illegal logging ratio is based on Seneka Creek Associate (2004) that specifies the total wood production (total: 2’124’480’000 m3/yr) and the suspicious volumes (total: 166’815’000 m3/yr).
Certified wood ratio
26.5% % Certified wood ratio in the world is based on UNECE-FAO
(2012) and corresponds to a ratio for round wood.
Calculated parameters
Value Unit Comment and reference
Deforestation allocated to wood
13’000’000 * 10% = 1’300’000
ha/year Total deforested area multiplied by the fraction of
deforestation that can be allocated to wood extraction
Illegal wood extraction
(3’400’000’000 / (1-7.85%)) * 7.85% = 289’718’108
m3/year
Illegal wood corresponding to 7.85%, legal wood extraction from FAO (2010) corresponds to 92.15% of total wood
extraction.
Total wood extraction
3’400’000’000 + 289’718’108 = 3’689’718’108
m3/year Sum of legal and illegal wood extraction
Certified wood extraction
3’400’000’000 * 26.5% = 901’000’000
m3/year The certified wood ratio is for legal wood extraction
Non-certified wood extraction
3’689’718’108 – 901’000’000 = 2’788’718’108
m3/year
This corresponds to the total wood extraction minus the certified wood extracted.
Deforested area for non-certified
wood
1’300’000 / 2’788’718’108 = 0.000466
ha/m3
Area deforested per m3 of non-certified wood
extracted
Based on these parameters and calculations, the area deforested to obtain a cubic meter of non-
certified wood corresponds to 4.66 m2.
Quantis© LCA of certified and non-certifiable wood
December 19, 2012 Page 7
2.2 Evaluation of the environmental impacts of deforestation: deforestation process
The impacts related to deforestation are the following:
- Machines to cut the trees and transport them
- Infrastructures necessary for the machinery (access road, shed)
- Biomass burning and degradation
- Emissions due to land use change (LUC): carbon loss from soils and changes in other emissions
(N2O, CH4, etc.) from soils
- Biodiversity loss
- Effect on pluvial system
The deforestation for wood process has been built based on the ecoinvent v3 draft process called “clear-
cutting, primary forest to arable land/GLO” (Ecoinvent Centre, 2012).
2.2.1 Machines and infrastructure
As machinery use (power sawing and diesel) and infrastructure (occupation for construction site or
access road) are already considered in the processes of wood extraction named “ … at forest road” to
which the deforestation process will be added, they do not need to be considered here. Therefore, they
are put to zero in the deforestation process.
2.2.2 Biomass burning and emissions due to land use change
The forest biomass can be distributed among
- above ground (living) biomass (trees)
- below ground (living) biomass (roots and soil biomass)
- dead organic matter (litter or dead wood)
Litter or dead wood are not living biomass. They are assumed to burn or degrade, and emit the same
substances as (living) biomass. The (living) biomass will either be extracted as wood, or burned or
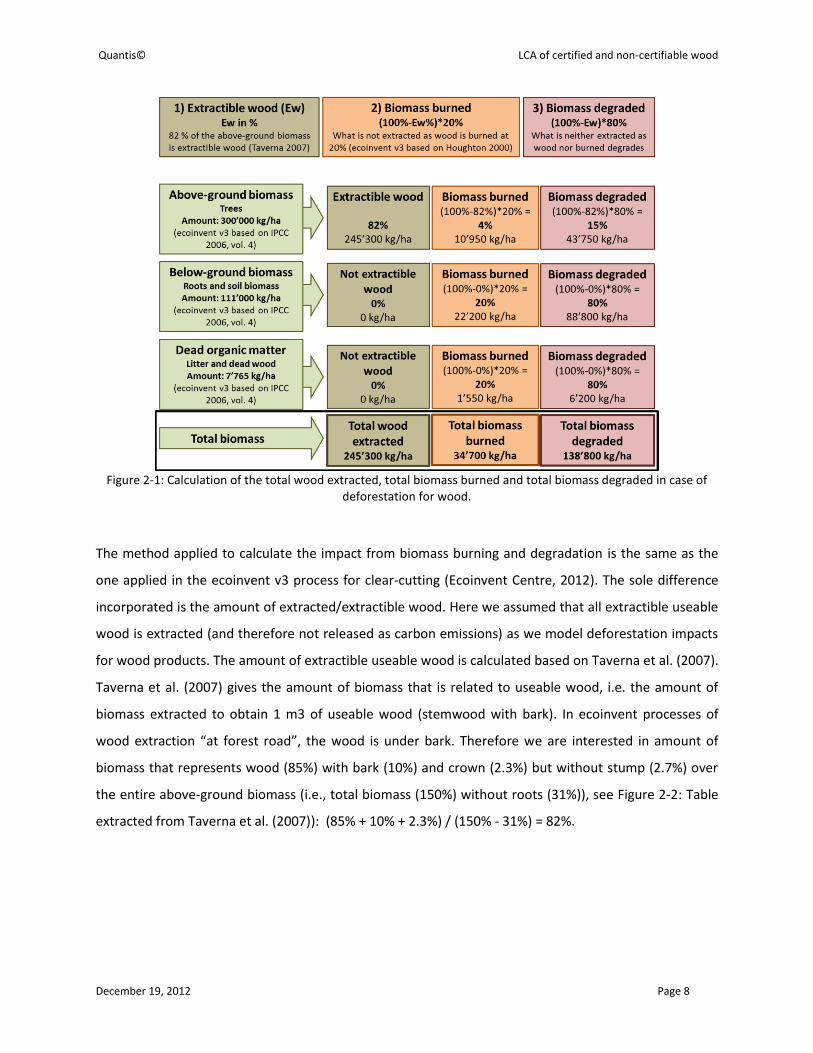
degraded. The Figure 2-1 explains how the total quantity of wood extracted, biomass burned and
biomass degraded per hectare is calculated.
Quantis© LCA of certified and non-certifiable wood
December 19, 2012 Page 8
Figure 2-1: Calculation of the total wood extracted, total biomass burned and total biomass degraded in case of
deforestation for wood.
The method applied to calculate the impact from biomass burning and degradation is the same as the
one applied in the ecoinvent v3 process for clear-cutting (Ecoinvent Centre, 2012). The sole difference
incorporated is the amount of extracted/extractible wood. Here we assumed that all extractible useable
wood is extracted (and therefore not released as carbon emissions) as we model deforestation impacts
for wood products. The amount of extractible useable wood is calculated based on Taverna et al. (2007).
Taverna et al. (2007) gives the amount of biomass that is related to useable wood, i.e. the amount of
biomass extracted to obtain 1 m3 of useable wood (stemwood with bark). In ecoinvent processes of
wood extraction “at forest road”, the wood is under bark. Therefore we are interested in amount of
biomass that represents wood (85%) with bark (10%) and crown (2.3%) but without stump (2.7%) over
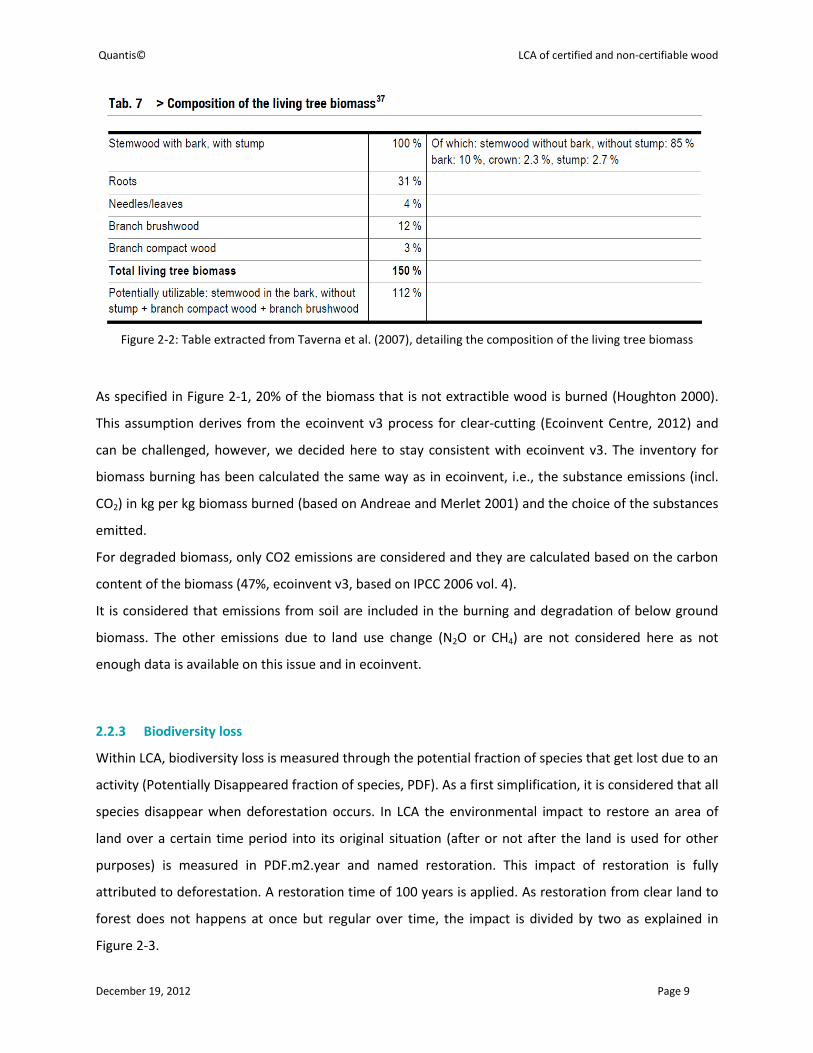
the entire above-ground biomass (i.e., total biomass (150%) without roots (31%)), see Figure 2-2: Table
extracted from Taverna et al. (2007)): (85% + 10% + 2.3%) / (150% - 31%) = 82%.
Quantis© LCA of certified and non-certifiable wood
December 19, 2012 Page 9
Figure 2-2: Table extracted from Taverna et al. (2007), detailing the composition of the living tree biomass
As specified in Figure 2-1, 20% of the biomass that is not extractible wood is burned (Houghton 2000).
This assumption derives from the ecoinvent v3 process for clear-cutting (Ecoinvent Centre, 2012) and
can be challenged, however, we decided here to stay consistent with ecoinvent v3. The inventory for
biomass burning has been calculated the same way as in ecoinvent, i.e., the substance emissions (incl.
CO2) in kg per kg biomass burned (based on Andreae and Merlet 2001) and the choice of the substances
emitted.
For degraded biomass, only CO2 emissions are considered and they are calculated based on the carbon
content of the biomass (47%, ecoinvent v3, based on IPCC 2006 vol. 4).
It is considered that emissions from soil are included in the burning and degradation of below ground
biomass. The other emissions due to land use change (N2O or CH4) are not considered here as not
enough data is available on this issue and in ecoinvent.
2.2.3 Biodiversity loss
Within LCA, biodiversity loss is measured through the potential fraction of species that get lost due to an
activity (Potentially Disappeared fraction of species, PDF). As a first simplification, it is considered that all
species disappear when deforestation occurs. In LCA the environmental impact to restore an area of
land over a certain time period into its original situation (after or not after the land is used for other
purposes) is measured in PDF.m2.year and named restoration. This impact of restoration is fully
attributed to deforestation. A restoration time of 100 years is applied. As restoration from clear land to
forest does not happens at once but regular over time, the impact is divided by two as explained in
Figure 2-3.

Quantis© LCA of certified and non-certifiable wood
December 19, 2012 Page 10
Figure 2-3: Restoration of biodiversity loss due to deforestation after 100 years. PDF stands for Potentially
Disappeared Fraction of species, where 1 indicates 100% disappearance of species. a) Progressive restoration, realistic scenario considered in this study. b) Brutal restoration after years, not realistic scenario.
Therefore for 1 m2 deforested, 100% species disappear over 1 m2 of land during 100 years, divided by 2
for the gradual change, which results in an impact on biodiversity of 50 PDF-m2-year.
Therefore 1 m2 of the elementary flow “transformation, from forest, primary” is considered to
correspond to an impact on biodiversity of 50 PDF-m2-year. This latter value is part of the impact
assessment methodology and is not part of the inventory process data.
2.2.4 Effect on pluvial system
It is known that deforestation can affect the pluvial system. Deforestation means less evapo-
transpiration. But not enough data is available on this topic and it is therefore not included in the
modeling. This could be added in future improvements of the model.
2.2.5 Multiple output process
Deforestation for wood results in wood products as output, but could also result into agricultural land
afterwards. Part of the emissions from the land transformation from deforestation could be allocated to
each of these two outputs. But as we are here interested in the building of a process of deforestation for
wood and as it is unknown what is done with the land afterwards, it has been decided that this
deforestation is 100% allocated to the wood extraction. This is a simplification which can give an
overestimation of reality and therefore can be challenged. However, we decided to keep this allocation
in order to be consistent with the choices made in the ecoinvent database.
Quantis© LCA of certified and non-certifiable wood
December 19, 2012 Page 11
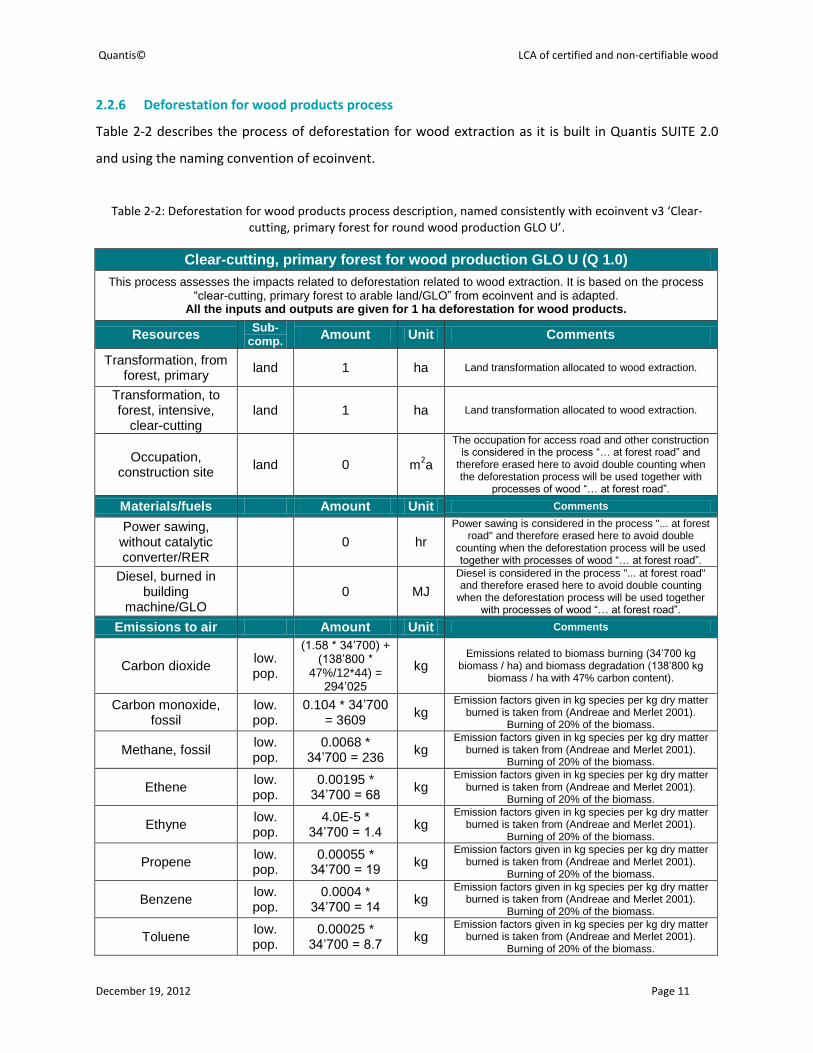
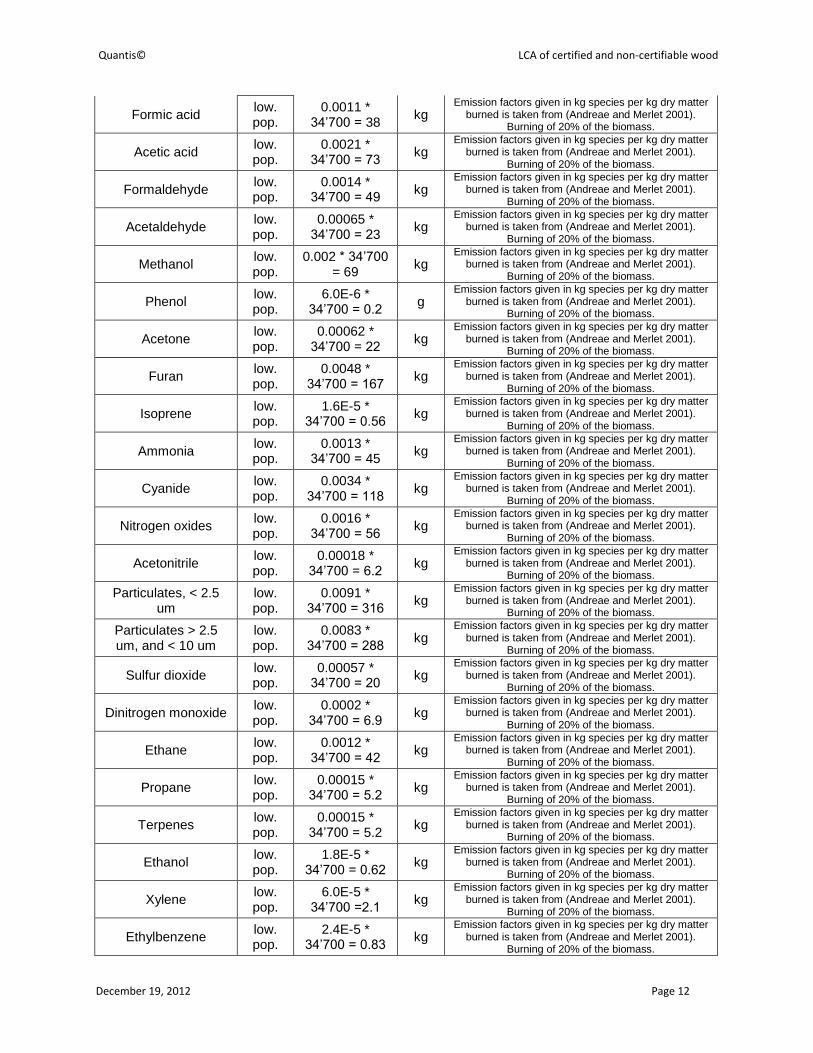
2.2.6 Deforestation for wood products process
Table 2-2 describes the process of deforestation for wood extraction as it is built in Quantis SUITE 2.0
and using the naming convention of ecoinvent.
Table 2-2: Deforestation for wood products process description, named consistently with ecoinvent v3 ‘Clear-cutting, primary forest for round wood production GLO U’.
Clear-cutting, primary forest for wood production GLO U (Q 1.0)
This process assesses the impacts related to deforestation related to wood extraction. It is based on the process “clear-cutting, primary forest to arable land/GLO” from ecoinvent and is adapted.
All the inputs and outputs are given for 1 ha deforestation for wood products.
Resources Sub-
comp. Amount Unit Comments
Transformation, from forest, primary
land 1 ha Land transformation allocated to wood extraction.
Transformation, to forest, intensive,
clear-cutting land 1 ha Land transformation allocated to wood extraction.
Occupation, construction site
land 0 m2a
The occupation for access road and other construction is considered in the process “… at forest road” and
therefore erased here to avoid double counting when the deforestation process will be used together with
processes of wood “… at forest road”.
Materials/fuels Amount Unit Comments
Power sawing, without catalytic converter/RER
0 hr
Power sawing is considered in the process "... at forest road" and therefore erased here to avoid double
counting when the deforestation process will be used together with processes of wood “… at forest road”.
Diesel, burned in building
machine/GLO 0 MJ
Diesel is considered in the process "... at forest road" and therefore erased here to avoid double counting
when the deforestation process will be used together with processes of wood “… at forest road”.
Emissions to air Amount Unit Comments
Carbon dioxide low. pop.
(1.58 * 34’700) + (138’800 *
47%/12*44) = 294’025
kg Emissions related to biomass burning (34’700 kg
biomass / ha) and biomass degradation (138’800 kg biomass / ha with 47% carbon content).
Carbon monoxide, fossil
low. pop.
0.104 * 34’700 = 3609
kg Emission factors given in kg species per kg dry matter
burned is taken from (Andreae and Merlet 2001). Burning of 20% of the biomass.
Methane, fossil low. pop.
0.0068 * 34’700 = 236
kg Emission factors given in kg species per kg dry matter
burned is taken from (Andreae and Merlet 2001). Burning of 20% of the biomass.
Ethene low. pop.
0.00195 * 34’700 = 68
kg Emission factors given in kg species per kg dry matter
burned is taken from (Andreae and Merlet 2001). Burning of 20% of the biomass.
Ethyne low. pop.
4.0E-5 * 34’700 = 1.4
kg Emission factors given in kg species per kg dry matter
burned is taken from (Andreae and Merlet 2001). Burning of 20% of the biomass.
Propene low. pop.
0.00055 * 34’700 = 19
kg Emission factors given in kg species per kg dry matter
burned is taken from (Andreae and Merlet 2001). Burning of 20% of the biomass.
Benzene low. pop.
0.0004 * 34’700 = 14
kg Emission factors given in kg species per kg dry matter
burned is taken from (Andreae and Merlet 2001). Burning of 20% of the biomass.
Toluene low. pop.
0.00025 * 34’700 = 8.7
kg Emission factors given in kg species per kg dry matter
burned is taken from (Andreae and Merlet 2001). Burning of 20% of the biomass.
Quantis© LCA of certified and non-certifiable wood
December 19, 2012 Page 12
Formic acid low. pop.
0.0011 * 34’700 = 38
kg Emission factors given in kg species per kg dry matter
burned is taken from (Andreae and Merlet 2001). Burning of 20% of the biomass.
Acetic acid low. pop.
0.0021 * 34’700 = 73
kg Emission factors given in kg species per kg dry matter
burned is taken from (Andreae and Merlet 2001). Burning of 20% of the biomass.
Formaldehyde low. pop.
0.0014 * 34’700 = 49
kg Emission factors given in kg species per kg dry matter
burned is taken from (Andreae and Merlet 2001). Burning of 20% of the biomass.
Acetaldehyde low. pop.
0.00065 * 34’700 = 23
kg Emission factors given in kg species per kg dry matter
burned is taken from (Andreae and Merlet 2001). Burning of 20% of the biomass.
Methanol low. pop.
0.002 * 34’700 = 69
kg Emission factors given in kg species per kg dry matter
burned is taken from (Andreae and Merlet 2001). Burning of 20% of the biomass.
Phenol low. pop.
6.0E-6 * 34’700 = 0.2
g Emission factors given in kg species per kg dry matter
burned is taken from (Andreae and Merlet 2001). Burning of 20% of the biomass.
Acetone low. pop.
0.00062 * 34’700 = 22
kg Emission factors given in kg species per kg dry matter
burned is taken from (Andreae and Merlet 2001). Burning of 20% of the biomass.
Furan low. pop.
0.0048 * 34’700 = 167
kg Emission factors given in kg species per kg dry matter
burned is taken from (Andreae and Merlet 2001). Burning of 20% of the biomass.
Isoprene low. pop.
1.6E-5 * 34’700 = 0.56
kg Emission factors given in kg species per kg dry matter
burned is taken from (Andreae and Merlet 2001). Burning of 20% of the biomass.
Ammonia low. pop.
0.0013 * 34’700 = 45
kg Emission factors given in kg species per kg dry matter
burned is taken from (Andreae and Merlet 2001). Burning of 20% of the biomass.
Cyanide low. pop.
0.0034 * 34’700 = 118
kg Emission factors given in kg species per kg dry matter
burned is taken from (Andreae and Merlet 2001). Burning of 20% of the biomass.
Nitrogen oxides low. pop.
0.0016 * 34’700 = 56
kg Emission factors given in kg species per kg dry matter
burned is taken from (Andreae and Merlet 2001). Burning of 20% of the biomass.
Acetonitrile low. pop.
0.00018 * 34’700 = 6.2
kg Emission factors given in kg species per kg dry matter
burned is taken from (Andreae and Merlet 2001). Burning of 20% of the biomass.
Particulates, < 2.5 um
low. pop.
0.0091 * 34’700 = 316
kg Emission factors given in kg species per kg dry matter
burned is taken from (Andreae and Merlet 2001). Burning of 20% of the biomass.
Particulates > 2.5 um, and < 10 um
low. pop.
0.0083 * 34’700 = 288
kg Emission factors given in kg species per kg dry matter
burned is taken from (Andreae and Merlet 2001). Burning of 20% of the biomass.
Sulfur dioxide low. pop.
0.00057 * 34’700 = 20
kg Emission factors given in kg species per kg dry matter
burned is taken from (Andreae and Merlet 2001). Burning of 20% of the biomass.
Dinitrogen monoxide low. pop.
0.0002 * 34’700 = 6.9
kg Emission factors given in kg species per kg dry matter
burned is taken from (Andreae and Merlet 2001). Burning of 20% of the biomass.
Ethane low. pop.
0.0012 * 34’700 = 42
kg Emission factors given in kg species per kg dry matter
burned is taken from (Andreae and Merlet 2001). Burning of 20% of the biomass.
Propane low. pop.
0.00015 * 34’700 = 5.2
kg Emission factors given in kg species per kg dry matter
burned is taken from (Andreae and Merlet 2001). Burning of 20% of the biomass.
Terpenes low. pop.
0.00015 * 34’700 = 5.2
kg Emission factors given in kg species per kg dry matter
burned is taken from (Andreae and Merlet 2001). Burning of 20% of the biomass.
Ethanol low. pop.
1.8E-5 * 34’700 = 0.62
kg Emission factors given in kg species per kg dry matter
burned is taken from (Andreae and Merlet 2001). Burning of 20% of the biomass.
Xylene low. pop.
6.0E-5 * 34’700 =2.1
kg Emission factors given in kg species per kg dry matter
burned is taken from (Andreae and Merlet 2001). Burning of 20% of the biomass.
Ethylbenzene low. pop.
2.4E-5 * 34’700 = 0.83
kg Emission factors given in kg species per kg dry matter
burned is taken from (Andreae and Merlet 2001). Burning of 20% of the biomass.
Quantis© LCA of certified and non-certifiable wood
December 19, 2012 Page 13
PAH, polycyclic
aromatic hydrocarbons low. pop.
2.5E-5 * 34’700 = 0.87
kg Emission factors given in kg species per kg dry matter
burned is taken from (Andreae and Merlet 2001). Burning of 20% of the biomass.
Output Amount Unit Comments
Clear-cutting, primary forest for wood production GLO U (Q
1.0) 1 ha
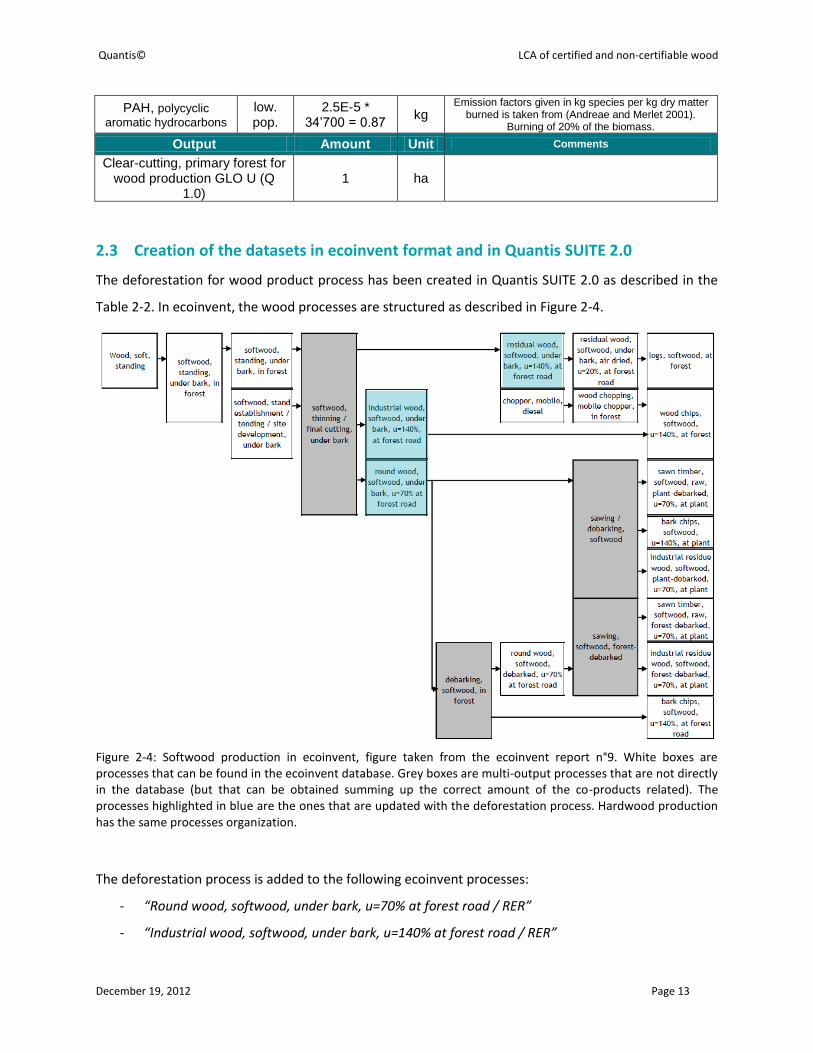
2.3 Creation of the datasets in ecoinvent format and in Quantis SUITE 2.0
The deforestation for wood product process has been created in Quantis SUITE 2.0 as described in the
Table 2-2. In ecoinvent, the wood processes are structured as described in Figure 2-4.
Figure 2-4: Softwood production in ecoinvent, figure taken from the ecoinvent report n°9. White boxes are processes that can be found in the ecoinvent database. Grey boxes are multi-output processes that are not directly in the database (but that can be obtained summing up the correct amount of the co-products related). The processes highlighted in blue are the ones that are updated with the deforestation process. Hardwood production has the same processes organization.
The deforestation process is added to the following ecoinvent processes:
- “Round wood, softwood, under bark, u=70% at forest road / RER”
- “Industrial wood, softwood, under bark, u=140% at forest road / RER”
Quantis© LCA of certified and non-certifiable wood
December 19, 2012 Page 14
- “Residual wood, softwood, under bark, u=140% at forest road / RER”
- “Round wood, hardwood, under bark, u=70% at forest road / RER”
- “Industrial wood, hardwood, under bark, u=80% at forest road /RER”
- “Residual wood, hardwood, under bark, u=80% at forest road / RER”
These processes consider the impacts from motor manual processes for thinning and final cutting and
the transport of the products to the nearest forest road, as well as the impact from the underlying
process “wood, standing, under bark” (being, carbon dioxide uptake, and land transformation). For
round wood, the tree is cut, disbranched with a chainsaw, and pulled out of the forest. Industrial wood
and residual wood (branches and small trees) is harvested with chainsaws and cut into suitable pieces.
Chips are mainly made from industrial wood directly chopped at location, while split wood is made from
residual wood through cutting one meter logs, splitting and piling them.
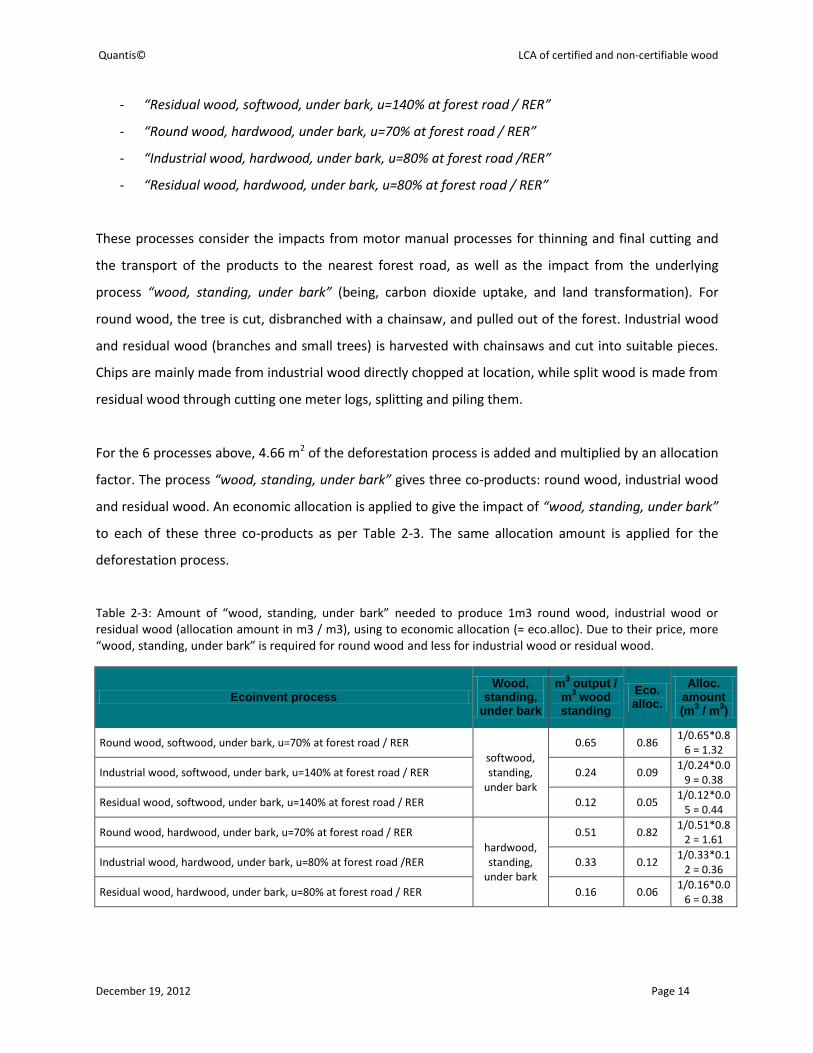
For the 6 processes above, 4.66 m2 of the deforestation process is added and multiplied by an allocation
factor. The process “wood, standing, under bark” gives three co-products: round wood, industrial wood
and residual wood. An economic allocation is applied to give the impact of “wood, standing, under bark”
to each of these three co-products as per Table 2-3. The same allocation amount is applied for the
deforestation process.
Table 2-3: Amount of “wood, standing, under bark” needed to produce 1m3 round wood, industrial wood or residual wood (allocation amount in m3 / m3), using to economic allocation (= eco.alloc). Due to their price, more “wood, standing, under bark” is required for round wood and less for industrial wood or residual wood.
Ecoinvent process Wood,
standing, under bark
m3 output /
m3 wood
standing
Eco. alloc.
Alloc. amount (m
3 / m
3)
Round wood, softwood, under bark, u=70% at forest road / RER
softwood, standing,
under bark
0.65 0.86 1/0.65*0.8
6 = 1.32
Industrial wood, softwood, under bark, u=140% at forest road / RER 0.24 0.09 1/0.24*0.0
9 = 0.38
Residual wood, softwood, under bark, u=140% at forest road / RER 0.12 0.05 1/0.12*0.0
5 = 0.44
Round wood, hardwood, under bark, u=70% at forest road / RER
hardwood, standing,
under bark
0.51 0.82 1/0.51*0.8
2 = 1.61
Industrial wood, hardwood, under bark, u=80% at forest road /RER 0.33 0.12 1/0.33*0.1
2 = 0.36
Residual wood, hardwood, under bark, u=80% at forest road / RER 0.16 0.06 1/0.16*0.0
6 = 0.38
Quantis© LCA of certified and non-certifiable wood
December 19, 2012 Page 15
As the deforestation process and the underlying process “wood, standing, under bark” contain both land
transformation, a correction is made to avoid double counting. The deforestation process contains the
following transformation flows “transformation, from forest, primary” and “transformation, to forest,
intensive, clear-cutting” (see Table 2-2). The objective is avoid double counting with the transformation
processes from the original wood process “wood, standing, under bark”, which are “transformation,
from forest, extensive” and “transformation, to forest, intensive”. Double counting is avoided by
subtracting the two land transformations of the original wood process from the 6 processes above using
the same amount as added deforestation (i.e., 4.66 m2 multiplied by the allocation amount).
The processes ending with “RER” correspond to a European location. These are recalled into “GLO”, for
a global location, as non-certified wood is generally from unknown location. Furthermore, the new
datasets created have the addition of “non-certifiable”:
- “Round wood, softwood, non-certified, under bark, u=70% at forest road / GLO”
- “Industrial wood, softwood, non-certified, under bark, u=140% at forest road / GLO”
- “Residual wood, softwood, non-certified, under bark, u=140% at forest road / GLO”
- “Round wood, hardwood, non-certified, under bark, u=70% at forest road / GLO”
- “Industrial wood, hardwood, non-certified, under bark, u=80% at forest road /GLO”
- “Residual wood, hardwood, non-certified, under bark, u=80% at forest road / GLO”
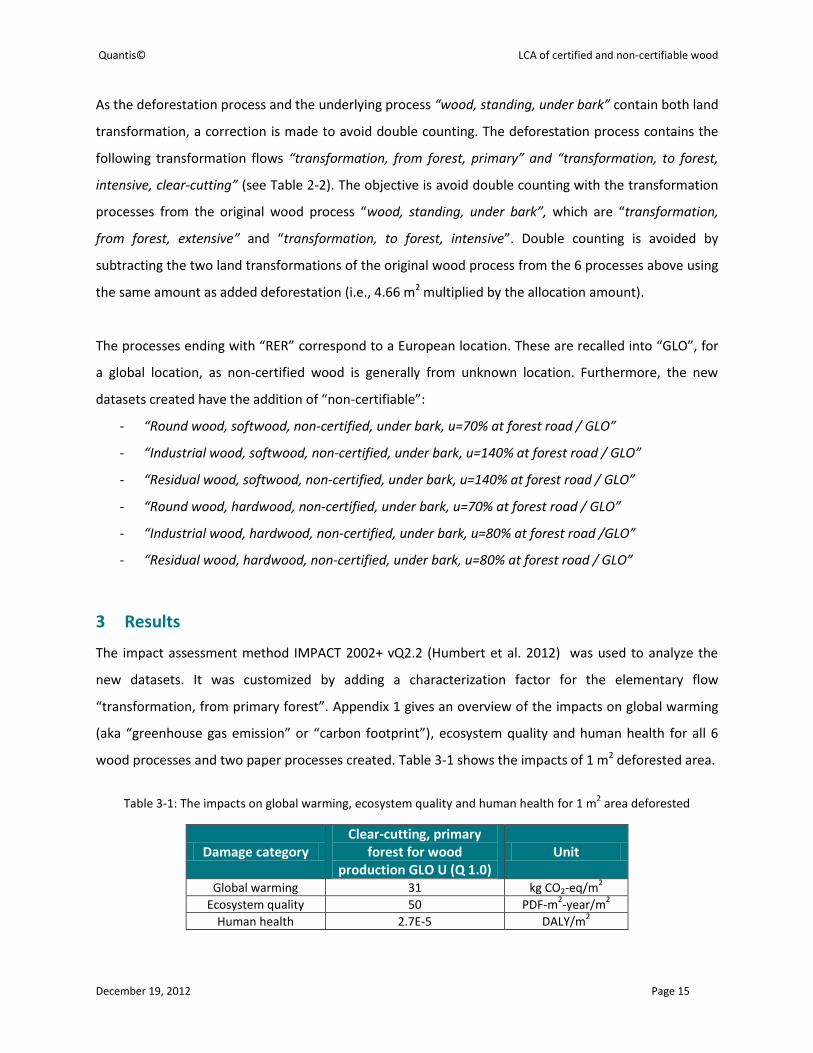
3 Results
The impact assessment method IMPACT 2002+ vQ2.2 (Humbert et al. 2012) was used to analyze the
new datasets. It was customized by adding a characterization factor for the elementary flow
“transformation, from primary forest”. Appendix 1 gives an overview of the impacts on global warming
(aka “greenhouse gas emission” or “carbon footprint”), ecosystem quality and human health for all 6
wood processes and two paper processes created. Table 3-1 shows the impacts of 1 m2 deforested area.
Table 3-1: The impacts on global warming, ecosystem quality and human health for 1 m2 area deforested
Damage category Clear-cutting, primary
forest for wood production GLO U (Q 1.0)
Unit
Global warming 31 kg CO2-eq/m2
Ecosystem quality 50 PDF-m2-year/m
2
Human health 2.7E-5 DALY/m2
Quantis© LCA of certified and non-certifiable wood
December 19, 2012 Page 16
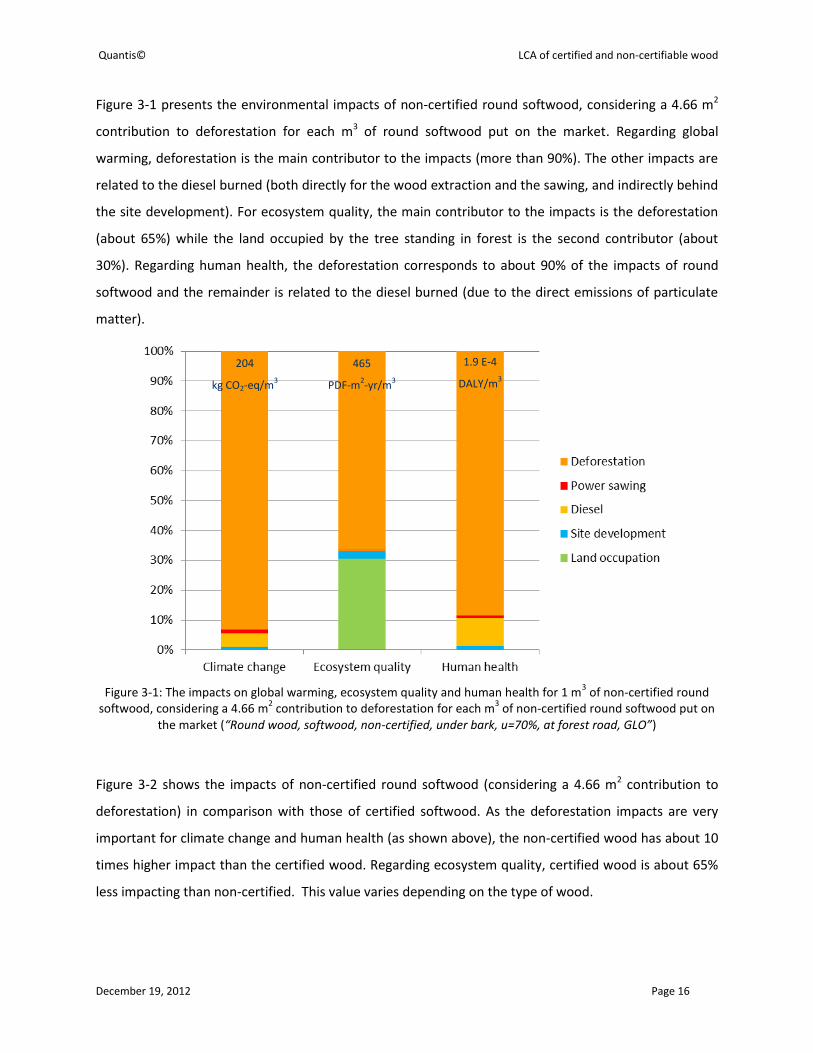
Figure 3-1 presents the environmental impacts of non-certified round softwood, considering a 4.66 m2
contribution to deforestation for each m3 of round softwood put on the market. Regarding global
warming, deforestation is the main contributor to the impacts (more than 90%). The other impacts are
related to the diesel burned (both directly for the wood extraction and the sawing, and indirectly behind
the site development). For ecosystem quality, the main contributor to the impacts is the deforestation
(about 65%) while the land occupied by the tree standing in forest is the second contributor (about
30%). Regarding human health, the deforestation corresponds to about 90% of the impacts of round
softwood and the remainder is related to the diesel burned (due to the direct emissions of particulate
matter).
Figure 3-1: The impacts on global warming, ecosystem quality and human health for 1 m
3 of non-certified round
softwood, considering a 4.66 m2 contribution to deforestation for each m
3 of non-certified round softwood put on
the market (“Round wood, softwood, non-certified, under bark, u=70%, at forest road, GLO”)
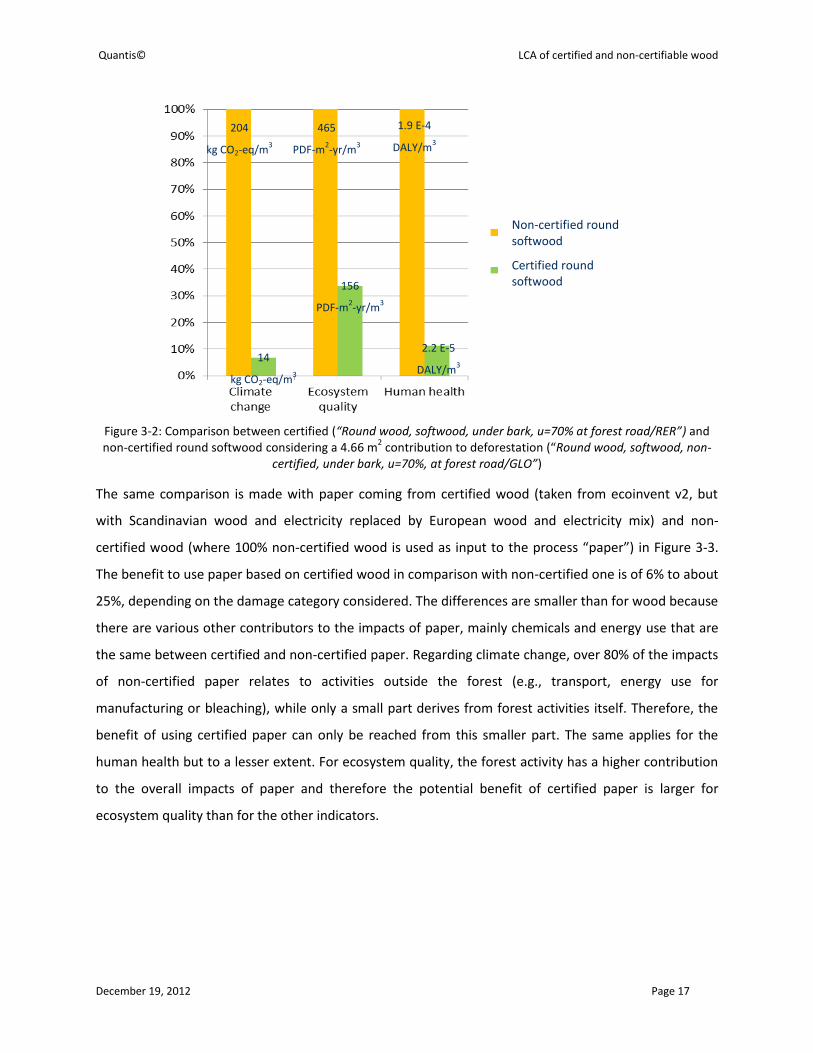
Figure 3-2 shows the impacts of non-certified round softwood (considering a 4.66 m2 contribution to
deforestation) in comparison with those of certified softwood. As the deforestation impacts are very
important for climate change and human health (as shown above), the non-certified wood has about 10
times higher impact than the certified wood. Regarding ecosystem quality, certified wood is about 65%
less impacting than non-certified. This value varies depending on the type of wood.
204
kg CO2-eq/m3
465
PDF-m2-yr/m
3
1.9 E-4
DALY/m3
Quantis© LCA of certified and non-certifiable wood
December 19, 2012 Page 17
Figure 3-2: Comparison between certified (“Round wood, softwood, under bark, u=70% at forest road/RER”) and non-certified round softwood considering a 4.66 m
2 contribution to deforestation (“Round wood, softwood, non-
certified, under bark, u=70%, at forest road/GLO”)
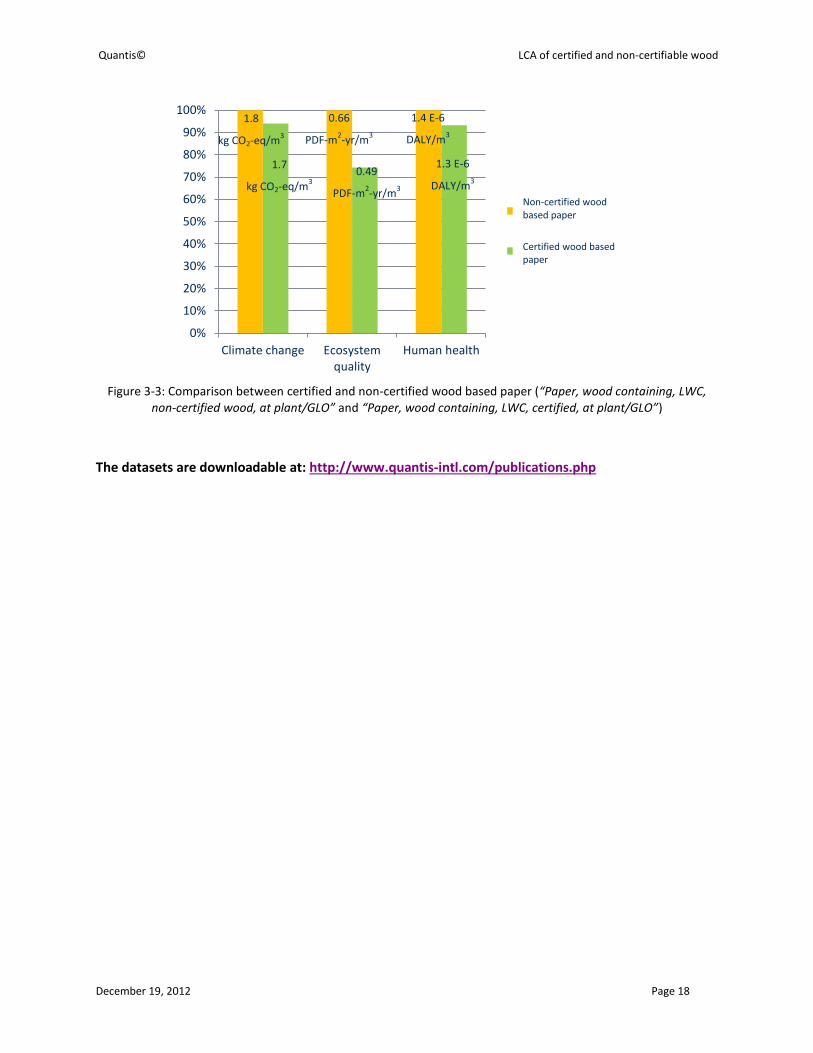
The same comparison is made with paper coming from certified wood (taken from ecoinvent v2, but
with Scandinavian wood and electricity replaced by European wood and electricity mix) and non-
certified wood (where 100% non-certified wood is used as input to the process “paper”) in Figure 3-3.
The benefit to use paper based on certified wood in comparison with non-certified one is of 6% to about
25%, depending on the damage category considered. The differences are smaller than for wood because
there are various other contributors to the impacts of paper, mainly chemicals and energy use that are
the same between certified and non-certified paper. Regarding climate change, over 80% of the impacts
of non-certified paper relates to activities outside the forest (e.g., transport, energy use for
manufacturing or bleaching), while only a small part derives from forest activities itself. Therefore, the
benefit of using certified paper can only be reached from this smaller part. The same applies for the
human health but to a lesser extent. For ecosystem quality, the forest activity has a higher contribution
to the overall impacts of paper and therefore the potential benefit of certified paper is larger for
ecosystem quality than for the other indicators.
204
kg CO2-eq/m3
465
PDF-m2-yr/m
3
1.9 E-4
DALY/m3
14
kg CO2-eq/m3
156
PDF-m2-yr/m
3
2.2 E-5
DALY/m3
Non-certified round softwood
Certified round softwood
Quantis© LCA of certified and non-certifiable wood
December 19, 2012 Page 18
Figure 3-3: Comparison between certified and non-certified wood based paper (“Paper, wood containing, LWC,
non-certified wood, at plant/GLO” and “Paper, wood containing, LWC, certified, at plant/GLO”)
The datasets are downloadable at: http://www.quantis-intl.com/publications.php
0%
10%
20%
30%
40%
50%
60%
70%
80%
90%
100%
Climate change Ecosystemquality
Human health
Non-certifiable woodbased paper
Certified wood basedpaper
1.8
kg CO2-eq/m3
0.66
PDF-m2-yr/m
3
1.4 E-6
DALY/m3
1.7
kg CO2-eq/m3
0.49
PDF-m2-yr/m
3
1.3 E-6
DALY/m3
Non-certified wood based paper
Certified wood based paper
Quantis© LCA of certified and non-certifiable wood
December 19, 2012 Page 19
4 References
ABNT, (2004) Brazilian standard: Forest Management - Principles, criteria, and indicators for native forests. The
Brazilian Organization for Standardization.
Ecoinvent Centre, (2010) ecoinvent database v 2.2.
Ecoinvent Centre, (2012) ecoinvent database v3.
FAO, (2010) Global forest resources assessment, Key findings. www.fao.org/forestry/fra2010, downloaded in
September 2012.
FAO, (2011) State of the World's forests. Rome. www.fao.org/docrep/013/i2000e/i2000e.pdf , downloaded in
September 2012.
Houghton, R.A., et al., (2000) Annual fuxes of carbon from deforestation and regrowth in the Brazilian Amazon.
Nature. 403: p. 301-304.
Humbert, S., De Schryver, A.M., Margni, M., Jolliet, O., (2012) IMPACT 2002+: User Guide. Draft for version Q2.2
(version adapted by Quantis). Quantis, Lausanne, Switzerland.
MC&I, (2002) Malaysian Criteria and indicators for Forest Management Certification.
Mongabay website: http://rainforests.mongabay.com/deforestation_drivers.html. vistited in September 2012
Noriko Hosonuma et al.(2012) An assessment of deforestation and forest degradation drivers in developing
countries Environ. Res. Lett. 7.
PEFC ST (1003:2010) PEFC INTERNATIONAL STANDARD: Requirements for certification schemes. Program of
endorsement of forest certification.
RNСFC, (2006) FOREST MANAGEMENT STANDARD. Russian National Council for Forest Certification.
Seneka Creek Associate, (2004) "Illegal" logging and global wood markets: the competitive impacts on the US wood
products industry. Downloaded on www.illegal-logging.info/uploads/afandpa.pdf in September 2012.
Taverna, R., Hofer, P., Werner, F., Kaufmann, E., Thürig, E., (2007) The CO2 effects of the Swiss forestry and timber
industry Scenarios of future potential for climate-change mitigation, Environmental studies no. 0739. Federal
Office for the Environment, Bern, Switzerland, p. 102.
UNECE-FAO, (2012) Forest products, annual market review 2011-2012. United Nations new York and Geneva.
www.unece.org/fileadmin/DAM/timber/publications/FPAMR_2012.pdf, downloaded in September 2012.
Quantis© LCA of certified and non-certifiable wood
December 19, 2012 Page 20
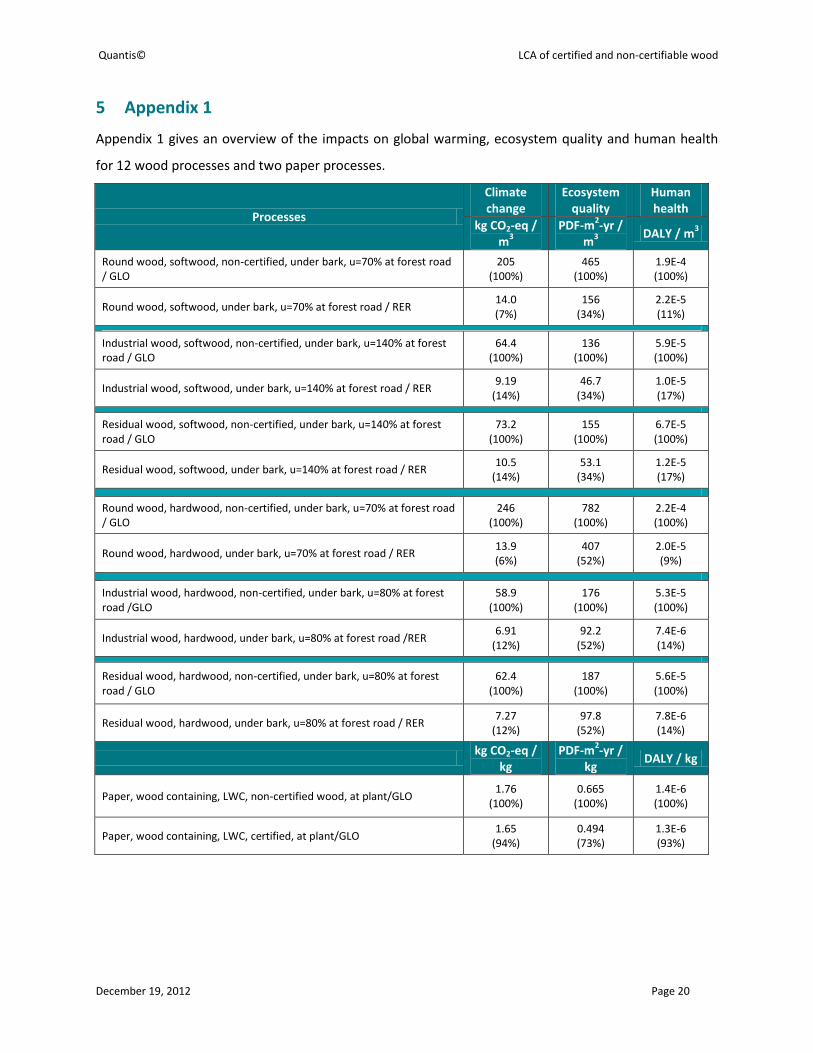
5 Appendix 1
Appendix 1 gives an overview of the impacts on global warming, ecosystem quality and human health
for 12 wood processes and two paper processes.
Processes
Climate change
Ecosystem quality
Human health
kg CO2-eq / m
3
PDF-m2-yr /
m3
DALY / m3
Round wood, softwood, non-certified, under bark, u=70% at forest road / GLO
205 (100%)
465 (100%)
1.9E-4 (100%)
Round wood, softwood, under bark, u=70% at forest road / RER 14.0 (7%)
156 (34%)
2.2E-5 (11%)
Industrial wood, softwood, non-certified, under bark, u=140% at forest road / GLO
64.4 (100%)
136 (100%)
5.9E-5 (100%)
Industrial wood, softwood, under bark, u=140% at forest road / RER 9.19
(14%) 46.7
(34%) 1.0E-5 (17%)
Residual wood, softwood, non-certified, under bark, u=140% at forest road / GLO
73.2 (100%)
155 (100%)
6.7E-5 (100%)
Residual wood, softwood, under bark, u=140% at forest road / RER 10.5
(14%) 53.1
(34%) 1.2E-5 (17%)
Round wood, hardwood, non-certified, under bark, u=70% at forest road / GLO
246 (100%)
782 (100%)
2.2E-4 (100%)
Round wood, hardwood, under bark, u=70% at forest road / RER 13.9 (6%)
407 (52%)
2.0E-5 (9%)
Industrial wood, hardwood, non-certified, under bark, u=80% at forest road /GLO
58.9 (100%)
176 (100%)
5.3E-5 (100%)
Industrial wood, hardwood, under bark, u=80% at forest road /RER 6.91
(12%) 92.2
(52%) 7.4E-6 (14%)
Residual wood, hardwood, non-certified, under bark, u=80% at forest road / GLO
62.4 (100%)
187 (100%)
5.6E-5 (100%)
Residual wood, hardwood, under bark, u=80% at forest road / RER 7.27
(12%) 97.8
(52%) 7.8E-6 (14%)
kg CO2-eq /
kg
PDF-m2-yr /
kg DALY / kg
Paper, wood containing, LWC, non-certified wood, at plant/GLO 1.76
(100%) 0.665
(100%) 1.4E-6 (100%)
Paper, wood containing, LWC, certified, at plant/GLO 1.65
(94%) 0.494 (73%)
1.3E-6 (93%)