Comparative Life-Cycle Assessment of Bottled vs. Tap Water ...
117
Comparative Life-Cycle Assessment of Bottled vs. Tap Water Systems Christopher G. Dettore Report No. CSS09-11 December 14, 2009
Transcript of Comparative Life-Cycle Assessment of Bottled vs. Tap Water ...

Comparative Life-Cycle Assessment of Bottled vs. Tap Water Systems
Christopher G. Dettore
Report No. CSS09-11
December 14, 2009
Comparative Life-Cycle Assessment of Bottled vs. Tap Water Systems
By:
Christopher G. Dettore
A project submitted in partial fulfillment of requirements for the degree of Master of Science
(Natural Resources and Environment)
University of Michigan Ann Arbor
December, 14, 2009
A report of the Center for Sustainable Systems Report No. CSS09-11
Faculty Advisors: Professor Gregory A. Keoleian Professor Jonathan W. Bulkley

Document Description
COMPARATIVE LIFE-CYCLE ASSESSMENT OF BOTTLED VS. TAP WATER SYSTEMS Christopher G. Dettore Center for Sustainable Systems, Report No. CSS09-11 University of Michigan, Ann Arbor, Michigan December 14, 2009 110 pp., 3 tables, 23 figures, 10 appendices This document is available online at: http://css.snre.umich.edu
Center for Sustainable Systems School of Natural Resources and Environment University of Michigan 440 Church Street, Dana Building Ann Arbor, MI 48109-1041 Phone: 734-764-1412 Fax: 734-647-5841 Email: [email protected] Web: http://css.snre.umich.edu
© Copyright 2009 by the Regents of the University of Michigan

Acknowledgements
I would like to express my sincere gratitude to my thesis co-chairs, Professor Gregory Keoleian
and Professor Jonathan Bulkley for their support and guidance throughout the course of this
research. The completion of this would not have been possible without their feedback. I would
also like to thank Helaine Hunscher for her patience and support on various aspects of this
project.
This project would not have been possible without the generous funding support provided by the
ALCOA Foundation Conservation and Sustainability Fellowship Program as well as the Oregon
Department of Environmental Quality. Also, collaboration with Franklin Associates, Ltd. has
been vital to moving the research forward during various stages.
I would also like to thank Chris McCormack of Norland International for providing data relevant
to the bottled water industry, as well as Linda Reekie of the American Water Works Association
Research Foundation, for providing data pertaining to municipal water and wastewater treatment
in the United States.

Contents Contents……………………………………………………………………………………….………….....i List of Tables………………………………………………………………………………………………iii List of Figures……………………………………………………………………………………………...iii Abstract……………………………………………………………………………………………………..1
Chapter 1 Introduction………….……...……………………………………………………………2 1.1 Background……...………………………………………………………………..2
1.2 Rationale……...…………………………………………………………………..3 1.3 Thesis Statement………...………………………………………………………..5 1.4 Literature Review…………………..………………………………………….....5 1.5 Overview of Life-Cycle Assessment……………...……………………………...6
1.5.1 Goal and Scope Definition………...……………………………………..7 1.5.2 Life-Cycle Inventory………..…………………………………………...7 1.5.3 Impact Assessment…………………...……………………………...…..7 1.5.4 Interpretation……..………………………………………………………6
1.6 Scope of Study……………………………………………………………………6 1.6.1 Function and Functional Unit……………………………………………6 1.6.2 Model Overview and System Boundaries……………………………….6 1.6.3 Data Categories…………………………………………………………10 1.6.3.1 Energy Resources……………………………………………...10 1.6.3.2 Greenhouse Gas Emissions……………………………………10 1.6.3.3 Solid Waste…………………………………………………….10 1.6.3.4 Water Use……………………………………………………...10
Chapter 2 Single-Use Bottled Water…………………………………….………………………...11 2.1 System Description……………………………………………………………...11 2.1.1 Life-Cycle Processes…………………………………………………...12 2.2 System Variants for Analysis…………………………………………………...13 2.3 Results…………………………………………………………………………...16 2.3.1 Life-Cycle Energy……………………………………………………...18 2.3.2 Life-Cycle Solid Waste…………………………………………………20 2.3.3 Life-Cycle Greenhouse Gases (GHG’s)………………………………..23 2.3.4 Life-Cycle Water Use…………………………………………………..25 2.4 Discussion……………………………………………………………………….27 Chapter 3 Home and Office Delivery (HOD) Bottled Water……..……………………………...29 3.1 System Description……………………………………………………………...29 3.1.1 Life-Cycle Processes…………………………………………………...30 3.2 System Variants for Analysis…………………………………………………...32 3.3 Results…………………………………………………………………………...34 3.3.1 Life-Cycle Energy……………………………………………………...36 3.3.2 Life-Cycle Solid Waste…………………………………………………38 3.3.3 Life-Cycle Greenhouse Gases (GHG’s)………………………………..40 3.3.4 Life-Cycle Water Use…………………………………………………..41 3.4 Discussion……………………………………………………………………….43

ii
Chapter 4 Municipal Tap Water……….……………………………….………………………....45 4.1 System Description……………………………………………………………...45 4.1.1 Life-Cycle Processes…………………………………………………...46 4.2 System Variants for Analysis…………………………………………………...47 4.3 Results…………………………………………………………………………...48 4.3.1 Life-Cycle Energy……………………………………………………...49 4.3.2 Life-Cycle Solid Waste…………………………………………………51 4.3.3 Life-Cycle Greenhouse Gases (GHG’s)………………………………..51 4.3.4 Life-Cycle Water Use…………………………………………………..52 4.4 Discussion……………………………………………………………………….54 Chapter 5 Comparison of Systems…...………………………………….………………………...55 2.1 Life-Cycle Energy Use……………..…………………………………………...55 2.2 Life-Cycle Solid Waste……………………………….........................................56 2.3 Life-Cycle Greenhouse Gas Emissions………….……………………………...57 2.4 Life-Cycle Water Use………..………………………………………………….58 Chapter 6 Conclusions…...………………………………….……………………………………...60 6.1 Key Findings and Recommendations for Improvement………………………...60 6.2 Context of Work……..……………………………….........................................62 6.3 Implications…………………………..………….……………………………...63 6.4 Future Work………...………..………………………………………………….66 Bibliography……………………………………………………………………………………………...68 Appendix A Material Composition of Systems……………………………………………………...70
Appendix B Production of Containers and Packaging……...……………………………………...72
Appendix C Life-Cycle Water Use…………………………………………………………………...80
Appendix D Municipal Water and Wastewater Treatment…...…………………………………...85
Appendix E Water Bottling Operations………...…………………………………………………...91
Appendix F Residential Dishwashing…………...…………………………………………………...96
Appendix G Transportation……………………..…………………………………………………...98
Appendix H End of Life Disposition………………………………………………………………..102
Appendix I Sensitivity Analysis………………..…………………………………………………..104
Appendix J Glossary……………………………………………………..........................................109

iii
List of Tables
Table 2.1 Single-use Bottled water Systems Combined Results by Variant……………………….17
Table 3.1 HOD Systems Combined Results by Variant……………………………………………35
Table 4.1 Municipal Tap Systems Combined Results by Variant………………………………….49
List of Figures
Figure 2.1 Overview of Single-Use Bottled Water Life-Cycle System Model………………...…....11
Figure 2.2 Single-Use Bottled Water System Variants for Analysis……………………..................14
Figure 2.3 Single-Use Bottled Water Life-Cycle Energy by Variant……………………………….18
Figure 2.4 Single-Use Bottled Water Life-Cycle Solid Waste by Variant………………………….21
Figure 2.5 Single-Use Bottled Water Life-Cycle GHG’s by Variant……………………………….23
Figure 2.6 Single-Use Bottled Water Life-Cycle Water Use by Variant………...………………….26
Figure 3.1 Overview of HOD Bottled Water Life-Cycle System Model……………........................29
Figure 3.2 HOD Bottled Water System Variants for Analysis………….………………..................33
Figure 3.3 HOD Bottled Water Life-Cycle Energy by Variant……………….…………………….36
Figure 3.4 HOD Bottled Water Life-Cycle Solid Waste by Variant………………..……………….38
Figure 3.5 HOD Bottled Water Life-Cycle GHG’s by Variant………………………….………….40
Figure 3.6 HOD Bottled Water Life-Cycle Water Use by Variant………...…………….………….42
Figure 4.1 Municipal Tap Water Life-Cycle System Model………………………………………...45
Figure 4.2 Municipal Tap Water System Variants for Analysis…………………….........................47
Figure 4.3 Municipal Tap Water Life-Cycle Energy by Variant………………………...………….50
Figure 4.4 Municipal Tap Water Life-Cycle Solid Waste by Variant……………………………....51
Figure 4.5 Municipal Tap Water Life-Cycle GHG’s by Variant………………………………...….52
Figure 4.6 Municipal Tap Water Life-Cycle Water Use by Variant………...…………...………….53
Figure 5.1 Parameters of System Variants…………………………………………………………..55
Figure 5.2 Combined Life-Cycle Energy……………………………………………………………55
Figure 5.3 Combined Life-Cycle Solid Waste………………………………………………………56
Figure 5.4 Combined Life-Cycle GHG’s……………………………………………………………57
Figure 5.5 Combined Life-Cycle Water Use………………………………………………...............58

1
Abstract
This study uses life-cycle assessment (LCA) methodology to quantify life-cycle energy use, greenhouse
gas emissions, solid waste generation and water use for delivering drinking water to consumer households
in the United States. Three systems were considered in this analysis: 1) single-use disposable bottled
water (500ml) sold in 24-packs, 2) Home and office delivery bottled water, 3) municipal tap water. For
both the HOD and municipal tap systems, drinking water is served in a reusable drinking vessel (bottle or
cup) that is periodically washed in a residential dishwasher. Variants of each system were constructed to
represent a range of possible real-world scenarios using factors such as bottle type (virgin PET, rPET),
water type (natural source, municipal source), distribution (regional, national, overseas), end-of-life
treatment (landfill disposal, recycling), type of reusable drinking vessel (steel bottle, glass cup) and
frequency of washing the reusable vessel.
With respect to life-cycle energy, solid waste, greenhouse gas emission and water use, the municipal tap
systems outperform both HOD and single-use bottled systems. Single-use bottled systems consume 11-31
times more energy than tap systems. Production of plastic bottles is responsible for over 70% of the
energy use of regional bottled systems, while with national and overseas distribution, transportation
begins to dominate. Tap and HOD system energy use is dominated by residential washing of the reusable
drinking vessel. Greenhouse gas emissions generally correlate with energy use. HOD systems consume
8-18% of energy relative to single-use systems, while municipal tap systems use 35-55% of HOD life-
cycle energy. For solid waste, single-use systems perform the worst, followed by the HOD and municipal
tap systems respectively. End-of-life treatment of bottles dictates single-use systems solid waste profile.
From an environmental perspective, municipal tap water is the preferred drinking water system.
Strategies to reduce the impact of bottled water may include bans at the organizational level (city
governments, universities, and restaurants), education and outreach to encourage consumers to choose tap
water and the expansion of state bottle bills to improve recovery of empty bottles. Results of this study
can be used to inform consumers and legislators of the impacts of their choices with regard to drinking
water.

2
Chapter 1
Introduction
1.1 Background
Water is essential for life. Human survival is dependent upon drinking water. In fact, estimates indicate
that on average 60% of the human body is composed of water. Maintaining adequate hydration is
necessary for proper functioning of nearly every bodily system (Mayo Clinic). This includes the removal
of toxins, regulation of body temperature, transport of nutrients and oxygen to cells, lubrication of joints
and protection of organs and tissues. Daily activities deplete a human body’s water reserves through
breathing, perspiration and the excretion of waste. Dehydration leads to decreased human functioning
often marked by headache and fatigue, though the health effects of prolonged dehydration can be much
more severe including kidney failure and in extreme cases death. To avoid dehydration, we must
replenish our water resources through the intake of food and fluids. Typically, 20% of one’s daily water
requirements are met through the consumption of food. The intake of fluids is necessary to make up the
remaining 80%. As such, the provision of drinking water is of the utmost importance to society.
Currently, the source of one’s drinking water is a topic of much debate. Until recently, drinking water
was primarily delivered by way of municipal distribution networks terminating in a household tap. With
the explosion of the bottled water industry in the 1990’s, however, consumers no longer have to rely on
the municipal tap system to deliver their drinking water. Consequently, since 2003 more bottled water has
been consumed by Americans than any other beverage category excepting carbonated soft drinks. In
2007, this translated to over 29 gallons per person (Rodwan, 2008).
Much speculation has surrounded the tradeoffs involved in choosing between bottled and tap water. In a
time of growing awareness of environmental issues including fossil resource depletion, emissions of
greenhouse gases and rapidly filling landfills, there is a need to ensure that the systems we rely on to
deliver basic needs, including the provision of drinking water, do so in an efficient manner and without
undue toll on the environment. Faced with a choice between utilizing municipal tap systems or bottled
water systems, an assessment of the environmental burdens of each serves to provide legislators and
consumers with the information necessary to make informed decisions.

3
1.2 Rationale
The systems in place for delivering drinking water have considerable impact with regard to use of
resources and release of pollution. In terms of energy resources, these systems are very intensive.
Centralized water treatment and distribution systems consume more than 26 quads (quadrillion BTU) of
commercial energy globally, or roughly 7% of total consumption (James, Campbell, Godlove, 2002).
These systems require considerable amounts of energy to collect water from surface and groundwater
supplies, treat the influent to EPA mandated safety standards with both mechanical and chemical
processes, and ultimately distribute to end users in households and businesses.
Bottled water has recently emerged as an alternative method of delivering drinking water. Convenient
packaging and widespread availability have facilitated bottled water’s emergence as a dominant beverage
category, with sales second only to carbonated soft drinks as of 2003 (Rodwan, 2008). As a system for
delivering drinking water, bottled water also consumes considerable amounts of energy. The packages
themselves, mostly bottles made of PET (polyethylene terephthalate) in various sizes, are derived from
petroleum resources. The processes required for material production as well as container fabrication are
energy intensive, while a finished bottle holds considerable embodied energy in its chemical bonds. In
fact, the Pacific Institute estimates that in 2006, the equivalent of 17 million barrels of oil were consumed
to produce the bottles used for American consumption of bottled water. Additional energy is consumed
in the treatment of the water (varies by water source and method), the filling of containers in a bottling
plant and the transportation of the filled bottled to retail outlets and ultimately homes and businesses. All
told, the total amount of energy required to deliver a bottle of water to a consumer, depending on a variety
of factors, can be as high as the equivalent of filling the bottle ¼ full with oil (Pacific Institute, 2007).
Further, after a single use, most empty bottles enter the waste stream. While well developed systems for
recycling PET bottles exists in the U.S., recycling rates have been falling for a decade, and in 2006 only
23% of PET bottles sold were recycled (NAPCOR, 2007). The remaining bottles end up in a landfill,
amounting to roughly 4 billion pounds of bottles per year (Kchao, 2008). In addition, estimates state that
bottling water was responsible for more than 2.5 million tons of the greenhouse gas (GHG) CO2 in 2006
(Pacific Institute, 2007).
A recent increase in public awareness of the impacts of bottling water coupled with growing concern for
the environment has elevated bottled water to the stage of public debate. The consumption of fossil
resources required for manufacturing and transporting bottled water as well as the solid waste and
emissions left in the wake has led to a backlash against bottled water. Articles drawing into question the

4
growing consumption of bottled water and highlighting its impacts have appeared worldwide in reputable
periodicals including the Wall Street Journal, New York Times, Los Angeles Times, Times (London) and
the Daily Telegraph. Further, a critical mass of U.S. Mayors banning or restricting the purchase of bottled
water with city funds (Los Angeles followed by San Francisco, Salt Lake City, Chicago, Seattle and most
recently Toronto) led to the signing of Mayoral Resolution No. 90 in June 2007 at the annual meeting of
the Conference of Mayors. The resolution entitled “The Importance of Municipal Water” directed an
effort to compile information on the importance of municipal water and the impact of bottled water on the
municipal solid waste stream (Kchao, 2008). Aside from concerns regarding bottled water’s impact on
municipal waste streams, underlying this resolution is the notion that a major societal shift to bottled
water could serve to undermine funding in municipal tap systems and potentially lead to equity issues for
the poor.
The backlash against bottled water made its way into the restaurant world, with an increasing number of
high-end restaurants in major cities such as San Francisco and New York no longer serving bottled water,
opting instead to serve customers filtered municipal water in carafes (Burros, 2007). More recently, this
trend has begun to spread to universities. Washington University in St. Louis banned the sale of bottled
water on its campus in January 2009, and claims to be the first university to do so (Woznica, 2009). Their
actions have not gone unnoticed as other universities have begun to move towards bans including the
University of Pennsylvania, Brandeis University and Ohio Wesleyan. Further abroad, students at Leeds
University in the United Kingdom recently voted to ban bottled water sales on campus in December 2008,
a move covered extensively by the British newspaper, the Guardian, who expects many other U.K.
schools to follow suit.
Clearly, the topic of bottled water is a divisive one. While sales appear to be down in 2008 (Girard,
2009), the industry is well established and will likely see continued strong sales in the near term.
Worldwide, the demand for drinking water will continue to rise with steadily growing population
numbers. Priority should be given to meeting this demand with a wise and efficient use of resources. It is
imperative, particularly today as we face threats from a changing global climate and shrinking stocks of
energy resources, to evaluate systems for delivering drinking water in terms of energy resource
consumption, environmental emissions and overall efficiency.
5
1.3 Thesis Statement
This study compares several contemporary systems for the delivery of drinking water to United States
consumers, specifically municipal tap systems and bottled water systems. The analyses will use Life-
Cycle Assessment (LCA) methodology to quantify burdens associated with the respective systems from a
life-cycle perspective. The framework for the assessment will be based on parameters specific to the
United States; the results, however, can be replicated using alternative parameters to derive broader
implications.
While previous studies have addressed the impacts of drinking water delivery systems, these have been
based entirely on conditions specific to Switzerland (energy, transportation systems etc.) (Jungbluth,
2006) or have failed to develop a comprehensive life-cycle energy estimate (Gleick, Cooley, 2008). This
study seeks to provide new insight by using systems specific to the U.S., including energy systems,
transportation and municipal water and wastewater treatment. Further, to most accurately represent the
life-cycle of a municipal tap water system, the life-cycle of a reusable vessel (bottle, cup) from which the
water may be consumed, and the periodic washing of this vessel are modeled. Previous studies have not
considered these two factors.
1.4 Literature Review
Few studies have been done comparing the environmental impact of systems for delivering drinking
water. Jungbluth (2006) compared tap and bottled water variants in Switzerland using life-cycle
approaches. The study found tap water results in less than 1% of the environmental impact of
unrefrigerated bottled water. Further, while refrigerating and carbonating tap water increases the life-
cycle impacts, doing so still only results in impacts 25% of those of bottled water. Jungbluth also reported
that the origin of the water is more important than packaging, and that returnable bottles/jugs are only a
reasonable alternative if the distance from the bottling facility to the consumer is relatively short.
Van Hoof, et al. (2002), found substantially lower energy, solid waste and emissions resulting from
consumption of tap water compared to bottled water. Filtered tap water shows impacts greater than those
of unfiltered tap, but still outperforms bottled water.
Most recently, Gleick and Cooley (2008) quantified key energy inputs in bottled water required from
production of bottles to point of use. They, however, did not use a comprehensive life-cycle model, citing
variation in key processes, but rather calculated ranges in energy use. They found that for water

6
transported short distances energy requirements are dominated by energy used to produce the bottles.
Long-distance transport, however can lead to energy costs comparable to or even larger than those for
producing the bottle.
Several studies have been conducted examining the environmental impacts of packaging systems.
Keoleian, McDaniel and Spitzley (1997) evaluated nine packaging systems with respect to environmental
performance, including LLDPE (linear low-density polyethylene) flexible pouches, paperboard gable top
cartons, single-use and refillable glass bottles, single-use and refillable HDPE (high-density polyethylene)
bottles, PC (polycarbonate) refillable bottles, steel cans and composite cans. They identified material
production energy as the key factor influencing life-cycle energy and post-consumer waste contributing
the majority of life-cycle solid waste.
Franklin Associates, a leading LCA consulting firm, has conducted numerous life-cycle based packaging
studies. These include recently completed plastic packaging LCI studies for coffee and milk containers.
The milk container study examined four half-gallon milk containers: a glass bottle, a PLA bottle, a HDPE
bottle and a gable top paperboard carton. The study quantified energy use, solid waste generation and
water and airborne emissions, and highlighted the tradeoffs and complexities of choosing the different
packaging options (2008).
1.5 Overview of Life-Cycle Assessment
LCA is an environmental management tool used to describe and quantify the environmental burdens
associated with a product or system throughout its entire life cycle (cradle-to-grave). The phases of a full
product life-cycle include extraction of raw materials, material production, manufacturing, distribution,
use and end-of-life. LCA involves the quantification of all energy and material inputs throughout each
life-cycle phase as well as the resultant outputs (e.g. emissions, solid wastes). Further, potential
environmental impacts associated with identified inputs and releases are assessed. LCA is often used to
compare products or systems with the goal of determining the least burdensome option.
The procedures of an LCA are defined by the International Organization for Standardization (ISO) under
the ISO 14000 environmental management standards. ISO 14040 concerns the principles and framework
of LCA, while ISO 14044 establishes the requirements and guidelines for completing an ISO compliant
LCA.

7
The ISO framework defines four required phases for an LCA. These include 1) Goal and Scope
Definition, 2) Life Cycle Inventory (LCI), 3) Life Cycle Impact Assessment (LCIA) and 4) Interpretation.
1.5.1 Goal and Scope Definition
In the first step of an LCA, the goal and scope definition, the LCA practitioner defines the purpose of the
study including the intended application and audience. Further, a function and “functional unit” of the
product system is established. The “functional unit” serves as a means to provide a common reference for
the inputs and outputs of the system. For example, the function of systems in this study is to provide
drinking water to consumer households, and the functional unit is 1000 gallons of drinking water
delivered to a consumer household. System boundaries, assumptions and limitations of the study are also
set forth.
1.5.2 Life Cycle Inventory (LCI)
The life cycle inventory analysis involves the identification and quantification of all relevant inputs and
outputs throughout the full life cycle of the given product system. This includes not only the direct
material and energy inputs and environmental releases related to production and manufacturing but also
those associated with upstream processes such as the energy required to extract raw fuels and materials
from the earth. Conducting the LCI entails an accounting of the input and output flows associated with
each process included in the system.
1.5.3 Impact Assessment
Using the results of the LCI, a life cycle impact assessment (LCIA) is conducted. The purpose of the
LCIA, a technical, quantitative and/or qualitative process, is to characterize and assess the magnitude and
significance of the potential environmental impacts LCI results. An LCIA consists of three steps:
• Classification: Data from the LCI is assigned to a number of selected impact categories
(e.g. Greenhouse gases (GHG’s) CO2, CH4 and N2O are used to evaluate global warming
impacts).
• Characterization: Modeling of the inventory result from each category in terms of a
category indicator (e.g. conversion of emissions of all greenhouse gases to CO2eq using
global warming potentials for each gas).
• Valuation: Involves an integration of the results across impact categories using weight
factors to facilitate a comparison between impact categories or allow for a single score
8
for the environmental performance of a product or system. This is considered an optional
step.
1.5.4 Interpretation
The final step in LCA, the interpretation, serves to evaluate the results of the inventory analysis and
impact assessment and recommend potential changes in the product system to improve environmental
performance. The results are interpreted in relation to the goals of the study, significant results are
highlighted and conclusions and recommendations are drawn.
1.6 Scope of Study
This research uses Life-Cycle Assessment (LCA) methodology to compare various scenarios for
delivering drinking water to consumers in the United States. Three main systems, (1) single-serving
disposable bottled water, (2) home and office delivery water (HOD) and (3) municipal tap water are
analyzed to quantify energy use, greenhouse gas (GHG) emissions, generation of solid waste and water
use. Variants of the 3 main systems were constructed based on packaging type, water source, distribution
distance, type of reusable container and end-of-life treatment of packaging and containers.
1.6.1 Function and Functional Unit
The system function was the delivery of drinking water to consumers in the United States by way of
several dominant delivery systems. The functional unit for the study was 1000 gallons of drinking water
delivered to the consumer.
1.6.2 Model Overview and System Boundaries
Three baseline systems will be examined through a multitude of sub-scenarios. The three main systems
encompass the delivery of 1000 gallons of drinking water via:
System 1: Single-use bottled water (500 ml bottles) sold in 24-packs. (7571 bottles/315.5 24-packs) System 2: HOD water from 5-gallon jugs served in a reusable drinking container. System 3: Municipal tap water served in a reusable drinking container.
For each of the systems, the following life-cycle stages are considered:
1) Cradle to material production for containers and secondary packaging.
2) Fabrication of containers (disposable and reusable) and secondary packaging.
3) Municipal treatment and pipeline distribution of tap water.

9
4) Operations at the bottling plant including water treatment and container filling.
5) Distribution of filled bottles/jugs.
6) Washing of reusable containers (single-serving and 5-gallon jugs).
7) Disposal/recycling of postconsumer materials (bottles, containers, secondary packaging).
In addition to the above, transportation between the various life-cycle stages was considered part of the
system model. The transportation stages included in the analysis are:
1) Transportation of filled containers (bottled water) from bottling facility to distribution/retail
center. This includes HOD water, which cycles between bottling facility and consumer
household. Bottles were assumed to be fabricated on-site at bottling facility.
2) Transportation of bottled water from retail store to consumer household (round trip)
3) Transportation associated with end-of-life of containers, packaging (i.e. to landfill).
4) Transportation of reusable drink ware from manufacturing location to consumer household.
Several key assumptions were made in completing this study:
• Burdens related to capital goods were expected to be small relative to other processes and are not
within the boundaries of the study. This includes production/maintenance burdens associated with
manufacturing equipment, vehicles and water treatment equipment as well as construction of
manufacturing, bottling and retail facilities and municipal water infrastructure.
• The production of pallets, likely used during various life-cycle stages, was not considered.
• The use of PE (polyethylene) stretch wrap to wrap pallets of bottled water was shown to represent
less than 1% of the system, and was thus excluded from this study.
• The burdens associated with the shipment of secondary packaging from the supplier to the
bottling facility were not considered.
• As is becoming increasingly the trend especially with larger bottlers, bottle/cap manufacturing
was assumed to take place on-site at the bottling facility (Senior, Dege, 2005).
• Labels, ink and glue associated with bottled water were assumed to be less than 1% of the system
and were thus excluded from this study.

10
1.6.3 Data Categories
This section introduces the four data categories that were used to classify the results of the inventory
analysis.
1.6.3.1 Energy Resources
Total primary energy consumed was tracked at each life cycle phase. This includes process related and
feedstock energy. Feedstock energy accounts for the petroleum used as a raw material for making
plastics.
1.6.3.2 Greenhouse Gas Emissions (CO2 equivalents)
Greenhouse gas (GHG) emissions resulting were tracked through each life-cycle stage of the system and
converted into CO2 equivalents. This includes carbon dioxide (CO2), methane (CH4), nitrous oxide (N2O)
and fluorinated gases generated from various processes.
1.6.3.3 Solid Waste
The mass of solid waste generated was tracked at each life cycle phase of the system. The solid waste
category is an aggregation of solid waste generated from various processes and post-consumer waste that
exit the system to enter a landfill. Materials that exit the system to be recycled for use in another product
system do not accrue any of the burdens associated with disposal. This analysis did not account for credits
(in material use or energy for example) for recycling material at the end-of-life; however a credit was
given for the reduction in total solid waste.
1.6.3.4 Water Use
Water use, in gallons, was tracked through each life cycle stage for the system. This includes water used
for various processes including material production, power generation (consumptive water use at the
plant) and production of transport fuels as well as wastewater resulting from bottling and water treatment
processes. Drinking water was not included in this category, as this was constant at 1000 gallons across
all scenarios.

11
Chapter 2
Single-Use Bottled Water
2.1 System Description
This system encompasses the delivery of drinking water to consumers in 500 ml (16.9 oz) single-use
bottles. Figure 2.1 shows the overview of the life cycle stages and processes modeled.
Figure 2.1: Overview of Life-Cycle System Model
This life cycle system begins with material production followed by the conversion of
commodity/engineered materials by processes to produce bottles, caps and secondary packaging. At a
bottling plant, 500 ml bottles are filled with drinking water (treated municipally or onsite at the bottling
facility), capped and packaged into 24-packs. Complete multi-packs of bottled water are then transported
by truck to a distribution center and onward (by various means and various distances) to a retailer in the
United States. Multi-pack bottle water is then purchased by consumers and transported to the household
via passenger vehicle. Bottled water is consumed, and the empty packaging (primary and secondary) is
disposed of. The end-of-life fate of packaging materials varies by variant. The 1000 gallons of drinking
water that makes up the functional unit requires 7571 bottles packaged into 315.5 24-packs.
Material Production
Container/Packaging Fabrication
Municipal Water Treatment and Distribution(if applicable)
Disposal (recycling, landfill)
UseBottling Operations
Filled Container Distribution
Material Recovery & Recycling
(if applicable)

12
2.1.1 Life Cycle Processes
Material Production:
During the Material Production Phase, raw materials are extracted from the earth and transformed into the
desired finished materials. The Material Production Phase for this system represents the material
production activities for primary (bottles, caps) and secondary packaging (corrugated boxes, polyethylene
wrap). See Appendix B for details of material production processes.
Material Recovery and Recycling:
Some variants utilize 25% recycled PET as a material component for bottles. The Material Recovery and
Recycling Phase represent the use of recycled PET in the fabrication of PET bottles for bottled water. In
accordance with the recycling methodology set forth in Appendix H, material recovery and recycling
activities in this case include the burdens of collecting and reprocessing the PET bottles for use in the
fabrication of new PET bottles.
Container Fabrication:
During the container fabrication phase, finished materials including PET, PLA (polylactic acid) and PP
(polypropylene) undergo fabrication processes that convert the materials into containers. See Appendix B
for details on fabrication processes. It is assumed that container fabrication occurs on-site at a bottling
facility.
Municipal Water Treatment:
The source of the drinking water for the bottled water systems differs by variant. For those variants that
use municipal water for bottling, this phase encompasses the treatment of water at a municipal water
treatment plant and subsequent distribution to a bottling facility. Data from the American Water Works
Association (AWWA) was used to estimate average energy use at U.S water treatment plants. See
Appendix D for details on the municipal treatment of drinking water.
Bottling Operations:
This phase represents operations at a bottling plant, including water treatment, container filling and
packaging of individual bottles into 24-packs. The technologies employed for treating the water varies by
the source of the water. In this study bottlers source their water from either municipal or natural (spring)
supplies. Municipally sourced water will normally undergo microfiltration and reverse osmosis treatment
(RO), followed by ozone treatment and UV (ultraviolet) disinfection. The treatment of water from natural

13
sources, on the other hand, begins with micro-filtration followed by ozone treatment and UV disinfection.
Naturally sourced water does not go through the RO process (IBWA, 2009). See Appendix E for details
on the bottling operations.
Filled Container Distribution:
This phase represents the distribution of filled 24-packs of bottled water, including:
(1) Travel from the bottling plant to a distribution facility
(2) Travel from the distributor to a retailer, and
(3) Travel from a retailer to a consumer household.
Distances and modes of travel are dependent on the variant under consideration. For example, a variant
considers bottled water traveling to the U.S. from overseas via ocean freighter and subsequent ground
transportation, while another considers bottled water produced regionally and transported by truck a
relatively short distance. See Appendix G for details on transportation processes.
Use:
This phase represents the fate of bottled water once it arrives in a consumer household and prior to
disposal; in other words, this is consumption of bottled water. No life-cycle processes are explicitly
represented during this phase.
Disposal:
Disposal includes the end of life fate of primary containers (bottles) and secondary packaging. Primary
containers are subject to alternative end of life scenarios (recycling, land filling) depending on the variant
under consideration. Disposal of secondary packaging (corrugated board, PE wrap) is split between
recycling and land fill based on the EPA estimates for municipal solid waste disposal in the US for
various materials. Disposal burdens include those associated with transportation from consumer to final
disposal and process related burdens of recycling and land fill disposal. See Appendix H for details
regarding end of life processes.
2.2 Bottled Water System Variants for Analysis
Variants of the bottled water system were derived to represent the broad range of life-cycle impacts
associated with the bottled water products available on the market today. The variants cover the possible

14
spectrum between minimum and maximum impacts. Variants are intended to highlight some of the trade-
offs and important parameters of the life-cycle of bottled water. Parameters used to construct variants
include:
• Primary Packaging (bottle): virgin PET; PET w/ 25% recycled content; PLA.
• Water Source: Spring (natural source); municipal supply.
• Transportation distances: Bottler to distributor; distributor to retailer; retailer to
consumer household. (Note: as stated earlier, it is assumed that single-use bottles are blow
molded on-site at the bottling facility)
• Disposal: landfill; recycle.
Figure 2.2: Bottled Water System Variants
Variant 1: Regional distribution; virgin PET bottle; spring water; landfilled
Variant 1 represents regional sales of bottled water, such that the distribution network is limited to 100
miles of transport from the bottler to a distributor. Spring water is packaged in a virgin PET bottle (PET
made from virgin material, rather than recycled material). Bottles are packaged into 24-multipacks using
secondary packaging, and transported 100 miles to a distribution facility in a single-unit diesel truck.
From a distributor, the bottled water is transported 20 miles to a retail location (grocery store, beverage
vendor etc.) in single-unit diesel truck, before finally being purchased by a consumer and transported 4
km (8 km round trip) in a passenger vehicle (car) to the consumer household. 8 km is the average round-
trip distance to a retail store in the U.S. (Sivaraman, 2007). The bottled water is consumed and the empty
container disposed of in a municipal landfill.
Variant 2: Regional distribution; rPET bottle (25%); spring water; recycled
Variant 2, also a regional model, introduces the use of recycled PET in the single-use bottle. Most
recycled PET is down-cycled into other products (clothing, carpets and strapping) in an open-loop
1 2 3 4 5 6 7
Package: PET ‐ virginPET‐25% recy. cnt.
PET‐25% recy. cnt.
PLAPET‐25% recy.
cnt.PET‐25% recy.
cnt.PET‐virgin
Water Source: Spring Spring Municipal Spring Spring Spring SpringTravel:To distributor (mi): 100 100 100 100 1500 4900 6300To retailer (mi): 20 20 20 20 20 20 20To home (km): 8 8 8 8 8 8 8
Disposal: Landfil led Recycled Recycled Landfil led Recycled Recycled Landfil led

15
recycling system. Incorporating recycled PET (rPET) into bottles represents a closed-loop recycling
system. Closed-loop recycling systems produce materials that have the same inherent properties as the
original material and can thus displace the use of virgin material. In theory, a closed-loop recycling
system can continue into perpetuity (though not in practice with current technology due to degradation of
material). As such, closed loop systems are preferable to open-loop systems in which the material
properties are not maintained. In the bottled water industry (if not the whole beverage industry), the use of
rPET in the production of new bottles is an uncommon practice as of yet. Recently, however, Arkansas
bottler Mountain Valley Spring Water has begun incorporating 25% rPET into all of its PET bottles. This
variant uses 25% rPET as the baseline scenario. Sensitivities were conducted to determine the life-cycle
benefits of using 50% and 100% rPET for the production of PET water bottles. See Appendix I for
sensitivity analyses.
Variant 3: Regional distribution; rPET bottle; municipal water; recycled
Variant 3 is an equivalent scenario to variant 2 in all respects excepting the source of the water being
bottled. This variant uses municipally sourced water, which has been subject to the municipal water
treatment system prior to arriving at the bottling facility. Further, municipal water that is to be bottled
undergoes reverse-osmosis treatment at the bottling plant, an energy intensive process. Reverse osmosis is
not generally employed in the bottling of spring water. This variant is intended to highlight the
differences in life-cycle impacts of spring versus municipally sourced bottled water.
Variant 4: Regional distribution; PLA bottle; spring water; landfilled
Variant 4 is equivalent to variant 1 in all respects excepting the material composition of the bottle. This
variant uses a PLA bottle for the primary container. PLA is a biopolymer derived from renewable sources
such as corn or sugar cane, rather than fossil based resources. While PLA is technically compostable,
high-temperature commercial composting systems are required. At present, there is not a developed
network of commercial facilities that are willing to accept PLA from municipalities. As a result,
composting PLA is not a viable option for a consumer. PLA bottles entering the waste stream from this
variant are consequently deposited in a landfill. This variant is intended to highlight the differences
associated with producing PLA versus PET bottles.
Variant 5: National distribution; rPET bottle; spring water; recycled
Variant 5 represents the national sales of bottled spring water. This variant is comparable to bottled water
systems employed by such national brands as Poland Spring. Spring water is bottled near the source (a

16
natural source) and shipped long distances to penetrate the national market. Here, spring water is bottled
into rPET containers, packaged into 24-multipacks and transported 1500 miles via tractor trailer diesel
truck to a distribution center. From the distribution center, the bottled water is transported 20 miles to a
retail center via single-unit diesel truck, purchased by a consumer and driven by passenger vehicle (car) 4
km (8 km roundtrip) to the household. Following consumption of the bottled water, the empty bottle is
recycled.
Variant 6: International distribution; rPET bottle; spring water; recycled
Variant 6 represents an overseas bottled water system model, similar to the system employed by such
international brands as Evian™. Spring water is bottled near the source and shipped via combination of
rail, ocean freighter, and truck to reach an international market. Transportation modes and distance are
based on inferences made from the Evian™ website. Spring water is bottled into rPET bottles in Évian-
les-Bains, France, packaged into 24-multipacks and transported via rail to the Port of Marseilles, roughly
300 miles. From the Port of Marseilles, the bottled water is shipped across the Atlantic Ocean via ocean
freighter to the Port of New York, NY, roughly 4500 miles before continuing on to a distribution center
via single-unit diesel truck an additional 100 miles. From the distribution center, the bottled water is
transported 20 miles via single-unit diesel truck to a retail store before finally being purchased and
transported 4 km (8 km round trip) to a consumer household in a passenger vehicle. Following
consumption of the bottled water, the empty bottles are recycled.
Variant 7: Extended international distribution; virgin PET bottle; spring water; landfilled
Variant 7 is an additional overseas bottled water system, and represents spring water which is packaged
into virgin-PET bottles, and transported to the Port of New York, NY (same transportation modes and
distances, 300/4500 miles). From port, however, the bottled water is trucked an additional 1500 miles to a
distribution center in the central United States. From the distribution center, the bottled water is trucked
20 miles to a retailer, purchased and transported 4 km (8 km roundtrip) in a passenger vehicle. Empty
bottles are disposed of in a landfill.
2.3 Results
Using SimaPro 7 LCA software and Microsoft Excel, the life-cycle impacts of Single-Use Bottled
Water variants were evaluated. Results were evaluated for 1000 gallons of drinking water (7571
PET bottles/315.5 24-packs) and are presented in Table 2.1 below by variant, as defined in
section 2.2.

17
Table 2.1: Combined Results By Variant
Single‐Use Bottled Water (1000 gallons)[1000 gallons = 3785.4 liters]
1 2 3 4 5 6 7Energy (MJ)
Container Production 13857.2 11940.8 11940.8 12449.2 11940.8 11940.8 13857.2
2° Pkng Production 1582.3 1582.3 1582.3 1582.3 1582.3 1582.3 1582.3
Bottling 687.6 687.6 941.9 687.6 687.6 687.6 687.6
Distribution 2202.5 2202.5 2202.5 2202.5 10132.8 9119.7 17050.0
Consumer Transport 245.5 245.5 245.5 245.5 245.5 245.5 245.5
End‐of‐Life (ctrs, pkng.) 26.6 2.3 2.3 26.6 2.3 2.3 26.6
Total: 18601.7 16661.0 16915.3 17193.8 24591.3 23578.2 33449.2
Solid Waste (kg)Container Production 13.0 21.5 21.5 7.8 21.5 21.5 13.0
2° Pkng Production 7.7 7.7 7.7 7.7 7.7 7.7 7.7
Bottling operations: 6.8 6.8 9.1 6.8 6.8 6.8 6.8
Distribution: 0.8 0.8 0.8 0.8 3.8 3.5 6.5
Consumer Transport 0.001 0.001 0.001 0.001 0.001 0.001 0.001
End‐of‐Life (ctrs, pkng.) 169.5 51.4 51.4 169.5 51.4 51.4 169.5
Total: 197.9 88.3 90.6 192.6 91.3 90.9 203.5
GWP (kg CO2 eq)
Container Production 571.8 506.9 506.9 152.5 506.9 506.9 571.8
2° Pkng Production 108.1 108.1 108.1 108.1 108.1 108.1 108.1
Bottling operations: 40.2 40.2 56.1 40.2 40.2 40.2 40.2
Distribution: 159.6 159.6 159.6 159.6 737.1 671.3 1248.8
Consumer Transport 19.1 19.1 19.1 19.1 19.1 19.1 19.1
End‐of‐Life (ctrs, pkng.) 26.8 2.8 2.8 26.8 2.8 2.8 26.8
Total: 925.7 836.7 852.6 506.3 1414.2 1348.4 2014.8
Water Use (gallons):Ctr/Pkng Production: 175.0 175.0 175.0 175.0 175.0 175.0 175.0
Bottling: 67.2 67.2 400.5 67.2 67.2 67.2 67.2Power Production 701.0 690.0 716.2 701.0 690.0 690.0 701.0Transportation 11.1 11.1 11.1 11.1 32.7 11.1 36.1Total: 954.3 943.3 1302.8 954.3 965.0 943.4 979.4
Variant
18
2.3.1 Life-Cycle Energy:
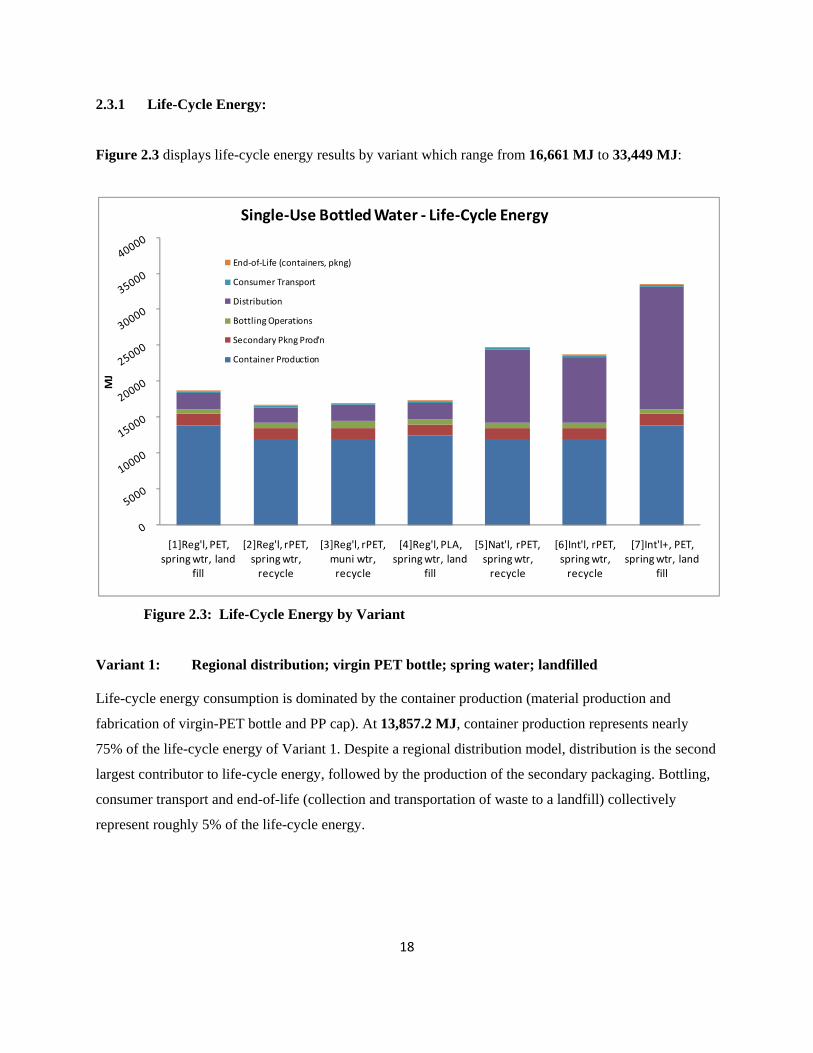
Figure 2.3 displays life-cycle energy results by variant which range from 16,661 MJ to 33,449 MJ:
Figure 2.3: Life-Cycle Energy by Variant
Variant 1: Regional distribution; virgin PET bottle; spring water; landfilled Life-cycle energy consumption is dominated by the container production (material production and
fabrication of virgin-PET bottle and PP cap). At 13,857.2 MJ, container production represents nearly
75% of the life-cycle energy of Variant 1. Despite a regional distribution model, distribution is the second
largest contributor to life-cycle energy, followed by the production of the secondary packaging. Bottling,
consumer transport and end-of-life (collection and transportation of waste to a landfill) collectively
represent roughly 5% of the life-cycle energy.
[1]Reg'l, PET, spring wtr, land
fill
[2]Reg'l, rPET, spring wtr, recycle
[3]Reg'l, rPET, muni wtr, recycle
[4]Reg'l, PLA, spring wtr, land
fill
[5]Nat'l, rPET, spring wtr, recycle
[6]Int'l, rPET, spring wtr, recycle
[7]Int'l+, PET, spring wtr, land
fill
MJ
Single‐Use Bottled Water ‐ Life‐Cycle Energy
End‐of‐Life (containers, pkng)
Consumer Transport
Distribution
Bottling Operations
Secondary Pkng Prod'n
Container Production

19
Variant 2: Regional distribution; rPET bottle (25%); spring water; recycled Life-cycle energy consumption is dominated by the container production (material production and
fabrication of virgin-PET bottle and PP cap). At 11,940.8 MJ, container production represents nearly
72% of the life-cycle energy of Variant 2. The decrease in container production energy from Variant 1 is
attributed to the use of 25% rPET in the bottle. Producing bottles from recycled PET is less energy
intensive than doing so from virgin material. Despite a regional distribution model, distribution is the
second largest contributor to life-cycle energy, followed by the production of the secondary packaging.
Bottling, consumer transport and end-of-life (collection and transportation of waste to a landfill)
collectively represent less than 6% of the life-cycle energy.
Variant 3: Regional distribution; rPET bottle; municipal water; recycled
The life-cycle energy profile of Variant 3 is identical to that of Variant 2 with one exception. The use of
municipal water for bottling leads to an increase in bottling energy (941.9 MJ vs. 687.6 MJ). Bottling
municipal water is more energy intensive than bottling spring water for two reasons. First, the municipal
water has already undergone treatment at a municipal water treatment facility, a process that consumes
energy. Further, industry standard is to further treat municipal water to be bottled with reverse osmosis,
an energy intensive process, while spring water will not undergo this additional treatment step. Here
bottling energy increases to 6% of life-cycle energy (from 4.1%).
Variant 4: Regional distribution; PLA bottle; spring water; landfilled
Relative to virgin-PET (variant 1), the PLA container production process exhibits decrease in container
production energy (12,499.2 MJ vs. 13,857.2 MJ). PLA, a biopolymer, is derived from renewable
resources rather than fossil based resources, and as a consequence is less intensive to produce. Energy use
in all other life-cycle stages remains unchanged from Variant 1.
Variant 5: National distribution; rPET bottle; spring water; recycled
While life-cycle energy is still dominated by container production (49%), national distribution translates
to more than a 4-fold increase in distribution energy use (2,205.5 MJ to 10,132.8 MJ). Here, distribution
accounts for 41% of life-cycle energy. Energy use at other life-cycle stages remains unchanged from
Variant 2.

20
Variant 6: International distribution; rPET bottle; spring water; recycled Life-cycle energy continues to be dominated by container production (51%), however, overseas
distribution translates to more than a fourfold increase in distribution energy use (2,205.5 MJ to 9,119.7
MJ) relative to the regional variants. Here, distribution accounts for 39% of life-cycle energy. Energy use
at other life-cycle stages remains unchanged from other spring water variants. It is interesting to note that
while distribution distance increased drastically from the national distribution model (variant 5),
distribution energy has actually decreased from 10,132.5 MJ to 9,119.7 MJ. This is a product of the
relative efficiency of ocean freight transport (which accounts for 4,500 of the 4,900 miles of the overseas
distribution model) versus the tractor-trailer transport of the national distribution model.
Variant 7: Extended international distribution; virgin PET bottle; spring water; landfilled Here, life-cycle energy is dominated by distribution energy use (51% of life-cycle energy). The
distribution model for Variant 7 results in a nearly eightfold increase in distribution energy from regional
variants (from 2,205.5 MJ to 17,050 MJ). This variant employs the use of virgin-PET bottles and hence
exhibits an increase in container production energy use from Variant 6. Here we see the highest life-cycle
energy of the bottled variants.
2.3.2 Life-Cycle Solid Waste
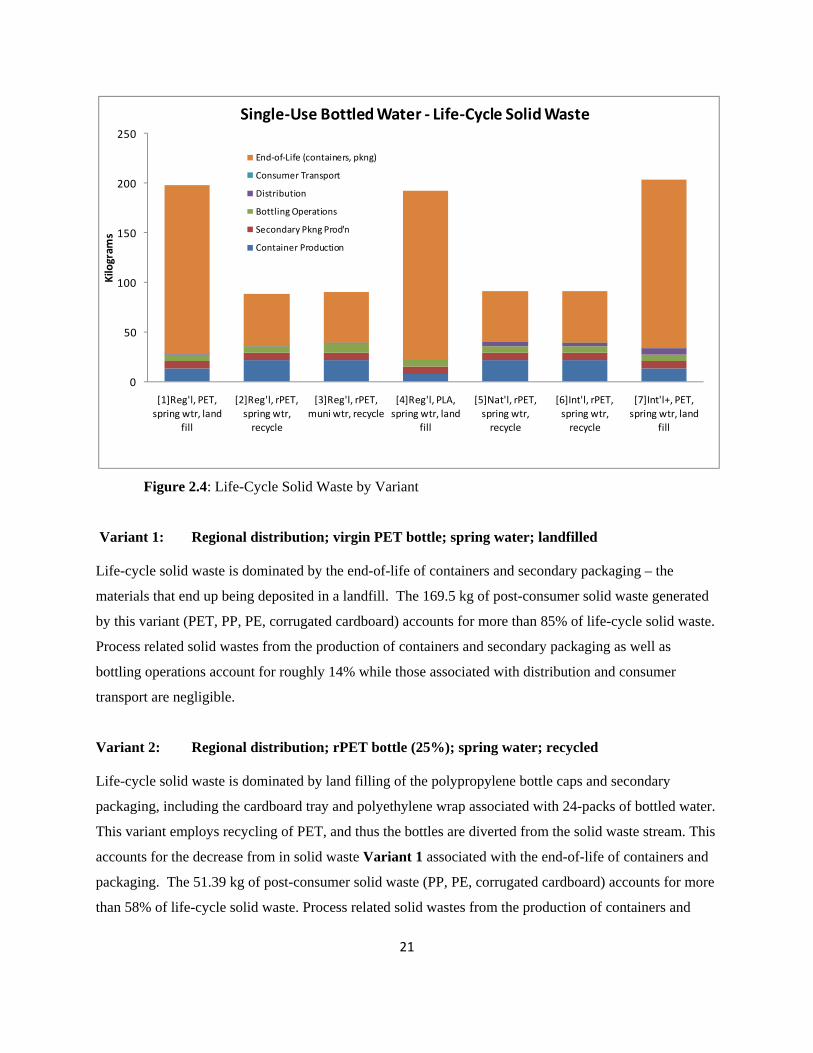
Figure 2.4 displays life-cycle solid waste results by variant which ranges from 88.3 kg to 203.5 kg:
21
Figure 2.4: Life-Cycle Solid Waste by Variant
Variant 1: Regional distribution; virgin PET bottle; spring water; landfilled Life-cycle solid waste is dominated by the end-of-life of containers and secondary packaging – the
materials that end up being deposited in a landfill. The 169.5 kg of post-consumer solid waste generated
by this variant (PET, PP, PE, corrugated cardboard) accounts for more than 85% of life-cycle solid waste.
Process related solid wastes from the production of containers and secondary packaging as well as
bottling operations account for roughly 14% while those associated with distribution and consumer
transport are negligible.
Variant 2: Regional distribution; rPET bottle (25%); spring water; recycled Life-cycle solid waste is dominated by land filling of the polypropylene bottle caps and secondary
packaging, including the cardboard tray and polyethylene wrap associated with 24-packs of bottled water.
This variant employs recycling of PET, and thus the bottles are diverted from the solid waste stream. This
accounts for the decrease from in solid waste Variant 1 associated with the end-of-life of containers and
packaging. The 51.39 kg of post-consumer solid waste (PP, PE, corrugated cardboard) accounts for more
than 58% of life-cycle solid waste. Process related solid wastes from the production of containers and
0
50
100
150
200
250
[1]Reg'l, PET, spring wtr, land
fill
[2]Reg'l, rPET, spring wtr, recycle
[3]Reg'l, rPET, muni wtr, recycle
[4]Reg'l, PLA, spring wtr, land
fill
[5]Nat'l, rPET, spring wtr, recycle
[6]Int'l, rPET, spring wtr, recycle
[7]Int'l+, PET, spring wtr, land
fill
Kilogram
sSingle‐Use Bottled Water ‐ Life‐Cycle Solid Waste
End‐of‐Life (containers, pkng)
Consumer Transport
Distribution
Bottling Operations
Secondary Pkng Prod'n
Container Production

22
secondary packaging as well as bottling operations account for roughly 33% while those associated with
distribution and consumer transport are negligible. Relative to Variant 1, solid waste resulting from
container production has increased from 13.04 kg to 21.54 kg. Process related solid wastes are greater for
producing rPET bottles than virgin-PET. Overall, Variant 2 shows a 56% reduction of total solid waste
resulting from the recycling of PET bottles after their useful life.
Variant 3: Regional distribution; rPET bottle; municipal water; recycled Like energy use, life-cycle solid waste remains unchanged from Variant 2, excepting that associated with
bottling. Here the use of municipal water for bottling and the associated increase in energy use leads to
the generation of more process related solid waste. Variant 3 shows an increase in bottling solid waste to
10% of life-cycle solid waste (from 7.7%).
Variant 4: Regional distribution; PLA bottle; spring water; landfilled
Life-cycle solid waste is dominated by the end-of-life of containers and packaging. The end-of-life stage
represents 88% of life-cycle solid waste. While technically biodegradable, PLA requires the high heat
and pressure of industrial composting facilities to decompose. Few facilities exist nationwide for the
composting of PLA. For this study, it was assumed that PLA is sent to a land fill. The PLA bottle
performs best (relative to virgin-PET and rPET) with regards to solid waste from the container production
process (4% of life-cycle solid waste).
Variant 5: National distribution; rPET bottle; spring water; recycled
Life-cycle solid waste is dominated by land filling of the polypropylene bottle caps and secondary
packaging, including the cardboard tray and polyethylene wrap associated with 24-packs of bottled water.
This variant employs recycling of PET, and thus the bottles are diverted from the solid waste stream. The
increases in distribution energy results in a commensurate increase in process related solid waste
associated with distribution. Here distribution solid waste accounts for 4% of life-cycle solid waste and
more than a fourfold increase from the regional distribution variants.
Variant 6: International distribution; rPET bottle; spring water; recycled
Life-cycle solid waste is dominated by land filling of the polypropylene bottle caps and secondary
packaging, including the cardboard tray and polyethylene wrap associated with 24-packs of bottled water.
The increases in distribution energy results in a commensurate increase in process related solid waste

23
associated with distribution. Here distribution solid waste accounts for 3.8% of life-cycle solid waste and
more than a fourfold increase from the regional distribution variants. Due to the relative efficiency of
ocean freight versus tractor-trailer transport, despite a drastic increase in distribution distance from the
national distribution model, we see a decrease in solid waste related to distribution (3.45 kg versus 3.85
kg).
Variant 7: Extended international distribution; virgin PET bottle; spring water; landfilled
Variant 7 generates the most solid waste of any of the bottled variants. This is a result in increase in solid
waste from the extended overseas distribution, the use of virgin-PET and the land filling of bottles. Due to
the land filling of bottles, end-of-life represents 83% of life-cycle solid waste. The extended overseas
distribution model causes distribution related solid waste to increase from 3.45 to 6.46 kg, a nearly
twofold increase.
2.3.3 Life-Cycle Greenhouse Gas Emissions
Figure 2.5 displays life-cycle GHG results by variant which ranges from 506 kg CO2eq to 2,015 kg
CO2eq:
Figure 2.5: Life-Cycle Greenhouse Gas Emissions by Variant
0
500
1000
1500
2000
2500
[1]Reg'l, PET, spring wtr, land
fill
[2]Reg'l, rPET, spring wtr, recycle
[3]Reg'l, rPET, muni wtr, recycle
[4]Reg'l, PLA, spring wtr, land
fill
[5]Nat'l, rPET, spring wtr, recycle
[6]Int'l, rPET, spring wtr, recycle
[7]Int'l+, PET, spring wtr, land
fill
Kilogram
s CO
2eq
Single‐Use Bottled Water ‐ Life‐Cycle GHG's
End‐of‐Life (containers, pkng)
Consumer Transport
Distribution
Bottling Operations
Secondary Pkng Prod'n
Container Production

24
Variant 1: Regional distribution; virgin PET bottle; spring water; landfilled
Typically, greenhouse gas emissions correlate with energy use. As such, life-cycle GHG emissions share
the same top three contributors with life-cycle energy: container production, distribution and secondary
packaging production. These three represent 62%, 17% and 12% of GHG emissions respectively. The
remainder, bottling, consumer transport and end-of-life, collectively account for less than 10% of life-
cycle GHG emissions.
Variant 2: Regional distribution; rPET bottle (25%); spring water; recycled
Life-cycle GHG emissions share the same top three contributors with life-cycle energy: container
production, distribution and secondary packaging production. These three represent 61%, 20% and 13%
of GHG emissions respectively. The remainder, bottling, consumer transport and end-of-life, collectively
account for roughly 7% of life-cycle GHG emissions. Overall, we see a 10% reduction of total GHG
emissions due to a reduced volume of solid waste collected and transported to a land fill.
Variant 3: Regional distribution; rPET bottle; municipal water; recycled
Life-cycle greenhouse gas emissions increase slightly from Variant 2 due to the increased energy
demands of bottling municipal water. Greenhouse gases emitted during the bottling process account for
7% of life-cycle emissions (up from 5% with Variant 2).
Variant 4: Regional distribution; PLA bottle; spring water; landfilled
Life-cycle GHG emissions are dominated by distribution related emissions, at 32% of life-cycle
emissions. Relative to Variant 1, we see a drastic reduction in the emissions from container production as
they fell from 62% of life-cycle emissions to 30%. While production of PLA is significantly less intensive
then PET (virgin or rPET) with respect to GHG emissions, much of the reduction can be attributed to
plant specific bonuses from special energy certificates. The data used in this study for production of PLA
are specific to the Natureworks Plant in Nebraska, the largest PLA plant in the world, and reflects carbon
dioxide emissions offsets through wind power certificates specific to the plant.
Variant 5: National distribution; rPET bottle; spring water; recycled
At 52%, distribution related GHG emissions dominate the life-cycle here. The 737.07 kg of CO2eg
associated with distribution is more than a fourfold increase from the regional variants. Emissions from
all other life-cycle stage remain unchanged from Variant 2.

25
Variant 6: International distribution; rPET bottle; spring water; recycled
At 50%, distribution related GHG emissions dominate the life-cycle here. The 671.33 kg CO2eg
associated with distribution is more than a fourfold increase from the regional variants. Emissions from
all other life-cycle stage remain unchanged from Variant 5. Due to the relative efficiency of ocean freight
versus tractor-trailer transport, despite a drastic increase in distribution distance from the national
distribution model, we see a decrease in GHG emissions related to distribution (671.33 versus 737.07 kg
CO2eg).
Variant 7: Extended international distribution; virgin PET bottle; spring water; landfilled
At 62%, distribution related GHG emissions dominate the life-cycle here. The 1248.79 kg CO2eg
associated with distribution is more than an eightfold increase from the regional variants, and nearly a
twofold increase from the overseas distribution model employed by Variant 6. This variant employs the
use of virgin-PET bottles and hence exhibits an increase in container production GHG emissions from
Variant 6. Here we see the highest life-cycle GHG emissions of the bottled variants.
2.3.4 Life-Cycle Water Use Results
Figure 2.6 displays life-cycle water use results by variant which ranges from 943 gallons to 1303
gallons:

26
Figure 2.6: Life-Cycle Water Use by Variant
Variant 1: Regional distribution; virgin PET bottle; spring water; landfilled Life-cycle water use for Variant 1 is dominated (73%) by water used during power production activities,
followed by material production for packaging and containers (PET, PP, corrugated board, LDPE) Water
use associated with bottling is a product of rinsing bottles prior to filling.
Variant 2: Regional distribution; rPET bottle (25%); spring water; recycled
Life-cycle water is slightly reduced from Variant 1. The reduction in water used for power production is
due to the lower energy requirements associated with the rPET bottle (relative to virgin bottles).
Variant 3: Regional distribution; rPET bottle; municipal water; recycled This variant has the highest total water use of among all variants. Water use increases dramatically with
the bottling of municipal water. Bottlers typically treat municipal water with reverse osmosis, something
that is not done with spring water. Reverse osmosis produces 25% wastewater. As such, to produce 1000
gallons of drinking water from reverse osmosis, 1333.3 gallons of influent is required, and 333.3 gallons
0
200
400
600
800
1000
1200
1400
[1]Reg'l, PET, spring wtr, land
fill
[2]Reg'l, rPET, spring wtr, recycle
[3]Reg'l, rPET, muni wtr, recycle
[4]Reg'l, PLA, spring wtr, land
fill
[5]Nat'l, rPET, spring wtr, recycle
[6]Int'l, rPET, spring wtr, recycle
[7]Int'l+, PET, spring wtr, land
fill
Gallons
Single‐Use Bottled Water ‐ Life‐Cycle Water Use
Transportation
Power Production
Bottling
Ctr/Pkng Production

27
exit the process as wastewater. Variant 3 bottling water use increases to 400.5 gallons, and shows a 38%
increase in total water use from Variant 2.
Variant 4:
Water use is unchanged from Variant 1.
Variant 5:
Variant 5 transportation related water use increases 196% from the regional variants (1-4) due to national
distribution of bottled water.
Variant 6:
Despite the overseas distribution model used for Variant 6, we see a reduction in transportation related
water use. This is due to the relative efficiency of ocean freighter travel versus tractor-trailer travel.
Variant 7:
The extended overseas distribution model of Variant 7 requires additional transportation related water
use. Transportation water use increases 225%.
2.4 Discussion
As evidenced from the analysis of bottled water variants, several key factors determine the life-cycle
impacts of a single-use bottled water system: the material composition of the single-use bottle, the end-of-
life treatment of those bottles and the details of distribution including mode and distance.
The material composition of the primary container (500 ml bottle) is a significant contributor to the life-
cycle energy and greenhouse gas profile of single-use bottled water. For regionally distributed bottled
water packaged in virgin-PET, container production (material production and container fabrication)
constitutes 75% of life-cycle energy. The use of rPET (25% recycled content) reduces container
production energy by 14% (13,857.2 to 11,940.8 MJ), and life-cycle energy by 10%. Similar reductions
are seen in greenhouse gas emissions with rPET reducing container production GHG’s by 11% (571.83 to
506.89 kg CO2eq), and life-cycle GHG’s by 10%. The use of a PLA bottle also reduces life-cycle energy
and greenhouse gas emissions to the system. Relative to the virgin scenario, PLA bottles reduce container
production energy by 10% (13,857.2 to 12,449.2 MJ) and life-cycle energy by 8%. More dramatic
reductions are seen in greenhouse gas emissions. The use of PLA reduces container production emissions

28
by 73% (571.83 to 152.49 kg CO2eq) and life-cycle emissions by 45%. It should be noted that the
majority of the GHG reduction from the use of PLA are specific to the Natureworks Plant in Nebraska,
the largest PLA plant in the world. The PLA data used in this study are specific to this plant and reflect
carbon dioxide emissions offsets through wind power certificates specific to the plant. There is some
potential that PLA could generate methane when landfilled. Unfortunately, few studies have been
published that address the greenhouse gas emissions associated with land filling biodegradable polymers.
Some research suggest that PLA does not degrade in a well-engineered landfill where there is little
moisture or warmth (Bohlmann, 2004). While more research is needed to understand the fate of
degradable plastics in a landfill, this study assumes no biodegradation of PLA nor associated emissions.
The end-of-life treatment of the single-use bottles has a considerable impact on the life-cycle solid waste
for the single-use bottled systems. End-of-life, the post-consumer portion of solid waste (bottles, caps,
secondary packaging), is the dominant solid waste category across all variants and ranges from 56-86% of
life-cycle solid waste. By diverting bottles from a land fill through recycling, end-of-life solid waste is
reduced by 70%, from 169.5 kg to 51.39 kg. The remaining 51.39 kg of post-consumer solid that is sent
to a landfill is made up of the polypropylene caps and secondary packaging (polyethylene wrap and
corrugated board).
Distribution can be a major contributor to life-cycle impacts of single-use bottled water. Distribution
ranges from 12-51% of life-cycle energy across the variants depending on the distribution pattern in
place. Shifting from a regional to national distribution pattern increases distribution energy 360% (2,202.5
MJ to 10,132.8 MJ) as distribution energy rises from 12% to 41% of life-cycle energy. Overseas
distribution increases distribution energy 314%, notably less than national distribution despite much
greater travel distance. This is a function of the relative efficiency of ocean freighter versus tractor-trailer
travel. The extended overseas model increases distribution energy 674%, from 2,202.5 to 17,050 MJ.
Under this scenario, distribution energy accounts for 51% of life-cycle energy and becomes the dominant
contributor to life-cycle energy, replacing container production.

29
Chapter 3
Home and Office Delivery (HOD) Bottled Water
3.1 System Description
This system represents the delivery of drinking water to consumers in 5-gallon jugs through a home and
office delivery (HOD) provider. At the household, the drinking water is consumed through the use of a
reusable drinking vessel (stainless steel bottle, glass cup). Figure 3.1 shows the overview of the system
model.
Figure 3.1: Overview of Life-Cycle System Model
This life cycle begins with material production, including those required for the production of the 5-gallon
jug (PET, PC) the reusable drinking vessel (stainless steel bottle, glass cup). This system does not involve
the use of secondary packaging. While it is possible that some type of secondary packaging is used during
the life-cycle of HOD water, no data was found concerning this, and as such secondary packaging was not
included in the analysis. Finished materials undergo fabrication processes to produce the reusable drink
ware (stainless steel bottle, glass cup) and the water bottle (5-gallon jug). At a bottling plant, 5-gallon jugs
are filled with drinking water (treated municipally and/or on-site at the bottling facility). Filled containers
are then delivered to a consumer household as part of a home and office delivery system. The drinking
Container washing
Container fabrication(5‐gallon jug)
Use
Filled container distribution
Bottling operations
Material production
Reusabledrink ware fabrication
Disposal (landfill, recycling)
Reusabledrink ware
use
Residential washing
Container washing
Material production
Disposal (landfill, recycling)
Municipal Water Treatment and Distribution(if applicable)
Material Recovery & Recycling
(if applicable)

30
water is served in a reusable container which is periodically washed in a residential dishwasher. Empty 5-
gallon jugs are collected by fillers, returned to the bottling plant, washed and subsequently reenter the
HOD system. The end-of-life fate of the 5-gallon jug varies by scenario, while the reusable container is
recycled. The number of times a 5-gallon jug can be reused determines the number of jugs that need to be
fabricated to deliver the functional unit of 1000 gallons of drinking water. Reuse can vary considerably
(25-100 times) depending on many factors including climate and handling, but most importantly material
composition (Davis, 2008). Polycarbonate is a stronger, more durable material than PET, and as a result
has a longer life (Hamilton, 2001). For this analysis, 50 reuses per jug were assumed for PC jugs, while
only 25 for PET. This translates to the manufacture of 4 PC jugs or 8 PET jugs to deliver 1000 gallons of
drinking water.
The baseline scenario analyzes the use of two reusable drinking vessels (stainless steel bottle, glass cup)
to consume the whole functional unit (1000 gallons of drinking water). Sensitivities are run to determine
the life cycle impacts of shorter container life requiring the use of additional containers. See Appendix I
for sensitivity analysis regarding container life and the use of additional reusable containers. The
stainless steel bottle is manufactured in China and brought to the consumer by a combination of ocean
freight and truck transport. For the glass cup, distribution distance was assumed to be 300 miles by truck.
While paper cups are often used to consume HOD water in an office setting, this study examines the
consumption of HOD water in a consumer household setting.
3.1.1 Life Cycle Processes Material Production:
During the material production phase, raw materials are extracted from the earth and transformed into the
desired finished materials. The material production phase for this system represents the material
production activities for water bottles (5-gallon jugs) and reusable drinking vessels (steel bottle, glass
cup). See Appendix B for details of material production processes.
Material Recovery and Recycling:
Some variants utilize 25% recycled PET as a material component for the 5-gallon jug. The Material
Recovery and Recycling phase represents the use of rPET in the fabrication of PET bottles (5-gallon jugs)
for bottled water. In accordance with the recycling methodology set forth in Appendix H, material
recovery and recycling activities in this case include the burdens of collecting and reprocessing the 5-
gallon PET jugs for use in the fabrication of new jugs.
31
Fabrication:
During the fabrication phase, finished materials (PET, stainless steel, PP, glass) undergo fabrication
processes that convert the materials into containers. See Appendix B for details on fabrication processes.
As stated above, it is assumed that container fabrication associated with bottled water occurs on-site at a
bottling facility.
Municipal Water Treatment:
The source of the drinking water for the HOD bottled water systems differs by variant. For those variants
that use municipal water for bottling, this phase encompasses the treatment of water at a municipal water
treatment plant and subsequent distribution to a bottling facility. See Appendix D for details on the
municipal treatment of drinking water.
Bottling Operations:
This phase represents operations at a bottling plant, including water treatment, container washing and
container filling. The technologies employed for treating the water varies by the source of the water. In
this study bottlers source their water from either municipal or natural (spring) supplies. Municipally
sourced water will undergo microfiltration and reverse osmosis treatment (RO), followed by ozone
treatment and UV disinfection. The treatment of water from natural sources, on the other hand, begins
with micro-filtration followed by ozone treatment and UV disinfection. Naturally sourced water does not
go through the RO process.
Filled Container Distribution:
This phase represents the transportation of filled 5-gallon jugs to a consumer household as part of an
HOD distribution system. Also included in this phase is the transportation of empty jugs back to the
bottling plant. Transportation burdens are based on ton-kilometers (metric tkm), and include mass of the
container and water.
Residential Washing:
This phase represents the washing of the reusable drinking vessel in a residential dishwasher. The
baseline scenario assumes the reusable container is washed after every four uses. Sensitivities are run to
determine the life-cycle impacts associated with more frequent washing. See Appendix F for details on
the residential washing process, and Appendix I for sensitivity analysis. This phase includes burdens

32
associated with residential dishwashing including energy and water use for operation as well as energy
use for wastewater treatment of the effluent.
Use:
The use phase represents the consumption of the drinking water at the consumer household. No life-cycle
processes are explicitly represented during this phase.
Container Washing:
This phase represents the washing of reusable 5-gallon jugs at the bottling plant. The container washing
occurs as a step in the bottling process, and thus the burdens associated with washing are represented in
the bottling operations phase. The washing step involves the energy requirement for operation (electricity)
and for heating the wash water to 60C (natural gas). See Appendix E for details of the bottling process.
Disposal:
Disposal includes the end of life fate of containers (5-gallon jugs, reusable drinking vessel). Primary
containers, 5-gallon jugs, are subject to alternative end of life scenarios (recycling, land filling) depending
on the variant under consideration. Disposal burdens include those associated with transportation from
consumer to final disposal and process related burdens of recycling and landfill disposal. Disposal of the
stainless steel bottle/cap and glass cup is split between recycling and land fill disposal based on the EPA
estimates for municipal solid waste disposal in the US for various materials. See Appendix H for details
regarding end-of-life processes.
3.2 HOD Bottled Water System Variants For Analysis
Variants of the HOD bottled water system were derived to represent a range of life-cycle impacts based
on key life-cycle parameters. The variants cover the possible spectrum between minimum and maximum
impacts without taking into consideration every possible combination of model parameters. Rather,
variants are intended to highlight some of the trade-offs and important parameters of the life-cycle of
HOD bottled water. Parameters used to construct variants include:
• Primary Packaging (5-gallon jug): virgin-PET; PET w/ 25% recycled content; Polycarbonate.
• Water Source: Spring (natural source); municipal supply.
• Reusable Drinking Vessel: stainless steel bottle, glass cup.

33
• Distribution Distance Allocation (1-way): 10 miles, 20 miles.
• Disposal (jug): Recycled, land fill disposal.
Figure 3.2: Home and Office Delivery System Variants
Variant 1: PC jug; spring water; stainless steel bottle; jug recycled
Variant 1 represents a HOD system using a polycarbonate 5-gallon jug filled with spring water. Filled
containers travel 10 miles in a delivery van to the consumer household as part of the delivery system.
Water is served in the reusable drinking vessel, a stainless steel bottle. Empty container are collected as
part of the delivery system and transported 10 miles back to the bottling facility to be reused. After 50
reuses, the 5-gallon jug is recycled.
Variant 2: PC jug; spring water; glass cup; jug recycled
Variant 2 replaces the stainless steel drinking vessel with a 12 oz. glass cup. This variant is intended to
highlight the trade-off associated with the choice of a reusable drinking vessel.
Variant 3: PC jug; municipal water; steel bottle; jug landfilled
Variant 3 differs from variant 1 in the source of drinking water and end-of-life fate of containers. Here
drinking water is sourced from municipal supplies, and 5-gallon jugs are land filled after 50 reuses. This
variant is intended to highlight the differences in life-cycle impacts associated with the source of drinking
water and the trade-off between recycling and land filling for a HOD bottled water system.
Variant 4: Virgin PET jug; spring water; steel bottle; jug landfilled
Variant 4 introduces the use of virgin-PET in the 5-gallon jug. This variant is intended to highlight the
difference in life-cycle impacts of a HOD system with regards to material composition of the 5-gallon
jug.
1 2 3 4 5 6
Package: PC PC PC PET ‐ virginPET‐25% recy.
cnt.PC
Water Source: Spring Spring Municipal Spring Spring SpringStainless steel bottle (18 oz.)
Glass cup (12 oz.)
Stainless steel bottle (18 oz.)
Stainless steel bottle (18 oz.)
Stainless steel bottle (18 oz.)
Stainless steel bottle (18 oz.)
10 10 10 10 10 20Disposal (jug): Recycled Recycled Landfilled Landfilled Recycled Recycled
Reusable Drinking VesselTravel (miles, 1‐way):

34
Variant 5: rPET jug (25%); spring water; steel bottle; jug recycled
Variant 5 uses 25% rPET in the 5-gallon jug, and introduces the benefit of recycled content and recycling
to the HOD system.
Variant 6: PC jug; spring water; steel bottle; jug recycled; extended distribution distance
Variant 6 increases the one-way distribution distance from 10 to 20 miles, to determine the impact of
distribution distance on the life-cycle impacts of HOD bottled water.
3.3 Results
Using SimaPro 7 LCA software and Microsoft Excel, the life-cycle impacts of Home and Office Delivery
Bottled Water variants were evaluated. Results were evaluated in terms of 1000 gallons of drinking water
delivered (4 PC jugs/50 reuses or 8 PET jugs/25 reuses) are presented by variant in Table 3.1 below, as
defined in section 3.2.

35
Table 3.1: Combined Results By Variant
HOD Systems (1000 Gallons)[1000 gallons = 3785.4 liters]
1 2 3 4 5 6Energy (MJ)
Jug Prod'n 413.55 413.55 413.55 607.68 523.19 413.55
Bottl ing 922.92 922.92 1177.20 922.92 922.92 922.92
Distribution 300.93 300.93 300.93 300.93 300.93 601.94
Reusable Ctr (l ife‐cycle) 44.90 8.00 44.90 44.90 44.90 44.90
Washing (residential) 933.33 1400.00 933.33 933.33 933.33 933.33
End‐of‐Life (containers) 0.00 0.00 0.60 1.16 0.00 0.00
Total: 2615.63 3045.40 2870.50 2810.92 2725.27 2916.63
Solid Waste (kg)Jug Prod'n 0.45 0.45 0.45 0.26 0.77 0.45
Bottl ing 8.21 8.21 10.49 8.21 8.21 8.21
Distribution 0.00 0.00 0.00 0.00 0.00 0.00
Reusable Ctr (l ife‐cycle) 0.03 0.67 0.03 0.03 0.03 0.03
Washing (residential) 9.23 13.84 9.23 9.23 9.23 9.23
End‐of‐Life (containers) 0.00 0.00 2.92 5.85 0.00 0.00
Total: 17.92 23.18 23.13 23.57 18.23 17.92
GWP (kg CO2 eq)
Jug Prod'n 22.32 22.32 22.32 25.50 22.86 22.32
Bottl ing 53.17 53.17 69.05 53.17 53.17 53.17
Distribution 22.56 22.56 22.56 22.56 22.56 45.12
Reusable Ctr (l ife‐cycle) 2.51 0.59 2.51 2.51 2.51 2.51
Washing (residential) 54.93 82.40 54.93 54.93 54.93 54.93
End‐of‐Life (containers) 0.00 0.00 0.84 1.13 0.00 0.00
Total: 155.49 181.04 172.21 159.80 156.03 178.05
Water Use (gallons):Jug Prod'n 3.09 3.09 3.09 5.40 5.40 3.09
Bottl ing 264.20 264.20 597.50 264.20 264.20 264.20Washing (residential) 213.30 320.00 213.30 213.30 213.30 213.30Power Production 295.69 370.32 321.64 307.19 306.66 295.69Transportation 3.00 3.00 3.00 3.00 3.00 6.00Total: 779.28 960.61 1138.53 793.09 792.56 782.28
Variant

36
3.3.1 Life-Cycle Energy
Figure 3.3 displays life-cycle energy use results which range from 2,616 MJ to 3,045 MJ:
Figure 3.3: Life-Cycle Energy Use by Variant
Variant 1: PC jug; spring water; stainless steel bottle; jug recycled Life-cycle energy is dominated by residential washing of the reusable stainless steel bottle and the
operations at the bottling plant. These two life-cycle stages account for 36% and 35% of total life-cycle
energy respectively. HOD bottling energy use for spring water is somewhat higher than for single-use
bottled water from Chapter 2 (922.9 MJ vs. 687.6 MJ). This is due to the washing of the reusable 5-gallon
jugs that is a part of the bottling process. The washing process consumes electricity for operation as well
as natural gas to heat the washing water to 60C. Material production of the polycarbonate jug and
distribution account for 16% and 12% of life-cycle energy respectively, while the life-cycle of the
reusable stainless steel bottle (production, distribution, disposal) accounts for a mere 2%.
0
500
1000
1500
2000
2500
3000
3500
[1]PC, spr wtr, steel, recycle
[2]PC, spr wtr, glass, recycle
[3]PC, muni wtr, steel, land fill
[4]PET, spr wtr, steel, land fill
[5]rPET, spr wtr, steel, recycle
[6]PC, spr wtr, steel, extended
distribution, recycle
MJ
HOD Water‐ Life‐Cycle Energy Use End‐of‐Life JugWashing (residential)Reusable Drinking Ctr Life‐CycleDistributionBottling Operations

37
Variant 2: PC jug; spring water; glass cup; jug recycled
Here we see an increase in residential washing energy use to 46% of life-cycle energy (from 36%). This is
due to the size of the drinking vessel. The 12 oz. glass cup requires more uses to consume 1000 gallons of
drinking water (relative to the 18 oz. steel bottle) and thus undergoes more washing cycles (washed every
4 uses) and as such consumes more life-cycle energy. Energy from the reusable drinking container life-
cycle has dropped from Variant 1 (from 44.9 MJ to 8.0 MJ). This is due to lower production energy for
the glass cup relative to the stainless steel bottle.
Variant 3: PC jug; municipal water; steel bottle; jug landfilled
Here we observe a sharp increase in bottling energy use as it rises 6% to 41% of life-cycle energy use.
This can be attributed to the use of municipal water for bottling. The life-cycle energy of municipal
bottled water is greater than that of spring bottled water for two reasons: 1) municipal water has already
been treated at a municipal treatment plant; 2) once it arrives at a bottling plant municipal water
undergoes reverse osmosis treatment. Spring water does not undergo reverse osmosis at the bottling plant.
Energy associated with end-of-life of 5-gallon jugs has increased slightly due to collection and
transportation of the jugs to a landfill.
Variant 4: Virgin PET jug; spring water; steel bottle; jug landfilled
The key change in life-cycle energy relative to previous variants is related to the production of 5-gallon
jugs. Per kg, manufacturing PET jugs is less energy intensive than PC jugs (104 MJ/kg vs. 141.5
MJ//kg); however, this system requires the use of twice the number of jugs as PC variants. As such,
energy from jug production increases to 607.7 MJ (from 413.5 MJ), accounting for 22% of life-cycle
energy.
Variant 5: rPET jug (25%); spring water; steel bottle; jug recycled
With the introduction of rPET, the key change in life-cycle energy is a decrease in jug production energy
relative to Variant 4. Here jug production drops to 523.2 MJ (from 607.7 MJ) and accounts for 19% of
life-cycle energy (from 22%). While rPET jugs are less energy intensive than those of virgin-PET, total
jug production energy is still higher than that of PC jugs when accounting for the number of jugs required
for the delivery of 1000 gallons of drinking water.

38
Variant 6: PC jug; spring water; steel bottle; jug recycled; extended distribution distance
The key change from Variant 1 is a marked increase in distribution energy use resulting from a doubling
of the allocated one-way distance. Distribution energy increases to 601.9 MJ and 21% of life-cycle energy
(from 300.9 MJ and 12%). Other values remain unchanged from Variant 1.
3.3.2 Life-Cycle Solid Waste
Figure 3.4 displays life-cycle solid waste results which range from 17.9 kg to 23.6 kg:
Figure 3.4: Life-Cycle Solid Waste by Variant
Variant 1: PC jug; spring water; stainless steel bottle; jug recycled
Much life life-cycle energy, solid waste is dominated by residential washing and bottling at 52% and 46%
of the life-cycle. These are process related solid wastes associated with energy use. Solid waste from
material production of the 5-gallon jug generates 3% of the life-cycle solid waste while the life-cycle of
the reusable stainless steel bottle accounts for 0.2%.
0
5
10
15
20
25
[1]PC, spr wtr, steel, recycle
[2]PC, spr wtr, glass, recycle
[3]PC, muni wtr, steel, land fill
[4]PET, spr wtr, steel, land fill
[5]rPET, spr wtr, steel, recycle
[6]PC, spr wtr, steel, extended
distribution, recycle
Kilogram
s
HOD Water Life‐Cycle Solid WasteEnd‐of‐Life JugWashing (residential)Reusable Drinking Ctr Life‐CycleDistributionBottling OperationsJug Production

39
Variant 2: PC jug; spring water; glass cup; jug recycled.
The increase in solid waste from residential washing relative to Variant 1 (13.8 kg vs. 9.2 kg) is due to the
size of the drinking vessel and the increase in the number of required washing cycles. Also, we observe an
increase in the solid waste generated from the life-cycle of the reusable drinking vessel. While less energy
intensive, the production of the glass cup produces more solid waste than that of the stainless steel bottle.
Further, landfill disposal of the glass cup adds additional solid waste to the life-cycle. Other life-cycle
stages remain unchanged from Variant 1.
Variant 3: PC jug; municipal water; steel bottle; jug landfilled
A rise in solid waste from the bottling process can be attributed to the bottling of municipal water and the
resulting increase in energy use and associated solid wastes. The use of municipal water for bottling
increases bottling operation solid waste from 8.2 kg to 10.4 kg. The increase in solid waste from the end-
of-life of containers is due to the land filling of 5-gallon polycarbonate jugs. The recycling from previous
variants diverted the jug material while here we see 2.9 kg of post-consumer solid waste being deposited
in a land fill.
Variant 4: Virgin PET jug; spring water; steel bottle; jug landfilled
Key values for this variant include solid waste from the manufacturing of 5-gallon jugs and post-
consumer solid waste. Per kilogram, the production and manufacture of jugs from PET generates less
solid waste than from PC. Consequently, while twice as many PET jugs are produced than would be with
PC, the net generation of solid waste decreases to 0.3 kg (from 0.5 kg), and accounts for 1% of life-cycle
solid waste. Post-consumer solid waste sent to a land fill (5-gallons jugs) has doubled from the previous
variant, due to the use of twice as many jugs.
Variant 5: rPET jug (25%); spring water; steel bottle; jug recycled
We observe a marked increase in solid waste associated with jug production. This is due to the fact that
process related solid wastes are greater for producing rPET bottles than virgin-PET, a consequence of the
recycling methodology chosen for this study. End-of-life solid waste has dropped to zero as post-
consumer solid waste is diverted from the land fill through recycling.
Variant 6: PC jug; spring water; steel bottle; jug recycled; extended distribution distance
Life-cycle solid waste remains unchanged from Variant 1.
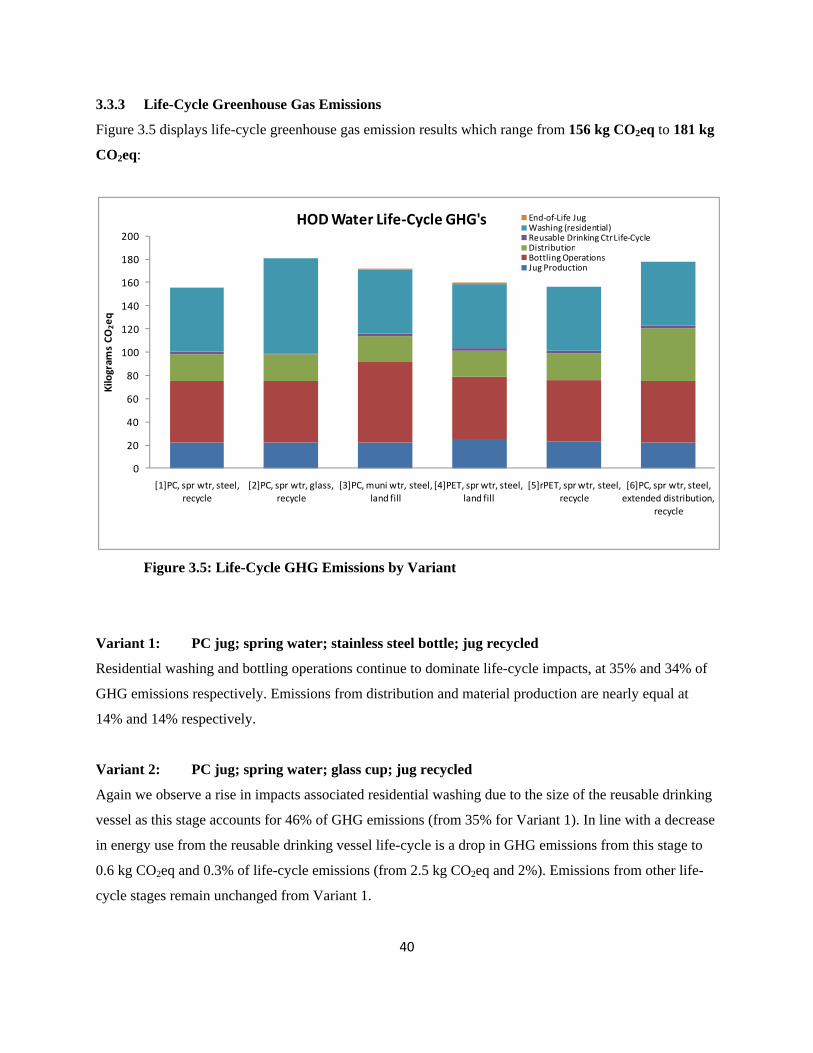
40
3.3.3 Life-Cycle Greenhouse Gas Emissions
Figure 3.5 displays life-cycle greenhouse gas emission results which range from 156 kg CO2eq to 181 kg
CO2eq:
Figure 3.5: Life-Cycle GHG Emissions by Variant
Variant 1: PC jug; spring water; stainless steel bottle; jug recycled
Residential washing and bottling operations continue to dominate life-cycle impacts, at 35% and 34% of
GHG emissions respectively. Emissions from distribution and material production are nearly equal at
14% and 14% respectively.
Variant 2: PC jug; spring water; glass cup; jug recycled
Again we observe a rise in impacts associated residential washing due to the size of the reusable drinking
vessel as this stage accounts for 46% of GHG emissions (from 35% for Variant 1). In line with a decrease
in energy use from the reusable drinking vessel life-cycle is a drop in GHG emissions from this stage to
0.6 kg CO2eq and 0.3% of life-cycle emissions (from 2.5 kg CO2eq and 2%). Emissions from other life-
cycle stages remain unchanged from Variant 1.
0
20
40
60
80
100
120
140
160
180
200
[1]PC, spr wtr, steel, recycle
[2]PC, spr wtr, glass, recycle
[3]PC, muni wtr, steel, land fill
[4]PET, spr wtr, steel, land fill
[5]rPET, spr wtr, steel, recycle
[6]PC, spr wtr, steel, extended distribution,
recycle
Kilogram
s CO
2eq
HOD Water Life‐Cycle GHG's End‐of‐Life JugWashing (residential)Reusable Drinking Ctr Life‐CycleDistributionBottling OperationsJug Production

41
Variant 3: PC jug; municipal water; steel bottle; jug landfilled
Relative to Variant 1, we observe increases in life-cycle GHG emissions associated with the bottling
process and the end-of-life of 5-gallon jugs. As mentioned above, the life-cycle energy of municipal
bottled water is greater than that of spring bottled water, and this translates into higher GHG emissions.
The rise in GHG emission from the end-of-life of 5-gallon jugs is due to the collection and transportation
of post-consumer solid waste to the land fill.
Variant 4: Virgin PET jug; spring water; steel bottle; jug landfilled
Key values here include GHG emissions from the production of and the end-of-life treatment of the 5-
gallon jugs. The increase in production related GHG emissions is due to the use of 8 jugs (versus 4 with
the PC variants). Further, after 25 reuses, the jugs are collected and transported to a land fill. As such,
twice as much material is delivered to the land fill (relative to PC variants), and a commensurate rise in
GHG emissions is observed.
Variant 5: rPET jug (25%); spring water; steel bottle; jug recycled
Commensurate with life-cycle energy, the use of rPET in the 5-gallon jugs yields a decrease in GHG
emissions from Variant 4 as it drops to 22.9 kg CO2eq and 15% of life-cycle emissions (from 22.5 kg and
16%). The diversion of post-consumer solid waste from the land fill decreases end-of-life emissions to
zero. Other values remain unchanged from Variant 4.
Variant 6: PC jug; spring water; steel bottle; jug recycled; extended distribution distance
Like energy use, the key change from Variant 1 is a marked increase in distribution related emissions
resulting from a doubling of the allocated one-way distance. GHG emissions from distribution increase to
45.12 kg CO2eq and 25.3% of life-cycle emissions from 22.56 kg CO2eq and 14.5%. Other values remain
unchanged from Variant 1.
3.3.4 Life-Cycle Water Use
Figure 3.6 displays life-cycle water use results which range from 782 gallons to 1139 gallons:

42
Figure 3.6: Life-Cycle Water Use by Variant
Variant 1: PC jug; spring water; stainless steel bottle; jug recycled
Life-cycle water use is dominated by power production followed by bottling operations at 38% and 34%
respectively. The washing and rinsing procedures that occur during the HOD bottling procedure generates
1 liter of wastewater per 1 gallon of fill water, amounting to 264.2 gallons per 1000 gallons fill. Periodic
residential washing of the stainless steel bottle (after every 4 uses) generates 213.3 gallons of wastewater,
and 27% of life-cycle water use. Water use associated with material production is quite low relative to the
single-use bottled variants in Chapter 2 (3.1 vs. 109.1 gallons). With 50 reuses per 5-gallon polycarbonate
jug, considerably less material is required to delivery 1000 gallons of drinking water to consumers
relative to single-use bottled water.
Variant 2: PC jug; spring water; glass cup; jug recycled
Attributable to the size of the reusable drinking vessel and the resultant increase in the number of required
washing cycles is increase in water use from residential washing (from 213.3 to 320 gallons). Energy
consumption required for additional washing cycles leads to an increase in water use from power
production. Water use from jug production and bottling remains unchanged.
0
200
400
600
800
1000
1200
[1]PC, spr wtr, steel, recycle
[2]PC, spr wtr, glass, recycle
[3]PC, muni wtr, steel, land fill
[4]PET, spr wtr, steel, land fill
[5]rPET, spr wtr, steel, recycle
[6]PC, spr wtr, steel, extended
distribution, recycle
Gallons
HOD Life‐Cycle Water Use Transportation
Power Production
Washing (residential)
Bottling
Jug Prod'n

43
Variant 3: PC jug; municipal water; steel bottle; jug landfilled
Again, the use of municipal water for bottling yields a substantial increase in life-cycle impacts. Here
were see an additional use of 333.3 gallons of water over the spring water variants for a total of 597.5
gallons of water use associated with bottling. This is related to the use of reverse-osmosis to treat
municipal water at the bottling plant. Reverse-osmosis produces 25% wastewater, and thus requires the
treatment of 1333.3 gallons to produce 1000 gallons of drinking water. This variant shows the highest
life-cycle water use of all the HOD variants.
Variant 4: Virgin PET jug; spring water; steel bottle; jug landfilled
A key change to water use with this variant is the increase associated with production of the 5-gallon jug.
Per kilogram, higher water use is associated with the production of PC jugs relative to PET jugs;
however, due to the use of twice as much PET (more jugs), the jug production water use is higher overall
for the PET variant.
Variant 5: rPET jug (25%); spring water; steel bottle; jug recycled
Water use remains unchanged from the previous variant.
Variant 6: PC jug; spring water; steel bottle; jug recycled; extended distribution distance
Transportation related water use increases slightly here from the previous variant due to the increased
distribution distance.
3.4 Discussion As evidenced by the analysis of HOD bottled water variants, several key factors determine the life-cycle
impacts of an HOD system: washing of the reusable drinking vessel, type of water to be bottled, material
composition of the 5-gallon jug, the end-of-life treatment of those jugs, and the distribution distance.
Generally the largest contributor to all life-cycle impact categories (excepting Variant 3), washing of the
reusable drinking vessel ranges from 32-46% of life-cycle energy, 39.1-61.4% of life-cycle solid waste
and 30.4-45.5% of life-cycle GHG emissions. This study assumes that the reusable drinking vessel will be
washed after every four uses. Some consumer may choose to wash their drinking vessel more and some
less, and this choice could have significant implications for life-cycle impacts. Sensitivity analysis was

44
conducted to determine the effect on life-cycle impacts of frequency of washing (see Appendix I).
Washing every four uses was assumed to be a suitable estimate for the baseline variants in this study.
The type of water to be bottled is a factor in the life-cycle impacts of the HOD system. Bottling municipal
water leads to an increase in life-cycle impacts in all categories relative to spring water variants. In fact,
the use of municipal water (Variant 3) results in bottling becoming the dominant life-cycle process over
residential washing of the reusable drinking vessel at 41% of life-cycle energy, 45.4% of life-cycle solid
waste and 40.2% of life-cycle GHG’s.
The material composition of the primary container (5-gallon jug) is a factor influencing the life-cycle
energy and greenhouse gas profile of HOD bottled water. The advantage to using a polycarbonate jug is
its durability and the resulting average 50 reuses per jug. More reuses translate into fewer containers per
volume of delivered drinking water. As such this study assumes the use of 4 polycarbonate jugs versus 8
PET jugs (only 25 reuses) to deliver 1000 gallons of drinking water. Per kilogram, manufacturing jugs
from PC is more energy, GHG and solid waste intensive than doing so from PET; however, the fewer
number of PC jugs required more than offsets the difference rendering PC the better choice with respect
to both energy use and GHG emissions.
The end-of-life treatment of the 5-gallon jugs has a significant influence on the life-cycle solid waste of
the HOD system and particularly on end-of-life solid waste (post-consumer solid waste). Post-consumer
solid waste ranges from 0% (jugs diverted from landfill via recycling) to 24.8% (virgin-PET jugs land
filled) of life-cycle solid waste across variants. The recycling of 5-gallon jugs is crucial to improving the
life-cycle solid waste profile of an HOD system.
Distribution distance is also a critical factor influencing the life-cycle impacts of HOD bottled water,
particularly with respect to energy use and GHG emissions. With an increase in the one-way distribution
distance from 10 to 20 miles, we observe distribution energy rise to 20.6% of life-cycle energy from
11.5%. With respect to GHG emissions, the increase in distance results in a rise in distribution related
emission to 25.3% from 14.5%. Delivery routes should be optimized to minimize distribution distance to
any one consumer household to reduce the life-cycle impacts of an HOD bottled water system.

45
Chapter 4
Municipal Tap Water
4.1 System Description This system represents the delivery of drinking water to consumers via municipal water systems
terminating in a household tap. At the household, the drinking water is consumed through the use of a
reusable drinking vessel (stainless steel bottle, glass cup). Figure 4.1 shows the overview of the system
model.
Figure 4.1: Overview of Life-Cycle System Model
The life-cycle begins with the conversion of raw materials into finished materials, in this case the
production of stainless steel, polypropylene and glass, which are then used in the fabrication of the
reusable drinking vessel (stainless steel bottle/cap, glass cup). Drinking water is treated and distributed
via municipal systems to a consumer household. Drinking water is served in the reusable drinking vessel
which is periodically washed in a residential dishwasher. The end-of-life disposal of the reusable drinking
vessel is split between recycling and land fill disposal based on the EPA estimates for municipal solid
waste disposal in the US for various materials.
The baseline scenario analyzes the use of two reusable drinking vessels (stainless steel bottle, glass cup)
to consume the whole functional unit (1000 gallons of drinking water). Sensitivities are run to determine
the life cycle impacts of shorter container life requiring the use of additional containers. See Appendix I
for sensitivity analysis regarding container life and the use of additional reusable containers. The stainless
MaterialProduction
Drinking vessel
fabrication
DisposalWashing ‐residential
Drinking vessel use
Municipal water treatment and distribution
46
steel bottle is manufactured in China and brought to the consumer by a combination of ocean freight and
truck transport. The glass cup distribution distance was assumed to be 300 miles by diesel tractor trailer.
4.1.1 Life Cycle Processes
Material Production:
During the material production phase, raw materials are extracted from the earth and transformed into the
desired finished materials. The material production phase for this system represents the material
production activities for the reusable drinking vessel (stainless steel, glass) and cap (polypropylene). See
Appendix B for details of material production processes.
Fabrication:
During the fabrication phase, finished materials (stainless steel, glass, PP) undergo fabrication processes
that convert the materials into containers. See Appendix B for details on fabrication processes. This
phase includes:
• Stainless steel container fabrication
• PP injection molding to produce cap
• Glass cup fabrication
Municipal Water Treatment and Distribution:
This phase encompasses the treatment at a municipal water treatment plant and subsequent distribution of
1000 gallons of drinking water to a consumer household. See Appendix D for details on the municipal
treatment and distribution of drinking water.
Use:
The use phase represents the consumption of the drinking water at the consumer household. No life-cycle
processes are explicitly represented during this phase.
Residential Washing:
This phase represents the washing of the reusable drinking vessel in a residential dishwasher. The
baseline scenario assumes the reusable container is washed after every four uses. Sensitivities are run to
determine the life-cycle impacts associated with more frequent washing. See Appendix F for details on
the residential washing process, and Appendix I for the sensitivity analysis. This phase includes burdens

47
associated with residential dishwashing including energy and water use for operation as well as energy
use for wastewater treatment of the effluent.
Disposal:
Disposal includes the end of life fate of the reusable drinking vessel (stainless steel bottle, PP cap or glass
cup). Disposal burdens include those associated with transportation from consumer to final disposal and
process related burdens. Disposal of the stainless steel bottle/cap and glass cup is split between recycling
and land fill disposal based on the EPA estimates for municipal solid waste disposal in the US for various
materials. See Appendix H for details regarding end of life processes.
4.2 Tap water system variants
Relative to the single-use and HOD bottled water systems, the tap water system is straightforward, and
not conducive to myriad variants. As such, only two variants on the life-cycle of a tap drinking water
system are analyzed. The variants highlight life-cycle impacts relative to the choice of a reusable drinking
vessel, either a stainless steel bottle or a glass cup. Sensitivities are also run to evaluate life-cycle impacts
of different patterns of residential washing, and variation in container life requiring the use of additional
reusable containers. See Appendix I for sensitivity analyses.
Figure 4.2: Tap Water System Variants
Variant 1: Stainless steel bottle
Variant 1 represents tap water served in a reusable stainless steel 18 oz. bottle (based on the Klean
Kanteen™ product). The bottle is assumed manufactured in China and transported 6570 miles from
Shanghai to Long Beach, CA on an ocean freighter followed by 1500 miles of truck travel to reach the
consumer market in the central United States. The steel bottle is subject to 63.3% recycling and 36.7%
land fill disposal at the end of its useful life.
1 2Stainless steel bottle (18 oz.)
Glass cup (12 oz.)
6570/1500 300
63.3%/36.7% 28.1%/71.9%
Reusable Drinking VesselDistribution (miles):
Disposal:(% recy/% landfill)

48
Variant 2: Glass cup
Variant 2 represents tap water served in a 12 oz. glass kitchen cup. Distribution distance for the glass cup
was assumed to be 300 miles by diesel tractor trailer. The glass cup is subject to 28.1% recycling and
71.9% land fill disposal at the end of its useful life. This variant is intended to highlight the tradeoff
involved in the selection of a reusable drinking vessel.
4.3 Results
Using SimaPro 7 LCA software and Microsoft Excel, the life-cycle impacts of Tap Water System
Variants were evaluated. Results were evaluated in terms of 1000 gallons of delivered drinking water
(using two reusable drinking vessels) and are presented by variant, as defined in section 4.2 above.

49
4.3.1 Life-Cycle Energy Use
Figure 4.3 displays life-cycle energy use results which range from 63 MJ to 80 MJ:
Table 4.1: Combined Results By Variant
Municipal Tap Systems (1000 Gallons)[1000 gallons = 3785.4 liters]
1 2Energy (MJ)
Municipal Water Trmnt 76.44 76.44
Reusable Ctr (l ife‐cycle) 43.25 8.00
Washing (residential) 933.33 1400.00
Total: 1053.02 1484.44
Solid Waste (kg)Municipal water trmnt 0.58 0.58
Reusable ctr (prod'n, disp) 0.03 0.67
Washing (residential): 9.23 13.84
Total: 9.84 15.10
GWP (kg CO2 eq)
Municipal water trmnt 5.21 5.21
Reusable ctr (prod'n, disp) 2.39 0.59
Washing (residential): 54.93 82.40
Total: 62.53 88.20
Water Use (gallons):Washing Reusable Ctr 213.30 320.00
Power Production 152.48 227.11
Transportation 0.00 0.00Total: 365.78 547.11
Variant
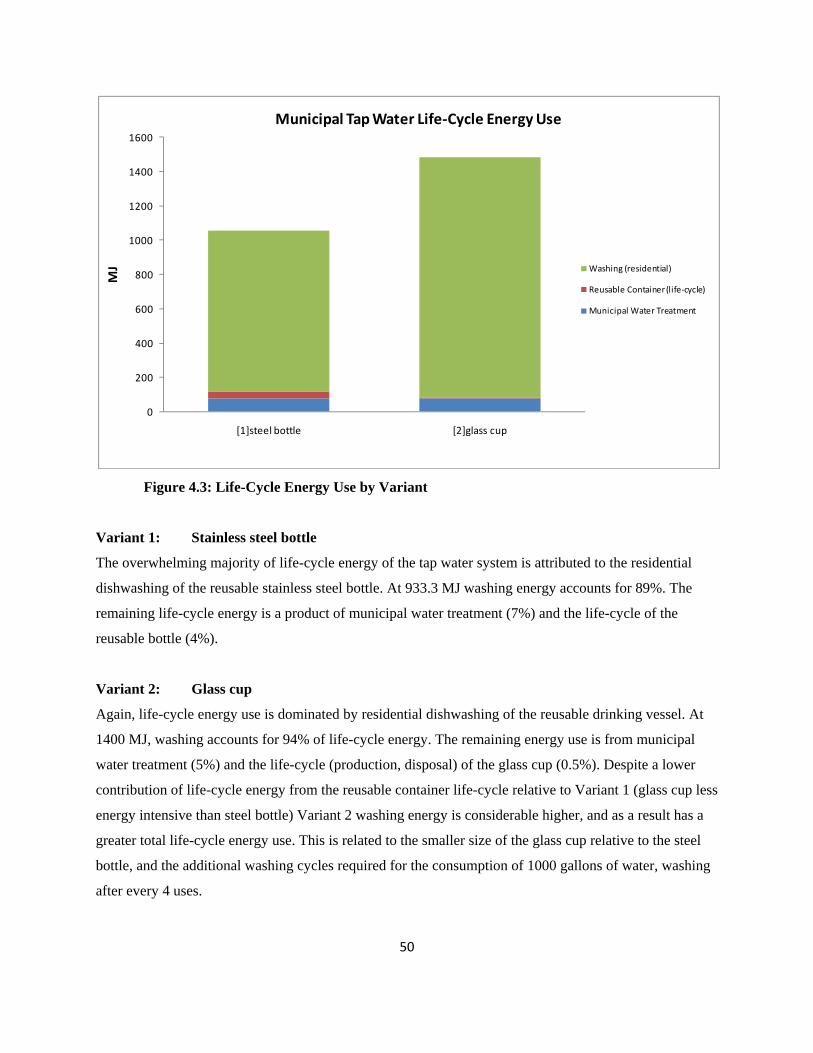
50
Figure 4.3: Life-Cycle Energy Use by Variant
Variant 1: Stainless steel bottle
The overwhelming majority of life-cycle energy of the tap water system is attributed to the residential
dishwashing of the reusable stainless steel bottle. At 933.3 MJ washing energy accounts for 89%. The
remaining life-cycle energy is a product of municipal water treatment (7%) and the life-cycle of the
reusable bottle (4%).
Variant 2: Glass cup
Again, life-cycle energy use is dominated by residential dishwashing of the reusable drinking vessel. At
1400 MJ, washing accounts for 94% of life-cycle energy. The remaining energy use is from municipal
water treatment (5%) and the life-cycle (production, disposal) of the glass cup (0.5%). Despite a lower
contribution of life-cycle energy from the reusable container life-cycle relative to Variant 1 (glass cup less
energy intensive than steel bottle) Variant 2 washing energy is considerable higher, and as a result has a
greater total life-cycle energy use. This is related to the smaller size of the glass cup relative to the steel
bottle, and the additional washing cycles required for the consumption of 1000 gallons of water, washing
after every 4 uses.
0
200
400
600
800
1000
1200
1400
1600
[1]steel bottle [2]glass cup
MJ
Municipal Tap Water Life‐Cycle Energy Use
Washing (residential)
Reusable Container (life‐cycle)
Municipal Water Treatment

51
4.3.2 Life-Cycle Solid Waste
Figure 4.4 displays life-cycle solid waste results which range from 9.8 kg to 15.1 kg:
Figure 4.4: Life-Cycle Solid Waste by Variant
Variant 1: Stainless steel bottle Residential washing accounts for the vast majority of life-cycle solid waste for the tap water system. At
9.2 kg, residential washing generates 94% of life-cycle solid waste. The remaining life-cycle solid waste
is a product of municipal water treatment (6%) and the life-cycle of the reusable bottle (0.3%).
Variant 2: Glass cup Residential washing generates the lion’s share of life-cycle solid waste. At 13.8 kg, washing accounts for
92% of life-cycle solid waste. Municipal water treatment (4%) and the life-cycle of the glass cup (0.4%)
are responsible for the remaining solid waste.
4.3.3 Life-Cycle Greenhouse Gas Emissions
Figure 4.5 displays life-cycle GHG emission results which range from 1,053 kg CO2eq to 1,484 kg
CO2eq:
0
2
4
6
8
10
12
14
16
[1]steel bottle [2]glass cup
Kilogram
s
Municipal Tap Water Life‐Cycle Solid Waste
Washing (residential)
Reusable Container (life‐cycle)
Municipal Water Treatment

52
Figure 4.5: Life-Cycle GHG’s by Variant
Variant 1: Stainless steel bottle Residential washing contributes the majority of life-cycle greenhouse gas emissions for the tap water
system. At 54.9 kg CO2eq, residential washing generates 88% of life-cycle GHG’s. The remaining
emissions are a product of municipal water treatment (8%) and the life-cycle of the reusable bottle (4%).
Variant 2: Glass Cup
The bulk of life-cycle GHG emissions results from residential washing of the glass cup. At 82.4 kg
CO2eq, washing represents 93% of emissions. The remaining emissions come from municipal water
treatment (6%) and the life-cycle of the glass cup (0.7%).
4.3.4 Life-Cycle Water Use
Figure 4.6 displays life-cycle water use results which range from 366 gallons to 547 gallons:
0
10
20
30
40
50
60
70
80
90
100
[1]steel bottle [2]glass cup
Kilogram
s CO
2eq
Municipal Tap Water Life‐Cycle GHG's
Washing (residential)
Reusable Container (life‐cycle)
Municipal Water Treatment

53
Figure 4.6: Life-Cycle Water Use by Variant
Variant 1: Stainless steel bottle
The majority of life-cycle water use (58%) associated with the tap water system is a product of the
residential washing process. Over the course of consuming 1000 gallons of drinking water, 213.8 gallons
of water are consumed for washing of the reusable bottle. Water used in power production accounts for
the remaining water use.
Variant 2: Glass cup
Again, the majority of life-cycle water use associated with the tap water system is a product of the
residential washing process. Over the course of consuming 1000 gallons of drinking water, 320 gallons of
water are consumed for washing of the reusable bottle. Water use increases from Variant 1 due to the
additional washing cycles required for the glass cup and the associated additional washing water and
power production.
0
100
200
300
400
500
600
[1]steel bottle [2]glass cup
Gallons
Municipal Tap Water Life‐Cycle Water Use
Transportation
Power Production
Washing Reusable Container

54
4.4 Discussion
As evidenced by the analysis of municipal tap water variants, the key factor that determines the life-cycle
impacts is the washing of the reusable drinking vessel. For both tap water variants, washing is responsible
for more than 87% of energy use, solid waste and GHG emissions, and 100% of water use. As such,
Variant 1 outperforms Variant 2 in all impact categories because of the additional washing required by the
smaller size of the glass cup. As stated above, this study assumes the reusable drinking vessel is washed
after every 4 uses. Per use (refill), the 12 oz. glass cup delivers less water than the 18 oz. stainless steel
bottle and thus requires more washing cycles to deliver the full functional unit of 1000 gallons of drinking
water. In this respect, the choice of a reusable drinking vessel has an effect on the life-cycle impacts of
tap water systems.
A comparison of the life-cycle impacts of the containers themselves shows, however, that the stainless
steel bottle is considerably more intensive with respect to energy use and GHG emissions. The bottle uses
more than five times the energy and emits more than 4 times the GHG’s than the glass cup across the life-
cycle. With regard to solid waste, however, the glass cup generates nearly two times the amount produced
during the bottle across the life-cycle.

55
Chapter 5
Comparison of Systems
Figure 5.1 defines the parameters of the system variants discussed below:
Figure 5.1: Parameters of Systems Variants
5.1 Life-Cycle Energy Use To allow for a relative comparison, Figure 5.2 displays life-cycle energy use across all variants from each
of the three systems.
Figure 5.2: Life-Cycle Energy
With respect to energy use, the tap systems are clearly the preferable drinking water delivery system.
Relative to tap water served in a reusable drinking vessel, single-use bottled systems have between 11-31
times higher use. Including recycled content in the bottles improves the performance of the bottled
B‐1: Regional bottled, virgin‐PET, spring water, landfil led. H‐1: PC jug, spring water, stainless bottle, recycledB‐2: Reg'l bottled, 25% rPET, spring water H‐2: PC jug, spring water, glass cup, recycledB‐3: Reg'l bottled, 25% rPET, municipal water H‐3: PC jug, municipal water, stainless bottle, landfil ledB‐4: Reg'l bottled, PLA, spring water H‐4: virgin‐PET jug, spring water, stainless bottle, lanfdilledB‐5: National bottled, 25% rPET H‐5: 25% rPET, spring water, stainless bottle, recycledB‐6: Overseas bottled, 25% rPET H‐6: PC jug, spring water, stainless bottle, extended distanceB‐7: Extended overseas, virgin‐PET
T‐1: Tap water, stainless bottleT‐2: Tap water, glass cup
0
5000
10000
15000
20000
25000
30000
35000
40000
MJ
System Variants
Life‐Cycle Energy Use

56
system relative to tap while increasing distribution distance makes the disparity more pronounced. The
greatest difference in energy use comes from a comparison of the extended overseas bottled water with
the tap system using the stainless steel bottle.
Relative to home and office delivery systems, the tap systems have between 35% and 55% of life-cycle
energy use. Both the HOD and tap systems energy use are heavily determined by the residential washing
of the reusable drinking vessel. What separates the systems is the energy use from jug production, bottling
and distribution in the HOD systems.
A comparison of single-use bottled and HOD systems shows that HOD systems are preferable with
respect to energy use by a wide margin. HOD systems use between 8% and 18% of the energy consumed
by bottled systems. The key factor in the difference in energy is single-use bottle production at regional
distances, joined by distribution energy for national and overseas bottled variants.
5.2 Life-Cycle Solid Waste For relative comparison, Figure 5.3 illustrates differences in life-cycle solid waste generation across all
variants from each of the three systems.
Figure 5.3: Life-Cycle Solid Waste
With respect to life-cycle solid waste generation, tap water systems are the preferred systems. Relative to
tap water served in a reusable drinking vessel, single-use bottled systems generate between 6-21 times
more solid waste. For single-use bottled systems the majority of solid waste comes from the end-of-life of
197.9
88.3 90.6
192.6
91.3 90.9
203.5
17.9 23.2 23.1 23.6 18.2 17.9 9.8 15.1
0
50
100
150
200
250
kilogram
s
System Variants
Life‐Cycle Solid Waste
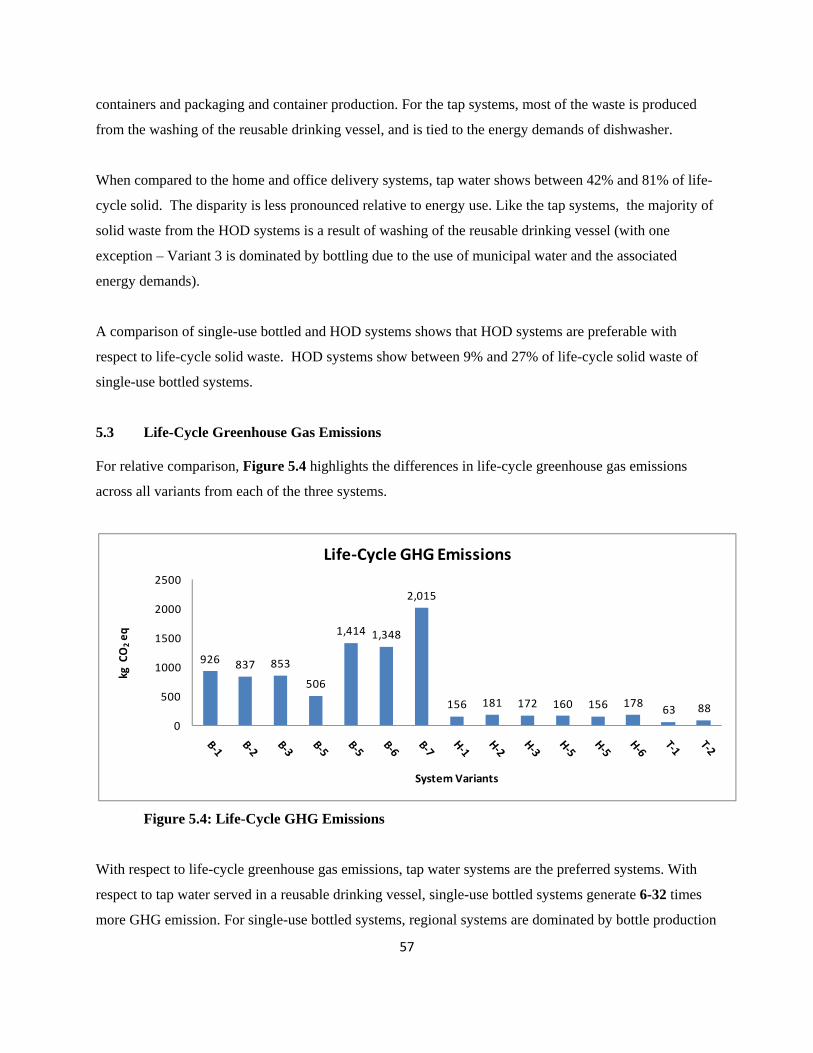
57
containers and packaging and container production. For the tap systems, most of the waste is produced
from the washing of the reusable drinking vessel, and is tied to the energy demands of dishwasher.
When compared to the home and office delivery systems, tap water shows between 42% and 81% of life-
cycle solid. The disparity is less pronounced relative to energy use. Like the tap systems, the majority of
solid waste from the HOD systems is a result of washing of the reusable drinking vessel (with one
exception – Variant 3 is dominated by bottling due to the use of municipal water and the associated
energy demands).
A comparison of single-use bottled and HOD systems shows that HOD systems are preferable with
respect to life-cycle solid waste. HOD systems show between 9% and 27% of life-cycle solid waste of
single-use bottled systems.
5.3 Life-Cycle Greenhouse Gas Emissions For relative comparison, Figure 5.4 highlights the differences in life-cycle greenhouse gas emissions
across all variants from each of the three systems.
Figure 5.4: Life-Cycle GHG Emissions
With respect to life-cycle greenhouse gas emissions, tap water systems are the preferred systems. With
respect to tap water served in a reusable drinking vessel, single-use bottled systems generate 6-32 times
more GHG emission. For single-use bottled systems, regional systems are dominated by bottle production
926 837 853
506
1,414 1,348
2,015
156 181 172 160 156 178 63 88
0
500
1000
1500
2000
2500
kg CO2eq
System Variants
Life‐Cycle GHG Emissions

58
while for national and overseas systems distribution produces the majority of emissions. For tap systems,
residential washing is responsible for the vast majority of emissions.
Compared with home and office delivery systems, tap water systems produce between 35% and 57% of
life-cycle greenhouse gas emissions. The generation of GHG emissions is highly correlated with energy
use, and similar to tap systems, the majority of emissions from the HOD systems are related to residential
washing of the reusable drinking vessel. The difference in emissions here can be attributed to jug
production, bottling operations and distribution in the HOD systems.
When single-use bottled and HOD systems are compared, we see that HOD systems produce between 8%
and 31% of the life-cycle emissions of single-use systems. Separating the systems are the emission
intensive single-use bottle production and distribution activities.
5.4 Life-Cycle Water Use The differences in life-cycle water use are highlighted in Figure 5.4 across all variants from each of the
three systems.
Figure 5.5: Life-Cycle Water Use
With respect to life-cycle water use, the municipal tap systems outperform both HOD and single-use
bottled systems by a considerable margin. Single-use bottled systems consume large amounts of water
954 943
1,303
954 965 943 979
779
961
1,139
793 793 782
366
547
0
200
400
600
800
1000
1200
1400
Gallons
System Variants
Life‐Cycle Water Use

59
indirectly through the power requirements of the systems. The HOD systems bottling process and
associated power requirements separate them from municipal tap systems.
The HOD system water use is dominated by power production, bottling process as well as the residential
washing of the reusable drinking vessel. Tap systems water use is dominated by residential washing. As
such, water use in tap and HOD systems is determined at least in part by the number of residential
washing cycles in the life-cycle which is a function of the choice of a reusable drinking vessel. Variants
H-2 and T-2 illustrate the impact of choosing the smaller 12 oz. cup (as opposed to the 18 oz. bottle).
With the assumed pattern of washing after every four uses, the glass cup is washed more times during the
course of delivering 1000 gallons of drinking water and thus consumes more water for washing.
Bottling municipal water (variants B-3 and H-3) increases water use substantially due to industry standard
treatment procedure for municipal water. At the bottling plant, municipal water undergoes reverse-
osmosis treatment, a process that generates 25% wastewater. Typically, spring water will not be subject to
reverse-osmosis treatment. As such, the highest life-cycle water use is associated with variants B-3 and
H-3 the systems that utilizes municipal water for bottling.
Aside from residential washing activities, it is the HOD bottling process that separates the single-use
bottled and HOD systems. The single-use bottling process produces wastewater at 6.7% of fill water. The
wastewater is water that has been used to rinse the bottles before filling. The HOD bottling process
produce one liter of wastewater per 1 gallon of fill, or 26% wastewater relative to the volume bottled.

60
Chapter 6
Conclusions
6.1 Key Findings and Recommendations for Improvement In all life-cycle impact categories the tap water systems outperformed both single-use bottled and HOD
systems by a margin of at least 45.1% and by as much as 96.9%. As the tap water systems life-cycle
impacts are essentially determined by the residential washing of the reusable drinking vessel, the energy,
solid waste, greenhouse gas and water use profile can be improved by reducing dishwashing burdens,
thereby more effectively leveraging their performance against the bottled systems. This can be
accomplished by reducing the frequency of washing (decrease to every 6-8uses?) or reducing the burdens
allocated to the drinking vessel by only washing when the dishwasher is loaded to capacity. The baseline
scenario for this study assumes the drinking vessel will be washed after every 4 uses, and allocates 3% of
dishwashing burdens to the tap water system. Washing less frequently and fully loading the dishwasher
can substantially reduce life-cycle burdens attributed to residential washing. See Appendix I for a
sensitivity analysis regarding the allocation of dishwashing burdens (energy, GHG’s, solid waste).
With the exception of water use, the HOD systems perform significantly better than single-use bottled
systems with respect to energy, solid waste and greenhouse gas emissions. HOD showed at most 31%
and as little as 7.7% of the life-cycle impacts of single-use bottled systems across energy, solid waste and
greenhouse gas emissions.
Like tap water systems, HOD systems can more effectively leverage their performance against single-use
systems by reducing the burdens associated with residential dishwashing. With the exception of HOD
Variant 3, under which municipal water is bottled, residential dishwashing is the dominant process
contributing to all life-cycle impact categories for the HOD systems. Reducing the burdens associated
with residential dishwashing has the potential to significantly mitigate life-cycle energy, solid waste,
greenhouse gas emissions and water use. After residential washing, the HOD bottling process is the
dominant contributor to life-cycle impacts of HOD systems.
Improvement in the bottling process aimed at reducing energy consumption and water use stand to
significantly improve the life-cycle profile of HOD systems. Bottling municipal water proved to increase

61
impacts in all categories, particularly with regard to water use. Further improvements in the life-cycle
impact profile of HOD systems may be achieved should bottler opt to bottle only spring water.
Single-use bottled systems were the worst performers with regard to energy use, solid waste and
greenhouse gas emissions by a wide margin. The production of petroleum based single-use bottles is the
dominant contributor to energy use that is between 11-18 times greater than that of tap water systems for
regionally distributed bottled water. When the distribution of bottled water is extended to reach a national
or international market, this difference grows to between 17-32 times the energy use seen in tap water
systems. Similar trends are seen in greenhouse gas emissions where regional bottled water life-cycle
emissions are between 6-15 times more than those from tap systems. For internationally distributed
bottled water, these emission climb to 22-32 times more than tap water systems. With regard to solid
waste, the end-of-life treatment of containers is the dominant factor in life-cycle of single-use bottled
water. Systems that send the empty bottles to a landfill generate roughly 14-20 times the solid waste of
tap water systems, while those that employ the recycling of bottles reduce this difference to 6-9 times.
The life-cycle energy and greenhouse gas profile of single-use bottled systems have potential for
improvement. First off, incorporating rPET (PET with recycled content) into the single-use bottles can
significantly reduce container production energy, a dominant contributor to both life-cycle energy and
GHG’s. Significant energy and greenhouse gas benefits result from offsetting intensive virgin material
production with the use of rPET. A 14% drop in container production energy and 10% drop in life-cycle
energy were observed with introduction of rPET (25% recycled content) into the single-use bottled
systems in this study. Increasing the percentage of recycled content (50%, 100%) in single-use bottles
would lead to commensurate reductions in energy use and greenhouse gas emissions. Integral to
increasing the use of rPET in single-use container production is recycling of containers after their useful
life. Recycled containers serve as feedstock for rPET, and facilitate energy and GHG savings associated
with a reduction in the production of virgin material. Further, in this study we observe recycling to
reduce life-cycle solid waste by greater than 50% for single-use systems as these containers are diverted
from a landfill.
Minimizing distribution is another strategy with the potential to significantly reduce life-cycle impacts of
single-use bottled water systems. We observed the distribution energy of a regional single-use bottled
water increase by 360% and 674% if distribution is expanded to reach a national and international market

62
respectively, contributing to a 45% and 98% increase in full life-cycle energy. Similar trends are seen in
life-cycle greenhouse gas emissions.
Using biopolymer PLA for the single-use bottles stands to improve life-cycle energy and greenhouse gas
profiles. In this study, PLA bottles led to a 10% decrease in container production energy relative to
virgin-PET. While less of a reduction than observed by using 25% rPET, PLA still shows substantial life-
cycle energy improvement. A 73% reduction in greenhouse gas emissions relative to virgin-PET is a
mainly function of plant specific CO2 offsets in place at the Natureworks PLA facility in Nebraska.
PLA’s affect on life-cycle solid waste is a somewhat unclear. While PLA is touted as a 100%
compostable polymer, it requires specialized facilities that create high-heat conditions. Natureworks
reports that roughly 150 of such facilities exist in the US; however systems are not currently in place for
the collection and transport of PLA to such facilities. As such, this study assumes that all PLA containers
are sent to a landfill. If the PLA composting market continues to develop and reasonable means for a
consumer to compost PLA exist, the life-cycle solid waste profile of a PLA bottled systems will show
considerable improvement.
As with HOD systems, single-use systems bottling municipal water results in increased impacts in all
categories, though particularly with regards to water use. Bottled municipal water offers no benefit over
water served from a tap, and as such should be avoided to better leverage single-use systems against
municipal tap systems with respect to life-cycle impacts.
6.2 Context of work The results of this study were mostly consistent with expectations prior to completing the work. Due to
the energy intensiveness of producing single-use plastic bottles, bottles systems were expected to perform
the worst with regard to energy use and greenhouse gas emissions, as was observed. Further, HOD
systems provided energy and GHG savings relative to single-use bottled systems, and municipal tap
systems resulted in the most favorable environmental profile. Several of the outcomes of the study were
somewhat unexpected. For example, we found that a nationally distributed bottled water (1500
distribution miles via truck) consumes more energy across the life-cycle than an overseas brand that
arrives in the U.S. via an ocean freighter (4900 miles of ocean freighter). Despite the much longer
distribution distance, the overseas water performs better with regard to energy use and GHG’s due to the
relative efficiency of ocean freight transport versus truck transport. Additionally, the dominance of

63
residential dishwashing of the reusable drinking vessel was unexpected (32-46% of HOD systems and 89-
94% of tap systems).
The results of this study are also in line with those of similar studies. Jungbluth (2006) found that tap
water results in less than 1% of the environmental impact of unrefrigerated bottled water. While the
comparative values from this study are somewhat higher than 1%, Jungbluth did not model the life-cycle
of a reusable drinking vessel associated with consuming tap water, nor the residential dishwashing of this
vessel. Van Hoof (2002) also found substantially lower energy, solid waste and emissions resulting from
consumption of tap water relative to bottled – a result also observed in this study. Finally, like Gleick and
Cooley (2008), this study found the energy requirements of bottled water that is transported short
distances (regionally) to be dominated by the energy used to produce the plastic bottles, while the energy
used to transport water long distances is comparable to or even greater than that used to produce the
bottles. While this finding is consistent with this study, Gleick’s range of estimated energy requirement
for producing bottled water was somewhat higher (5.6-10.2 MJ/l versus 4.4-8.8 MJ/l).
6.3 Implications As stated in Chapter 1, the goal of this study is to assess dominant systems for the delivery of drinking
water to a consumer household with respect to key life-cycle environmental impacts to determine the
preferred systems for delivering drinking water. It is clear that from an environmental perspective, tap
water systems are the preferred model for delivering drinking water to consumer households. With
respect to HOD and particularly single-use bottled water, municipal tap systems provide considerable
environmental advantage by minimizing energy use, greenhouse gas emissions and the generation of solid
waste. The life-cycle water use profile of tap systems due to residential washing activities is an Achilles
heel of these systems, but suggestion for improving performance in this regard have been made in section
6.1 above. While HOD systems do outperform single-use systems by a substantial margin, relative to tap
systems their toll on the environment with respect to energy, GHG’s and solid waste renders them
inferior.
This study was partly inspired by the current and growing backlash against bottled water (single-use) and
its purported environmental impacts. The overarching goal of this study was to systematically quantify
impacts of various drinking water systems, and recommend a course of action moving forward.
64
From an environmental perspective, it is easy to advocate the drinking of tap water as environmentally
preferable and thus the right choice when it comes to drinking water. However, consumers have been led
to believe that what is in the bottle is a superior product, and justifies the manufacturing of containers
from non-renewable fossil based resources and distribution that sometimes reaches half-way around the
world. This claim by water bottlers, that theirs is a superior product, has been challenged time and time
again by groups like the National Resource Defense Council (NRDC), who based on a four year study
completed in 1999, found major gaps in bottled water regulation and concluded that bottled water is not
necessarily safer than tap water. More recently, a 2008 Environmental Working Group study revealed a
surprising array of chemical contaminants in every bottled water brand analyzed. As such, the picture is
less clear. Many cite convenience as the reason they prefer bottled water to tap; other cites taste. While
consumer awareness of environmental issues is on the rise, and some reports show bottled water sales
flagging to its lowest growth rate since 1991 (Robinson-Jacobs, 2008), bottled water as a beverage
category is soundly established and will not be going away anytime soon. Be that as it may, while I do
advocate drinking tap water as the environmentally preferable and responsible choice, I also offer some
suggestions for strategies aimed at reducing the impact of bottled water.
Bottled Water Bans: A common principle in the environmental lexicon is that of the “3 R’s”, represent reduce, reuse and
recycle as a strategy for reducing the environmental impact of goods and services. In line with this
principle, bottled water bans would serve to reduce the production of single-use bottles for bottled water
thereby reducing environmental impacts. I do not advocate a universal ban on bottled, which I believe
would be not only impossible to administer but would interfere with appropriate uses of bottled water, of
which there are several. Certainly in emergency situations, such as natural disasters, bottled water may be
the only option for providing victims with drinking water. In this context, it is reasonable for aid
organizations or governments to distribute bottled water.
A more reasonable approach to reduce the consumption of bottled water is the implementation of bans at
the organizational level, for instance within city governments, universities even restaurants. This is a
trend that has already begun and is currently on the rise. Increasing awareness of the environmental
impacts of bottled water consumption has led to a growing list of U.S. mayors banning the purchase of
bottled water with city funds including the mayors of Los Angeles, San Francisco, Salt Lake City,
Chicago, Seattle and Toronto. This trend has recently moved beyond city governments. On May 5 2009,
New York Governor David Patterson signed an executive order directing state agencies to phase out the

65
purchase and use of bottle water at government workplaces. A growing list of U.S. colleges and
universities has taken similar action, as have some high-end restaurants in cities like New York and San
Francisco. This is certainly a beginning, and a trend that will hopefully continue into the future, possibly
expanding into new areas such as public schools and retailer, particularly bulk retailer like Costco, Sam’s
Club and Wal-Mart.
Expanded Bottle-Bills: Another strategy that has the potential to reduce the impact of the consumption of bottled water is the
expansion of state bottle bills. Ideally, this would encompass states that do not have bottle bills
implementing them, and those that do expanding them to cover non-carbonated bottled water. Currently
11 state have bottle bills that require consumers to place a deposit (5 or 10 cents) on the purchase of
certain beverage container. These bills provide an incentive for container recycling, as consumer may
recover their deposit by returning their bottles to the retailer. Increased recycling of beverage containers,
particularly bottled water, has the potential to provide considerable environmental benefit by keeping
bottles out of landfills and by reducing the need to extract raw materials from the earth and produce virgin
material from which to manufacture new bottles, thereby reducing energy use. At present, estimates state
that 86% of used water bottles end up in landfills (Larson, 2007). Government funded studies conducted
pre- and post- bottle bill show that the bills reduce litter by between 69% and 84%. Further, the nation’s
11 bottle bill states recycle 490 containers per capita per year while the nation’s 39 non-deposit states
recycle 191 containers per capita per year. This translates into recovery rates that are more than two
and a half times higher in bottle bill states than states without bottle bills (Gitlitz, 2003). As such, bottles
bill have tremendous potential to improve the recovery rate of single-use water bottles.
To date, three states, Oregon, New York and Connecticut have updated their bottle bills to include bottled
water (and other non-carbonated beverage containers) in 2009. Hopefully more will follow.
Education and Outreach: Much of the problem with bottled water is related to consumer choice. Consumers appear to desire bottled
water, and as long as that remains the case companies will capitalize on that desire by providing a bottled
water product- simple supply and demand. While there is a contingent of consumers aware of the myriad
environmental problems associated with the production and sales of bottled water, most are not. The most
effective way to reduce the consumption of bottled water may be to increase consumer awareness through
education and outreach campaigns. Currently there exist campaigns attempting to raise awareness of the
66
trade-offs associated choosing bottled over tap water. These include Corporate Accountability
International’s “Think Outside the Bottle” and Food and Water Watch’s “Tack Back the Tap”, to name a
few. While these campaigns have helped spark interest on college campuses, in city governments and
amongst restaurateurs, efforts need to be undertaken to reach a wider more mainstream audience. City
governments that have stopped purchasing bottled should make concerted efforts to publicize their
decision, or take s step further with city sponsored campaigns urging the public to do the same. For
example, since 1997, the city of Louisville, Kentucky has distributed more than 1.8 million refillable
“pure tap” bottles to residents in efforts to change consumer behavior and encourage support for
municipal tap systems (Larson, 2007). Perhaps sympathetic city officials nationwide can initiate
campaigns to target public schools. Recently, New York Governor David Patterson signed an executive
order halting state-agency purchasing of bottled water. As the first Governor to take such action,
Patterson is in a unique position to elevate the debate to a new level, and bring wider awareness to
residents of New York and beyond.
6.4 Future Work While this study provides a valuable assessment of the environmental impacts associated with various
drinking water distribution systems, and contributes sound evidence to the burgeoning bottled versus tap
water debate, there is still potential for future work on this topic.
Despite reports that state the opposite, many consumers still believe that bottled water is a superior
product and feel compelled to drink bottled water out of concern for the safety of their tap water. Others
cite bad taste as the reason they choose bottled over tap water. To improve both taste and purity, many
consumers choose to install home reverse-osmosis systems onto their municipal taps. These systems
include a variety of filter membranes, plastic filter casing, a pressurized water tank and various auxiliary
plumbing connections. Also, as reverse-osmosis is an active process (the reverse of osmosis, a passive
process that moves a solvent from an area of low solute concentration, through a membrane, to an area of
high solute concentration), and thereby requires energy. A future life-cycle study of tap water systems
could add another layer of depth by integrating the use of a home RO unit into the model. This would
include modeling the life-cycle impact of the production and disposal of the RO unit, as well as the
impacts of the unit’s energy demands.
With regard to the modeling of single-use bottled water systems that employ PLA bottles as their primary
container, a future study could add value by expanding the analysis involving PLA. For this study, I was
67
unable to procure life-cycle data describing the composting of PLA. Further, composting PLA requires
specialized facilities of which there are an estimated 150 in the United States. Due to this limited market,
I assumed that composting of PLA is not a reasonable option for an average consumer at this time. As
such I assumed PLA bottles were sent to a landfill. While the use of PLA in this study demonstrated the
energy and greenhouse gas benefits of manufacturing bottles out of PLA, composting was not part of the
analysis. Compostability, one of the most touted benefits of PLA, has the potential to significantly
improve life-cycle solid waste profile of PLA bottles and should be part of future studies evaluated
bottled water.
As the bottled water industry continues to come under fire for the impacts associated with their products,
innovation in beverage containers will be explored as a way to minimize impacts. Currently, many
bottled water companies are undertaking bottle light-weighting to reduce material use. Other companies
are exploring altering the composition of bottles. Recently, ENSO Bottles, LLC, developed a form of a
PET bottle that they claim will biodegradable within 1-5 years in microbial landfills, in either aerobic or
anaerobic conditions (Globe Net, 2009). There is, however, some debate as to whether the PET breaks
down completely or merely degrades into a many small PET particles.
In response to recent sharp criticisms, bottled water will evolve with the use of new products and the
employment of new practices. A future study of concerning the life-cycle impacts of drinking water
delivery systems incorporating new products and practices in the bottled water industry would provide
valuable insight into the response of the industry to external pressure and would serve to move the bottled
versus tap debate forward.

68
Bibliography:
Bohlmann, G.M. “Biodegradable Packaging Life-Cycle Assessment”. Environmental Progress 23.4,
2004. Burros, M. “Fighting the Tide: A Few Restaurants Tilt to Tap Water”. New York Times. 30 May 2007.
Web. 10 August 2008. Davis, Bill. Arbor Springs Water Company. Private conversation, 15 December 2008. Franklin Associates Ltd. “LCI Summary for Four Half-Gallon Milk Containers”. Prepared for
the Plastics Division of the American Chemistry Council. September 2008. Girard, R. “2008 Bottled Water Profits Down, Bottled Water Bans Up”. Polaris Institute. 19 February
2009. Web. 5 May 2009. Available at http://www.insidethebottle.org/2008-bottled-water-profits-down-bottled-water-bans
Gitlitz, J. “Facts about beverage container wasting and replacement.” Bottle Bill Resource Guide. January
2003. Web. 8 May 2009. Available at http://www.bottlebill.org/about/benefits/waste-facts.htm Gleick, P.H., Cooley, H.S. “Energy Implications of Bottled Water.” Environmental Research Letters
4.014009, 2009. Web. 13 April 2009. Globe-Net. “Biodegradable Water Bottle Introduced.” [18 March 2009; cited 8 May 2009]. Available
from http://www.globe-net.com/search/display.cfm?NID=4067&CID=8 Hamilton, D. “Closing the Loop on Material Selection”. Water and Wastes Digest Magazine. June 2001.
Web. Accessed 17 July 2008. IBWA (International Bottled Water Association), “Bottled Water: Path to Market, Natural vs. Public
Sources” [15 August 2008; cited 22 October 2009]. Available from http://www.bottledwater.org/public/flash/bottled-water-v33.swf
James, K., Campbell, S.L., Godlove, C. E. “Watergy: Taking Advantage of Untapped Energy and Water
Efficiency Opportunities in Municipal Water Systems”. Alliance to Save Energy and USAID, 2002, Washington D.C.
Jungbluth, N. “Comparison of the Environmental Impact of Drinking Water vs. Bottled Mineral Water”.
Manuscript for the SGWA information bulletin and GWA (Gas Water Sewage). 2006. Web. 15 May 2008.
Kchao, V. “Bottled Water: Social and Environmental Impacts and the Alternatives”. U.S. Mayors
Newspaper. 19 May 2008. Web. 5 May 2009. Keoleian, G., Spitzley, D., McDaniel, J.A. “Life Cycle Design of Milk and Juice Packaging”. National
Risk Management Research Laboratory, Office of Research and Development, U.S. Environmental Protection Agency, EPA 600/R-97/082, October 1997.

69
Larsen, J. “Bottled Water Boycotts: Back-to-the Tap Movements Gain Momentum.” Earth Policy Institute. 7 December 2007. Web. 10 May 2009. Available at http://www.earthpolicy.org/index.php?/plan_b_updates/2007/update68
Mayo Clinic Staff. “How Much Water Should You Drink Every Day?”. [updated April 19, 2008; cited
September 30 2009]. Available from http://www.mayoclinic.com/health/water/NU00283 NAPCOR. “2006 Report On Post Consumer PET Container Recycling Activity: Final Report”. [2007;
cited July 30, 2008]. Available from http://www.napcor.com/pdf/2006PET_Report.pdf Pacific Institute. “Bottled Water and Energy: A Factsheet”. [2008; cited July 15, 2008] Available from
http://www.pacinst.org/topics/water_and_sustainability/bottled_water/bottled_water_and_energy. html Robinson-Jacobs, K. “Bottled Water Sales Growth Slows to Trickle.” Dallas Morning News. 31 October
2008. Web. 10 May 2009. Rodwan, J. G. “Confronting Challenges: U.S. and International Bottled Water Developments and
Statistics for 2008”. Bottled Water Reporter. April/May 2009. Accessed July 15, 2008. Senior, D.A., and Nick Dege. “Technology of Bottled Water”. Ames, Iowa: Blackwell Publishing. 2nd
edition. 2005. Sivaraman, D., “Comparative Energy, Environmental, and Economic Analysis of Traditional and E-
Commerce DVD Rental Networks.” Journal of Industrial Ecology, Vol. 11, No. 3, pp. 77-91, 2007. Available at SSRN: http://ssrn.com/abstract=1005177
Van Hoof, G., Schowanek, D. “Comparative LCA of drinking water delivery systems: tap water, PuR
water filter and bottled water.” Abstract for the Society for Environmental Toxicology and Chemistry – Europe, 2002 Annual Meeting. Web. 15 May 2008. Available at http://abstracts.co.allenpress.com/pweb/setaceu2002/document/844
Woznica, D. “WU water bottle ban sparks efforts to follow suit around the world”. Independent Newspaper of Washington University – St Louis. 6 February 2009. Web. 15 April 2009.

70
Appendix A
Material Composition of Systems
Single-Use Bottled Systems:
This system represents the delivery of drinking water in single-use 500 ml bottles packaged into 24 packs.
In order to deliver 1000 gallons of drinking water to a consumer, this system requires 315.5 24-packs of
500ml bottles, for a total of 7571 units of bottled water. The material composition of this system includes
bottles, caps and the secondary packaging associated with 24-packs including a corrugated cardboard tray
and stretch wrap. See Table A-1 for the material composition of single-use bottled systems by mass.
Bottles caps and secondary packaging were weighed manually. The bottle and cap mass are the average
of five products available on the market today. The mass of the bottle was assumed to be the same
regardless of the material composition of the bottle (i.e. virgin-PET, rPET, PLA).
Table A-1
Home and Office Delivery Systems:
This system represents the delivery of drinking water in 5-gallon reusable jugs via a home and office
delivery system (HOD). The water is consumed via a reusable drinking vessel (bottle or cup). In order to
deliver the functional unit of 1000 gallons of drinking water, this systems requires the production of four
polycarbonate jugs (50 reuses each) or eight PET jugs (25 reuses each). Regarding the reusable drinking
vessel, this study assumed that 2 containers were required to deliver the full functional unit. The material
composition of this system includes the 5-gallon jugs and the reusable drinking vessel including a
Single‐unit mass
24‐packFunctional
Unit
(g) (g) (kg)
500 ml bottle 15.6 374.4 118.1Polypropylene Cap 2.1 50.4 15.9Cardboard Tray ‐ 83.1 26.2Stretch Warp ‐ 29.5 9.3
Drinking Water 500 12000 3785.4
Total: 3954.9
Note: water density assume 1 g/ml.

71
polypropylene cap associated with the steel bottle. The cap associated with the 5-gallon jug was
determined to represent less than 1% of the product systems by mass, and was excluded from this study.
See Table A-2 for the material composition of HOD systems by mass. The mass of a 5-gallon jug was
assumed the same for polycarbonate and PET. All weights were determined manually.
Table A-2
Municipal Tap Water Systems:
This system represents the delivery of drinking water to a consumer household by way of a municipal tap
water system. Drinking water is served in reusable drink vessel (bottle or cup). In consuming the
functional unit of 1000 gallons of drinking water this study assumes that two reusable drinking vessels are
needed. The material composition of the municipal tap water systems is composed solely of the reusable
drinking vessel. See Table A-3 for the material composition of municipal tap water systems by mass.
Table A-3
Single‐unit mass
Functional Unit
(kg) (kg)
PC Jug 0.73 2.92PET Jug 0.73 5.85Stainless Steel Bottle 0.14 0.28PP cap (steel bottle) 0.03 0.06Glass Cup 0.31 0.62
Single‐unit mass
Functional Unit
(kg) (kg)
Stainless Steel Bottle 0.14 0.28PP cap (steel bottle) 0.03 0.06Glass Cup 0.31 0.62

72
Appendix B
Production of Containers and Packaging
This appendix includes data for material production as well as fabrication of containers and packaging. In
some cases, material production and fabrication are shown separately while in others the data is rolled
together depending on the data source. The following processes are included in the appendix:
• Production of PET bottle/jug
• Production of Polypropylene (PP) cap
• Production of rPET bottle/jug
• Production of Polycarbonate (PC) jug
• Material production and fabrication of Polylactic Acid (PLA) bottle
• Production of Polyethylene (PE) wrap
• Production of corrugated cardboard tray
• Material production and fabrication of stainless steel bottle
• Production of glass kitchen cup
Production of PET bottle/jug:
PET (polyethylene terephthalate), is a thermoplastic polymer resin of the polyester family and consists of
polymerized units of the monomer ethylene terephthalate. The raw materials to make PET are
monoethylene glycol (MEG) and purified terephthalic acid (PTA) or dimethyl terephthalate (DMT)
temperature and vacuum. The raw materials undergo a series of esterification processes followed by
polymerization processes leading to the end product of amorphous PET. The amorphous PET then
undergoes another polymerization step, solid state polymerization to produce bottle grade PET.
To fabricate bottles, bottle grade PET resin undergoes a blow molding process. Resin melted and molded
into a hollow preform shape. The preform is then heated and introduced to increasingly high pressure air
in order to blow the preform into shape of the terminal blow mold. The end result is a finished PET
bottled. (Bousted, 2005)

73
Life-cycle data for the production of PET bottles from the extraction of raw materials through to the
production of a finished PET bottle were obtained from the Association of Plastics Manufacturers of
Europe (APME). Table B-1 displays data regarding energy use, greenhouse gas emissions and production
of solid waste associated with the production of PET bottles.
Table B-1: Production of PET bottles/jugs
Production of Polypropylene Caps:
Polypropylene is a thermoplastic polymer resin and consists of polymerized units of the monomer
propylene. The polymer is formed via addition polymerization where many monomers bond together via
rearrangement of bonds without the loss of any atom or molecule. This is in contrast to a condensation
polymer which is formed by a condensation reaction where a molecule, usually water, is lost during the
formation, such as the esterification process used to in the production of PET. The end result is
polypropylene resin. To fabricate caps, PP resin undergoes an injection molding process. Melted resin is
fed into a mold that is the reverse shape of the desired product. The melted plastic solidifies when it come
into contact with the cooled wall of the mold. The mold opens and the finished part is ejected. (Bousted,
2005)
Life-cycle data for the production of PP caps from the extraction of raw materials through to the injection
molding of PP resin into finished caps was generated by Franklin Associates, Ltd. was obtained from
SimaPro 7.0 Life-Cycle Software. Table B-2 displays data reflecting energy use, greenhouse gas
emissions and production of solid waste associated with the production of PP caps.
Process: unitEnergy Use (MJ LHV)
GHG Emissions(kg CO2 eq)
Solid Waste (kg)
PET bottle production per kg 103.9 4.4 0.0447source: APME

74
Table B-2: Production of Polypropylene caps
Production of rPET Bottles/Jugs: The data described here represents the production of PET bottles from recycled PET bottles, and is based
on a dataset developed by Franklin Associates, Ltd., for SimaPro 7.0 Life-Cycle Software. The Franklin
dataset was adapted to include the burdens associated with collection and reprocessing of the recycled
PET, due to the method of recycling allocation chosen for this study. The collection and reprocessing data
for recycling PET is based on the Buwal 6.0 database in SimaPro 7.0. Table B-3 displays life-cycle data
reflecting energy use, greenhouse gas emissions and production of solid waste associated with the
production of rPET bottles.
Table B-3: Production of rPET containers
Production of PC jug:
Polycarbonate is a thermoplastic polymer that is commonly produced by reacting phosgene with
bisphenol-A. To produce a hollow container, such as a jug, polycarbonate compound will undergo blow
molding. Melted plastic is extruded into a hollow tube (a parison) and captured by closing it into a cooled
metal mold. Low pressure air is blown into the parison, inflating it into the shape of the desired container.
Once the plastic has cooled, the mold is opened and the container ejected. (Bousted, 2005)
Process: unitEnergy Use (MJ LHV)
GHG Emissions(kg CO2 eq)
Solid Waste (kg)
PP cap production per kg 99.4 3.6 0.49
source: Franklin Associates, Ltd.
Process: unitEnergy Use (MJ LHV)
GHG Emissions(kg CO2 eq)
Solid Waste (kg)
rPET bottle per kg 46.1 2.56 0.39source: Franklin Associates, Ltd.; Buwal 6.0

75
This study uses data for the production of PC from the Association of Plastic Manufacturers of Europe
(APME) and blow molding data from Ecoinvent. Table B-4 displays life-cycle data reflecting energy use,
greenhouse gas emissions and production of solid waste associated with the production of PC containers.
Table B-4: Production of PC jug
Production of PLA Bottle:
Polylactic acid (PLA) is a biopolymer derived from renewable resources, such as corn starch. Bacterial
fermentation is used to produce lactic acid, which is then polymerized through a ring-opening
polymerization process to form PLA (Vink et al., 2003).
Data for the production of PLA is from Ecoinvent and is based on the production of PLA at the
Natureworks plant in Nebraska. The data reflects CO2 offsets through wind power certificates specific to
the plant. To produce bottles from PLA, the resin undergoes a blow molding process as described with
PET bottle production above. Table B-5 displays life-cycle data reflecting energy use, greenhouse gas
emissions and production of solid waste associated with the production of PLA bottles.
Table B-5: Production of PLA bottle
Process: unitEnergy Use (MJ LHV)
GHG Emissions(kg CO2 eq)
Solid Waste (kg)
Polycarbonate production per kg 113 6.78 0.155Blow molding per kg 28.5 0.857 0.003
Total 141.5 7.64 0.158
source: APME; Ecoinvent
Process: unitEnergy Use (MJ LHV)
GHG Emissions(kg CO2 eq)
Solid Waste (kg)
PLA production per kg 63.5 ‐0.0456 0.000Blow molding per kg 28.5 0.857 0.003
Total 92.0 0.81 0.003
source: Ecoinvent

76
Production of Polyethylene Wrap (LDPE):
Polyethylene is a thermoplastic polymer resin produced from the monomer ethylene. Low density
polyethylene is a particular type of PE, with a relatively low density. LDPE is produced using a high
pressure polymerization technology that is specific to LDPE. The end product is LDPE resin. To produce
PE wrap from LDPE, the resin undergoes a film extrusion, a process in which the resin is melted and
formed into a continuous profile. Molten plastic is gravity fed into the extruder, before heated further,
forced into a die to form a tube. Air is used to inflate the tube, as it travels upwards, continually cooling
and eventually passing through rollers that flatten the tube. The edges of the tube are split to produce two
flat film sheets, and the film is wound onto reels. (Bousted, 2005)
Life-cycle data for the production of PE wrap from Ecoinvent are displayed in Table B-6 and show
energy use, greenhouse gas emissions and production of solid waste.
Table B-6: Production of PE wrap
Production of Corrugated Cardboard Tray:
Corrugated containers are fabricated from a “sandwich” of three primary paperboard components: outer
liner, corrugating medium and inner liner. The liners are composed of unbleached Kraft paperboard, and
the medium of semi-chemical paperboard. (Franklin Associates)
The data used for the production of corrugated board was developed by Franklin Associates, Ltd., and
represents a typical U.S. average that contains 45% recycled content. This study assumes that the energy
required to fold corrugated board into a trap is negligible relative to the production of the material and
thus is not represented here. Table B-7 displays life-cycle data for the production of corrugated cardboard
with respect to energy use, greenhouse gas emissions and solid waste.
Process: unitEnergy Use (MJ LHV)
GHG Emissions(kg CO2 eq)
Solid Waste (kg)
PE wrap production per kg 92.6 2.36 0.0source: Ecoinvent

77
Table B-7: Production corrugated cardboard tray
Production of Reusable Stainless Steel Bottle:
Stainless steel is a steel alloy that is defined by a minimum of 11% chromium by mass. Stainless steel is
produced in an electric arc furnace where carbon electrodes contact recycled stainless scrap and various
alloys of chromium (and nickel, molybdenum etc. depending on the stainless type). A current is passed
through the electrode and the temperature increases to a point where the scrap and alloys melt. After some
additional processing to finalize the exact desired chemistry, the material is hot rolled into its final form, a
sheet of stainless steel. Some material receives cold rolling to further reduce the thickness as in sheets or
drawn into smaller diameters as in rods and wire. (Stainless Steel Information Center)
Food grade stainless steel is typically 18/8 stainless steel, defined by 18% chromium, 8% nickel
composition. Fabrication processes are used to transform 18/8 stainless steel from sheet form into a
reusable water bottle. This study uses Ecoinvent data to represent life-cycle impacts associated with the
production of 18/8 stainless steel and the processing required to fabricate a reusable water bottle. Table
B-8 displays data for the production of a stainless steel bottle with respect to energy use, greenhouse gas
emissions and solid waste. While the dataset did not include values for life-cycle solid waste, this was
deemed acceptable for this analysis due to the relatively small amount of stainless steel used to produced
the two bottles used in the systems analyzed in this study.
Table B-8: Production of stainless steel bottle
Process: unitEnergy Use (MJ LHV)
GHG Emissions(kg CO2 eq)
Solid Waste (kg)
Tray Production per kg 28.7 3.08 0.3source: Franklin Associates, Ltd.
Process: unitEnergy Use (MJ LHV)
GHG Emissions(kg CO2 eq)
Solid Waste (kg)
Stainlees steel production per kg 87.6 5.1 0.0Bottle fabrication per kg 45.1 2.6 0.0
Total 132.7 7.7 0.0
source: Ecoinvent

78
Production of a Glass Kitchen Cup:
Glass is manufactured by melting high-purity sand with other minerals including limestone, soda ash
(sodium carbonate), feldspar and post-consumer glass cullet. The mixture is melted, refined and
fabricated into a finished product, typically in an integrated operation. A procedure similar to blow
forming of plastics is used to fabricate the final container. Gobs of melted glass are dropped into a mold
and blown with compressed air to form the glass into the shape of the mold. (Franklin Associates)
This study used life-cycle data developed by Franklin Associates, Ltd. for the production of glass
containers to represent to fabrication of a generic glass kitchen cup. Table B-9 displays data for the
production of a glass container with respect to energy use, greenhouse gas emissions and solid waste.
Table B-9: Production of glass kitchen cup
Process: unitEnergy Use (MJ LHV)
GHG Emissions(kg CO2 eq)
Solid Waste (kg)
Glass Container Production per kg 12.7 0.92 0.08source: Franklin Associates, Ltd.

79
References:
Bousted, I. “Ecoprofiles of the European Plastics Industry: Polyethylene terephalate, LDPE, Polypropylene, Polycarbonate.” Plastics Europe. March 2005.
Franklin Associates Ltd., USA 1998 Database and descriptions from SimaPro 7.0 Life-Cycle Software.
The Stainless Steel Information Center. “Stainless Steel Overview: How is it Made?” Web. Accessed 10 May 2009. Available at http://www.ssina.com/overview/how.html
Vink, E.T.H., Ra’bago, K.R., Glassner, D.A., Gruber, P.R. “Applications of life cycle assessment to NatureWorks™ polylactide (PLA) production.” Polymer Degradation and Stability 2003;80(3):403-419.

80
Appendix C
Life-Cycle Water Use
This appendix presents the data for used to determine life-cycle water use of the systems analyzed in this
study. The data in this appendix refers to process related water use, and does not include the 1000 gallons
drinking water that is common to all systems.
Single-Use Bottled Systems: This study accounts for water use at three stages of the life-cycle of single-use bottled systems:
• Material production/fabrication of containers and packaging.
• Rinse water used in the bottling process.
• Wastewater from reverse-osmosis treatment during bottling operations (for municipally sourced water only.
• Water associated with power production.
• Water associated with transportation.
Material Production/Fabrication:
Water is consumed during the material production and fabrication of containers and packaging. Table
C-1 shows the data for water use by material.
Table C-1: Water use by material
Item Unit Water Use source:
PET bottles ltr/kg 3.5 (a)
Polypropylene (caps) ltr/kg 2.2 (a)
Polyethylene wrap ltr/kg 4.2 (a)
Corrugated board ltr/kg 6.7 (b)
(a) APME, Eco‐profiles of the European Plastics Industry(b) BUWAL, Ecobalance of Packaging Materials
81
Bottling Process:
The bottling process represented in this study consumes water for rinsing of single-use bottles at a rate of
6.72% of fill water (McCormack, 2008). For 1000 gallons of fill water this amounts to 67.2 gallons.
Reverse-Osmosis Treatment:
For those systems that use municipal water for bottling, the water will undergo reverse-osmosis treatment
at the bottling plant. Reverse-osmosis typically recovers 75% of feed water (McCormack, 2008), and thus
produces 25% wastewater. As such, to produce 1000 gallons of treated drinking water, 1333.3 gallons of
feed is required, and 333.3 gallons is discharged as wastewater.
Power Production:
The production of power consumes water. Thermoelectric power plants consumptive (evaporative)
water use is attributable to cooling processes. Evaporative water loss from the reservoir surfaces
associated with hydroelectric plants also results in water being evaporated for electrical
production. The national weighted average for thermoelectric and hydroelectric water use is 2.0 gal
(7.6 L) of evaporated water per kWh of electricity consumed at the point of end use. (NREL 2003).
For this study, 2.0 gallons of water use is attributed to each kWh of energy consumed across all
systems.
Transportation:
Fuels used for transportation (e.g. gasoline, diesel) require the consumption of water for their production.
For this study we assumed .15 gallon/mile (King, Webber 2008) water consumption for all modes of
transportation. While King and Webber purported this average value for light duty vehicles, a lack of
additional data deemed this estimate acceptable for transportation in this study. Water use burdens were
further scaled based on the mass of transported goods and capacity of transportation vehicles. While the
King/Webber study was not full life-cycle based, a vehicle’s life-cycle impacts are mostly attributed to
the use phase (~90%) due to the combustion of fossil fuels (Kasai, 2000).
Home and Office Delivery Systems:
This study accounts for water use at four stages of the life-cycle of HOD systems:
• Material production/fabrication of 5-gallon jugs.
• Rinse/wash water from the HOD bottling process.

82
• Wastewater from reverse-osmosis treatment during bottling operations (for municipally sourced water only.
• Water used during the residential dishwashing of the reusable drinking vessel.
• Water associated with power production.
• Water associated with transportation.
Material Production/Fabrication:
Water is consumed during the material production and fabrication of the reusable 5-gallon jugs. Table
C-2 shows the data for water use by material.
Table C-2: Water use by 5-gallon jug material
HOD Bottling Process:
The HOD bottling process represented in this study consumes water for washing and rinsing of 5-gallons
jugs at a rate of 1L per gallon of fill water (McCormack, 2008). For 1000 gallons of fill water this
amounts to 264.2 gallons.
Reverse-Osmosis Treatment:
See single-use bottled systems above.
Residential Dishwashing:
Water is consumed during the residential dishwashing of the reusable drinking container. Life-cycle water
use depends on the number of dishwashing cycles run. Data for water used during residential dishwashing
was obtained from the EPA’s Energy Star website. The average Energy Star dishwasher consumes 4
gallons of water per cycle (EnergyStar.gov).
Item Unit Water Use source:PET jugs ltr/kg 3.5 (a)Polycarbonate ltr/kg 4.0 (a)(a) APME, Eco‐profiles of the European Plastics Industry

83
Power Production: See single-use bottled systems above. Transportation: See single-use bottled systems above.
Municipal Tap Systems:
This study accounts for water use at during one life-cycle stage of municipal tap systems:
• Water used during the residential dishwashing of the reusable drinking vessel.
• Water associated with power production.
• Water associated with transportation.
Residential Dishwashing:
See HOD systems above.
Power Production: See single-use bottled systems above. Transportation: See single-use bottled systems above.

84
References:
EnergyStar.gov. “Dishwashers for Consumers”. [Cited 1 August 2008]. Available from http://www.energystar.gov/index.cfm?c=dishwash.pr_dishwashers
Kasai J, “Experiences and thoughts about Life Cycle Assessment in the Automotive Industry in
Japan.” Int J LCA 5 (5), (2000), 313–316 King, C.W., Webber, M.E., "The Water Intensity of Transportation", Journal of Environmental Science
and Technology, Vol. 42, (2008), 21, pp. 7866-7872 McCormack, Chris. Norland International, Inc. Private Conversation 18 December 2008.
Torcellini, P., et al. (2003) Consumptive Water Use for U.S. Power Production. NREL/TP-550-33905, 2003.

85
Appendix D
Municipal Water and Wastewater Treatment
This appendix presents the data for the municipal treatment and distribution of water to household tap
systems as well as the treatment of wastewater at a municipal plant. The data reflects energy usage at the
plant (for treatment and distribution to end-users in the case of water treatment) as well as the
consumption of chemicals for treatment.
Municipal Water Treatment:
The data for the municipal treatment of water is applied to several parts of this study:
• Treatment of drinking water for the municipal tap systems.
• Treatment of single-use bottled or HOD drinking water that is sourced from municipal systems (prior to entering a bottling plant).
• Treatment of influent water for use in residential dishwashing of reusable container for municipal tap and HOD systems.
• Treatment of influent water used for rinsing/washing in the single-use and HOD bottling processes.
Utilities withdrawal fresh water from either groundwater or surface water sources, which they treat as
necessary and distribute to customers. Depending on numerous factors including turbidity, microbial
content and pH of the influent, the water can be treated with chemicals such as alum for coagulation,
filtered through sand or membranes and disinfected with some form of a chlorine compound.
Energy
The primary data source for energy used during municipal water treatment is a survey of utilities across
the U.S. completed as part of a study by the American Water Works Association. The study “Energy
Index Development for Benchmarking Water and Wastewater Utilities” involved the development of a
statistically representative sample of U.S. utility energy use and characteristics. Surveys were sent to

86
utilities resulting in a final filtered data set of 122 water treatment plants. The utilities provided data
concerning average daily flow as well as plant energy consumption including electricity and other fuels.
A weighted average (by flow volume) of energy use was computed across all plants that included
purchased electricity as well as natural gas used at the plant. Energy use is for plants operations as wells
as subsequent distribution of water to end-users. Table D-1 presents average estimated energy use at U.S
municipal water treatment plants. Energy consumption by plant varied from .26 kWh/1000 gallons to 7.25
kWh/1000 gallons. The life-cycle impacts of plant energy use were determined with the use of SimaPro
7.0 Life-Cycle software.
Table D-1: Average Estimated Energy Use at U.S Municipal Water Treatment Plants
Chemicals
Water treatment plants use a variety of chemicals as part of the treatment process. Chlorine, chloramine
or hypochlorite is commonly used for disinfection, sodium hydroxide for pH adjustment, alum or
polymers for coagulation to name a few. Estimates for per gallon chemical use at a water treatment plant
are based on usage and flow data from the Ann Arbor Water Treatment plant during a five year period
from January 2000 through December 2005 (Tripathi, 2007). While the data for Ann Arbor cannot be
taken as representative of all plants in the U.S., this was the only dataset available for chemical use at a
water treatment plant and was thus deemed acceptable for this study. Table D-2 presents chemical usage
at the Ann Arbor Water Treatment plant as used for analysis in this study. Life-cycle impacts associated
with the production of these chemicals were determined with SimaPro 7.0 and are also presented I Table
D-2.
Electricity Use
Natural Gas Use
kwh thermsper million gallons 1,629.88 41.63 per 1000 gallons 1.63 0.04163per gallon 0.00163 4.163E‐05Source: AWWA

87
Table D-2: Treatment Chemical Usage at Ann Arbor Water Treatment Plant
Municipal Wastewater Treatment:
The data for the municipal wastewater treatment is applied to several parts of this study:
• Treatment of effluent water from single-use and HOD bottling operations used for bottle rinsing/washing.
• Treatment of effluent water from residential dishwashing of reusable container for municipal tap and HOD systems.
Wastewater from industries and most households flows to a local wastewater treatment plant where
pollutant levels are reduced before discharge to the environment. Wastewater is treated in stages
involving various treatment technologies. The specific treatment type and level depends on the plant as
well as the quality of the influent.
Primary treatment of wastewater involves straining of the influent to remove all large objects. Next, the
water is routed into a large tank where gravity settling takes place. Solids sink to the bottom while oil and
grease rise to the top and are skimmed off the surface.
Treatment Chemical lbs/gallonEnergy Use (MJ LHV)
GHG Emissions (kg CO2 eq)
Solid Waste source:
(a)Lime 0.0016927 6.50 1.25 0.22 (b)Sodium Hypochlorite 0.0000307 18.10 0.90 0.00 (c)Carbon Dioxide 0.0001677 11.20 0.22 0.00 (b)Oxygen 0.0000256 5.59 0.22 0.00 (b)Sodium Hydroxide 0.0001331 19.70 1.15 0.07 (b)Sodium Hexametaphosphate 0.0000091 206.00 12.70 0.94 (d)Ammonia 0.0000087 35.80 2.28 0.01 (d)Sodium Silico Fluoride 0.0000378 206.00 12.70 0.94 (e)(a) Life‐Cycle Energy and Emissions for Municipal Water and Wastewater Services. Tripathi, Malavika(b) SimaPro 7.0 ‐ BUWAL250, Eco‐indicator 95(c) SimaPro 7.0 ‐ Ecoinvent, Eco‐indicator 95(c) SimaPro 7.0; NREL, ‘Life‐cycle Inventory of Biodiesel fuel and Petroleum Diesel fuel’.(e) SimaPro 7.0 ‐ Industry Data 2.0, APME, Eco‐indicator 95
Life‐Cycle Impacts

88
Secondary treatment is meant to substantially degrade the biological content of the wastewater through
the use of microorganism and other methods including activated sludge, trickling filtration, rotating
biological contactors and lagoons and oxidation ponds.
Advanced or Tertiary treatment is the final stage of wastewater treatment and serves to raise the
effluent quality before it is discharged into the receiving environment. This stage often includes additional
filtration, nutrient removal and a final disinfection step. (Metcalf & Eddy, 2004)
Energy
As with the water treatment, the primary data source for energy used during the wastewater treatment
process is a survey of utilities across the U.S. completed as part of a study by the American Water Works
Association - “Energy Index Development for Benchmarking Water and Wastewater Utilities”. Surveys
were sent to utilities resulting in a final filtered data set of 243 wastewater treatment plants. The utilities
provided data concerning average daily flow as well as plant energy consumption including electricity
and other fuels.
A weighted average (by flow volume) of energy use was computed for all plants that included purchased
electricity, natural gas and fuel oil used at the plant. Because the water from washing drinking containers
and rinsing bottles is not expected to contribute bio-solids to the wastewater treatment process, the energy
reported below has been scaled down. According to “Wastewater Engineering; Treatment, Disposal and
Reuse” (Metcalf & Eddy, 2004) approximately 56% of all energy use in a typical wastewater treatment
plant is associated with the treatment of bio-solids through the activated sludge process. This energy has
been removed since bio-solids will not be produced by the systems in this study. Table D-3 presents
average estimated energy use at U.S municipal water treatment plants. The life-cycle impacts of plant
energy use were determined with the use of SimaPro 7.0 Life-Cycle software.

89
Table D-3: Average Est. Energy Use at U.S Municipal Wastewater Treatment Plants
Chemicals
Wastewater treatment plants use a wide range of chemicals as part of the treatment process depending on
the level of treatment desired and the characteristics of the influent. For this study, the estimate of
chemical usage is based on data reported for three wastewater treatment plants, Ann Arbor, MI, Ypsilanti,
MI and Laguna, CA. While these three utilities cannot be assumed as representative of all plants across
the U.S., the energy for chemical production accounts for ~10% of the life-cycle energy use at all three
utilities. Because it represents such a small portion of total wastewater treatment energy, an estimate of
this type was deemed acceptable. Table D-4 presents average chemical usage across three wastewater
treatment plants as used for analysis in this study. Life-cycle impacts associated with the production of
these chemicals were determine with SimaPro 7.0 and are also presented I Table D-4.
Table D-4: Chemical Usage at U.S Municipal Wastewater Treatment Plants
Electricity Use
Natural Gas Use
Fuel Oil Use
kwh therms gallons
per million gallons 1,640.69 17.10 0.7222per 1000 gallons 1.64 0.02 0.0007per gallon 0.0016 1.7E‐05 7.2E‐07Source: AWWA
Treatment Chemical lbs/gallonEnergy Use (MJ LHV)
GHG Emissions (kg CO2 eq)
Solid Waste (kg)
source:(a)
Lime 0.000309 6.50 1.25 0.22 (b)Ferric Chloride 0.000112 17.60 0.85 0.00 (c)Ferrous Chloride 0.000064 17.60 0.85 0.00 (c)Hypochlorite 0.000014 18.10 0.90 0.00 (c)Alum 0.000017 6.29 0.27 0.00 (b)(a) Life‐Cycle Energy and Emissions for Municipal Water and Wastewater Services. Tripathi, Malavik(b) SimaPro 7.0 ‐ BUWAL250, Eco‐indicator 95(c) SimaPro 7.0 ‐ Ecoinvent, Eco‐indicator 95
Life‐Cycle Impacts

90
References
Metcalf and Eddy. “Wastewater Engineering: Treatment and Reuse; 4th Edition.” New York: McGraw Hill. 2004.
Tripathi, M. “Life-Cycle Energy and Emissions for Municipal Water and Wastewater Services: Case
Studies of Treatment Plants in U.S. Accessed at http://deepblue.lib.umich.edu/handle/2027.42/50474

91
Appendix E
Water Bottling Operations
This appendix describes the data used to represent operations at a bottling plant, including bottling for
single-use bottled systems and home and office delivery systems. Bottling operations include the
activities of purifying the water and filling the bottles, and in the case of the single-use bottled systems,
packaging the bottles into 24-packs.
Treatment Processes:
This analysis includes the bottling of water acquired from municipal sources as well as that acquired
directly from natural sources such as a spring. Water acquired from municipal sources will undergo
filtration followed by reverse osmosis, UV disinfection and ozone treatment prior to being used to fill
bottles. With spring water, bottlers normally forego the reverse osmosis step (McCormack, 2008)).
Filtration:
The purpose of filtration is to remove physical particles from the water. Filtration is a physical process
that employs various media including screens, membranes or granular materials (Senior, Dege, 2005).
Reverse-Osmosis:
Reverse-osmosis is a diffusion controlled membrane process that is effective at removing organic matter
from water. It works by using pressure to force a solution through a membrane, retaining the solute on
one side and allowing the pure solvent to pass to the other side. A typical reverse-osmosis process
requires a pump, membranes in a housing element, control valves and sensors (including pressure gauges
and flow meters) (Senior, Dege, 2005).
Ultraviolet Disinfection:
UV irradiation is an antimicrobial treatment method that disinfects water by degrading the nucleic acid in
bacterial cells. Most UV disinfection units have a tubular arrangement that pass water by a
perpendicularly mounted mercury discharge lamp (Senior, Dege, 2005).

92
Ozone Treatment:
Ozone treatment is a chemical oxidation process that uses ozone to oxidize reduced organic species in
order to destroy compounds that can cause undesirable tastes and odors. In particular, ozone treatment is
widely used in the bottled water industry to remove dissolved iron or manganese (Senior, Dege, 2005).
Single-Use Bottling:
Data for the energy demands of bottling for single-use bottled systems was obtained from Norland
International, Inc., provider of turnkey technology solutions for the bottled water industry. Norland
International designs and manufactures a variety of complete bottling lines. Technical specifications
including power requirements for a small bottling line (500ml-1L bottles) were provided by Norland. The
bottling line consists of the water treatment technology, bottle rinser/filler/capper/labeler and conveyor
systems that move the bottled water through various other packaging activities. The final product is 24-
packs of 500ml bottled water packaged in cardboard track and wrapped in PE shrink wrap. The process of
rinsing bottles generates wastewater at a rate of 6.7% of fill. As such, included in the single-use bottling
results is the municipal water treatment of the influent water used for rinsing and the municipal
wastewater treatment of the effluent. The water/wastewater treatment energy requirements are not
included in this appendix, but are described in Appendix D. Power requirements for the small bottling
line used for this study are shown in Table E-1 below.
Home and Office Delivery Bottling:
Data for the energy demands of bottling for HOD systems was obtained from Norland International, Inc.
Technical specifications including power requirements for a large bottling line (3-5 gallon jugs) were
provided by Norland. The bottling line consists of the water treatment technology followed by a bottle
washing/filling unit. The washing, which allows the 5-gallon jugs to be reused multiple times, involves a
pre-rinse, a wash with 140F water, and a final rinse. The washing/rinsing process generates 1 liter of
wastewater per 1 gallon of fill water. As such, included in the HOD bottling results is the municipal water
treatment of the influent water used for washing/rinsing and the municipal wastewater treatment of the
effluent. The water/wastewater treatment energy requirements are not included in this appendix, but are
described in Appendix D. Power requirements for the large bottling line used for this study are shown in
Table E-2 below. Also included in the data used to estimate HOD bottling energy use is the energy (heat
from natural gas) required to heat the water for washing, shown in Table E-3.

93
Table E-1: Small Bottling Line Power/Energy Requirements
Small Bottling Operation ‐ 500ml:Norland International System capable of filling/labelling/packaging 4500 bottles/hour.Functional Unit of 1000 gallons (7571 bottles) = 1.68 hours of operation.
System Component KW/Hr KWh/1000 gallonsPre‐Treatment Carbon Filter 0.1 0.17
Water Softener 0.1 0.17UV System 0.6 1.01
RO System (10,000 gpd)1 5.0 12.00Ozone System 6.1 10.26Bottle Rinser 0.3 0.50Bottle Filler 2.6 4.37Labeler/Capper 1.0 1.68Cincher 1.9 3.20Conveyor System (36') 0.4 0.67Bottle Unscrambler 2.3 3.87Date Coder 0.2 0.34Conveyor System (14') 0.4 0.67Case Packer 5000 0.8 1.35Shrink Pack 5000 16.0 26.92
Total for 1000 Gallons:
Municipal Source2: 67.18
Spring/Well Source2: 55.18
Source: Norland International, Inc., SP5000 system. Notes: [1] For 10,000 gpd, 8 hour work day, RO unit runs 24 hours.
[2]Water sourced from municipal supplies require RO treatment while Spring/Well water does not.
Filling & Packing
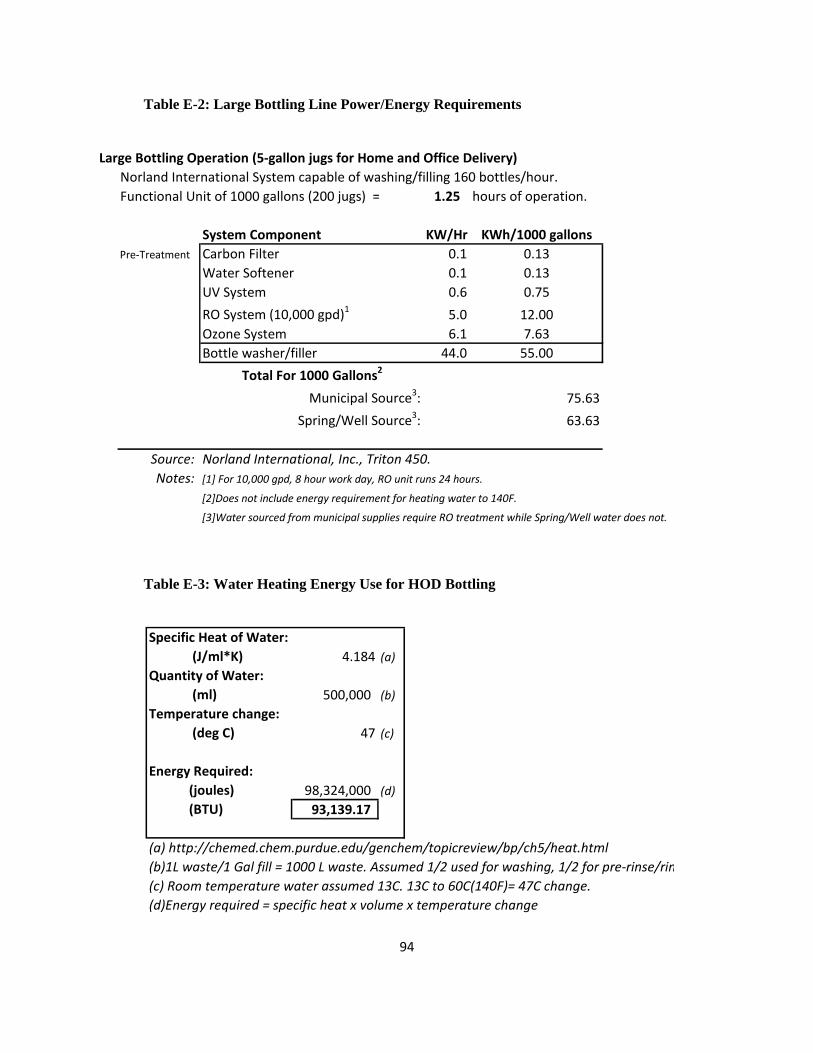
94
Table E-2: Large Bottling Line Power/Energy Requirements
Table E-3: Water Heating Energy Use for HOD Bottling
Large Bottling Operation (5‐gallon jugs for Home and Office Delivery)Norland International System capable of washing/filling 160 bottles/hour.Functional Unit of 1000 gallons (200 jugs) = 1.25 hours of operation.
System Component KW/Hr KWh/1000 gallonsPre‐Treatment Carbon Filter 0.1 0.13
Water Softener 0.1 0.13UV System 0.6 0.75
RO System (10,000 gpd)1 5.0 12.00Ozone System 6.1 7.63Bottle washer/filler 44.0 55.00
Total For 1000 Gallons2
Municipal Source3: 75.63
Spring/Well Source3: 63.63
Source: Norland International, Inc., Triton 450. Notes: [1] For 10,000 gpd, 8 hour work day, RO unit runs 24 hours.
[2]Does not include energy requirement for heating water to 140F.
[3]Water sourced from municipal supplies require RO treatment while Spring/Well water does not.
Specific Heat of Water: (J/ml*K) 4.184 (a)
Quantity of Water: (ml) 500,000 (b)
Temperature change: (deg C) 47 (c)
Energy Required: (joules) 98,324,000 (d) (BTU) 93,139.17
(a) http://chemed.chem.purdue.edu/genchem/topicreview/bp/ch5/heat.html(b)1L waste/1 Gal fill = 1000 L waste. Assumed 1/2 used for washing, 1/2 for pre‐rinse/rin(c) Room temperature water assumed 13C. 13C to 60C(140F)= 47C change. (d)Energy required = specific heat x volume x temperature change
95
References: IBWA (International Bottled Water Association), “Bottled Water: Path to Market, Natural vs. Public
Sources” [15 August 2008; cited 22 October 2009]. Available from http://www.bottledwater.org/public/flash/bottled-water-v33.swf
McCormack, Chris. Norland International, Inc. Private Conversation 18 December 2008. Senior, D.A., and Nick Dege. “Technology of Bottled Water”. Ames, Iowa: Blackwell Publishing. 2nd
edition. 2005. Globe-Net. “Biodegradable Water Bottle Introduced.” [18 March 2009; cited 8 May 2009]. Available
from http://www.globe-net.com/search/display.cfm?NID=4067&CID=8
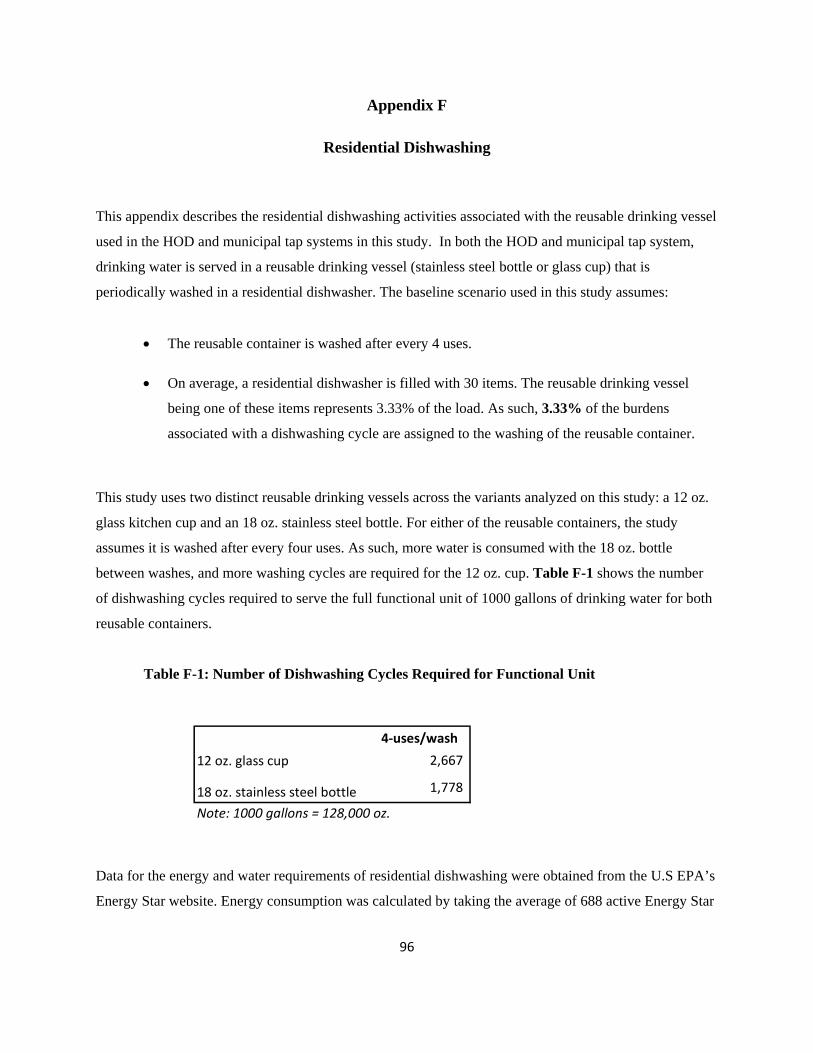
96
Appendix F
Residential Dishwashing
This appendix describes the residential dishwashing activities associated with the reusable drinking vessel
used in the HOD and municipal tap systems in this study. In both the HOD and municipal tap system,
drinking water is served in a reusable drinking vessel (stainless steel bottle or glass cup) that is
periodically washed in a residential dishwasher. The baseline scenario used in this study assumes:
• The reusable container is washed after every 4 uses.
• On average, a residential dishwasher is filled with 30 items. The reusable drinking vessel
being one of these items represents 3.33% of the load. As such, 3.33% of the burdens
associated with a dishwashing cycle are assigned to the washing of the reusable container.
This study uses two distinct reusable drinking vessels across the variants analyzed on this study: a 12 oz.
glass kitchen cup and an 18 oz. stainless steel bottle. For either of the reusable containers, the study
assumes it is washed after every four uses. As such, more water is consumed with the 18 oz. bottle
between washes, and more washing cycles are required for the 12 oz. cup. Table F-1 shows the number
of dishwashing cycles required to serve the full functional unit of 1000 gallons of drinking water for both
reusable containers.
Table F-1: Number of Dishwashing Cycles Required for Functional Unit
Data for the energy and water requirements of residential dishwashing were obtained from the U.S EPA’s
Energy Star website. Energy consumption was calculated by taking the average of 688 active Energy Star
4‐uses/wash
12 oz. glass cup 2,667
1,778
Note: 1000 gallons = 128,000 oz.
18 oz. stainless steel bottle

97
residential dishwashers. Table F-2 displays the average energy and water burdens associated with
residential dishwashing.
Table F-2: Average Environmental Burdens from Residential Dishwashing
Table F-3 displays the life-cycle energy and water use burdens associated with each of the reusable
drinking vessels as evaluated in this study at 3% of each dishwashing cycle.
Table F-3: Energy and Water Use by Reusable Container Type
kWh/cycle: 1.39
Avg. H2O/cycle, gal: 4source: EnergyStar
12 oz. glass cupkWh used: 111.40water used: 320
18 oz. stainless steel bottle
kWh used: 74.26water used: 213.33

98
Appendix G
Transportation
This appendix describes the data used in this study for transportation/distribution at various stages of the
life-cycle system. Included are data for transportation via:
• Single-unit diesel truck
• Diesel tractor-trailer
• Passenger car
• Delivery van
• Diesel Locomotive
• Ocean Freighter
Single-Unit Diesel Truck:
The single-unit diesel truck is used in this study for the distribution of single-use-bottled water of less
than 100 miles including transportation from a bottler to a regional distributor and from a distributor to a
retail store. This study assumes that a single-unit truck (versus a tractor-trailer) is used for short distance
freight trucking (<100 miles). Data for transportation via a single-unit diesel truck from Franklin
Associates is shown in Table G-1.
Table G-1: Single-Unit Diesel Truck Transport
unitEnergy
(MJ LHV)GHG's
(kg CO2 eq)Solid waste
(kg)
per tkm 2.88 0.209 0.00109
Source: Franklin Associates, Ltd.

99
Diesel Tractor-Trailer:
The diesel tractor-trailer truck is used in this study for road transportation distances of greater than 100
miles including the distribution of single-use bottled water in variants 5 and 7. This study assumes that a
diesel tractor-trailer (versus a single-unit truck) is used for long-distance freight trucking (>100 miles;
1500 miles in this study). ). Data for transportation via a diesel tractor-trailer from Franklin Associates is
shown in Table G-2.
Table G-2: Diesel Tractor-Trailer Transport
Passenger Car:
The passenger car is used in this study for the transport of bottled water from a retail store to a consumer
household. This study assumes that each 24-pack of bottled water consumed is purchased at a retail store
as one of thirty items purchased, and thus receives 3.33% of the burdens of transport for each trip to the
store. Each 24-pack of bottled water is allocated one retail trip. Burdens for retail transport are based on
distance rather than weight, as it was assumed that the weight of an average load of groceries will not
substantially affect the fuel consumption of the vehicle. The average roundtrip distance to a retail store in
the U.S. is 8 km (Sivaraman, 2007). Data for transportation via a passenger vehicle are shown in Table
G-3.
Table G-3: Passenger Car Transport
unitEnergy
(MJ LHV) (kg CO2
eq)Solid waste
(kg)
per tkm 1.02 0.0744 0.000388
Source: Franklin Associates, Ltd.
unitEnergy
(MJ LHV) (kg CO2
eq)Solid waste
(kg)
per km 0.00292 0.000227 1.12E‐08
Source: Delft Technical University, Netherlands, IDEMAT 2001 database

100
Delivery Van:
The delivery van is used in this study for the delivery of HOD bottled water, and the pickup of empty 5-
gallon jugs after the consumption of the drinking water. The study employs one-way transportation
distance of 10/20 miles as part of a HOD delivery route, depending on the variant. Burdens are calculated
by weight and consist of the weight of jugs and water on delivery, and the weight of empty jugs on the
return trip. Data for transportation via a delivery van are shown in Table G-4.
Table G-4: Delivery Van Transport
Diesel Locomotive:
The diesel locomotive is used in this study for the transport of overseas single-use bottled water from the
bottling plant to a sea port. This model is roughly based on transportation logistics used by Evian ™,
which includes ~300 miles of rail travel from Évian-les-Bains, France to the Port of Marseilles (where it
bottled water is ultimately loaded onto an ocean freighter and shipped). Data for rail transport using a
diesel locomotive are shown in Table G-5.
Table G-5: Diesel Locomotive Transport
unitEnergy
(MJ LHV) (kg CO2
eq)Solid waste
(kg)
per tkm 7.38 0.553 0
Source: BUWAL 6.0
unitEnergy
(MJ LHV)GHG's (kg CO2
Solid waste (kg)
per tkm 0.261 0.0191 0.0000992Source: Franklin Associates, Ltd.

101
Ocean Freighter:
The ocean freighter is used in this study for the transport of overseas single-use bottled water from the
Port of Marseilles, France to the Port of New York, ~4500 miles. Data for ocean freighter transport are
shown in Table G-6.
Table G-6: Ocean Freighter Transport
unitEnergy
(MJ LHV)GHG's (kg CO2
Solid waste (kg)
per tkm 0.224 0.0166 0.0000847Source: Franklin Associates, Ltd.

102
Appendix H
End-of-Life Disposition
This appendix describes the data used for end-of-life disposition of containers and packaging including
single-use bottles and caps, secondary packaging, HOD 5-gallon jugs and the reusable drinking vessel.
In this study, materials are either sent to a land fill or are recycled at the end of their useful life. It is
assumed that PP caps and all secondary packaging are sent to a land fill regardless of the variant at issue,
while single-use and HOD containers are either recycled or land filled. Reusable drinking vessels
(stainless steel bottle, glass cup) are recycled (steel bottle) or landfilled (glass cup).
Land Filling:
The land filling model used in this study is based on data derived from Swiss systems for waste disposal
in a landfill. The inventory data for land filling is based on the average composition of materials (PET, PP
etc.) in municipal waste in Switzerland, with material specific transfer coefficients. The data includes
waste collection, waste water treatment, sludge treatment, sludge incineration and energy recovery from
landfill methane gas. With regards to PLA, theoretically a PLA bottle degrading in a landfill would
release CO2/methane; the temperature inside of modern sanitary landfills, however, is likely too low for
biodegradation (and subsequent CO2/methane releases). As such, I assumed no PLA biodegradation
occurs in the land fill.
Data for the land filling of various materials are shown in Table H-1 below.
Table H-1: Land Filling of Various Materials
per kg material Energy(MJ LHV)
GHG's(kg CO2 eq)
Polyethylene Teraphthalate 0.198 0.194Polycarbonate 0.198 0.194 (a)Polylactic acid 0.198 0.194 (a)Polyethylene 0.204 0.288Polypropylene 0.201 0.244Glass 0.193 0.014Corrugated Cardboard 0.343 0.0195
(a) Data for PC and PLA was not available, assumed same as PET.
Source: BUWAL (Swiss Agency for Environment, Forests and Landscapes

103
Recycling:
The approach to recycling used in this analysis is to assign full burdens for virgin material production and
end-of-life disposal to the product system for which they occur. As such, all burdens for virgin material
production and initial product fabrication are assigned to the first product system using the material. The
first system bears no disposal burdens for any material that is recovered and recycled for use in a second
product system. Postconsumer material recovered from the first system comes into the second system free
of its virgin material burdens. The system using the postconsumer material (rPET bottles/jugs) bears the
full burdens of collecting and reprocessing the material for use in the second product system, as well as
well as the full burdens for the second product fabrication and use. The system using the postconsumer
recycled material also bears the full burdens for disposal of the material at the end of life. Burdens
associated with the recycling of PET are accounted for in the data for the production of rPET bottles as
described in Appendix B.
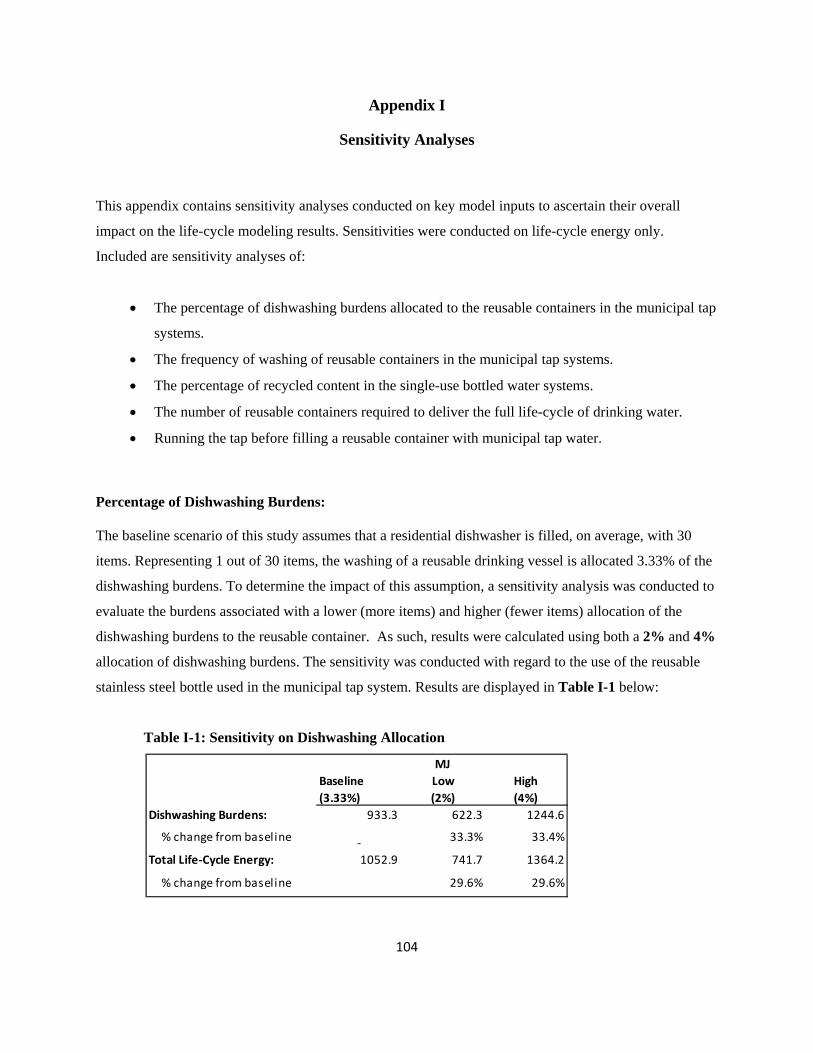
104
Appendix I
Sensitivity Analyses
This appendix contains sensitivity analyses conducted on key model inputs to ascertain their overall
impact on the life-cycle modeling results. Sensitivities were conducted on life-cycle energy only.
Included are sensitivity analyses of:
• The percentage of dishwashing burdens allocated to the reusable containers in the municipal tap
systems.
• The frequency of washing of reusable containers in the municipal tap systems.
• The percentage of recycled content in the single-use bottled water systems.
• The number of reusable containers required to deliver the full life-cycle of drinking water.
• Running the tap before filling a reusable container with municipal tap water.
Percentage of Dishwashing Burdens: The baseline scenario of this study assumes that a residential dishwasher is filled, on average, with 30
items. Representing 1 out of 30 items, the washing of a reusable drinking vessel is allocated 3.33% of the
dishwashing burdens. To determine the impact of this assumption, a sensitivity analysis was conducted to
evaluate the burdens associated with a lower (more items) and higher (fewer items) allocation of the
dishwashing burdens to the reusable container. As such, results were calculated using both a 2% and 4%
allocation of dishwashing burdens. The sensitivity was conducted with regard to the use of the reusable
stainless steel bottle used in the municipal tap system. Results are displayed in Table I-1 below:
Table I-1: Sensitivity on Dishwashing Allocation
Baseline (3.33%)
Low (2%)
High (4%)
Dishwashing Burdens: 933.3 622.3 1244.6
% change from baseline ‐ 33.3% 33.4%
Total Life‐Cycle Energy: 1052.9 741.7 1364.2
% change from baseline 29.6% 29.6%
MJ
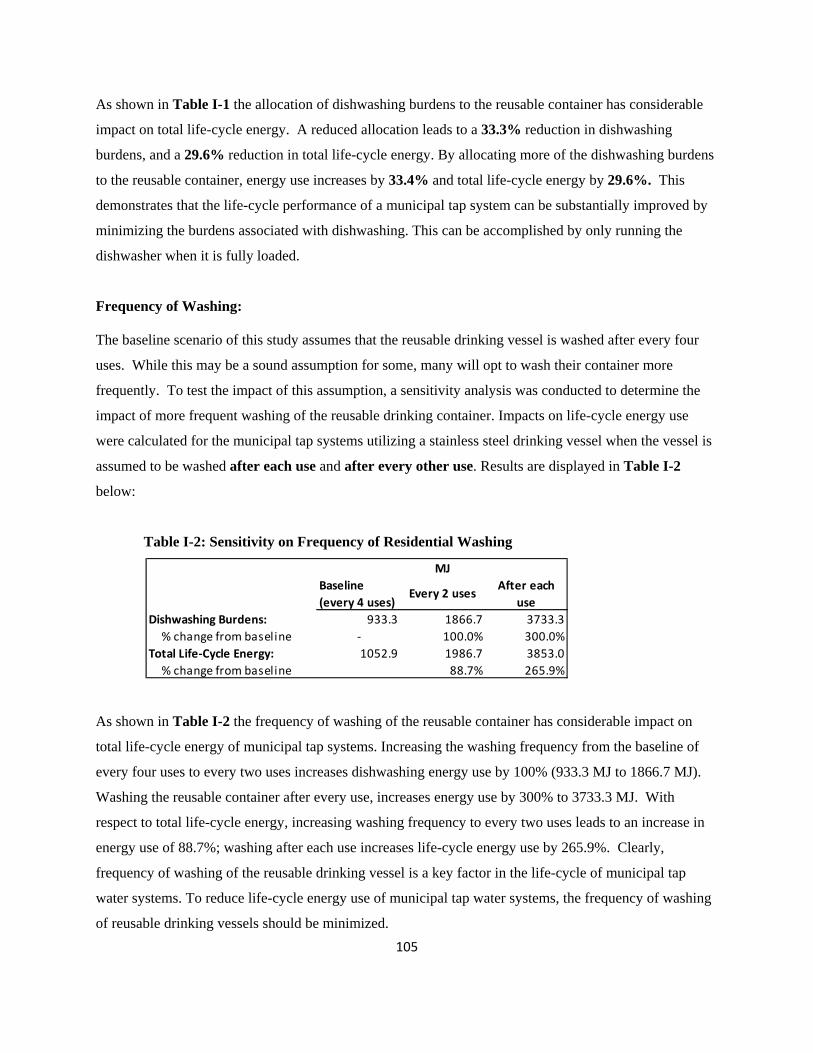
105
As shown in Table I-1 the allocation of dishwashing burdens to the reusable container has considerable
impact on total life-cycle energy. A reduced allocation leads to a 33.3% reduction in dishwashing
burdens, and a 29.6% reduction in total life-cycle energy. By allocating more of the dishwashing burdens
to the reusable container, energy use increases by 33.4% and total life-cycle energy by 29.6%. This
demonstrates that the life-cycle performance of a municipal tap system can be substantially improved by
minimizing the burdens associated with dishwashing. This can be accomplished by only running the
dishwasher when it is fully loaded.
Frequency of Washing: The baseline scenario of this study assumes that the reusable drinking vessel is washed after every four
uses. While this may be a sound assumption for some, many will opt to wash their container more
frequently. To test the impact of this assumption, a sensitivity analysis was conducted to determine the
impact of more frequent washing of the reusable drinking container. Impacts on life-cycle energy use
were calculated for the municipal tap systems utilizing a stainless steel drinking vessel when the vessel is
assumed to be washed after each use and after every other use. Results are displayed in Table I-2
below:
Table I-2: Sensitivity on Frequency of Residential Washing
As shown in Table I-2 the frequency of washing of the reusable container has considerable impact on
total life-cycle energy of municipal tap systems. Increasing the washing frequency from the baseline of
every four uses to every two uses increases dishwashing energy use by 100% (933.3 MJ to 1866.7 MJ).
Washing the reusable container after every use, increases energy use by 300% to 3733.3 MJ. With
respect to total life-cycle energy, increasing washing frequency to every two uses leads to an increase in
energy use of 88.7%; washing after each use increases life-cycle energy use by 265.9%. Clearly,
frequency of washing of the reusable drinking vessel is a key factor in the life-cycle of municipal tap
water systems. To reduce life-cycle energy use of municipal tap water systems, the frequency of washing
of reusable drinking vessels should be minimized.
Baseline (every 4 uses)
Every 2 usesAfter each
useDishwashing Burdens: 933.3 1866.7 3733.3% change from baseline ‐ 100.0% 300.0%
Total Life‐Cycle Energy: 1052.9 1986.7 3853.0% change from baseline 88.7% 265.9%
MJ

106
The Number of Reusable Containers:
The baseline scenario of this study assumes the use of a single reusable container to deliver the full 1000
gallons of drinking water to a consumer. While this is a reasonable assumption, it is possible that some
consumers/households would employ several reusable containers over the time period required to
consume 1000 gallons of drinking water. To determine the impact of using more than one reusable
container, a sensitivity analysis was conducted to evaluate the associated burdens with regard to life-cycle
energy. Results were calculated for the use of two and four reusable containers with regard to the use of
the stainless steel bottle used in the municipal tap systems. Results are displayed in Table I-3 below:
Table I-3: Sensitivity on Number of Reusable Containers
As shown in Table I-3 the additional of more reusable containers to the model has a relatively minimal
impact on overall life-cycle energy. The additional of a second container increases life-cycle energy by
4.1%, while the additional of three containers (total of four) raises energy by 12.3%. The additional of
more reusable containers does not significantly affect life-cycle performance of the municipal tap systems
with respect the HOD and single-use bottled systems.
Running the Tap Before Filling a Reusable Container with Municipal Tap Water: The baseline scenario for the municipal tap system evaluated in this study assumes the consumption of
precisely 1000 gallons of water to provide a consumer with 1000 gallons of drinking water. In other
words, no water is wasted in the provision of drinking water. For purposes of this study, this assumption
was deemed acceptable. It is possible, however, that a consumer might run the tap before filling a
reusable container with water due to behavioral preferences (i.e. to clear standing water from the pipes; to
wait for colder water; to rinse the container, etc.). A sensitivity analysis was conducted to determine the
energy impact of running the water before the filling of the reusable container with drinking water.
Baseline (1 container)
Medium (2)
High(4)
Container Life‐Cycle Energy 43.3 86.5 173.0% change from baseline ‐ 100.0% 300.0%
Total Life‐Cycle Energy: 1052.9 1096.2 1182.7% change from baseline 4.1% 12.3%
MJ

107
Results were computed for the consumption of 1500 and 2000 gallons of municipal tap water and are
presented in Table I-4 below:
Table I-4: Energy Impact of Consuming Additional Tap Water
As shown in Table I-4, the consumption of water in excess of the 1000 gallons of drinking water has a
relatively small impact on total life-cycle energy. The medium scenario (consumption of 1500 gallons to
provide 1000 gallons of drinking water) leads to a 3.6% increase in life-cycle energy, while the high
scenario (consumption of 2000 gallons) leads to a 7.3% increase. The life-cycle of the municipal tap
systems is dominated by the residential washing of the reusable container ( >88% of total life-cycle
energy). As such, increasing water use does not lead to significantly different results.
Percentage of Recycled Content in the Single-Use Bottled Water Systems: The baseline scenario for single-use bottled systems that employ recycled content (rPET) in the bottles is
25% rPET. As shown in Chapter 2, the inclusion of recycled content in single-use bottles reduces life-
cycle energy, solid waste and greenhouse gas burdens. Currently, the use of recycled content in the
bottled water industry is not a standard practice. Mountain Valley Spring Water, one of the few bottled
water companies to use recycled content in their products, recently made a public commitment to using
25% recycled content in all of their PET containers with the goal of moving towards 50% rPET over the
next year. Here, a sensitivity analysis is conducted to demonstrate the benefits of using additional
amounts of recycled content in single-use bottled systems. Results were calculated for 50% and 100%
recycled content for regional single-use bottled systems that employ recycling after the useful life of the
container with respect to life-cycle energy. Results are shown in Table I-5 below:
Baseline (1000 gallons)
Medium (1500 gallons)
High(2000 gallons)
Municipal Treatment Energy 76.0 115.0 153.0% change from baseline ‐ 51.4% 101.4%
Total Life‐Cycle Energy: 1052.9 1090.9 1130.0% change from baseline 3.6% 7.3%
mmBTU

108
Table I-5: Life-Cycle Energy Benefits of Increased Recycled Content:
As shown in Table I-5, the percentage of recycled content included in the single-use bottle has a
significant impact on both container production energy and total life-cycle energy. Relative to the use of
Virgin-PET single-use bottles, the use of 25%, 50% and 100% rPET leads to a 14%, 25% and 49%
reduction in container production energy. These reductions translate into 10%, 18% and 37% reductions
in total life-cycle energy. Incorporating increasing amounts of rPET into bottles stands to substantially
improve the life-cycle energy profile of single-use bottled systems. Commensurate benefits can be
expected in life-cycle solid waste and greenhouse gases.
Virgin PET 25% rPET 50% rPET 100% rPETContainer Production Energy 13857.2 11940.8 10445.1 7068.9
% reduction from virgin ‐ 14% 25% 49%Total Life‐Cycle Energy 18601.7 16661.0 15165.4 11742.8
% reduction from virgin ‐ 10% 18% 37%
MJ

109
Appendix J
Glossary
GHG: greenhouse gas
HDPE: High-density polyethylene plastic
HOD: Home and office delivery water system
Kg CO2eq: Kilogram of carbon dioxide equivalents; a measure of global warming impact based on a gas’s global warming potential relative to carbon dioxide.
LCA: Life-cycle assessment; a systematic method for quantifying a product/system’s environmental impact across its entire life-cycle, from extraction of raw materials to disposal.
LCI: Life-cycle inventory
LCIA: Life-cycle impact assessment
LDPE: Low-density polyethylene plastic
LLDPE: Linear low-density polyethylene plastic
MJ: Mega joule (energy value)
MJ LHV: Mega joule lower heating value; The lower heating value of a fuel is defined as the amount of heat released by combusting a specified quantity and returning the temperature of the combustion products to 150 °C. LHV assumes all the water component is in vapor state at the end of combustion (in product of combustion), as opposed to HHV that assumes all the water component in liquid form of the combustion gas.
MmBTU: One million BTU (British thermal unit; energy value)
PC: Polycarbonate plastic
PE: Polyethylene plastic
PET: Polyethylene terephthalate plastic
PP: Polypropylene plastic
Quad: An energy unit equivalent to a quadrillion BTUs
RO: Reverse osmosis; a treatment technology used to produce drinking water
110
rPET: PET made with recycled content
UV: Ultraviolet treatment; a disinfectant treatment technology used in the production of bottled water
Virgin PET: PET made with virgin content


![Trends in tap and bottled water consumption among children ... · and trends for drinking water, tap and bottled, among US children and adults. Past studies [11] have estimated that](https://static.fdocuments.net/doc/165x107/5f04e2017e708231d4102f3d/trends-in-tap-and-bottled-water-consumption-among-children-and-trends-for-drinking.jpg)