Comparative LCA of beverage cartons with and without bio ... · cartons containing fossil polymer...
50
Comparative LCA of beverage cartons with and without bio-based polymers IVL Swedish Environmental Resource Institute Lisa Hallberg, [email protected] www.ivl.se Tetra Brik® Aseptic Tetra Brik® 2016-05-20
Transcript of Comparative LCA of beverage cartons with and without bio ... · cartons containing fossil polymer...

Mallsidor
IVL Färger
Comparative LCA of beverage cartons with and without bio-based polymers
IVL Swedish Environmental Resource InstituteLisa Hallberg, [email protected]
Tetra Brik® AsepticTetra Brik®
2016-05-20

Mallsidor
IVL Färger
Project and PurposeLife cycle assessment (LCA) was carried out for two beverage
cartons containing fossil polymer (PE) and bio-based polymer (PE)
§ Purpose‒ Provide knowledge of the environmental strengths and
weaknesses of the Tetra Brik® and Tetra Brik Aseptic®
beverage cartons with bio-based content on the relevant markets.‒ Compare the environmental performance of the carton
with and without bio-based polymers.‒ Build a fact base that can be used in external
communication, including comparative claims concerning the current cartons versus the redesigned.

Mallsidor
IVL Färger
Organisation of study§ The study was performed during 2015-2016 by
Swedish Environmental Research Institute (IVL),Lisa Hallberg, on behalf of Tetra Pak
§ The project participants from Tetra Pak were:‒ Davide Braghiroli and Massimiliano Cereda, Italy
‒ Erika Kloow and Karin Holmkvist, Sweden
‒ David Cockburn, Sweden (internal review of report)
§ Conducted according to the ISO standards on LCA(ISO 14040 and 14044)
§ Critically reviewed by Ecoinnovazione(Alessandra Zamagni and Paolo Masoni)

Mallsidor
IVL Färger
Studied cartons and FlowchartLightCap™ 30
Lid
Neck
Tetra Brik® Aseptic 1000 Edge LightCap™ 30 (TBA)
TwistCap™ 34
Lid
Neck
Tetra Brik® 1000 Edge TwistCap™ 34 (TB)
The functional unit: the provision of 1 litres of beverage
Green processes represent raw materials, blue the core processes and red the end of life treatment.

Mallsidor
IVL Färger
Studied cartons: Material composition

Mallsidor
IVL Färger
Scenarios
The base case, where only fossil PE is used, is the reference to which thebio-based PE scenarios A1-A3 (TBA) and B1-B2 (TB) are compared.

Mallsidor
IVL Färger
Studied marketsFour markets are studied; Sweden, Norway, Denmark and Germany. They mainly differ concerning the end of lifetreatment and the distribution of beverage cartons.
The markets also differ concerning the production of the electricity used in processes such as filling, recycling and energy credit in waste incineration. Country averageelectricity production is applied for these processses.

Mallsidor
IVL Färger
Comparisons
It is not within the scope of this study to compare:− The two cartons with each other since they do not have the same
function. The Tetra Brik® Asepticcartons are used for ambient products, while the Tetra Brik® cartons are used for chilled products.
− The four markets are included in the study to provide a picture on the total perspective for each carton on the different markets. The markets as such should not be compared to each other.
The bio-based PE scenarios A1-A3 (Tetra Brik® Aseptic) and B1-B2 (Tetra Brik®) are compared to the base case,
where only fossil PE is used.

Mallsidor
IVL Färger
System boundaries§ Cradle to grave study.
§ Production of the beverage and refrigeration (chilled product for TB carton) are not included in the analysis.
§ Substitution: Has been applied to reflect the environmental benefit associated with produced fibres (material recycling) and produced energy (end of life). This has been done by using a substitution approach, which means that the production of alternative material or energy is withdrawn from the studied system.

Mallsidor
IVL Färger
Biogenic carbon modelling§ Bio-based PE: the carbon uptake is accounted for in the
production phase, as a negative biogenic CO2 flow contributing with a negative global warming. When the biogenic carbon is released (when incinerated), these biogenic CO2 emissions is treated in the same way as the fossil CO2 i.e. by contributing to global warming.
§ LPB and Secondary packaging: the carbon uptake in the material is not included. When the biogenic carbon is released (when incinerated), these biogenic CO2 emissions are considered not to contribute to global warming.
§ It is important to point out that the choice of modelling does not affect the total results.

Mallsidor
IVL Färger
Tetra Brik® Aseptic, Sweden
Mallsidor
IVL Färger
Results relative to the base case
The energy use is decreasing when more bio-based PE is replacing fossil PE.
The renewable energy is increasing somewhat for the bio-based PE scenarios, but since the decrease in non renewable energy is larger, the result is a net decrease.
Total energy resources: Tetra Brik® Aseptic, Sweden

Mallsidor
IVL Färger
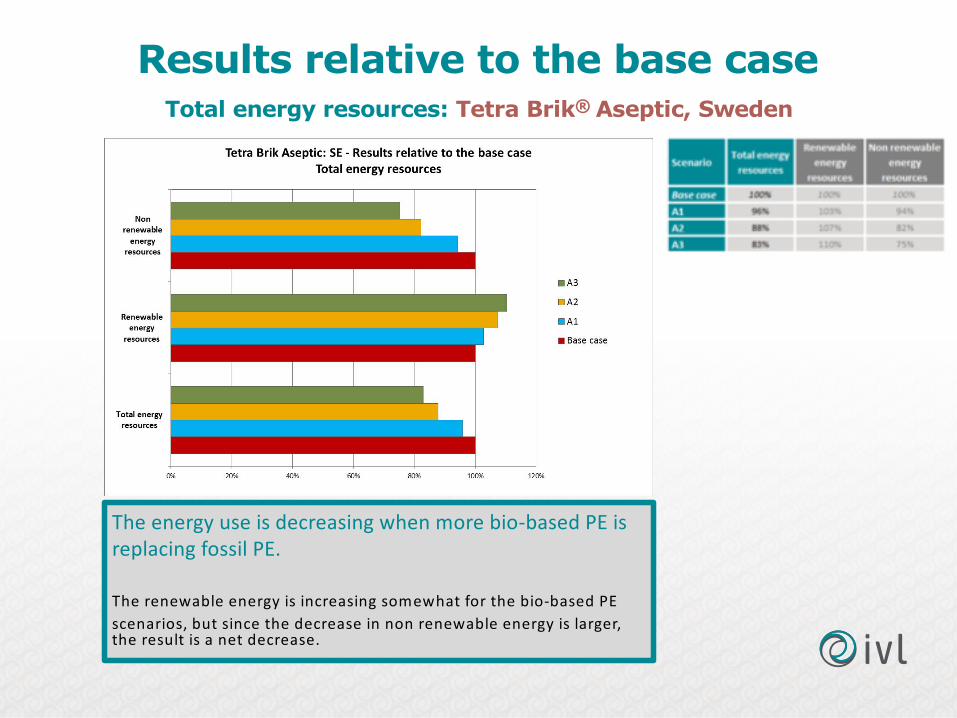
Results relative to the base caseGlobal warming potential (GWP): Tetra Brik® Aseptic, Sweden
The impact is decreasing when more bio-based PE is replacing fossil PE.
For bio-based PE there is an uptake and release of carbon dioxide i.e. there is no net increase of carbon dioxide. The use of fossil PE on the other hand increases the carbon dioxide in the technosphere.

Mallsidor
IVL Färger
Results for the life cycle phasesTotal energy resources: Tetra Brik® Aseptic, Sweden
The production of the raw materials(1) is dominating.
The EoL ends up as a net negative impact, i.e. the credits for the produced energy and paper fibres are larger than the impacts due to PE incineration and the recycling processes.
The distribution is quite large (since the beverage is included).
The converting and filling show the smallest impact, but is not negligible.
(1) The transport of bio-based PE (from Brazil) is included in the raw materials (0.3 % of the total impact for scenario A3).
Mallsidor
IVL Färger
Results for the life cycle phasesGlobal warming potential (GWP): Tetra Brik® Aseptic, Sweden
The production of the raw materials(1) is dominating.
The EoL is equal for all scenarios since the biogenic CO2 released at waste incineration contributes to GWP. This is because the uptake of the biogenic CO2 has already been accounted for in the production phase, which also explains why the impact is decreasing for the raw material production when more bio-based PE is replacing the fossil PE.
The EoL ends up as a net positive impact, i.e. the impacts due to PE incineration and the recycling processes are larger than the credits for the produced energy and paper fibres.
(1) The transport of bio-based PE (from Brazil) is included in the raw materials (0.4 % of the total impact for scenario A3).

Mallsidor
IVL Färger
Conclusions on results relative to the base caseTetra Brik® Aseptic, Sweden
§ The bio-based PE is to prefer when global warming and use of non renewable energy resources are considered. There is an almost 20 % impact decrease for these aspects.
§ The impacts eutrophication, acidification and photo oxidant formationare much higher for the bio-based PE. − This is expected for EP since the bio-based PE is produced from sugar cane
ethanol – a value chain containing use of fertilizers associated with phosphorous emissions as well as combustion of bio-based material giving rise to nitrogen oxide emissions (e.g. trash burning in the sugar cane fields and bagasse combustion in ethanol production).
− There are similar reasons for the high AP impact; use of fertilizers associated (ammonia emissions) as well as combustion of bio-based material (nitrogen oxide emissions).
− For the POCP the reasons for the higher impact are mainly the trash burning in the sugar cane fields as well as the bagasse combustion in ethanol production.

Mallsidor
IVL Färger
Conclusions – Future improvements
The forward looking Braskem 2020 scenario showed that the environmental impacts can be decreased quite substantially.
The following future potential improvements are predicted to apply by 2020 [Braskem 2013]:
“Precision agriculture for sugarcane management (lower fertiliser inputs, lower fertiliser losses), improved sugarcane yields, full reliance on mechanical harvesting of sugarcane (no pre-harvest burning), and use of harvested trash for additional green electricity generation at ethanol mills, as well as enhanced green ethylene yields.”
“Some aspects will be under Braskem’s direct control whilst others relate to elsewhere in the supply chain and to the legislative/regulatory background.”
“It should also be noted that the practice of trash burning is currently being phased-out in Brazilian sugarcane ethanol production and this is expected to be largely completed by 2017.”
The bio-based PE production from the sugar cane ethanol value chain is not a mature process.

Mallsidor
IVL Färger
Conclusions – Life cycle phases
− The raw material production dominates for all impact categories.− The distribution is a quite large part (since the beverage and secondary
packaging is included in this transport).− The end of life show a net positive impact for global warming i.e. the
environmental impacts due to waste incineration and recycling are larger than the credits from the produced energy and paper fibres.
− The end of life show a net negative impact for energy resources, eutrophication, acidification and photo oxidant formation i.e. the credits from the produced energy and paper fibres are larger than the environmental impacts due to waste incineration and recycling.
− The converting and filling show the smallest impact.
The markets should not be compared, but the internal relations between the life cycle phases are of course affected by which market is analyzed due to differences in end of life management, distribution and to some extent the filling process.

Mallsidor
IVL Färger
Tetra Brik® Aseptic, Norway

Mallsidor
IVL Färger
Results relative to the base case
The energy use is decreasing when more bio-based PE is replacing fossil PE.
The renewable energy is increasing somewhat for the bio-based PE scenarios, but since the decrease in non renewable energy is larger, the result is a net decrease.
Total energy resources: Tetra Brik® Aseptic, Norway

Mallsidor
IVL Färger
Results relative to the base caseGlobal warming potential (GWP): Tetra Brik® Aseptic, Norway
The impact is decreasing when more bio-based PE is replacing fossil PE.
For bio-based PE there is an uptake and release of carbon dioxide i.e. there is no net increase of carbon dioxide. The use of fossil PE on the other hand increases the carbon dioxide in the technosphere.

Mallsidor
IVL Färger
Results for the life cycle phasesTotal energy resources: Tetra Brik® Aseptic, Norway
The production of the raw materials(1) is dominating.
The EoL ends up as a net negative impact, i.e. the credits for the produced energy and paper fibres are larger than the impacts due to PE incineration and the recycling processes.
The distribution is quite large (since the beverage is included).
The converting and filling show the smallest impact, but is not negligible.
(1) The transport of bio-based PE (from Brazil) is included in the raw materials.

Mallsidor
IVL Färger
Results for the life cycle phasesGlobal warming potential (GWP): Tetra Brik® Aseptic, Norway
The production of the raw materials(1) is dominating.
The EoL is equal for all scenarios since the biogenic CO2 released at waste incineration contributes to GWP. This is because the uptake of the biogenic CO2 has already been accounted for in the production phase, which also explains why the impact is decreasing for the raw material production when more bio-based PE is replacing the fossil PE.
The EoL ends up as a net positive impact, i.e. the impacts due to PE incineration and the recycling processes are larger than the credits for the produced energy and paper fibres.
(1) The transport of bio-based PE (from Brazil) is included in the raw materials.

Mallsidor
IVL Färger
Tetra Brik® Aseptic, Denmark
Mallsidor
IVL Färger
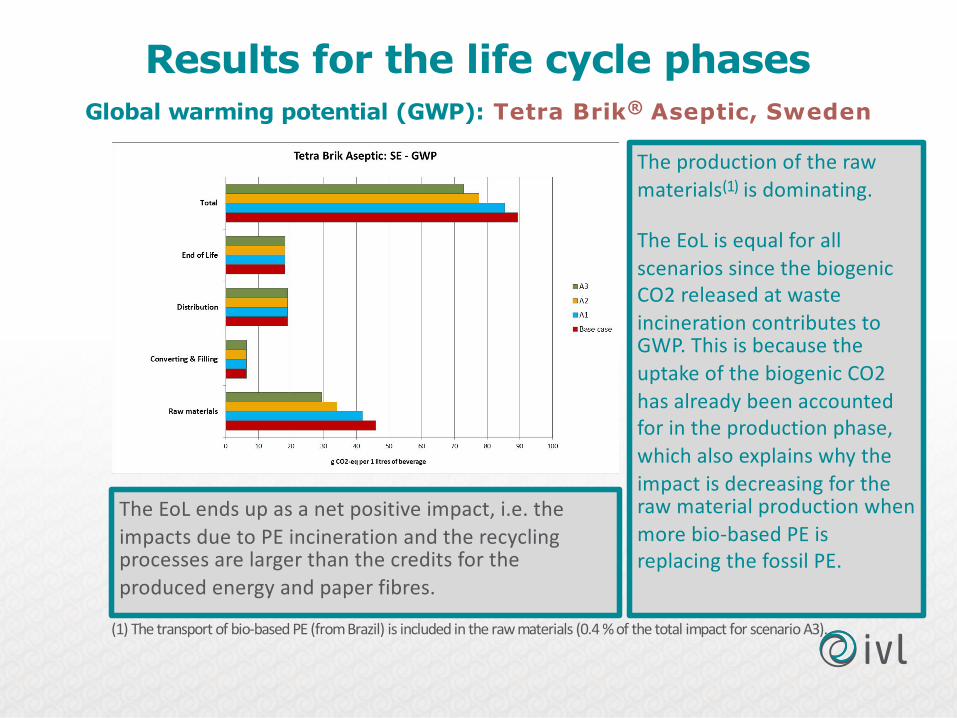
Results relative to the base case
The energy use is decreasing when more bio-based PE is replacing fossil PE.
The renewable energy is increasing somewhat for the bio-based PE scenarios, but since the decrease in non renewable energy is larger, the result is a net decrease.
Total energy resources: Tetra Brik® Aseptic, Denmark

Mallsidor
IVL Färger
Results relative to the base caseGlobal warming potential (GWP): Tetra Brik® Aseptic, Denmark
The impact is decreasing when more bio-based PE is replacing fossil PE.
For bio-based PE there is an uptake and release of carbon dioxide i.e. there is no net increase of carbon dioxide. The use of fossil PE on the other hand increases the carbon dioxide in the technosphere.

Mallsidor
IVL Färger
Results for the life cycle phasesTotal energy resources: Tetra Brik® Aseptic, Denmark
The production of the raw materials(1) is dominating.
The EoL ends up as a net negative impact, i.e. the credits for the produced energy and paper fibres are larger than the impacts due to PE incineration and the recycling processes.
The distribution is quite large (since the beverage is included).
The converting and filling show the smallest impact, but is not negligible.
(1) The transport of bio-based PE (from Brazil) is included in the raw materials.

Mallsidor
IVL Färger
Results for the life cycle phasesGlobal warming potential (GWP): Tetra Brik® Aseptic, Denmark
The production of the raw materials(1) is dominating.
The EoL is equal for all scenarios since the biogenic CO2 released at waste incineration contributes to GWP. This is because the uptake of the biogenic CO2 has already been accounted for in the production phase, which also explains why the impact is decreasing for the raw material production when more bio-based PE is replacing the fossil PE.
The EoL ends up as a net positive impact, i.e. the impacts due to PE incineration and the recycling processes are larger than the credits for the produced energy and paper fibres.
(1) The transport of bio-based PE (from Brazil) is included in the raw materials.

Mallsidor
IVL Färger
Tetra Brik® Aseptic, Germany

Mallsidor
IVL Färger
Results relative to the base case
The energy use is decreasing when more bio-based PE is replacing fossil PE.
The renewable energy is increasing somewhat for the bio-based PE scenarios, but since the decrease in non renewable energy is larger, the result is a net decrease.
Total energy resources: Tetra Brik® Aseptic, Germany

Mallsidor
IVL Färger
Results relative to the base caseGlobal warming potential (GWP): Tetra Brik® Aseptic, Germany
The impact is decreasing when more bio-based PE is replacing fossil PE.
For bio-based PE there is an uptake and release of carbon dioxide i.e. there is no net increase of carbon dioxide. The use of fossil PE on the other hand increases the carbon dioxide in the technosphere.

Mallsidor
IVL Färger
Results for the life cycle phasesTotal energy resources: Tetra Brik® Aseptic, Germany
The production of the raw materials(1) is dominating.
The EoL ends up as a net negative impact, i.e. the credits for the produced energy and paper fibres are larger than the impacts due to PE incineration and the recycling processes.
The distribution is quite large (since the beverage is included).
The converting and filling show the smallest impact, but is not negligible.
(1) The transport of bio-based PE (from Brazil) is included in the raw materials.

Mallsidor
IVL Färger
Results for the life cycle phasesGlobal warming potential (GWP): Tetra Brik® Aseptic, Germany
The production of the raw materials(1) is dominating.
The EoL is equal for all scenarios since the biogenic CO2 released at waste incineration contributes to GWP. This is because the uptake of the biogenic CO2 has already been accounted for in the production phase, which also explains why the impact is decreasing for the raw material production when more bio-based PE is replacing the fossil PE.
The EoL ends up as a net positive impact, i.e. the impacts due to PE incineration and the recycling processes are larger than the credits for the produced energy and paper fibres.
(1) The transport of bio-based PE (from Brazil) is included in the raw materials.

Mallsidor
IVL Färger
Tetra Brik®, Sweden

Mallsidor
IVL Färger
Results relative to the base case
The energy use is decreasing when more bio-based PE is replacing fossil PE.
The renewable energy is increasing somewhat for the bio-based PE scenarios, but since the decrease in non renewable energy is larger, the result is a net decrease.
Total energy resources: Tetra Brik®, Sweden

Mallsidor
IVL Färger
Results relative to the base caseGlobal warming potential (GWP): Tetra Brik®, Sweden
The impact is decreasing when more bio-based PE is replacing fossil PE.
For bio-based PE there is an uptake and release of carbon dioxide i.e. there is no net increase of carbon dioxide. The use of fossil PE on the other hand increases the carbon dioxide in the technosphere.

Mallsidor
IVL Färger
Conclusions on results relative to the base caseTetra Brik®, Sweden
§ The bio-based PE is to prefer when global warming and use of non renewable energy resources are considered. There is an impact decrease of 20 % for GWP and 28 % for non renewable energy.
§ The impacts eutrophication, acidification and photo oxidant formationare much higher for the bio-based PE. − This is expected for EP since the bio-based PE is produced from sugar cane
ethanol – a value chain containing use of fertilizers associated with phosphorous emissions as well as combustion of bio-based material giving rise to nitrogen oxide emissions (e.g. trash burning in the sugar cane fields and bagasse combustion in ethanol production).
− There are similar reasons for the high AP impact; use of fertilizers associated (ammonia emissions) as well as combustion of bio-based material (nitrogen oxide emissions).
− For the POCP the reasons for the higher impact are mainly the trash burning in the sugar cane fields as well as the bagasse combustion in ethanol production.

Mallsidor
IVL Färger
Conclusions – Life cycle phases
− The raw material production dominates for all impact categories.− The distribution is a quite large part (since the beverage and secondary
packaging is included in this transport).− The end of life show a net positive impact for global warming i.e. the
environmental impacts due to waste incineration and recycling are larger than the credits from the produced energy and paper fibres.
− The end of life show a net negative impact for energy resources, eutrophication, acidification and photo oxidant formation i.e. the credits from the produced energy and paper fibres are larger than the the environmental impacts due to waste incineration and recycling.
− The converting and filling show the smallest impact.
The markets should not be compared, but the internal relations between the life cycle phases are of course affected by which market is analyzed due to differences in end of life management, distribution and to some extent the filling process.

Mallsidor
IVL Färger
Conclusions – Future improvements
A forward looking scenario for 2020 made in the Braskem LCA showed that the environmental impacts can be decreased quite substantially.
The following future potential improvements are predicted to apply by 2020 [Braskem 2013]:
“Precision agriculture for sugarcane management (lower fertiliser inputs, lower fertiliser losses), improved sugarcane yields, full reliance on mechanical harvesting of sugarcane (no pre-harvest burning), and use of harvested trash for additional green electricity generation at ethanol mills, as well as enhanced green ethylene yields.”
“Some aspects will be under Braskem’s direct control whilst others relate to elsewhere in the supply chain and to the legislative/regulatory background.”
“It should also be noted that the practice of trash burning is currently being phased-out in Brazilian sugarcane ethanol production and this is expected to be largely completed by 2017.”
The bio-based PE production from the sugar cane ethanol value chain is not a mature process.

Mallsidor
IVL Färger
Tetra Brik®, Norway

Mallsidor
IVL Färger
Results relative to the base case
The energy use is decreasing when more bio-based PE is replacing fossil PE.
The renewable energy is increasing somewhat for the bio-based PE scenarios, but since the decrease in non renewable energy is larger, the result is a net decrease.
Total energy resources: Tetra Brik®, Norway

Mallsidor
IVL Färger
Results relative to the base caseGlobal warming potential (GWP): Tetra Brik®, Norway
The impact is decreasing when more bio-based PE is replacing fossil PE.
For bio-based PE there is an uptake and release of carbon dioxide i.e. there is no net increase of carbon dioxide. The use of fossil PE on the other hand increases the carbon dioxide in the technosphere.

Mallsidor
IVL Färger
Tetra Brik®, Denmark

Mallsidor
IVL Färger
Results relative to the base case
The energy use is decreasing when more bio-based PE is replacing fossil PE.
The renewable energy is increasing somewhat for the bio-based PE scenarios, but since the decrease in non renewable energy is larger, the result is a net decrease.
Total energy resources: Tetra Brik®, Denmark

Mallsidor
IVL Färger
Results relative to the base caseGlobal warming potential (GWP): Tetra Brik®, Denmark
The impact is decreasing when more bio-based PE is replacing fossil PE.
For bio-based PE there is an uptake and release of carbon dioxide i.e. there is no net increase of carbon dioxide. The use of fossil PE on the other hand increases the carbon dioxide in the technosphere.

Mallsidor
IVL Färger
Tetra Brik®, Germany
Mallsidor
IVL Färger
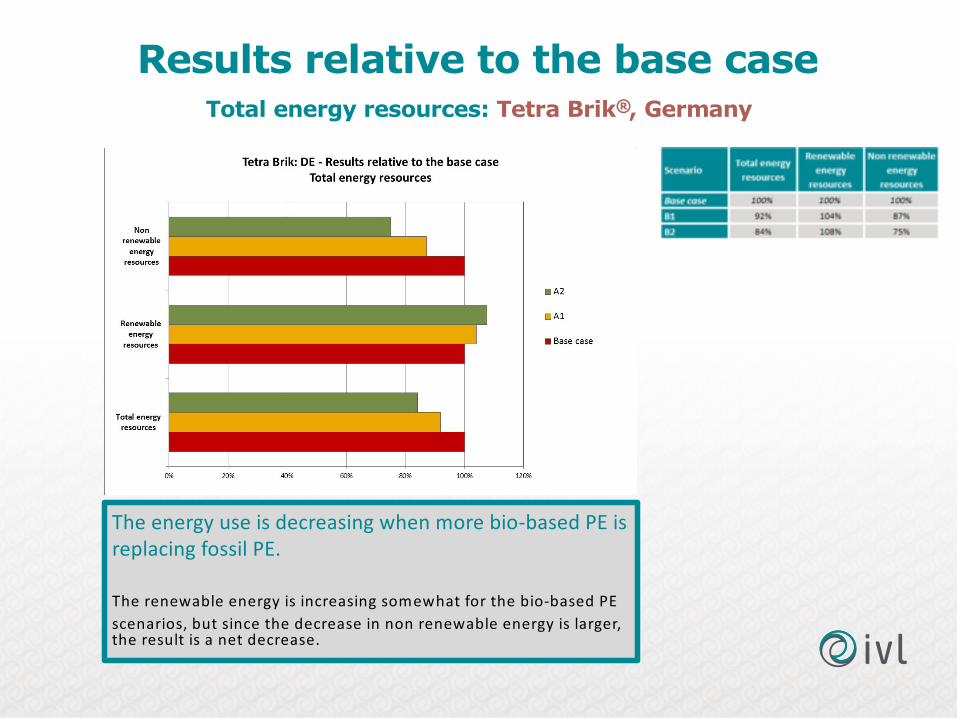
Results relative to the base case
The energy use is decreasing when more bio-based PE is replacing fossil PE.
The renewable energy is increasing somewhat for the bio-based PE scenarios, but since the decrease in non renewable energy is larger, the result is a net decrease.
Total energy resources: Tetra Brik®, Germany

Mallsidor
IVL Färger
Results relative to the base caseGlobal warming potential (GWP): Tetra Brik®, Germany
The impact is decreasing when more bio-based PE is replacing fossil PE.
For bio-based PE there is an uptake and release of carbon dioxide i.e. there is no net increase of carbon dioxide. The use of fossil PE on the other hand increases the carbon dioxide in the technosphere.

Mallsidor
IVL Färger
§ "Cradle to grave": When including the whole life cycle.
§ "Cradle to gate": When including everything up to the factory "gate".
§ Life cycle inventory (LCI): When just presenting the inventory results in terms of kg of emissions (CO2, NOx, SO2 etc.) & resources (Crude oil, Uranium etc.)
§ Life cycle impact assessment (LCIA): When also presenting the impact assessment results in terms of Global warming (kg CO2
equvivalents), Acidification (kg SO2 equvivalents), Eutrophication (kg PO43- equvivalents) etc.
§ Functional unit: defines the quantification of the function of the product. It is a scale factor, which has to be the same for the different systems studied e.g. 1 tonne of steel product.
DefinitionsLife cycle assessment (LCI/LCA)

Mallsidor
IVL Färger
Environmental load
CO2
CH4
N2Oetc
SO2
NOx
HCletc
NOx
PNH3
etc
Environmental impacts
Global warming
Acidification
Eutrophication
Characterisation
"Index"
Weighting
Life cycle impact assessment (LCIA)