Comparative genomics tools for biological discovery...
37
1 Comparative genomics tools for biological discovery Lior Pachter Dept. Mathematics, U.C. Berkeley and LBNL [email protected] Inna Dubchak, LBNL Outline What is comparative genomics? VISTA tools developed for comparative genomics. Related biological stories Large scale VISTA applications including automatic computational system for comparing the human and mouse genomes
Transcript of Comparative genomics tools for biological discovery...

1
Comparative genomics tools forbiological discovery
Lior PachterDept. Mathematics, U.C. Berkeleyand [email protected]
Inna Dubchak, LBNL
Outline
What is comparative genomics?
VISTA tools developed for comparative genomics.
Related biological stories
Large scale VISTA applications including automaticcomputational system for comparing the humanand mouse genomes

2
The Human genome
The next steps:
Developing the IGI (integrated gene index) and IPI(integrated protein index)
Large-scale identification of regulatory regions
Sequencing of additional large genomes
Completing the catalogue of human variation
From sequence to function
From the Nature paper:
”

3
1-2% Coding
Gene A Gene B
Protein A Protein B
mRNA mRNA
Non-CodingCoding
Distant Non-Coding Sequences Causing Disease
b gB ed gA
b-Thalassemia~50kb
LCR
Disease Gene Distance
Campomelic displasiaAniridiaX-Linked DeafnessSaethre-Chotzen syndromeRieger syndromeSplit hand/split footmalformation
SOX9PAX6POU3F4TWISTPITX2SHFM1
850kb125kb900kb250kb
90kb 450kb

4
BackgroundEvolution can help!
In general, functionally important sequences areconserved
Conserved sequences are functionally important
Raw sequence can help in finding biological function
Comparison of 1196 orthologous genes(Makalowski et al., 1996)
• Sequence identity:– exons: 84.6%– protein: 85.4%– introns: 35%– 5’ UTRs: 67%– 3’ UTRs: 69%
• 27 proteins were 100% identical
Integrating data into more powerful gene predictionmodels than with human genomic sequence alone

5
Comparing sequences of different organisms
• Helps in gene predictions
• Helps in understanding evolution
• Conserved between species non-coding sequencesare reliable guides to regulatory elements
• Differences between evolutionary closely relatedsequences help to discover gene functions
Challengesß Sequence at different stages of completion,
difficult to compareß
ß Whole genome shotgun• Finished BACs
ß Fast and accurate analysisß Scaling up to the size of whole genomes
Partial Assemblies

6
http://www-gsd.lbl.gov/vista
Processed ~ 11000 queries on-line, distributed > 560 copies of theprogram in 34 countries
Modules of VISTA:
• Program for global alignment of DNAfragments of any length
• Visualization of alignment and varioussequence features for any number ofspecies
• Evaluation and retrieval of all regions withpredefined levels of conservation

7
Sequence comparisons. How?
Three variations:
Find the best OVERALL alignment.Global alignment
Find ALL regions of similarity.Local alignment
Find the BEST region of similarity.Optimal local alignment
Aligning large genomic regions• Long sequences lead to memory problems• Speed becomes an issue• Long alignments are very sensitive to parameters• Draft sequences present a nontrivial problem• Accuracy is difficult to measure and to achieve
References for some existing programs:Glass:Domino Tiling, Gene Recognition, and Mice.Pachter, L. Ph.D. Thesis, MIT (1999)Human and Mouse Gene Structure: Comparative Analysis and Application to Exon Prediction.Batzoglou, S., Pachter, L., Mesirov, J., Berger, B., Lander, E. Genome Research (2000).MUMmerDelcher, A.L., Kasif S., Fleischmann, R.D., Peterson J., White, O. and Salzberg, S.L.Alignment of whole genomes. Nucleic Acids Research (1999)PipMakerPipMaker: A Web Server for Aligning Two Genomic DNA Sequences.Scott Schwartz, Zheng Zhang, Kelly A. Frazer, Arian Smit, Cathy Riemer, John Bouck, Richard Gibbs,Ross Hardison, and Webb Miller. Genome Research (2000)Scan2Dbscan/Scan2: Fast alignment of mega-sequences.Seledtsov I.A., Solovyev V.V. To Appear. Web site http://softberry.com/

8
Local alignment algorithms are designed to search for highlysimilar regions in two sequences that may not be highly similar intheir entirety. The algorithm works by first finding very shortcommon segments between the input sequence and databasesequences, and then expanding out the matching regions as far aspossible.!For cross-species comparison one needs to accurately align twocomplete sequences. It is insufficient to find common similarregions in the two sequences, rather, what is needed is a global mapspecifying how the two sequences fit together, much likeunderstanding how the pieces in a puzzle connect up with eachother.This problem is called global alignment
Global Alignment
Local Alignment
Local vs global alignment

9
ßß Very fastVery fast global alignment of global alignment of megabasesmegabases of sequence. of sequence.ßß Provides detailsProvides details about ordered and oriented about ordered and oriented contigscontigs, and, andaccurate placement in the finished sequence.accurate placement in the finished sequence.ßß Full integrationFull integration with repeat maskingwith repeat masking..
AVID- the alignment engine behind VISTA
• ORDER and ORIENT• FIND all common k-long words (k-mers)• ALIGN k-mers scoring by local homology• FIX k-mers with good local homology• RECURSE with smaller k (shorter words)
Visualization
tggtaacattcaaattatg-----ttctcaaagtgagcatgaca-acttttttccatgg
|| | |||| | | || || | | | |||||| | || | | ||
tgatgacatctatttgctgtttcctttttagaaactgcatgagagcctggctagtaggg!
Window of length L is centered at a particular nucleotide inthe base sequence
Percent of identical nucleotides in L positions of the alignmentis calculated and plotted
Move to the next nucleotide!

10
Finding conserved regions withpercentage and length cutoffs
Conserved segments with percent identity X andlength Y - regions in which every contiguoussubsegment of length Y was at least X% identicalto its paired sequence. These segments aremerged to define the conserved regions.
Output:11054 - 11156 = 103bp at 77.670% NONCODING13241 - 13453 = 213bp at 87.793% EXON14698 - 14822 = 125bp at 84.800% EXON
VISTA plot
Human Sequence (horizontal axis)
% IdentityBetweenHumans/Mice(Vertical Axis)
KIF Gene
0kb0kb 10kb10kb
Conserved Non Coding Sequences

11
Human/Human/MouseMouse
Nuclear Hormone Receptor:LXR-AlphaNuclear Hormone Receptor:LXR-Alpha
Human/Human/RabbitRabbit
Human/Human/OpossumOpossum

12
Human/Human/MouseMouse
Human/Human/MouseMouse
Low-Density Lipoprotein Receptor (LDLR)Low-Density Lipoprotein Receptor (LDLR)
Human/Human/LemurLemur
Human/Human/LemurLemur
Liver enhancer
human/mouse 75%
50/100%
human/rabbit
50/100%75%
human/chicken 75%
50%
human/rat
50/100%75%
75%human/pig
50/100%
100%
75%50/100%
human/macaque
Apolipoprotein AI geneMulti-Species Comparative Analysis (VISTA)

13
VISTA input files•Sequences of two or more organisms•Annotation file for a base sequence if available
VISTA output files• All pair wise global alignments of the sequences• VISTA plot• The list of conserved regions at predefined by theuser length and conservation cutoffs
VISTA flavors
• VISTA – comparing DNA of multipleorganisms
• for 3 species - analyzing cutoffs to defineactively conserved non-coding sequences
• cVISTA - comparing two closely relatedspecies
• rVISTA – regulatory VISTA

14
Mouse/Dog
Human/Dog
Human/Mouse
Mouse/Dog
Human/Mouse
Human/Dog
Mouse/Dog
Human/Mouse
Human/Dog
Example: Dubchak et al., 2000, Genome Research, 10: 1304-1306.
Active conservation of noncoding sequences –present in more than two mammals
% Cutoffsum of three pair wise
Intersection/Unionvalues is maximal
Over 120 basepairs:H/D > 92%H/M > 80%D/M > 77%
4
1 2
14

15
Identifying non-coding sequences (CNSs)involved in transcriptional regulation
rVISTA - prediction of transcriptionfactor binding sites
• Simultaneous searches of the major transcriptionfactor binding site database (Transfac) and theuse of global sequence alignment to sieve throughthe data
• Combination of database searches withcomparative sequence analysis reduces thenumber of predicted transcription factor bindingsites by several orders of magnitude
16
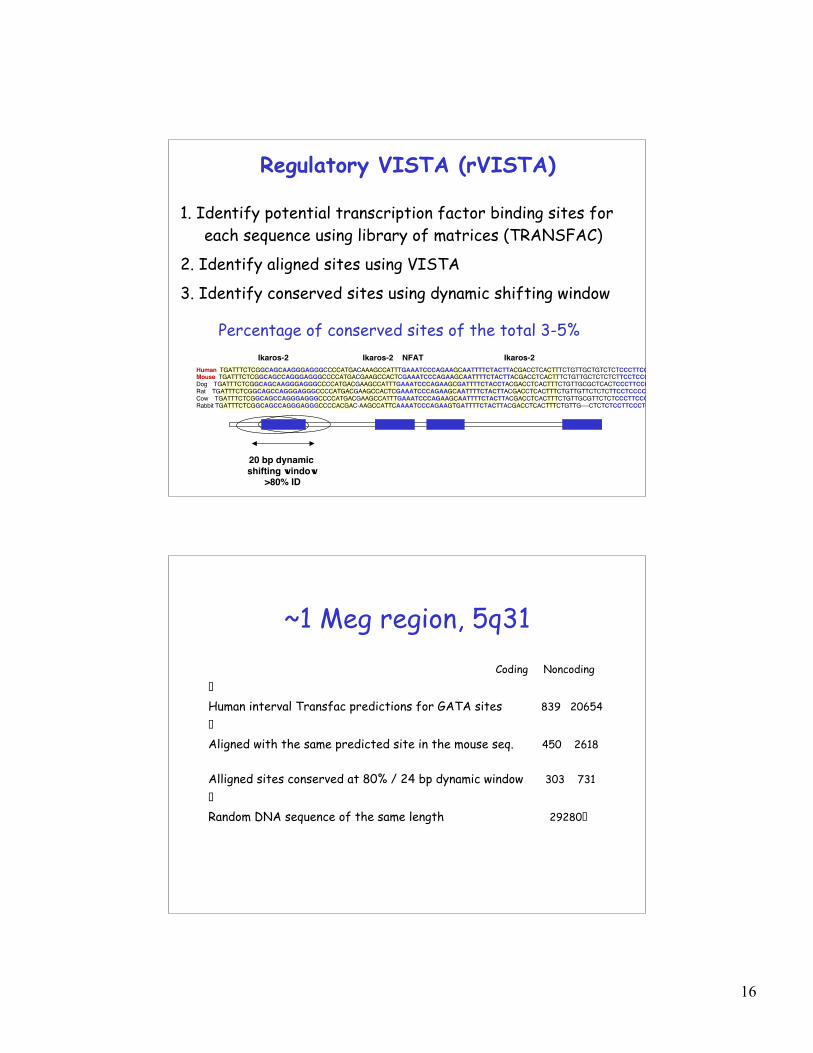
Human TGATTTCTCGGCAGCAAGGGAGGGCCCCATGACAAAGCCATTTGAAATCCCAGAAGCAATTTTCTACTTACGACCTCACTTTCTGTTGCTGTCTCTCCCTTCCCCTCTGMouse TGATTTCTCGGCAGCCAGGGAGGGCCCCATGACGAAGCCACTCGAAATCCCAGAAGCAATTTTCTACTTACGACCTCACTTTCTGTTGCTCTCTCTTCCTCCCCCTCCADog TGATTTCTCGGCAGCAAGGGAGGGCCCCATGACGAAGCCATTTGAAATCCCAGAAGCGATTTTCTACCTACGACCTCACTTTCTGTTGCGCTCACTCCCTTCCCCTGCARat TGATTTCTCGGCAGCCAGGGAGGGCCCCATGACGAAGCCACTCGAAATCCCAGAAGCAATTTTCTACTTACGACCTCACTTTCTGTTGTTCTCTCTTCCTCCCCCTCCACow TGATTTCTCGGCAGCCAGGGAGGGCCCCATGACGAAGCCATTTGAAATCCCAGAAGCAATTTTCTACTTACGACCTCACTTTCTGTTGCGTTCTCTCCCTTCCCCTCCTRabbit TGATTTCTCGGCAGCCAGGGAGGGCCCCACGAC-AAGCCATTCAAAATCCCAGAAGTGATTTTCTACTTACGACCTCACTTTCTGTTG----CTCTCTCCTTCCCTCCA
Ikaros-2 Ikaros-2 NFAT Ikaros-2
20 bp dynamic shifting window
>80% ID
1. Identify potential transcription factor binding sites foreach sequence using library of matrices (TRANSFAC)
2. Identify aligned sites using VISTA
3. Identify conserved sites using dynamic shifting window
Percentage of conserved sites of the total 3-5%
Regulatory VISTA (rVISTA)
~1 Meg region, 5q31Coding Noncoding
!
Human interval Transfac predictions for GATA sites 839 20654!
Aligned with the same predicted site in the mouse seq. 450 2618
Alligned sites conserved at 80% / 24 bp dynamic window 303 731!
Random DNA sequence of the same length 29280!

17
GATA-3 Conserved (4)
GATA-3 (28)
2 Exp. Verified GATA-3 Sites
IL 5

18
AP-1-conservedNFAT-conserved
GATA-3-conserved
100%
75%
50%
A
B
C
Ik-2-AllIk-2-Aligned
Ik-2-conserved
100%
75%
50%
AP-1-AllNFAT-All
AP-1-AlignedNFAT-Aligned
AP-1-ConservedNFAT-Conserved
100%
75%
50%
Sequence motif recognition+
multiple sequence alignment of syntenicregions,
a high throughput strategy for filtering andprioritizing putative DNA binding sites
genomically informed starting place forglobally investigating detailed regulation

19
Main features of VISTA
• Clear , configurable output
• Ability to visualize several globalalignments on the same scale
• Alignments up to several megabases
• Working with finished and draft sequences
• Available source code and WEB site
Related publications
• O N E• Loots GG, Locksley RM, Blankespoor CM, Wang ZE, Miller W,
Rubin EM, Frazer KA. Identification of a coordinateregulator of interleukins 4, 13, and 5 by cross-speciessequence comparisons.
• Science. 2000 Apr 7;288(5463):136-40.
• T W O• Pennacchio LA, Olivier M, Hubacek JA, Cohen JC, Cox DR,
Fruchart JC, Krauss RM, Rubin EM. An apolipoproteininfluencing triglycerides in humans and mice revealed bycomparative sequencing.
• Science. 2001 Oct 5;294(5540):169-73.

20
Large scale VISTA applications:
Cardiovascular comparative genomics database http://pga.lbl.gov
Godzilla – comparing the human and mouse genomehttp://pipeline.lbl.gov
What if you don’t have a sequence of other species forthe region of your interest?
Are there publicly available comparative genomics data?
Godzilla - automatic computational system forcomparative analysis of genomes
http://pipeline.lbl.gov http://www-gsd.lbl.gov/vista
DATABase Human Genome – Golden Path Assembly
Mouse assemblies:Arachne October 2001Phusion November 2001MGSC v3 April 2002

21
Main modules of the system
Visualization Analysis of conservation
Mapping and alignment of mouse contigsagainst the human genome
Human
Mouse
Chromosome Comparison
Base pair alignment247 GGTGAGGTCGAGGACCCTGCA CGGAGCTGTATGGAGGGCA AGAGC |: || ||||: |||| --:|| ||| |::| |||---||||368 GAGTCGGGGGAGGGGGCTGCTGTTGGCTCTGGACAGCTTGCATTGAGAGG

22
Tandem Local/Global Alignment ApproachSequence fragment anchoring (DNA and/or translated BLAT) Multi-step verification of potential regions using global alignment (AVID)
Advantage of the tandem approach:
better sensitivity/specificity trade-offfill-in effectscoring longer alignments
AVIDLobalalignment
NT_002606 at Chr.17:2909457-29116113
BLATLocal alignment

23
Visualization – VistaBrowser & VistaTrack
Comparison combined with the humangenome annotation on the UCSCHuman Genome Browser
Stand-alone Java applet for detailed comparison
VistaBrowser

24
VistaTrack
Vista Plots
HumanSequence
Annotations
http://pipeline.lbl.gov/
MyGodzilla - is an interactive web tool forcomparing your favorite sequence againstthe human genome

25
MyGodzilla Tool
Submit a DNA sequence of ANY organism...… or submit a whole chromosome and analyze another Genome
Examples of Results
• Understanding the structure of conservation
• Identification of putative functional sites
• Discovery of new genes
• Detection of contamination and misassemblies

26
Two assemblies are better than one
Zoom InZoom In
Gene Name
Identification of a New Identification of a New ApoApo Gene on Human 11q23 Gene on Human 11q23
Godzilla Godzilla
Highly Conserved RegionHighly Conserved Region
ApoA4ApoA4 ApoC3ApoC3 ApoA1ApoA1

27
Identification of a New Identification of a New ApoApo Gene on Human 11q23 Gene on Human 11q23Godzilla Godzilla
New Gene (ApoA5)New Gene (ApoA5)PennacchioPennacchio LA et al. LA et al.Science. 2001, 294:169-73Science. 2001, 294:169-73..
Finding regulatory regions
Muscle Specific Regulatory Region: humanbeta enolase intronic enhancer

28
Comparative analysis of genomic intervalscontaining important cardiovascular genes
http://pga.lbl.gov
http://pga.lbl.gov/cvcgd.html
29
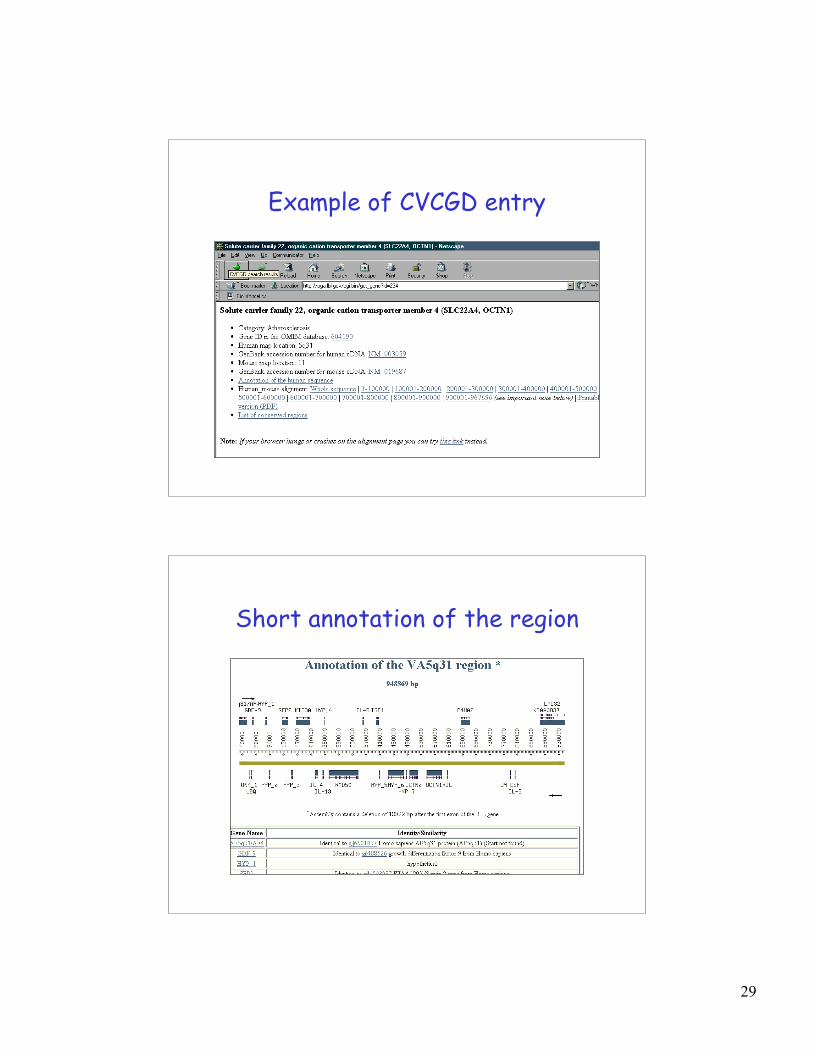
Example of CVCGD entry
Short annotation of the region

30
Detailed annotation in AceDBformat
VISTA plot of the region

31
multiVISTA plot of the region
Alignment
32
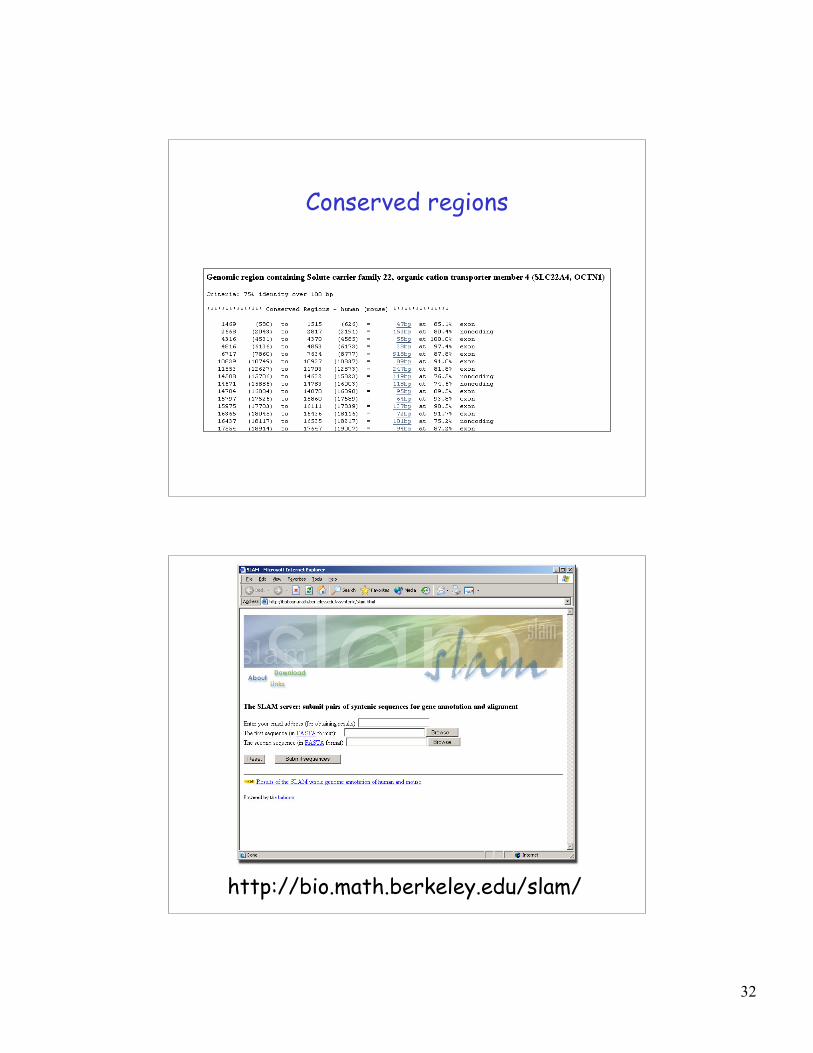
Conserved regions
http://bio.math.berkeley.edu/slam/

33
SLAM components• Splice site detector
– VLMM
• Intron and intergenic regions– 2nd order Markov chain
– independent geometric lengths
• Coding sequence– PHMM on protein level
– generalized length distribution
• Conserved non-coding sequence– PHMM on DNA level
SLAM input and output
• Input:– Pair of syntenic sequences (FASTA).
• Output:– CDS and CNS predictions in both sequences.– Protein predictions.– Protein and CNS alignment.
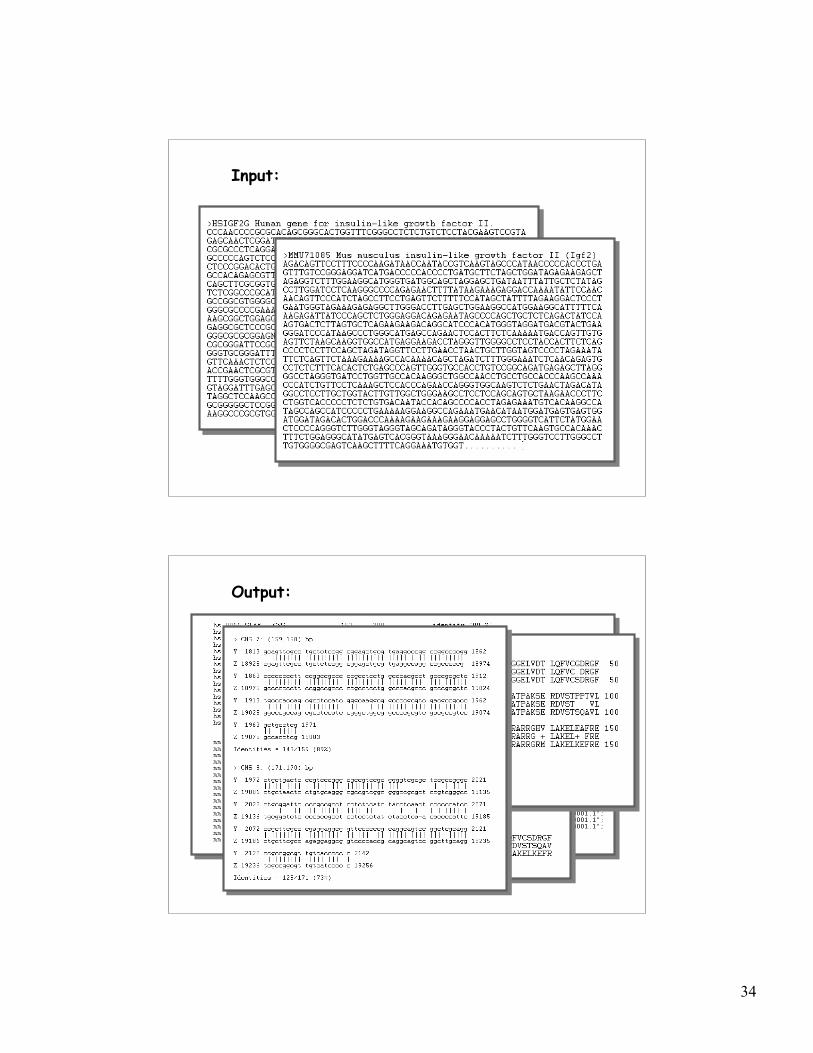
34
Input:
Output:

35
Publications on our tools:
• I. Dubchak, M. Brudno, L.S. Pachter, G.G. Loots, C. Mayor, E. M.Rubin, K. A. Frazer. (2000) Active conservation of noncodingsequences revealed by 3-way species comparisons. GenomeResearch, 10: 1304-1306.
• C. Mayor, M. Brudno, J. R. Schwartz, A. Poliakov, E. M. Rubin, K. A.Frazer, Lior S. Pachter, I. Dubchak. (2000) VISTA: Visualizingglobal DNA sequence alignments of arbitrary length.Bioinformatics, 16: 1046-1047.
• G. G. Loots, I. Ovcharenko, L. Pachter, I. Dubchak and E. M. Rubin.(2002) Comparative sequence-based approach to high-throughputdiscovery of functional regulatory elements. Genome Res., 12:832-839
• I. Dubchak, L. Pachter. (2002) The computational challenges ofapplying comparative-based computational methods to wholegenomes. Briefings in Bioinformatics, 3, 18.
Related sites
• The Human Genome Browser & BLAT programhttp://genome.ucsc.edu/
• ENSEMBLE Project (Sanger Center) http://www.ensembl.org/
• AVID alignment program
http://baboon.math.berkeley.edu/~syntenic/avid.html
• SLAM comparative gene prediction programhttp://bio.math.berkeley.edu/slam/mouse/
• PSU group's MHC Human-Mouse comparison resultshttp://bio.cse.psu.edu/mousegroup/MHC/
• PSU Pipmaker program http://bio.cse.psu.edu/pipmaker/

36
Summary
Suite of comparative genomics tools VISTAhttp://www-gsd.lbl.gov
Godzilla comparing the human and mouse genomehttp://pipeline.lbl.gov
Cardiovascular comparative genomics databasehttp://pga.lbl.gov
Questions? Write to [email protected]
Information from a SingleSequenceAlone
Multi-OrganismHigh QualitySequences
Towards Better VISTAs

37
ThanksBiology Bioinformatics
Kelly Frazer Michael BrudnoGaby Loots Olivier CouronneLen Pennacchio Brian Klock
Chris MayorIvan Ovcharenko
Alexander PoliakovJody Schwartz
Eddy Rubin Inna Dubchak
Funding – Programs for Genomic Applications (PGA) by NHLBI