Comparative Evaluation of Waste Export and Conversion Technologies
230
Transcript of Comparative Evaluation of Waste Export and Conversion Technologies
JUNE 2007

Comparative Evaluation of Waste Export and Conversion Technologies Disposal Options King County Department of Natural Resources and Parks Solid Waste Division
June 2007

001640 | 11-01056-10004 | 6/8/2007
Comparative Evaluation of Waste Export and Conversion Technologies Disposal Options
King County Department of Natural Resources and Parks Solid Waste Division
Contents
List of Tables ..................................................................................................................ix Abbreviations and Acronyms .........................................................................................xi
EXECUTIVE SUMMARY.................................................................................... ES-1
1 INTRODUCTION.............................................................................................. 1-1 Purpose .............................................................................................................. 1-1 Scope ................................................................................................................. 1-2 Nature of Review............................................................................................... 1-3
2 SOLID WASTE QUANTITY AND COMPOSITION ................................... 2-1 Solid Waste Composition .................................................................................. 2-1 Waste Disposal Quantity Projections ................................................................ 2-3 Projected Waste Composition ........................................................................... 2-3
3 REVIEW OF CONVERSION TECHNOLOGIES......................................... 3-1 Nature of Review............................................................................................... 3-1 Criteria for Determining Conversion Technologies for Further Review .......... 3-3 Conversion Technologies Reviewed ................................................................. 3-4
Thermal Conversion Technologies .......................................................... 3-5 Biological and Chemical Conversion Technologies.............................. 3-19
Additional Criteria for the County’s Consideration ........................................ 3-23 Recommendation of Technologies for Further Review .................................. 3-24
4 ANNUAL FACILITY AVAILABILITY OF CONVERSION TECHNOLOGIES............................................................................................. 4-1
General Concepts............................................................................................... 4-1 Scheduled and Unscheduled Outages................................................................ 4-2 Applications of Availability .............................................................................. 4-3 Reported Plant Availability at Reference Facilities .......................................... 4-4 Summary............................................................................................................ 4-5

Contents
vi 001640 | 11-01056-10004 | 6/8/2007
5 NON-PROCESSIBLE WASTE AT CONVERSION FACILITIES............. 5-1 What Constitutes Non-Processible Waste......................................................... 5-1 Estimated Quantity of Non-Processible Waste ................................................. 5-3
Amount of Non-Processible Waste at Existing Facilities........................ 5-4 Non-Processible Waste in King County .................................................. 5-4 Impact of Recycling on Non-Processible Waste ..................................... 5-5
6 CONVERSION TECHNOLOGY AND WASTE EXPORT FACILITY CONSIDERATIONS .................................................................... 6-1
Conversion Technology Considerations ........................................................... 6-1 Identification of County Priorities ........................................................... 6-2 Factors Impacting the Capacity of a Conversion Facility ....................... 6-2 Waste Simulation Model ......................................................................... 6-8 Factors Impacting the Number of Conversion Facilities....................... 6-13 Conclusions Regarding Capacity and Number of Conversion Facilities................................................................................................. 6-16 Size of Facility Sites .............................................................................. 6-17 Combination of Facilities Required....................................................... 6-18
Waste Export Disposal Option Facility Considerations.................................. 6-19 Siting of Intermodal Facilities ............................................................... 6-19 Sizing of Intermodal Facilities............................................................... 6-20 Other Facility Requirements.................................................................. 6-20
7 POTENTIAL IMPACTS OF RECYCLING ON CONVERSION TECHNOLOGIES............................................................................................. 7-1
Current Recycling Program............................................................................... 7-1 Future Recycling Program ................................................................................ 7-1
Level of Participation .............................................................................. 7-2 Programs Proposed to Be Added............................................................. 7-2 Goals and Objectives ............................................................................... 7-3
Recycling by Conversion Facilities................................................................. 7-14 Mass Burn Waste-To-Energy Waterwall............................................... 7-14 RDF Waste-To-Energy.......................................................................... 7-15 Advanced Thermal Recycling ............................................................... 7-15
Compatibility of Conversion Technologies and Recycling ............................ 7-16 Impact of Recycling on Conversion Facilities ................................................ 7-17
Required Disposal Capacity .................................................................. 7-17 Need for Additional Disposal Capacity................................................. 7-18 Impact on Ability to Generate Energy................................................... 7-18
Summary ......................................................................................................... 7-21
8 BACKUP DISPOSAL CAPACITY FOR CONVERSION FACILITIES ...................................................................................................... 8-1
Need for Backup Disposal Capacity ................................................................. 8-1 Backup Disposal Capacity Options................................................................... 8-1
Conversion Technology Redundancy...................................................... 8-2 In-County Disposal.................................................................................. 8-2

Contents
001640 | 11-01056-10004 | 6/8/2007 vii
Long-Haul to Regional Landfill............................................................... 8-3 Backup Disposal at Other Conversion Facilities............................................... 8-3 Conclusions ....................................................................................................... 8-4
9 RESIDUE ASH MANAGEMENT ................................................................... 9-1 Existing Regulatory Framework for Residue Ash in Washington .................... 9-2
Applicable Designation Tests .................................................................. 9-2 Factors that Impact Residue Ash Management ................................................. 9-3
Composition of Incoming Waste ............................................................. 9-3 Type of Conversion Technology Employed ............................................ 9-4 Co-Mingling of Bottom and Fly Ash....................................................... 9-6
Potential Uses for Residue Ash ......................................................................... 9-7 Likelihood that Conversion Technology Residue Could Receive a Beneficial Use Designation ............................................................................... 9-8 Conclusions ....................................................................................................... 9-8
10 ESTIMATE OF NET EMISSIONS ............................................................... 10-1 Methodology.................................................................................................... 10-2
Criteria Pollutant and Toxic Pollutant Emission Calculations .............. 10-2 Greenhouse Gas Emission Calculations ................................................ 10-7
Emission Calculations ................................................................................... 10-12 Criteria Pollutants ................................................................................ 10-12 Toxic Pollutants ................................................................................... 10-14 Greenhouse Gas Pollutants .................................................................. 10-15
Air Quality Impacts ....................................................................................... 10-18 Human Health Impacts ........................................................................ 10-19 Human Welfare Issues ......................................................................... 10-23 Ecological Damage .............................................................................. 10-25 Global Warming................................................................................... 10-26
Summary........................................................................................................ 10-28
11 ESTIMATED CAPITAL COSTS AND OPERATING EXPENSES.......... 11-1 Estimated Capital Costs................................................................................... 11-1
Conversion Technologies....................................................................... 11-1 Capital Cost............................................................................................ 11-2 Intermodal Facility................................................................................. 11-4
Estimated Annual Operating Expenses ........................................................... 11-4 Conversion Technologies....................................................................... 11-4 Cost of Residue Ash Disposal Out-of-County....................................... 11-5 Cost of Waste Export ............................................................................. 11-6
12 PROJECTED ENERGY REVENUES .......................................................... 12-1 Potential Energy Generation............................................................................ 12-1
Conversion Technology Disposal Option.............................................. 12-1 Waste Export Disposal Option............................................................... 12-2
Projected Energy Prices................................................................................... 12-4

Contents
viii 001640 | 11-01056-10004 | 6/8/2007
Projected Electricity Prices ............................................................................. 12-5 Methodology.......................................................................................... 12-5
Implied Value of Landfill Gas ........................................................................ 12-9 Projected Energy Revenues........................................................................... 12-10
Conversion Facilities ........................................................................... 12-10 Waste Export Disposal Option ............................................................ 12-10
Summary of Revenues .................................................................................. 12-11
13 TRANSFER STATION COLLECTION/TRANSPORTATION INFRASTRUCTURE...................................................................................... 13-1
Conversion Technology Implementation ........................................................ 13-1 Conclusions ..................................................................................................... 13-2
14 ESTIMATED FACILITY SITING AND PERMITTING COSTS............. 14-1 Conversion Technology Implementation ........................................................ 14-1 Waste Export Implementation......................................................................... 14-3 Conclusions ..................................................................................................... 14-3
15 COMPARATIVE COST ANALYSIS............................................................ 15-1 Financial Model............................................................................................... 15-1 Comparative Cost Assumptions ...................................................................... 15-1
Operating Revenues............................................................................... 15-1 Annual Operating and Maintenance Expenses ...................................... 15-2 Annual Debt Service Payment............................................................... 15-2 Total Net Annual Costs ......................................................................... 15-4
Net Present Value............................................................................................ 15-4 Conclusions ..................................................................................................... 15-5
16 SUMMARY OF PRINCIPAL FINDINGS.................................................... 16-1
Appendix A. OVERVIEW OF COUNTY’S CURRENT RECYCLING PROGRAM
Appendix B. BACKGROUND INFORMATION ON SPOKANE WTE FACILITY
Appendix C. PRINCIPAL ASSUMPTIONS FOR POWER PRICE FORECAST
This report has been prepared for the use of the client for the specific purposes identified in the report. The conclusions, observations and recommendations contained herein attributed to R. W. Beck, Inc. (R. W. Beck) constitute the opinions of R. W. Beck. To the extent that statements, information and opinions provided by the client or others have been used in the preparation of this report, R. W. Beck has relied upon the same to be accurate, and for which no assurances are intended and no representations or warranties are made. R. W. Beck makes no certification and gives no assurances except as explicitly set forth in this report.
Copyright 2007, R. W. Beck, Inc. All rights reserved.

ix 001640 | 11-01056-10004 | 6/8/2007
Tables 2-1 Results of King County’s 2003 Waste Characterization Study ...................... 2-2 2-2 Projected Waste Disposal Quantities .............................................................. 2-3 3-1 RDF Shredding Options................................................................................ 3-12 3-2 Proven Thermal Conversion Facilities Operating in the United States ........ 3-15 3-3 Operating Characteristics of Proven Thermal Conversion Facilities............ 3-16 3-4 Comparison of Emerging and Proven Thermal Technologies...................... 3-18 3-5 Evaluation of Criteria for Conversion Technologies .................................... 3-26 4-1 Annual Facility Availability for Three Selected Conversion
Technologies ................................................................................................... 4-5 4-2 Annual Facility Availability for Three Selected Conversion
Technologies ................................................................................................... 4-5 5-1 Typical Non-Processible Materials ................................................................. 5-2 5-2 Assumed King County Processible Percentages and Tonnages by
Conversion Technology .................................................................................. 5-5 6-1 Projected Annual Quantity of Waste Requiring Disposal............................... 6-3 6-2 Assumed Non-Processible Percentage by Conversion Technology ............... 6-4 6-3 Reported Annual Facility Availability for each Conversion
Technology...................................................................................................... 6-4 6-4 Assumed Annual Facility Availability for each Conversion
Technology...................................................................................................... 6-5 6-5 Average Monthly Disposal Quantities (2003–2006) ...................................... 6-6 6-6 Approaches to Timing Disposal Capacity Additions...................................... 6-7 6-7 Simulation Results, 2016 Projected Tonnage ............................................... 6-11 6-8 Simulation Results, 2026 Projected Tonnage ............................................... 6-12 6-9 Simulation Results, 2036 Projected Tonnage ............................................... 6-13 6-10 Advantages and Disadvantages of a Single Facility ..................................... 6-15 6-11 Advantages and Disadvantages of Multiple Facilities .................................. 6-16 7-1 Projected Quantities of Materials to be Recycled and Disposed of in
King County through 2036 Based on Current Recycling Rate (Base Case)................................................................................................................ 7-3
7-2 Projected Quantities of Material Recycled by Commodity in King County, 2016 through 2036 (Base Case) ........................................................ 7-4
7-3 Comparison of Material Being Delivered to a Conversion Facility (Base Case) ..................................................................................................... 7-5
7-4 Projected Quantities of Materials to be Recycled and Disposed of in King County through 2036 at a 60% Recycling Rate..................................... 7-6
7-5 Projected Quantities of Material Recycled by Commodity in King County, 2016 through 2036 (60% Recycling Rate) ........................................ 7-7

Tables
x 001640 | 11-01056-10004 | 6/8/2007
7-6 Comparison of Material Being Delivered to a Conversion Facility (60% Recycling Rate) ......................................................................................7-9
7-7 Projected Quantities of Materials to be Recycled and Disposed of in King County through 2036 at a 70% Recycling Rate....................................7-10
7-8 Projected Quantities of Material Recycled by Commodity in King County, 2016 through 2036 (70% Recycling Rate).......................................7-11
7-9 Comparison of Material Being Delivered to a Conversion Facility (70% Recycling Rate) ....................................................................................7-13
7-10 Recycled Material Which are Not a Good Source of Feedstock for the Recommended Conversion Technologies......................................................7-19
7-11 Recycled Material Which are Not a Good Source of Feedstock for the Recommended Conversion Technologies......................................................7-19
8-1 Methods of Backup Disposal at Existing Conversion Facilities......................8-4 10-1 Pollutant Concentrations in Landfill Gas.......................................................10-4 10-2 Typical Control Efficiencies for Landfill Gas Combustion..........................10-5 10-3 Secondary Pollutant Emission Factors for Landfill Gas Combustion ..........10-5 10-4 Emission Factors for Mass Burn, RDF, and Advanced Thermal
Recycling Conversion Technologies .............................................................10-7 10-5 Greenhouse Gas Emission Factors for Conversion Technology .................10-10 10-6 Avoided Greenhouse Gas Emission Factors................................................10-11 10-7 Estimated Criteria Pollutant Emissions for Each Disposal Technology......10-13 10-8 Estimated Toxic Pollutant Emissions for Each Disposal Technology.........10-15 10-9 Estimated Greenhouse Gas Emissions for Disposal Options ......................10-17 10-10 Ambient Air Quality Standards for Criteria Pollutants................................10-20 11-1 2007 Estimated Capital Costs ........................................................................11-3 11-2 2007 Estimated Operating Expense Unit Rates .............................................11-5 11-3 2007 Estimated Residue Ash Disposal Rates ................................................11-6 11-4 Representative Waste Export Rates ...............................................................11-7 11-5 2007 Estimated Waste Export Rates..............................................................11-7 12-1 Estimated Landfill Gas Generation................................................................12-4 12-2 Base Case Power Price Forecast ....................................................................12-8 12-3 Implied Value of Landfill Gas .......................................................................12-9 12-4 Projected Revenues from the Sale of Electricity .........................................12-10 12-5 Gross Energy Revenues from Sale of Landfill Gas .....................................12-11 14-1 Estimated Siting and Permitting Costs for Conversion Technologies...........14-2 14-2 Estimated Siting and Permitting Costs for an Intermodal Facility ................14-3 15-1 Estimated Capital Costs .................................................................................15-4 16-1 Summary Comparative Cost Analysis ...........................................................16-5
001640 | 11-01056-10004 | 6/8/2007 xi
Abbreviations and Acronyms BNSF Burlington Northern Santa Fe Btu British thermal unit C&D construction and demolition (debris) CDD chlorinated dibenzo-p-dioxins CDF chlorinated dibenzofurans CDL construction, demolition and land-clearing (debris) CH4 methane CO carbon monoxide CO2 carbon dioxide EPA United States Environmental Protection Agency HAP hazardous air pollutant HCl hydrochloric acid HDPE high density polyethylene HHW household hazardous waste hp horsepower IPCC International Panel on Climate Change ISWA Integrated Waste Services Association kWh kilowatt-hour LandGEM Landfill Gas Emissions Model LDPE low density polyethylene MACT maximum available control technology MMBtu million British thermal units MWh megawatt-hour N2O nitrous oxide NAAQS National Ambient Air Quality Standards NMOC nonmethane organic compounds NOX oxides of nitrogen NPV net present value O&M operation and maintenance OCC old corrugated cardboard ONP old newspaper (newsprint) PAH polycyclic aromatic hydrocarbons PCDD polychlorinated dibenzo-p-dioxin PCDF polychlorinated dibenzofuran

Abbreviations and Acronyms
xii 001640 | 11-01056-10004 | 6/8/2007
PETE polyethylene terephthalate PM10 particulate matter less than 10 micrometers in mass-mean diameter PM2.5 particulate matter less than 2.5 micrometers in mass-mean diameterPSD Prevention of Significant Deterioration PVC polyvinylchloride RCW Revised Code of Washington RDC Regional Disposal Company RDF refuse-derived fuel SNCR selective non-catalytic reduction SO2 sulfur dioxide TCLP Toxicity Characteristic Leaching Procedure TEF Toxic Equivalency Factor TPD tons per day TPY tons per year TSP total suspended particulate matter ug/kg micrograms per kilogram of solid material UP Union Pacific VOC volatile organic compounds WAC Washington Administrative Code WECC Western Electricity Coordinating Council WTE waste-to-energy

EXECUTIVE SUMMARY

001640 | 11-01056-10004 | 6/8/2007
EXECUTIVE SUMMARY
Introduction This report presents the results of the review and analysis undertaken by R. W. Beck, Inc. (“R. W. Beck”) of waste disposal options currently being considered by King County’s Department of Natural Resources and Parks, Solid Waste Division. The Solid Waste Division is charged with the proper management of solid waste generated in the County and has developed a comprehensive solid waste management system that includes recycling, collection, transfer, and disposal components.
At the present time, the County’s principal means of disposal is the County-owned Cedar Hills Regional Landfill, which the County currently estimates will have useful remaining life until around 2016. With approximately nine years of remaining disposal capacity, the County is considering long-term alternative disposal options that would be available by 2016. The County is currently focused on evaluating the following options:
1. The intermodal transfer and long-haul transport via rail haul to privately owned landfills located outside the County (the “Waste Export Disposal Option”).
2. The development of a solid waste conversion facility that would be capable of converting municipal solid waste into a form of recoverable energy (the “Conversion Technology Disposal Option”).
This report sets forth the results of our review of certain issues related to these two disposal options during the 20-year study period of 2016 to 2036.
Purpose of the Report It is important to note that at the County’s current stage of planning for future disposal capacity, it does not intend to make a final decision based on the results of this report. This report has focused on: 1) providing information to assist decision-makers in their understanding of the two disposal options; 2) explaining the interrelationship of the disposal options to the County’s recycling program and its transfer station and transfer fleet; and 3) providing planning estimates of capital costs, operating expenses, and operating revenues associated with the two disposal options under consideration.
EXECUTIVE SUMMARY
ES-2 R. W. Beck 001640 | 11-01056-10004 | 6/8/2007
Overview of the System At the present time, the County is responsible for the proper management of the estimated 1,775,000 tons per year of solid waste that are currently being generated within the County. The County is managing this situation through two principal means:
1. Recycling – Approximately 770,000 tons of solid waste are currently being recycled by means of a series of recycling programs the County has implemented as described in Appendix A. The County estimates that it is currently recycling approximately 44.6 percent of the total waste being generated.
2. Landfilling – Approximately 1,005,000 tons of waste are being disposed of in the County, with most of this material being disposed of at the Cedar Hills landfill. This represents approximately 55.4 percent of the solid waste being generated in the County. Most of this waste is suitable for disposal by either of the two options considered in this report.
The portion of the solid waste stream requiring disposal is currently being collected by both private and public haulers and then delivered to either one of the County’s eight transfer stations or directly to the Cedar Hills landfill.
Overview of Waste Export Disposal Option While there are several options available to the County related to intermodal capacity, in order to estimate costs and other factors for the purpose of this report, we have assumed the Waste Export Disposal Option would involve an intermodal waste transfer facility developed, operated, and owned by the County, and located on a site accessible to one or both of the railroad mainlines that serve King County. “Intermodal” refers to the fact that the containerized solid waste will be transferred from trucks to rail cars as part of the transfer operation. Solid waste collected in the County will be delivered to a County transfer station, compacted into intermodal containers, and then transferred to the intermodal facility via transfer trailer trucks. At an intermodal facility, all of the solid waste will be loaded onto intermodal container rail cars. When a full train of rail cars has been loaded, the train will transport the waste to a privately owned regional landfill. At the landfill, the containers will be unloaded at the working face of the landfill and the empty containers will be placed back on the rail cars and returned to the intermodal facility.
The transfer and transportation of solid waste via an intermodal facility is a well-proven method of solid waste disposal with relatively low risk of technology failure.

EXECUTIVE SUMMARY
001640 | 11-01056-10004 | 6/8/2007 R. W. Beck ES-3
Overview of Conversion Technology Disposal Option For the purpose of this report, “Conversion Technology” refers to a process which converts solid waste from a waste product to a useful form of energy and/or useable byproduct, generally with some residual, unusable component that must be sent for disposal.
As is discussed in Section 3 of this report, a number of different Conversion Technologies are currently being promoted by various vendors. The Conversion Technologies can generally be subdivided as follows based on the type of process:
1. Thermal 2. Biological 3. Chemical
The County directed R. W. Beck to review currently available information on all Conversion Technologies for the purpose of identifying the Conversion Technologies that merit the County’s further review and consideration. In order to qualify for further review, a Conversion Technology had to be “commercially proven.” The County defined commercially proven as facilities that have been constructed and successfully operated for at least three years at an operating size or scale suitable for the quantity and composition of the County’s projected solid waste stream.
With these criteria in mind, we reviewed the following Conversion Technologies, all of which are described in detail in Section 3:
1. Thermal-based a. Pyrolysis b. Gasification c. Plasma Arc d. Mass Burn
i. Modular starved-air ii. Modular excess-air iii. Waterwall
e. Refuse-Derived Fuel (RDF) f. Advanced Thermal Recycling
2. Biological and Chemical a. Anaerobic Digestion b. Waste-to-Ethanol c. Aerobic Digestion/Municipal Solid Waste Composting d. Thermal Depolymerization/Plastics-to-Oil e. Steam Classification/Autoclave f. Catalytic Cracking
Of these 14 Conversion Technologies, we identified three as having sufficient operating experience in the size required to meet the County’s waste disposal requirements. These three commercially proven technologies are evaluated in depth in this report:
Mass Burn – Waterwall
EXECUTIVE SUMMARY
ES-4 R. W. Beck 001640 | 11-01056-10004 | 6/8/2007
RDF Advanced Thermal Recycling
These three Conversion Technologies are well-proven methods of solid waste disposal with a manageable risk of technology failure if the Conversion Facility is designed, constructed, operated, and maintained by a vendor with proven capabilities in the operation of such Conversion Facilities.
Of the 11 remaining Conversion Technologies, we identified five technologies that we believe merit further monitoring by the County in the event that a large, operating facility comes on-line. In such an event, the County would have additional information and data to evaluate. The five technologies that we believe merit further monitoring by the County are:
Gasification Plasma Arc Anaerobic Digestion Waste-to-Ethanol Steam Classification/Autoclave
In our opinion and for the reasons discussed in Section 3, the balance of the Conversion Technologies do not merit further monitoring by the County at this time.
Number and Size of Conversion Facilities Selecting the correct number and capacity of Conversion Facilities involves a number of different trade-offs that will require consideration by the County. The arguments in favor of smaller Conversion Facilities in multiple locations throughout the County are as follows:
1. Greater redundancy for the solid waste management system as a whole, both in terms of waste disposal and energy generation.
2. Reduced cost of transporting waste from the point of collection to the point of disposal.
3. Reduced impact on just one geographic area of the County associated with traffic, noise, odors, and litter.
4. Smaller facilities make it possible to add additional disposal capacity in smaller increments as it becomes necessary.
5. Increased annual availability of the disposal capacity of the entire solid waste management system by having a greater number of processing lines.
Arguments for larger Conversion Facilities in fewer locations are as follows:
1. Due to economies of scale, larger facilities will experience:
a. lower capital costs on a dollar per ton of installed capacity basis
b. lower operating expenses on a dollar per ton of waste basis
EXECUTIVE SUMMARY
001640 | 11-01056-10004 | 6/8/2007 R. W. Beck ES-5
This in turn should result in a lower overall cost to the County
2. Siting fewer Conversion Facilities will be less expensive and time-consuming for the County.
Because of the significant cost savings, the ability of a single Conversion Facility to meet the disposal capacity requirements, and the projected quantities of waste in the County, we have concluded for the purpose of this report that the County would implement a single facility sized at 3,200 TPD. Nevertheless, for the reasons cited above, this is a decision the County would want to carefully consider.
Effect of Recycling on Conversion Technologies The County has identified plans to increase its recycling rate above the current level of 44.6 percent. For the planning purposes of this report, the County advised that R. W. Beck should assume the percentage of recycled material will increase by an average of 0.3 percent per year (the “Base Case” recycling level). The County’s recycling goal is a critical factor that would need to be addressed in greater detail before making any decision regarding the actual implementation of a Conversion Technology.
As is discussed in Sections 6 and 7 of this report, we have assumed the County will take the steps required to reach the Base Case recycling level. Our analysis indicates that if the County is able to achieve its goals and increase the Base Case level of recycling from 44.6 percent in 2007 to 47.3 percent in 2016 and 53.3 percent by 2036, the County will be able to reduce the size of a Conversion Technology in 2016 from 3,700 tons per day (TPD) to 3,200 TPD and in 2036 will require disposal capacity of 4,700 TPD instead of 5,600 TPD. This has the potential to save the County hundreds of millions of dollars in capital costs and operating expenses over the useful operating life of a Conversion Facility or during the study period for the Waste Export Disposal Option.
In developing the information on the potential impact of recycling on a Conversion Facility, our analysis concluded that:
1. Based on the Waste Characterization Study that the County prepared in 2003, there are currently additional recyclable items in the County waste stream that if recovered should allow the County to reach the Base Case recycling level.
2. There is a sufficient quantity of solid waste being generated in the County that would allow the County to reach its Base Case recycling level while implementing a Conversion Facility at 3,200 TPD.
3. The County could increase the level of recycling above the Base Case to eventually achieve 60 percent by 2036 and there would be a sufficient quantity of waste for a 3,200 TPD Conversion Facility. Under such a scenario, there may be a small effect on the net amount of energy the Conversion Facility could generate, depending upon the types of materials that are actually targeted by the County for recycling.

EXECUTIVE SUMMARY
ES-6 R. W. Beck 001640 | 11-01056-10004 | 6/8/2007
4. If the County increased the level of recycling from the Base Case to 70 percent, there would be a small shortfall in the amount of waste required to operate a 3,200 TPD Conversion Facility. Under this scenario, it should be anticipated that there would be a modest impact on the net amount of energy the Conversion Facility could generate. The County might address this shortfall by accepting waste from other jurisdictions or by deciding to construct a smaller Conversion Facility that would be compatible with the increased level of recycling.
Decisions the County makes regarding the level of future recycling will be very important for the following reasons:
1. If the County targets a recycling level that is lower than what it actually achieves, the County could have unutilized disposal capacity at a Conversion Facility, thereby potentially underutilizing millions of dollars of investment.
2. If the County targets a recycling level that is higher than what it actually achieves, the County could find itself in a situation where it does not have sufficient disposal capacity to meet its needs.
3. The timing of when additional disposal capacity may be required after 2016 could be impacted by the actual level of recycling that is achieved.
Need for Backup Disposal Capacity It is important to note that if the County proceeds with a Conversion Facility at some future time, it will not eliminate the need for access to some landfill disposal capacity. Landfill disposal capacity would be required for the following reasons:
1. Disposal of non-processible waste (construction and demolition material, oversized items, etc.) that the Conversion Facility cannot process. We estimate that this could range from 5 to 9 percent of the waste stream in the County’s transfer system.
2. Disposal of solid waste during periods when the Conversion Facility, or a portion thereof, is down for scheduled or unscheduled maintenance, or when the waste quantity exceeds the storage and processing capacity in the transfer and Conversion Facility disposal system. Properly designed, constructed, and operated Conversion Facilities can be expected to have an annual availability factor of approximately 90 percent. In addition, the Conversion Facilities should be designed to have a minimum of three days’ storage capacity in addition to the storage capacity in the transfer system. The amount of bypassed waste will vary each year dependent upon the total amount of solid waste requiring disposal (which is projected to increase each year) and the installed capacity of the Conversion Facility.
3. Disposal of residue material from the conversion process. Any of the three identified Conversion Technologies should be able to reduce the volume of waste by approximately 90 percent meaning the remaining residue will be equal to 10% of the waste on the basis of volume. However, the remaining residue material will likely be equal to 25 to 30 percent of the weight of the incoming waste. Unless
EXECUTIVE SUMMARY
001640 | 11-01056-10004 | 6/8/2007 R. W. Beck ES-7
and until a beneficial use can be found for such residue material, it will have to be landfilled. Section 9 of this report discusses different approaches to the management of residue material in Washington State.
4. Due to seasonal fluctuations in the generation of solid waste throughout the year, the County may have to bypass solid waste during peak waste generation months depending upon policy decisions the County makes regarding the size of a Conversion Facility.
Energy Generation Both of the disposal options that are considered in this report have the potential to generate some form of energy.
For the Waste Export Disposal Option, we have assumed the County will deliver its solid waste to a privately owned regional landfill. As the County’s waste decomposes in a landfill, it will produce methane gas which can be captured, cleaned, and used to generate electricity. Based on a series of planning assumptions described in Section 12, we estimate that under the Waste Export Disposal Option the County solid waste could generate approximately 39 million British thermal units (MMBtu) of energy during the study period 2016 to 2036. We further estimate that the value of such gas to a private electricity generator could be approximately $118 million (2007 dollars) during that 20-year study period.
It is important to note that it is highly likely that the landfill could continue to generate gas from County waste for at least 40 years after the County stops delivering solid waste to the landfill. We have not included the additional 40 years of gas generation after 2036 in our comparative analysis in order to facilitate the comparison between options.
It should be further noted that the County may or may not experience any financial benefit from the sale of landfill gas. Because the landfill itself, the landfill gas collection equipment, and the power generation equipment would all be owned by private parties, no landfill gas revenue will accrue directly to the County. We are not able to determine whether such landfill gas revenues will be reflected in a lower disposal fee to the County.
However, the County would realize the benefits of electricity generation from a Conversion Facility that the County owns and operates. Based on the planning assumptions set forth in Section 12 regarding power generation, heating value of the solid waste, and annual plant availabilities, we estimate that a Conversion Facility could generate approximately 11.6 million MWh of electrical energy between 2016 and 2036. We further estimate that the value of such energy would be approximately $662 million, expressed in 2007 dollars. Assuming a 3,200 TPD Conversion Facility processes approximately 1,050,000 tons of waste per year, the net value of the Conversion Facility energy revenues to the County would be approximately $31.50 per ton. These revenues would be available to help offset the capital and operating expenses of the Conversion Facility.

EXECUTIVE SUMMARY
ES-8 R. W. Beck 001640 | 11-01056-10004 | 6/8/2007
Similar to the Waste Export Disposal Option, a Conversion Facility should be expected to be capable of generating electricity well beyond the initial 20-year planning period of this report. In our opinion, a properly designed, constructed, and operated Conversion Facility could have a useful life approaching 50 years assuming the timely renewal and replacement of required items of equipment.
Comparative Costs While a Conversion Facility may be expected to generate considerable revenue over the 20-year planning period of this report, it will have a substantial capital cost and operating and maintenance expenses. As discussed in Section 11 of this report, the last new Conversion Facility constructed in the United States came on-line in 1995, so much of the construction cost information is dated. Based on our discussions with the vendors of Conversion Facilities, we estimate that the capital cost of the three Conversion Technologies discussed in this report could range as follows:
Conversion Technology
2007 Capital Cost Range ($ millions)
Mass Burn WTE $460–$520 RDF WTE $560–$610 Advanced Thermal Recycling $520–$560
It should be noted that such estimates do not include the capital cost of a County-owned intermodal facility for the transfer and transportation of residue ash and bypass waste from the Conversion Facilities
The capital cost of an intermodal facility necessary for the Waste Export Disposal Option is estimated to be in the range of $15 million to $20 million (2007 dollars), or approximately 4 percent of the capital cost of the least expensive Conversion Facility. None of these capital cost estimates includes either the cost of property or the cost of capital (debt service).
The development of detailed construction cost estimates for three Conversion Technologies and the Waste Export Disposal Option was well beyond the scope of this report. Such estimates would require three to six months to develop and would cost well in excess of $100,000 to prepare.
Based on estimates of capital cost, cost of residue ash disposal, revenues from energy production, operation and maintenance costs, and transport and disposal fees, we developed a net present value (NPV) calculation for each option to assist the County in its evaluation of the comparative costs. The results of the NPV calculation for each disposal option are shown in the following table.

EXECUTIVE SUMMARY
001640 | 11-01056-10004 | 6/8/2007 R. W. Beck ES-9
Disposal Option Total Net Present Value
($2016 millions) Net Present Value per Ton
($2016)
Mass Burn $1,116 – $1,550 $42 – $58 RDF $1,570 – $1,967 $59 – $74 Advanced Thermal Recycling $1,443 – $1,875 $54 – $70 Waste Export $1,136 – $1,263 $43 – $47
It is important to recognize that the NPV is not an estimate of the actual cost to the County of each disposal option; it is an estimate of the value of the option considering the time value of money. Further discussion of the concepts and limitations of this analysis is included in Section 15 of this report.
Net Emissions The air quality implications of the disposal options were evaluated through a review of rates of emission of various air pollutants. Pollutants were divided into three categories: 1) criteria pollutants – those with published ambient air quality standards; 2) air toxic pollutants – human health pollutants with no ambient standards; and 3) greenhouse gases – pollutants that are not normally considered toxic, but thought to contribute to the earth’s climate change. Conversion Technologies would emit pollutants directly during the study years. Developing an estimate of emission rates for criteria pollutants and air toxic pollutants is straightforward, based on the quantity of waste converted and an assumed emission factor for each pollutant. For the landfill gas technologies associated with the Waste Export Disposal Option, however, since the gases continue to be generated for many years after the 20-year study period has ended, the estimation of emission rates considered gases derived from the wastes generated during the study period out to the year 2200.
For greenhouse gases, we used an EPA method, based on international scientific consensus, where emission rate estimation for Conversion Technologies includes only those emissions that do not come from sustainably harvested biogenic sources. For Conversion Technologies this essentially means that the majority of greenhouse gas emissions are carbon dioxide resulting from the combustion of plastics and materials of mixed origin. Wood, paper, food scraps, and other biogenic materials would decompose naturally and ultimately produce the same greenhouse gas emissions, so they are not counted in the emission inventory. For the disposal of solid waste in landfills, plastics do not decompose appreciably, so they do not produce greenhouse gases. However, the organic materials do decompose in landfills and produce methane, a much more potent greenhouse gas than the carbon dioxide produced by combustion. Since the methane would not occur under natural aerobic decomposition, methane emissions are included in the inventory, even if the original source is biogenic. The majority of the landfill gas, 80 percent, is assumed to be captured and burned. This produces carbon dioxide, which is treated the same as for the Conversion Technology alternatives.

EXECUTIVE SUMMARY
ES-10 R. W. Beck 001640 | 11-01056-10004 | 6/8/2007
Two other important concepts considered in the analysis of net emissions are “avoided emissions” and “carbon storage.” Any of the options involving energy recovery are given credit for emissions that are avoided from other sources that would be needed to generate the same electricity. Carbon storage only applies to landfill alternatives, where a certain percentage of the carbon that was in the natural biogenic cycle of growth and decay is now locked beneath the surface and will not decompose in the time period being considered. Books and some other forms of paper are examples of biogenic materials that decompose very slowly.
The results of the analysis concluded that criteria pollutant emissions from all options would be expected to be well controlled and not produce any significant human health or human welfare impacts. The Conversion Technologies are estimated to generally have higher criteria pollutant emissions than landfill gas technologies, with the exception that volatile organic compound emissions from landfills are much higher than from the Conversion Technologies.
Air toxic pollutant emissions from all options would be expected to be able to be well controlled and not pose any significant human health impacts. However, landfills would be expected to have significantly higher air toxic emissions than Conversion Technologies due to the large volumes of fugitive landfill gas that are unavoidable with even the best landfills.
Solid waste is a product of human civilization and results in greenhouse gas emissions. Any properly developed solid waste management plan should be able to reduce the potential global impact of the gases that could be produced by this waste. The modern landfill alternatives considered here, with active gas collection systems and estimated 80 percent gas capture, are estimated to produce less greenhouse gas emissions than the Conversion Technologies. This conclusion disagrees with information provided by some other researchers, who have found greenhouse gases from Conversion Technology alternatives to be on par or better than landfill alternatives. We believe the difference in conclusions is explained by: 1) the modern design of the landfills considered here, compared with national average landfills that do not collect as much of the landfill gas; and 2) the relatively low avoided emissions in Washington State compared with other states where a higher percentage of the electricity is generated from coal combustion.
The potential impact of net emissions from a Conversion Facility located in the County may differ from the potential impact in other parts of the United States because of the significant amount of hydro-based power in the northwest
Major Report Conclusions This report resulted in more than 30 principal findings as listed in Section 16. The key conclusions derived from these findings are as follows:
The three Conversion Technologies and the Waste Export Disposal Option are each capable of handling the quantity and composition of the King County waste stream while meeting all applicable permit requirements.

EXECUTIVE SUMMARY
001640 | 11-01056-10004 | 6/8/2007 R. W. Beck ES-11
The Conversion Technologies are compatible with increased County recycling efforts up to a 70% recycling rate.
In general, the Conversion Technologies are slightly more expensive than the Waste Export Disposal Option.
An informed decision on disposal options will require a more detailed analysis to refine conclusions and evaluate specific characteristics not covered in this report.

Section 1 INTRODUCTION

001640 | 11-01056-10004 | 6/8/2007
Section 1 INTRODUCTION
This report presents the results of the review and analyses undertaken by R. W. Beck, Inc. (R. W. Beck) on behalf of King County’s Department of Natural Resources and Parks, Solid Waste Division. Portions of the report were prepared by the following firms working as subconsultants to R. W. Beck:
Sound Resource Management
Geomatrix
Power Waste Recovery
Purpose The purpose of this report is to review available information regarding current and emerging technologies for the processing of solid waste (“Conversion Technologies”) as potential disposal alternatives to the landfilling of the County’s solid waste at an out-of-county landfill (“Waste Export”). The County currently disposes of most of its municipal solid waste at the Cedar Hills Regional Landfill, which is located in the County. Based on the current rate of disposal and the use of land at the Cedar Hills landfill that is currently permitted for the disposal of solid waste, the County estimates that the Cedar Hills landfill will reach the end of its useful operating life in 2016. The County has determined that it does not want to continue landfilling waste in the County after the Cedar Hills landfill has been closed. Therefore, the County is currently considering two options:
1. Disposal at a solid waste conversion facility to be constructed in the County (the “Conversion Technology Disposal Option”).
2. Intermodal transfer and long-haul transport via rail to an out-of-county landfill for disposal (the “Waste Export Disposal Option”).
More specifically, the purpose of this report is to: 1) identify commercially proven Conversion Technologies in the size range required by the County; 2) identify how large a Conversion Technology facility (“Conversion Facility”) would be required to meet the County’s waste disposal requirements; 3) consider the potential impact on a Conversion Facility as the County proceeds with the implementation of its proposed recycling programs; 4) identify the potential range of capital and operating costs of the Conversion Technology and Waste Export options; 5) identify the amount of energy a Conversion Facility could be expected to generate and the level of revenues the County could receive through the sale of that energy; and 6) compare the estimated range of net air emissions of the Waste Export Disposal Option with the Conversion Technology Disposal Option during the 20-year planning period of this report.

Section 1
1-2 R. W. Beck 001640 | 11-01056-10004 | 6/8/2007
We used criteria provided by the County to select Conversion Technologies for more in-depth consideration, after an initial review of all potential Conversion Technologies. These criteria required that the Conversion Technology had to be “commercially proven.” The County defined commercially proven as facilities that have been constructed and successfully operated for at least three years at a scale similar to the County’s projected waste stream.
Scope In preparing this report, R. W. Beck performed the work pursuant to the terms and conditions set forth in the Agreement for Professional Services for Work Order Multidisciplinary Engineering Services for SWD Planning and Implementation, Contract No. E53023E dated September 5, 2005. The specific scope of services for this work was identified in Work Order No. 6 – Comparative Evaluation of Waste Export and Conversion Technologies Disposal Options – Scope of Work dated December 19, 2006. The scope of work included subtasks that called for R. W. Beck to undertake research and analysis on the following topics in order to compare the disposal options:
Type and Quantity of Acceptable Waste
Conversion Technology Review and Selection
Annual Availability of Conversion Facilities
Compatibility of Recycling Programs and Conversion Technologies
Number and Size of Conversion Facilities and Waste Export Facilities
Percent of Waste That is Unacceptable at Conversion Facilities
Backup Disposal Capacity
Composition of Residue Ash from Conversion Facilities
Current Classification of Residue Ash in Washington
Estimate of Net Air Emissions
Estimated Capital and Operating Costs
Projected Energy Revenues
Transfer Station Collection/Transportation Infrastructure
Estimated Facility Siting and Permitting Costs
Following the execution of Work Order No. 6, the County directed R. W. Beck to also prepare a comparative cost analysis that summarized the planning estimates developed in various sections of the report.

INTRODUCTION
001640 | 11-01056-10004 | 6/8/2007 R. W. Beck 1-3
Nature of Review In undertaking the analysis associated with completing the 15 subtasks identified above, R. W. Beck undertook the following efforts:
1. Contacted vendors who offer different types of Conversion Technologies to obtain information on historical level of performance and estimated capital and operating costs.
2. Reviewed available reports prepared by others regarding the Conversion Technologies.
3. Relied upon our own previous experience in reviewing Conversion Technologies for other clients.
4. Visited Germany to review the actual operation of the advanced thermal recycling Conversion Technology.
5. Utilized data and information we have developed during the last 25 years regarding the operation of mass burn and refuse-derived fuel (RDF) Conversion Technologies.
6. Contacted the operator of the Spokane, Washington Conversion Facility to obtain historical operating data.
7. Contacted the Washington State Department of Ecology to obtain information on permit requirements and the classification of residue ash.
8. Developed long-range planning estimates of the price of power in the Northwest.
9. Undertook an analysis which developed planning estimates of the potential air emissions from the Waste Export and Conversion Technology disposal options.
10. Reviewed the County’s proposed recycling goals up to 2036, the County’s Waste Characterization Study, and the County’s estimate of future waste generation.
11. Prepared a summary comparative cost analysis of the disposal options.

Section 2 SOLID WASTE QUANTITY AND COMPOSITION

001640 | 11-01056-10004 | 6/8/2007
Section 2 SOLID WASTE QUANTITY AND COMPOSITION
This section of the report presents the results of the review R. W. Beck has performed regarding the quantity and composition of solid waste currently being disposed of by the County at the Cedar Hills Regional Landfill. The quantity and composition of the solid waste are important in identifying:
1. What percentage of the waste stream is actually processible by any particular Conversion Technology.
2. The amount of non-processible waste that will have to be landfilled.
3. What portion of the waste stream currently being sent for disposal might be able to be recycled in the future and how the Conversion Technologies would impacted by increased recycling.
At the end of this section is a summary table (Table 2-3) that outlines the projected tonnage and composition of waste in select future years. This projection is a snapshot based on the assumption that the composition of the waste stream has not significantly changed between 2003 and now, and that it will not change between now and 2036. The information in Table 2-3 is used in subsequent sections of this report as a basis for assumptions about future recycling efforts and is a starting point for determining the projected quantities and composition of waste disposed of in future years. To arrive at the projection of waste requiring disposal by a Conversion Facility, future additional levels of recycled material will be subtracted from the estimated quantities shown in Table 2-3.
Solid Waste Composition In order to develop an estimate of the amount of municipal solid waste which would potentially be acceptable for each Conversion Technology, R. W. Beck reviewed the results of the Waste Characterization Study performed by the County in 2003. We believe the Waste Characterization Study provides sufficient breakdown of waste categories for the planning purposes of this report. Table 2-1 presents a summary of the results of the Waste Characterization Study. Since this information represents the composition of waste that was delivered to the Cedar Hills landfill, after the County removed waste categorized as “unacceptable” waste, Table 2-1 is assumed to show the composition of future “acceptable” waste at a Conversion Facility. To determine the composition and quantity of waste that would actually be processed by a Conversion Facility in King County, future recycling efforts (Section 7) and non-processible waste based on the particular Conversion Technology (Section 6) are subtracted from this composition.

Section 2
001640 | 11-01056-10004 | 6/8/2007 R. W. Beck 2-2
Table 2-1 Results of King County’s 2003 Waste Characterization Study
Category Tons Percent
by Weight Category Tons Percent by
Weight
Paper 218,452 23.24% Metal 65,271 6.94%
Newspaper 25,362 2.70% Aluminum cans 3,532 0.38%
OCC/Kraft paper 43,338 4.61% Other aluminum 1,995 0.21%
Low-grade recyclable paper 58,606 6.23% Tinned food cans 6,973 0.74%
High-grade printing paper 15,277 1.63% Other ferrous metal 22,367 2.38%
Bleached polycoat paper 2,981 0.32% Other nonferrous metal 690 0.07%
Paper/other materials 15,278 1.63% Mixed metals/materials 29,180 3.10%
Compostable paper 52,054 5.54% Gas metal cylinders 534 0.06%
Gift wrapping paper 415 0.04% Other Wastes 100,358 10.68%
Other paper 5,141 0.55% Construction/demolition wastes 38,826 4.13%
Plastic 101,465 10.79% Ashes 1,429 0.15%
PET #1 plastic bottles 5,981 0.64% Nondistinct fines 10,584 1.13%
HDPE #2 plastic bottles 4,739 0.50% Gypsum wallboard 8,483 0.90%
Other plastic containers 6,674 0.71% Furniture/mattresses 25,572 2.72%
Polystyrene foam 3,974 0.42% Small appliances 7,765 0.83%
Plastic film and bags 47,027 5.00% Printers/copiers/faxes 1,103 0.12%
Other plastic packaging 5,812 0.62% Office electronics 1,208 0.13%
Plastic products 13,919 1.48% Miscellaneous inorganics 5,388 0.57%
Foam rubber/padding 2,978 0.32% Household Hazardous 5,607 0.60%
Plastic/other materials 10,361 1.10% Used oil 411 0.04%
Organics (wood/yard/food) 320,230 34.07% Vehicle batteries 0 0.00%
Dimensional lumber 35,741 3.80% Household batteries 238 0.03%
Treated wood 8,854 0.94% Alkaline/button cell batteries 475 0.05%
Contaminated wood 17,699 1.88% Latex paint 313 0.03%
Roofing/siding 6,045 0.64% Oil-based paint 105 0.01%
Stumps 1,722 0.18% Solvents/thinners 44 0.00%
Large prunings 1,847 0.20% Adhesives/glues 478 0.05%
Yard Wastes 47,127 5.01% Cleaners and corrosives 184 0.02%
Other wood 13,371 1.42% Pesticides/herbicides 200 0.02%
Food wastes 187,824 19.98% Gas/fuel oil 66 0.01%
Other Organics 100,340 10.67% Antifreeze 35 0.00%
Textiles/clothes 18,748 1.99% Medical waste 481 0.05%
Carpet/upholstery/other textiles 25,192 2.68% Computer monitors 172 0.02%
Disposable diapers 25,754 2.74% Televisions 1,621 0.17%
Rubber products 2,379 0.25% Cell Phones 176 0.02%
Tires 3,553 0.38% Laptops/LCD monitors 85 0.01%
Animal carcasses 52 0.01% Other Hazardous 523 0.06%
Animal feces 18,443 1.96% Total 940,027 100.00% Miscellaneous organics 6,219 0.66%
Glass 28,304 3.01%
Clear glass containers 9,674 1.03%
Green glass containers 4,281 0.46%
Brown glass containers 5,057 0.54%
Other colored glass containers 45 0.00%
Other glass 9,247 0.98% Source: King County Department of Natural Resources and Parks, Solid Waste Division.

SOLID WASTE QUANTITY AND COMPOSITION
001640 | 11-01056-10004 | 6/8/2007 R. W. Beck 2-3
Waste Disposal Quantity Projections We reviewed information provided by the County regarding the County’s projection of the quantity of waste it anticipates will be generated in the County during the period of 2016 to 2036. These projections were created from a regression model used by the County and assume an average increase in the recycling rate of 0.3% per year. Selected years from the County’s projections are presented in Table 2-2.
Table 2-2 Projected Waste Disposal Quantities
Year Projected Waste Disposal Quantity (thousands of tons)
2016 1,164 2021 1,255 2026 1,324 2031 1,439 2036 1,555
Projected Waste Composition To determine the waste composition and tonnages for the planning period, we applied the general categorical waste composition percentages from the Waste Characterization Study in 2003 to the waste projections for the planning period. This methodology assumes that little or no change to the composition of the waste stream will occur between 2003 and 2036. The resulting composition presented in Table 2-3 is a snapshot of the projected King County waste stream and is used as a basis for future assumptions in this report, including increases in the level of recycling.

SOLID WASTE QUANTITY AND COMPOSITION
001640 | 11-01056-10004 | 2/16/09 R. W. Beck 2-4
Table 2-3: Projected Waste Category Tonnages Assumed County Waste Composition
2016–2036 Projected Tons by Year
Category Percent 2016 2021 2026 2031 2036
Total 100 1,164,301 1,255,030 1,324,286 1,438,772 1,554,841 Paper 23.24 270,584 291,669 307,764 334,371 361,345 Plastic 10.79 125,628 135,418 142,890 155,243 167,767 Organics (wood/yard/food) 34.07 396,677 427,589 451,184 490,190 529,734 Other Organics 10.67 124,231 133,912 141,301 153,517 165,902 Glass 3.01 35,045 37,776 39,861 43,307 46,801 Metal 6.94 80,802 87,099 91,905 99,851 107,906 Other Wastes 10.68 124,347 134,037 141,434 153,661 166,057 Household Hazardous 0.6 6,986 7,530 7,946 8,633 9,329
Section 3 REVIEW OF CONVERSION TECHNOLOGIES

001640 | 11-01056-10004 | 6/8/2007
Section 3 REVIEW OF CONVERSION TECHNOLOGIES
The County is evaluating waste conversion technologies (“Conversion Technologies”) as a possible disposal alternative to rail haul from the County to landfills located outside the County. For the purpose of this report, Conversion Technologies are defined to include both commercially demonstrated combustion technologies as well as emerging technologies which utilize thermal, biological and chemical conversion. In recent years, various venders have proposed a number of new Conversion Technologies as potentially viable waste management alternatives. R. W. Beck conducted a review of these technologies which included: 1) reviewing published information regarding both commercially demonstrated and emerging Conversion Technologies; 2) contacted the vendors of certain emerging Conversion Technologies; 3) relying upon information R. W. Beck had previously developed; and 4) visiting several types of facilities under review. Based on selection criteria developed by the County, R. W. Beck has classified each of the Conversion Technologies we reviewed into one of three categories:
1. Proven technology that meets the County’s selection criteria.
2. Commercially unproven technology that appears to have potential and that merits ongoing monitoring by the County during the next three to five years.
3. Unproven technology that does not currently merit ongoing monitoring by the County.
This section of the report presents a summary of our review, the County’s selection criteria that we applied, a description of the various Conversion Technologies we reviewed for the purposes of this report, our recommendations regarding the categorization of each Conversion Technology, and a discussion of additional criteria the County may wish to consider if and when it decides to procure one of the recommended Conversion Technologies.
Nature of Review To review the Conversion Technologies, R. W. Beck: 1) relied upon our own experience working on waste-to-energy projects in the solid waste industry, 2) reviewed pertinent literature, and 3) contacted vendors of specific technologies to gather data for our review. These approaches are briefly described in the following paragraphs.

Section 3
3-2 R. W. Beck 001640 | 11-01056-10004 | 6/8/2007
R. W. Beck has extensive experience evaluating different solid waste processing technologies. Facilities that we have evaluated include the following technologies:
Waste-to-energy
Mass burn, including
Modular starved air Rotary combustors Field erected
Refuse-derived fuel and material recovery plants including
Ferrous recovery – pre-incineration Aluminum recovery – eddy current separators Sorting and sizing – trommels, shredders, air classifiers Glass recovery systems
Circulating fluidized bed combustors
Co-disposal – sewage sludge and municipal solid waste in a multiple hearth furnace
Composting of municipal solid waste
Co-composting of municipal solid waste and sewage sludge
Pyrolysis of municipal solid waste
Pyrolysis of tires
Municipal solid waste to ethanol
Plasma arc
Not all of the technologies listed above were included as part of this review for the County, as they are not all applicable for the County’s stated purposes. Specifically, co-disposal with sewage sludge, co-composting with sewage sludge, and pyrolysis of tires were not included as part of this review.
R. W. Beck also reviewed published information developed by others. The publications reviewed as part of this report include:
1. Evaluation of New and Emerging Solid Waste Management Technologies prepared for the New York City Economic and Development Corporation and New York City Department of Sanitation – September 16, 2004.
2. Summary Report: Evaluation of Alternative Solid Waste Processing Technologies prepared for the City of Los Angeles – September 2005.
3. Evaluation of Alternatives to and Identification of the Preferred Residuals Processing System Recommendations Report for Durham/York Region – May 30, 2006.
4. The Municipal Waste Combustion Industry in the United States-7th Edition Resource Recovery Yearbook and Directory.

REVIEW OF CONVERSION TECHNOLOGIES
001640 | 11-01056-10004 | 6/8/2007 R. W. Beck 3-3
5. Conversion Technology Evaluation Report prepared for the County of Los Angeles – August 18, 2005.
6. European Union documentation provided by Councilmember Kathy Lambert.
7. Solid Waste Management and Greenhouse Gases: a Life Cycle Assessment of Emissions and Sinks. U.S. Environmental Protection Agency.
Finally, R. W. Beck contacted vendors of different Conversion Technologies. In our telephone contact with vendors, we used a data request form that asked for the following information:
Process description
Number of facilities where technology is employed
Year the facility went into commercial operation
Size of facility
Type of waste processed
Need for front-end processing
Amount of process residue requiring disposal (as a percent of incoming waste)
Annual plant availability
Type of recovered products
Net energy produced
Capital cost of the facility ($/ton of daily waste disposal capacity)
Operating and maintenance expenses ($/ton of waste processed)
Type of air pollution control equipment installed
Results of air emissions tests
For technologies still in the developmental stage, date the technology is expected to be commercially available.
Criteria for Determining Conversion Technologies for Further Review Vendors are currently proposing a large number of emerging solid waste Conversion Technologies. It would be prohibitively expensive for the County to request an in-depth review of all the solid waste processing technologies currently being offered in the marketplace. Therefore, the County identified four basic criteria that any Conversion Technology was required to meet in order to qualify for further consideration and review. Those criteria are as follows:
1. Previously demonstrated continuous capability of the technology, over a minimum three-year period, to process the approximate quantities and

Section 3
3-4 R. W. Beck 001640 | 11-01056-10004 | 6/8/2007
composition of waste being managed by the County at the Cedar Hills Regional Landfill.
2. Demonstrated capability of the technology to produce energy or another byproduct for which there is a proven market and which could be sold in the quantities that the facility will produce.
3. Demonstrated capability of the technology, over a minimum three-year period, to operate within the permit requirements that will be imposed by the state of Washington.
4. Demonstrated capability, over a minimum three-year period, to produce a residue product which can be disposed of or reused in accordance with state solid waste handling requirements
In addition to these four basic criteria, the County also advised that R. W. Beck should consider the following issues:
1. The facilities must utilize a technology which assures that they will be able to be in operation by 2016.
2. The report should discuss the minimum level of processible material which a technology must accept.
3. Consideration must be given to the challenges that will be presented with trying to obtain sites for multiple facilities to be located in the County. There will be some practical limit on the number of facilities that can be sited so individual unit size should be a consideration.
4. A reasonable level of “scale-up,” (i.e., increased plant size required for the County’s waste over the largest size plant now in operation) should be allowed. However, the amount of scale-up that would be required to meet the County’s requirements should not be excessive.
5. The technologies should allow for the possible installation of additional processing lines as the County’s waste quantities increase over time. The processing lines should be of sufficient size so that such installations do not have to be undertaken on too frequent a basis, allowing the units to be operated efficiently.
Conversion Technologies Reviewed For the purpose of this report, we have subdivided the Conversion Technologies as follows:
Thermal technologies
Emerging thermal technologies
Proven thermal technologies
Biological and Chemical technologies

REVIEW OF CONVERSION TECHNOLOGIES
001640 | 11-01056-10004 | 6/8/2007 R. W. Beck 3-5
Presented below is a discussion of each of the Conversion Technologies R. W. Beck reviewed and our recommendation on which technologies meet the County’s criteria for further review.
Thermal Conversion Technologies Thermal-based Conversion Technologies utilize higher temperatures and have higher conversion rates when compared to other conversion processes. For the purpose of this report, our review of thermal technologies included proven and emerging thermal technologies. The proven thermal Conversion Technologies we reviewed are mass burn combustion, refuse-derived fuel burned in dedicated boilers, and advanced thermal recycling as employed in Germany. The emerging thermal Conversion Technologies we reviewed are pyrolysis, gasification, and plasma arc.
Emerging Thermal Conversion Technologies The following paragraphs present a discussion of the three emerging thermal Conversion Technologies R. W. Beck reviewed and our recommendation regarding whether each technology should be further reviewed based on the County’s criteria.
Pyrolysis and gasification, though we deem them “emerging” technologies in the context of this report, are not new technologies. These two technologies have been used to process coal since the early 20th century. Attempts were made in the 1970s to apply pyrolysis to the processing of municipal solid waste at several facilities in the United States but those projects failed, primarily due to difficulties with the front-end waste processing of the solid waste. While the application of these technologies to solid waste feedstocks is only emerging in the United States, these technologies have been applied for the management of solid waste in other parts of the world such as Japan and Europe.
Pyrolysis Pyrolysis is a process that produces pyrolytic oils and fuel gases that can be used directly as boiler fuel or refined for higher quality uses such as engine fuels, chemicals, adhesives, and other products. Solid residues from pyrolysis contain most of the inorganic portion of the feedstock, as well as large amounts of solid carbon or char. Pyrolysis typically occurs at temperatures in the range of 750°F to 1,500°F and thermochemically degrades the feedstock without the addition of air or oxygen. Because air or oxygen is not intentionally introduced or used in the reaction, pyrolysis requires thermal energy that is typically applied indirectly by thermal conduction through the walls of the containment reactor. The reactor is usually filled with an inert gas to aid in heat transfer from the reactor walls and to provide a transport medium for removal of the gaseous products.
The composition of the pyrolytic product is changed by the temperature, speed of process, and rate of heat transfer. Lower pyrolysis temperatures usually produce more liquid products and higher temperatures produce more gases. Slow pyrolysis is used to maximize the yield of solid char and is commonly used to make charcoal from wood feedstock. Fast or “flash” pyrolysis is a process that uses a shorter exposure

Section 3
3-6 R. W. Beck 001640 | 11-01056-10004 | 6/8/2007
time to temperatures of approximately 930°F. Typical exposure times for fast pyrolysis are less than one second. Rapid quenching of pyrolytic decomposition products is used to “freeze” the decomposition products and condense the liquids before they become low molecular weight gaseous products. This process results in a product that is up to 80 percent liquid by weight.
Combustion of the gases produced during the pyrolytic reaction in a separate reaction chamber release significant thermal energy. The thermal energy can produce steam for electricity generation, heat the pyrolytic reaction chamber, or dry the feedstock entering the reaction chamber. If pyrolytic gases are combusted to produce electricity, air emission control equipment will be needed to meet regulatory standards.
The municipal solid waste feedstock requires shredding to a 12-inch maximum size prior to charging the pyrolysis reactors.
To learn more about the status of the pyrolysis Conversion Technology, R. W. Beck attempted to contact Graveson Energy Management and WasteGen UK Ltd., two of the major suppliers. The U.S. representative of Graveson Energy Management was not reachable. Graveson Energy Management has not built a full-scale facility in the United States and their technology requires an extremely high size reduction of the feedstock to less than one inch. Due to this significant technical constraint, R. W. Beck eliminated this pyrolysis Conversion Technology from further consideration. Since a response was not received from WasteGen, our assessment relied upon published data. Other suppliers of the pyrolysis Conversion Technology have pilot or demonstration experience processing municipal solid waste, but no full-scale facilities are in commercial operation.
The net energy generation rate for the pyrolysis Conversion Technology can reportedly approach 700 kWh per ton of waste processed. Two facilities with WasteGen technology are operating in Germany, the oldest facility having operated continuously for 22 years. The largest operating unit with over three years of experience processing municipal solid waste and similar waste is rated at 175 TPD and is located in Hamm-Uentrop, Germany. The large scale-up of this technology for application in King County represents a potential area of risk. Brightstar Environmental constructed a single 30,000 TPY (2 units at estimated 50 TPD each) facility in Wollongong, New South Wales, Australia. The commercial-scale facility operated in test phase from 2000 to 2004 and was shut down in April 2004. The Brightstar facility reportedly had problems with the char gasification component of the process and corresponding financial problems with the plant. A proposed facility in the United States with the same conversion technology in Collier County, Florida was canceled.
Furthermore, no facilities employing pyrolysis to process MSW are commercially operating in the United States. Based on the lack of commercial application at the size and service duration required to process the County’s waste, R. W. Beck does not recommend the County pursue the pyrolysis technology at this time. We further recommend the County should not consider pyrolysis as a viable conversion technology either currently or in the future unless and until this technology is demonstrated at a commercially proven scale appropriate to the County’s needs.
REVIEW OF CONVERSION TECHNOLOGIES
001640 | 11-01056-10004 | 6/8/2007 R. W. Beck 3-7
Gasification Two types of gasification technologies exist: 1) fluid bed gasification and 2) two-stage (pyrolysis-gasification) fixed bed. These technologies involve the thermal conversion of organic carbon-based materials in the presence of internally produced heat, typically at temperatures of 1,400°F to 2,500°F, and in a limited supply of air/oxygen (less than stoichiometric, or less than is needed for complete combustion) to produce a synthetic gases (“syngas”) composed primarily of hydrogen and carbon monoxide. Inorganic materials are converted either to bottom ash (low-temperature gasification) or to a solid, vitreous slag (high-temperature gasification that operates above the melting temperature of inorganic components). Some of the oxygen injected into the system is used in reactions that produce heat, so that pyrolysis (endothermic) gasification reactions can initiate, after which the exothermic reactions control and cause the gasification process to be self-sustaining. Like pyrolysis, most gasification systems are closed systems and do not generate waste gases or air emission sources during the gasification phase. An important aspect of gasification is that the chemical reactions can be controlled for the production of different products. The gases produced by gasification can be cleaned to remove any unwanted particulates and compounds prior to use as fuel. After cooling and cleaning in an emission control system, the syngas can be utilized in boilers, gas turbines, or internal combustion engines to generate electricity, or the syngas can be used to make chemicals. Synthetic gases can produce methanol, ethanol, and other fuel liquids and chemicals.
All gasification technologies require preprocessing to reduce the size of the MSW feedstock, generally to a size of between 2 and 12 inches.
In low-temperature gasification, which takes place below the melting point of most inorganic constituents, a powdery to clinker-type of bottom ash is formed. In high-temperature gasification, the inorganic ash materials exit the bottom of the gasifier in a molten state, where the slag falls into a water bath, and is quenched and crystallized into a glassy, non-hazardous slag. The slag is crushed to form grit that can be easily handled. Slag can be used in the manufacture of roofing tiles or it can be used as sandblasting grit or asphalt filler. Bottom ash may require landfilling, although some suppliers have been able to use it to manufacture ceramic-like bricks or paving stones. One system that utilizes oxygen injection creates extremely hot temperatures in the bottom of the gasifier, reaching the melting temperature of some metals. In that process, metals can be recovered in ingot form. Reuse of the slag after this metal recovery would result in a very high MSW reduction rate. Fly ash from the air emission control system is the primary process residue. A facility with the gasification Conversion Technology reportedly can reduce the feedstock by weight by more than 90 percent. If this rate of reduction is correct, it would represent an improvement over traditional thermal conversion technologies, which can reduce the volume of MSW by 90 percent, but the weight by only 75 percent. The reduction rate of the gasification technology can reportedly vary from almost 80 percent to over 90 percent by weight.
As part of this review, R. W. Beck requested information from Ebara Corporation, Global Energy Solutions, Ntech Environmental (Entech Renewable Energy System licensee), and Interstate Waste Technologies (Thermoselect licensee). We received
Section 3
3-8 R. W. Beck 001640 | 11-01056-10004 | 6/8/2007
responses from Global Energy Solutions and Interstate Waste Technologies, and for the other potential suppliers we relied on published data. Twelve facilities employing Ebara technology are reported to be operating worldwide. Global Energy Solutions claims 23 operating facilities worldwide, of which four facilities process MSW. Forty-seven facilities employing technology by Entech Renewable Energy System are reported to be operating worldwide, of which 12 small facilities process MSW. Seven smaller facilities using Thermoselect technology are reported to be operating worldwide. Several Thermoselect facilities are in the development stage. Furthermore, no facilities employing gasification to process MSW are commercially operating in the United States.
For fluid bed technologies, the net energy generation rate can vary from almost 400 to 450 kWh per ton of waste processed, which is somewhat lower than the conversion rate of traditional thermal Conversion Technologies. For two-stage (pyrolysis-gasification) fixed bed technologies, the net energy generation rate reportedly can vary from almost 700 to over 900 kWh per ton of waste processed, which is significantly higher than traditional thermal Conversion Technologies. Global Energy Solutions has the largest operating unit, a facility in Tokyo, Japan, rated at 180 TPD with over three years of experience processing MSW. Scale-up of this technology for application in the County represents a potential area of risk. A facility in Karlsruhe, Germany, a Thermoselect system, had problems that led to considerable delays in commissioning. That 792-TPD facility was finally commissioned in 2001 at a reduced processing capacity and was shut down in 2004 due to environmental, economic, and litigation issues.
The current unit capital cost for a new facility is estimated to range from around $146,000 to $181,000 per TPD of installed capacity. The current unit operating and maintenance (O&M) cost is approximately $57 to $65 per ton of waste processed. The capital cost is somewhat lower than a proven thermal Conversion Technology and the O&M costs are somewhat higher.
Based on the lack of successful commercial application at the size required by the County, R. W. Beck does not recommend the County pursue gasification technology at this time. However, further improvements in gasification in general are currently underway and we recommend the County continue to monitor the gasification technology for future advancement and applicability.
Plasma Arc Plasma arc technology is a heating method that can be used in both pyrolysis and gasification systems. This technology was developed for the metals industry in the late 19th century. Plasma arc technology uses very high temperatures to break down the feedstock into elemental byproducts.
Plasma is a collection of free-moving electrons and ions that is typically formed by applying a large voltage across a gas volume at reduced or atmospheric pressure. When the voltage is high enough, and the gas pressure low enough, electrons in the gas molecules break away and flow toward the positive side of the applied voltage. The gas molecules, losing one or more electrons, become positively charged ions that are capable of transporting an electric current and generating heat when the electrons

REVIEW OF CONVERSION TECHNOLOGIES
001640 | 11-01056-10004 | 6/8/2007 R. W. Beck 3-9
drop to a stable state and release energy. This same is inherent in atmospheric lightning.
Plasma arc devices or “plasma torches” can be one of two types: 1) the transferred torch; and 2) the non-transferred torch. The transferred torch creates an electric field between an electrode, at the tip of the torch, and the reactor wall or conducting slag bath. When the field strength is sufficiently high, an electric arc is created between the electrode and reactor, much like an automotive spark plug. The non-transferred torch creates the electric arc internal to the torch and sends a process gas, such as air or nitrogen, through the arc where it is heated and then leaves the torch as a hot gas.
Very high temperatures are created in the ionized plasma. The plasma can reach temperatures of 7,000ºF and higher; the non-ionized gases in the reactor chamber can reach 1,700ºF to 2,200ºF; and the molten slag is typically around 3,000ºF. For applications in processing MSW, the intense heat actually breaks up the molecular structure of the organic material to produce simpler gaseous molecules such as carbon monoxide, hydrogen, and carbon dioxide. The inorganic material is vitrified to form a glassy residue. A main disadvantage of the plasma arc systems used in power generation is that a large fraction of the generated electricity is required to operate the plasma torches, which reduces net electrical output of the facility.
The MSW feedstock requires shredding to a 6-inch maximum size prior to charging the plasma arc reactors.
Byproducts of plasma gasification are similar to those produced in high-temperature gasification, as noted previously. Due to the very high temperatures produced in plasma gasification, carbon conversion nears 100 percent.
The net energy generation rate reportedly can vary significantly depending on the facility throughput. The parasitic load of the torches at plasma arc facilities is significant.
Hitachi Metals, Inc. has developed two commercial solid waste plasma arc facilities with the Westinghouse Plasma system in Japan. The facility in Utashinai has the largest operating unit, rated at 83 TPD with over three years of experience while processing MSW and auto-shredder residue. Existing systems use two operating and one spare torch per reactor. This scale of plasma arc technology has also been used in a General Motors plant in Defiance, Ohio, since 1989. The General Motors facility melts scrap metal for engine block castings. The plasma heating elements there have logged more than 500,000 hours of operation.
A leading supplier of the plasma arc Conversion Technology using the Westinghouse Plasma system is a company named Geoplasma. R. W. Beck relied upon published data about the plasma arc Conversion Technology offered by Geoplasma. Several other suppliers that were not evaluated in this report offer this Conversion Technology for small-scale facilities. Each gasification unit at Geoplasma’s proposed facilities would use approximately the same size plasma-heated cupola as the one installed at the Ohio plant. For a larger facility, Geoplasma proposes that it would add more processing lines in parallel. Geoplasma has not developed any plasma arc facilities. Geoplasma was selected to build a 3,000-TPD MSW facility in St. Lucie County,
Section 3
3-10 R. W. Beck 001640 | 11-01056-10004 | 6/8/2007
Florida. St. Lucie County is currently negotiating an agreement with Geoplasma to develop the project.
No MSW facilities employing the plasma arc Conversion Technology are commercially operating in the United States. Scale-up of this technology for application in King County represents a potential area of risk to the County. R. W. Beck does not recommend that the County pursue the plasma arc technology at this time due to the lack of commercial applications in the size and service duration required to process the County’s waste. We further recommend the County monitor the plasma arc technology for future advancement and applicability, particularly if the 3,000-TPD facility in Florida actually proceeds.
Summary of Emerging Thermal Technologies Note that all three of the emerging thermal Conversion Technologies require front-end processing of the waste and two require reducing the waste to a size of 6 inches or less. As discussed previously in this section, R. W. Beck has found that such processing of MSW can result in significant technical challenges. We also note that the reported energy generation potential of pyrolysis and gasification are significantly higher than more proven thermal Conversion Technologies such as mass burn or RDF. The reported capital cost of the gasification Conversion Technology is slightly lower than, and the O&M expenses are comparable to or higher than, proven thermal Conversion Technologies.
Proven Thermal Conversion Technologies R. W. Beck has identified three proven thermal Conversion Technologies, mass burn, RDF, and advanced thermal recycling. These technologies employ both modular (prefabricated) and field-erected systems, refractory and waterwall combustors, and starved air and excess air combustion technologies, in the appropriate combinations. In the following subsections we also discuss the rotary combustor technology, since a number of such facilities are in operation domestically. We have not included facilities in this discussion that have no current application in the waste-to-energy industry (for example, an RDF facility with modular, starved air combustion systems).
Mass Burn Waste-to-Energy Systems Mass burn waste-to-energy systems can be basically divided into three separate technologies: 1) modular starved air systems, 2) modular excess air systems, and 3) field-erected excess air systems. The modular starved air systems were historically used for small applications (under 400 TPD). These facilities typically combine several refractory lined combustors, each rated for around 90 TPD, in the number necessary to dispose of the quantities of waste available in the area. These refractory lined combustors generally have two chambers in which the municipal solid waste is introduced and pushed through several steps, during which the fuel is first dried, then combusted, and then completely burned with the ash removed into a submerged conveyor. The combustion is conducted without adequate amounts of oxygen (starved); additional air is introduced in the secondary chamber where the combustion is fully completed. Many of these modular starved air systems are used in small

REVIEW OF CONVERSION TECHNOLOGIES
001640 | 11-01056-10004 | 6/8/2007 R. W. Beck 3-11
applications for incineration only. If energy recovery is desired, a separate waste-heat boiler is included to convert the hot gases from incineration into steam to drive a steam turbine connected to an electric generator.
The modular excess air waste-to-energy system can be described as the rotary combustor systems in use in several facilities in the United States. These facilities use a rotating cylindrical combustor in combination with a waste-heat boiler to create steam for electrical production. The combustors are constructed with tube material that circulates water to absorb the heat of combustion and heat the water being used in the waste-heat boiler to create the steam for use in the steam turbine-generator. The municipal solid waste tumbles through the inclined combustor and falls out of the combustor onto an after-burning grate system which allows for the complete burnout of the municipal solid waste fuel.
The type of waste-to-energy facility most prevalent in the United States uses the field-erected, excess air technology. With this technology, the incinerator and boiler are one system; the walls of the incinerator are constructed of tubing in which water circulates as part of the steam generation process. The mass burn technology typically utilizes an overhead crane to feed municipal solid waste from a pit into a chute that deposits it onto an inclined surface upon which the material burns in the presence of more than enough (excess) air to achieve complete combustion. The heat generated during combustion is transferred through the waterwalls to create steam. In addition, the waterwall boilers are typically provided with additional tubing in other sections of the boiler to create superheated steam, which improves the generation of electricity, and other tubes to preheat the feedwater, which improves the efficiency of the boiler process. The superheated steam is sent to a steam turbine connected to an electric generator to create electric power. Some facilities use steam turbines that allow for extraction of steam at some specific pressure level to be sold to an adjacent industry that may require process steam.
RDF Systems Refuse-derived fuel systems have been employed as a means to improve the quality of the municipal solid waste prior to combustion and to provide a means to recover materials prior to combustion. All RDF systems operating in the United States today are being used in combination with field-erected waterwall boilers. There are no RDF systems being used in combination with modular starved air combustion systems. RDF systems can be used to prepare fuel to be used with different types of combustors, including fluid bed combustors or other industry boilers (cement kilns, pulverized coal units, etc). For the purposes of this report, we have assumed that an RDF plant for the County must be provided with its own combustion unit and that the County would not prepare RDF with the intention of selling it as fuel to some existing boiler unit.
RDF systems can be arranged in several different forms. There are several material processing systems that are typically used in an RDF plant, including shredders, magnets, eddy current separators, trommels, and picking stations. What differentiates each RDF system is the combination of preprocessing systems that it uses, and the order in which these systems are arranged. Several types of shredders can be
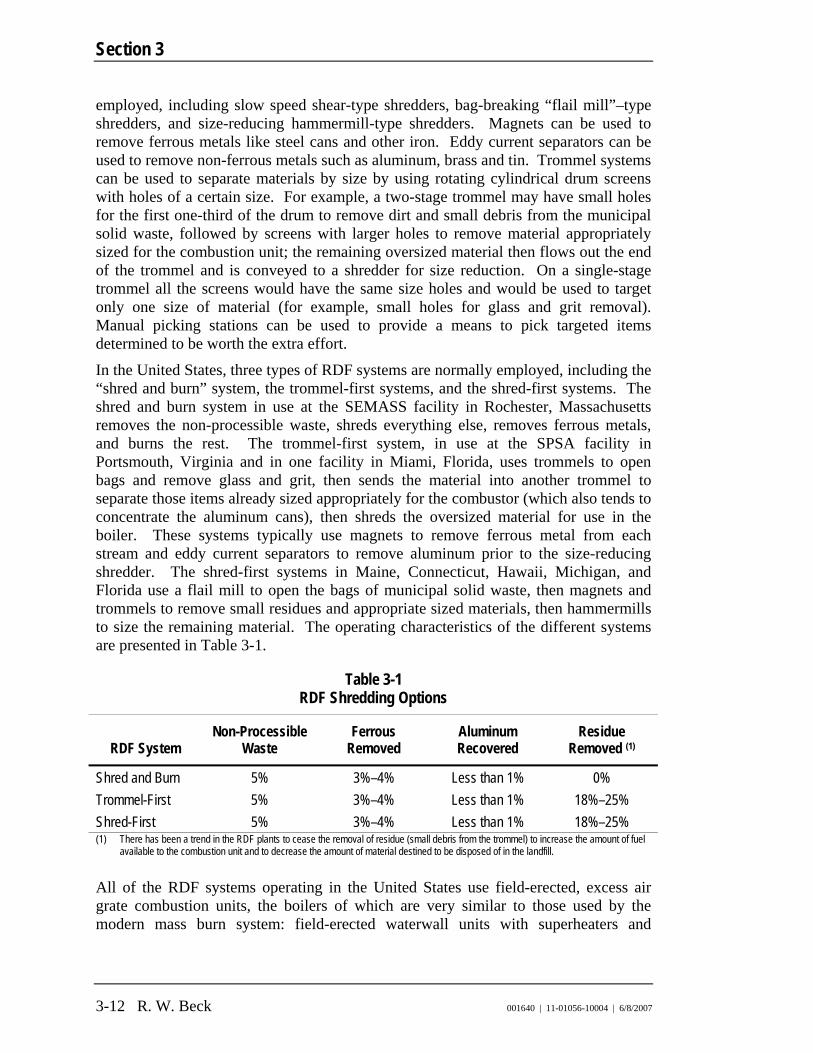
Section 3
3-12 R. W. Beck 001640 | 11-01056-10004 | 6/8/2007
employed, including slow speed shear-type shredders, bag-breaking “flail mill”–type shredders, and size-reducing hammermill-type shredders. Magnets can be used to remove ferrous metals like steel cans and other iron. Eddy current separators can be used to remove non-ferrous metals such as aluminum, brass and tin. Trommel systems can be used to separate materials by size by using rotating cylindrical drum screens with holes of a certain size. For example, a two-stage trommel may have small holes for the first one-third of the drum to remove dirt and small debris from the municipal solid waste, followed by screens with larger holes to remove material appropriately sized for the combustion unit; the remaining oversized material then flows out the end of the trommel and is conveyed to a shredder for size reduction. On a single-stage trommel all the screens would have the same size holes and would be used to target only one size of material (for example, small holes for glass and grit removal). Manual picking stations can be used to provide a means to pick targeted items determined to be worth the extra effort.
In the United States, three types of RDF systems are normally employed, including the “shred and burn” system, the trommel-first systems, and the shred-first systems. The shred and burn system in use at the SEMASS facility in Rochester, Massachusetts removes the non-processible waste, shreds everything else, removes ferrous metals, and burns the rest. The trommel-first system, in use at the SPSA facility in Portsmouth, Virginia and in one facility in Miami, Florida, uses trommels to open bags and remove glass and grit, then sends the material into another trommel to separate those items already sized appropriately for the combustor (which also tends to concentrate the aluminum cans), then shreds the oversized material for use in the boiler. These systems typically use magnets to remove ferrous metal from each stream and eddy current separators to remove aluminum prior to the size-reducing shredder. The shred-first systems in Maine, Connecticut, Hawaii, Michigan, and Florida use a flail mill to open the bags of municipal solid waste, then magnets and trommels to remove small residues and appropriate sized materials, then hammermills to size the remaining material. The operating characteristics of the different systems are presented in Table 3-1.
Table 3-1 RDF Shredding Options
RDF System Non-Processible
Waste Ferrous
Removed Aluminum Recovered
Residue Removed (1)
Shred and Burn 5% 3%–4% Less than 1% 0% Trommel-First 5% 3%–4% Less than 1% 18%–25% Shred-First 5% 3%–4% Less than 1% 18%–25% (1) There has been a trend in the RDF plants to cease the removal of residue (small debris from the trommel) to increase the amount of fuel
available to the combustion unit and to decrease the amount of material destined to be disposed of in the landfill.
All of the RDF systems operating in the United States use field-erected, excess air grate combustion units, the boilers of which are very similar to those used by the modern mass burn system: field-erected waterwall units with superheaters and

REVIEW OF CONVERSION TECHNOLOGIES
001640 | 11-01056-10004 | 6/8/2007 R. W. Beck 3-13
economizers.1 The differences between mass burn and RDF combustion units are associated with the grate systems. The majority of RDF units use a horizontal grate system, compared to the inclined grate systems used by the mass burn facilities.
Advanced Thermal Recycling Systems Advanced thermal recycling represents a second-generation advancement of technology which, similar to mass burn, uses complete combustion of organic carbon-based materials in an oxygen-rich environment, typically at temperatures of 1,300°F to 2,500°F, producing an exhaust gas composed primarily of carbon dioxide and water with inorganic materials converted to bottom ash and fly ash. The hot exhaust gases flow through a boiler, where steam is produced for driving a steam turbine-generator, generating electricity. The cooled waste gases flow through an advanced emission control system designed to capture and recover components in the flue gas, converting them to marketable byproducts such as gypsum (e.g., for wallboard manufacture) and hydrochloric acid (used for water treatment). Typical recovery rates of gypsum and hydrochloric acid from municipal solid waste on a weight basis are 0.3 and 1.3 percent, respectively. The bottom ash and fly ash are segregated, allowing for recovery/recycling of metals from the bottom ash, and use of the bottom ash as a road base and construction material provided such materials meet regulatory requirements. The post-combustion materials recovery and emissions control systems go beyond the technology utilized at conventional waste-to-energy plants such as the Spokane Regional Waste-to-Energy Facility.
1 In Europe, there are several RDF facilities that use fluidized bed combustion to burn RDF. Specifically, these involve circulating and bubbling bed technology. R. W. Beck has not focused on these technologies since there are no U.S. applications that meet the size and operating history requirements of the County. However, for the sake of completeness, we have provided this brief description.
Fluidized bed combustion is a method of burning solid fuel in suspension in a bed of small inert particles, which are kept in a state of agitation and fluidity by the upward flow of combustion air and gases of combustion. This technology makes it possible to efficiently burn a broad range of low-grade fuels, including MSW and RDF.
In the bubbling bed combustor, the particles of burning fuel and inert bed material are not intended to be carried out of the combustor, but to remain in the combustion chamber where combustion is accomplished in the 4 to 5 feet of bed depth. When the bubbling bed is at rest, before the high velocity air flow is started, the depth of the fuel and inert material is about 2 feet. With re-circulation of fly ash, the bubbling bed combustor approaches the circulating fluidized bed in operating characteristics.
The circulating fluidized bed differs from the bubbling bed type in that the circulating fluidized beds have a significant amount of partially burned fuel and inert material particles that are carried out of the combustion section and into a cyclone-type separator. The cyclone-separator permits the hot combustion gas, along with particles too fine to be retained by the cyclone-separator, to pass into the steam generator section of the assembly. The cyclone-separator is a device with a gas pass arrangement which produces a high velocity spiral flow of the gases and entrained particles. Centrifugal force causes the particles greater than a certain predetermined size to be recirculated back into the combustion chamber for increased residence time, which improves fuel burnup. We are aware of only two circulating fluid bed units burning 100 percent RDF (most systems burn a combination of fuels); both of those are in Europe and neither approaches the size criteria of the County.
Section 3
3-14 R. W. Beck 001640 | 11-01056-10004 | 6/8/2007
The feedstock for advanced thermal recycling systems can be unprocessed municipal solid waste or RDF. Using lower moisture content and removal of non-combustible materials, RDF improves the heating value of the feedstock, resulting in higher efficiency and lower throughput per kWh of electricity generated. To improve economics and efficiency, facilities can incorporate preprocessing to remove marketable recyclables such as paper, plastics, metals, and glass.
Materials handling involves extensive recycling and reuse of solid and liquid residues, which can include various marketable byproducts, as described in the previous paragraphs. These materials handling innovations reportedly result in disposal of less than 5 percent of process residues, which will be inert. With these innovations, the disposed weight reduction rate of the advanced thermal recycling technology can reportedly vary from 80 percent to over 95 percent.
R. W. Beck conducted a telephone conversation and received a written response from a representative of Waste Recovery Seattle International LLC, a licensee of the advanced thermal recycling Conversion Technology. This technology is proven in two full-scale, commercial facilities in Hamburg, Germany. Muellverwertung Borsigstrasse Damm (MVB), the oldest facility, has been operational since 1994. The Muellverwertung Rugenberger Damm (MVR) facility has reportedly operated at over 90 percent annual availability.
The net energy generation rate is on the order of 550 kWh per ton of waste processed. The MVR facility has the largest operating unit, with over three years of experience processing MSW and rated at 580 TPD. Based on this size, significant scale-up of this technology for application in the County is not necessary. A new facility under construction in Berlin, Germany will employ a steam reheat cycle, increasing the anticipated net energy generation rate to 850 kWh per ton.
The present unit capital cost for a new facility is estimated to be around US$180,000 per TPD of installed capacity. The present unit O&M cost is reported to be approximately US$47 per ton.
No facilities employing the advanced thermal recycling Conversion Technology are commercially operating in the United States. Based on the sizes of the facilities that have been installed and the number of years the advanced thermal recycling technology has been in commercial operation, the advanced thermal recycling Conversion Technology was considered in depth.
Summary of Proven Thermal Technologies Table 3-2 presents general information of representative facilities in the United States. Table 3-3 presents operating characteristics for proven thermal Conversion Facilities, including advanced thermal recycling facilities in Germany.
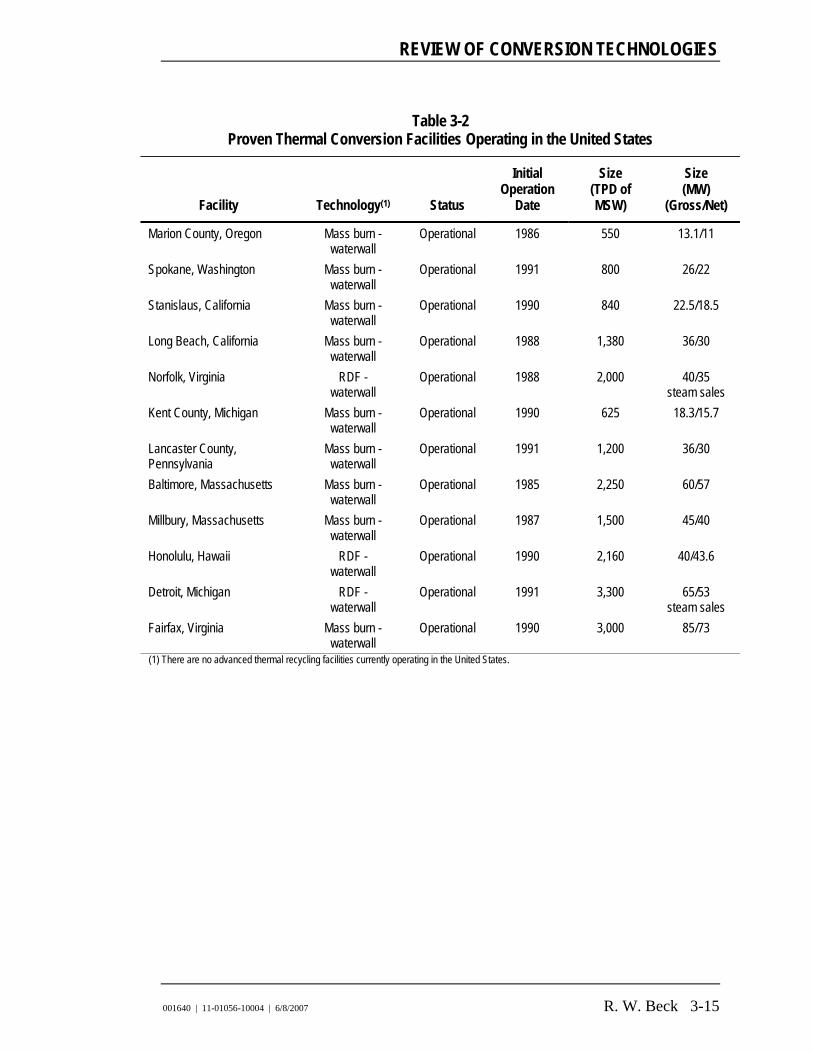
REVIEW OF CONVERSION TECHNOLOGIES
001640 | 11-01056-10004 | 6/8/2007 R. W. Beck 3-15
Table 3-2 Proven Thermal Conversion Facilities Operating in the United States
Facility Technology(1) Status
Initial Operation
Date
Size (TPD of MSW)
Size (MW)
(Gross/Net)
Marion County, Oregon Mass burn -waterwall
Operational 1986 550 13.1/11
Spokane, Washington Mass burn -waterwall
Operational 1991 800 26/22
Stanislaus, California Mass burn -waterwall
Operational 1990 840 22.5/18.5
Long Beach, California Mass burn -waterwall
Operational 1988 1,380 36/30
Norfolk, Virginia RDF - waterwall
Operational 1988 2,000 40/35 steam sales
Kent County, Michigan Mass burn -waterwall
Operational 1990 625 18.3/15.7
Lancaster County, Pennsylvania
Mass burn -waterwall
Operational 1991 1,200 36/30
Baltimore, Massachusetts Mass burn -waterwall
Operational 1985 2,250 60/57
Millbury, Massachusetts Mass burn -waterwall
Operational 1987 1,500 45/40
Honolulu, Hawaii RDF - waterwall
Operational 1990 2,160 40/43.6
Detroit, Michigan RDF - waterwall
Operational 1991 3,300 65/53 steam sales
Fairfax, Virginia Mass burn -waterwall
Operational 1990 3,000 85/73
(1) There are no advanced thermal recycling facilities currently operating in the United States.
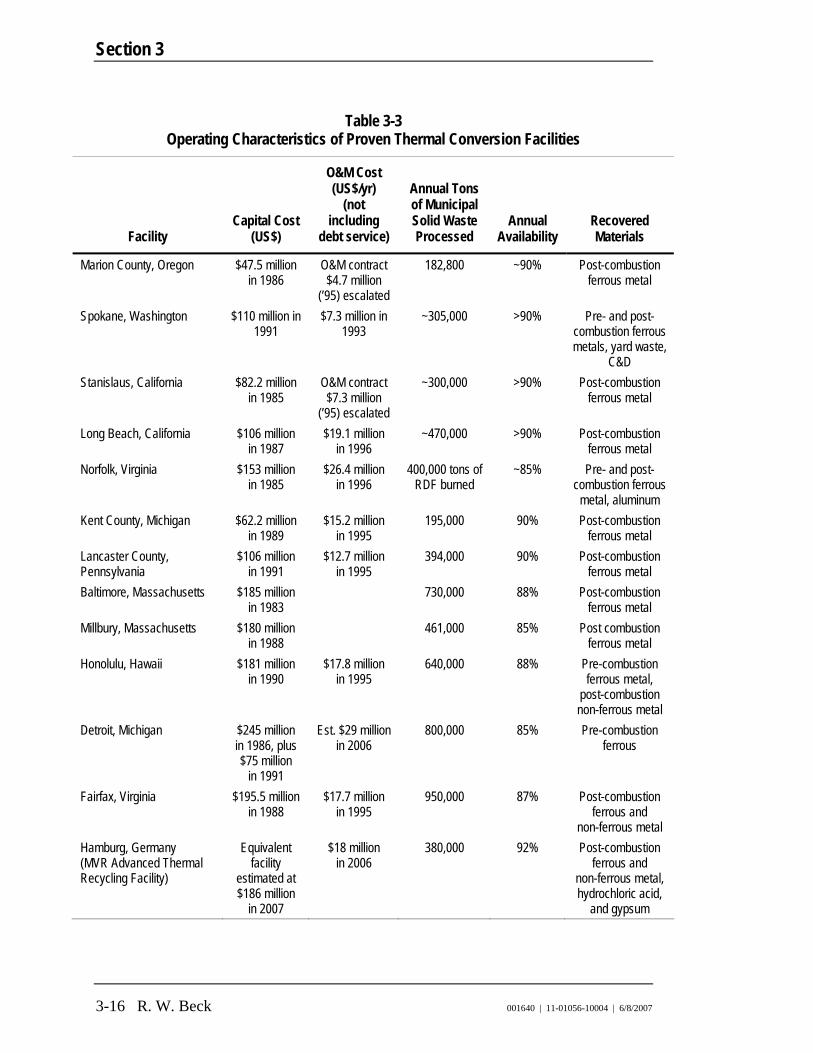
Section 3
3-16 R. W. Beck 001640 | 11-01056-10004 | 6/8/2007
Table 3-3 Operating Characteristics of Proven Thermal Conversion Facilities
Facility Capital Cost
(US$)
O&M Cost (US$/yr)
(not including
debt service)
Annual Tons of Municipal Solid Waste Processed
Annual Availability
Recovered Materials
Marion County, Oregon $47.5 million in 1986
O&M contract $4.7 million
(’95) escalated
182,800 ~90% Post-combustion ferrous metal
Spokane, Washington $110 million in 1991
$7.3 million in 1993
~305,000 >90% Pre- and post-combustion ferrous metals, yard waste,
C&D Stanislaus, California $82.2 million
in 1985 O&M contract $7.3 million
(’95) escalated
~300,000 >90% Post-combustion ferrous metal
Long Beach, California $106 million in 1987
$19.1 million in 1996
~470,000 >90% Post-combustion ferrous metal
Norfolk, Virginia $153 million in 1985
$26.4 million in 1996
400,000 tons of RDF burned
~85% Pre- and post- combustion ferrous
metal, aluminum Kent County, Michigan $62.2 million
in 1989 $15.2 million
in 1995 195,000 90% Post-combustion
ferrous metal Lancaster County, Pennsylvania
$106 million in 1991
$12.7 million in 1995
394,000 90% Post-combustion ferrous metal
Baltimore, Massachusetts $185 million in 1983
730,000 88% Post-combustion ferrous metal
Millbury, Massachusetts $180 million in 1988
461,000 85% Post combustion ferrous metal
Honolulu, Hawaii $181 million in 1990
$17.8 million in 1995
640,000 88% Pre-combustion ferrous metal,
post-combustion non-ferrous metal
Detroit, Michigan $245 million in 1986, plus $75 million
in 1991
Est. $29 million in 2006
800,000 85% Pre-combustion ferrous
Fairfax, Virginia $195.5 million in 1988
$17.7 million in 1995
950,000 87% Post-combustion ferrous and
non-ferrous metal Hamburg, Germany (MVR Advanced Thermal Recycling Facility)
Equivalent facility
estimated at $186 million
in 2007
$18 million in 2006
380,000 92% Post-combustion ferrous and
non-ferrous metal, hydrochloric acid,
and gypsum

REVIEW OF CONVERSION TECHNOLOGIES
001640 | 11-01056-10004 | 6/8/2007 R. W. Beck 3-17
The proven Conversion Technologies described in this section have demonstrated that they are capable of processing the residential municipal solid waste and light industrial/commercial combustible waste being generated in the County. All three use very similar methods for combustion of the waste. In general, the mass burn and advanced thermal recycling Conversion Technologies have the capability to handle certain components of the waste stream that the RDF systems try not to process, such as carpet, mattresses, and other bulky residential materials. None of these Conversion Technologies generally accept any medical or hazardous wastes, or construction and demolition waste, although targeted loads of combustible fractions of demolition waste could be accepted at most well designed mass burn or advanced thermal recycling facilities. Waste-to-energy facilities do not process contaminated soil, bulk tires, white goods or other materials deemed detrimental to the process. Mass burn and advanced thermal recycling systems generally have approximately 3 percent non-processible waste from the acceptable waste stream, while RDF facilities have 5 to 7 percent non-processible material from the acceptable waste stream.
The Conversion Technologies described in this section generally create electricity by use of a steam turbine-generator. A well designed facility can generate approximately 500 to 550 net kWh per ton of fuel (municipal solid waste or RDF) burned. Facilities can be designed to generate steam for sale along with the electric power if there is an adjacent industry that can use the process steam. The most common recovered material from waste-to-energy facilities other than electricity or steam is the ferrous metals remaining after combustion. There is a trend to recover non-ferrous metals from the post-combustion ash stream as well. Where permitted by regulation, some facilities have processes to recover aggregate material from the ash that in some cases can be used as road sub-base material or as an aggregate substitute in concrete blocks.
There are a number of capable waste-to-energy vendors in the United States that can design, procure, construct, operate and maintain the facility(ies). The systems and components used in the waste-to-energy facilities can be procured domestically and are readily available. The County could expect to retain a contractor capable of providing performance and other project bonds, and able to guarantee performance of the system, construction schedule, project cost, and operating expenses.

Section 3
3-18 R. W. Beck 001640 | 11-01056-10004 | 6/8/2007
Summary of Thermal Technologies Table 3-4 presents a summary of the emerging and proven thermal Conversion Technologies.
Table 3-4 Comparison of Emerging and Proven Thermal Technologies
Emerging Thermal Technologies Proven Thermal Technologies
Technology Characteristic Pyrolysis Gasification Plasma Arc Mass Burn RDF
Advanced Thermal
Recycling
Preprocessing requires size reduction (maximum size)
Yes (12 in.)
Yes (2–12 in. or compaction)
Yes (6 in.) No Yes No
Volumetric Reduction of Feedstock 80%–95% 80%–95% 95+% 90% 90% 80%–95%
Net Energy Generated (kWh per ton of waste processed) <700 kWh <400–>900 kWh <400–600 kWh 525–550 kWh 525–550 kWh 550 kWh
Largest daily processing capacity of a unit/line at a facility with more than three years of commercial operation that processes MSW or similar feedstock (tons/day)
175 TPD 180 TPD 83 TPD 3,000 TPD 3,000 TPD 580 TPD
Number of operating facilities with MSW worldwide 2 90–100 2 100+ ~15 2
Typical unit capital cost of new facility in the US (US$ Thousand/ton of daily waste processing capacity)
NA $146–$81 NA $180–$200 $180–$200 ~$180
Typical operating and maintenance (O&M) unit expenses in the US, not including process residue disposal (US$/ton of waste processed)
NA $57–$65/ton NA $35–$50/ton $40–$55/ton $47/ton
NA – information not available

REVIEW OF CONVERSION TECHNOLOGIES
001640 | 11-01056-10004 | 6/8/2007 R. W. Beck 3-19
Biological and Chemical Conversion Technologies Biological and Chemical Conversion Technologies utilize biological and/or chemical processes to reduce waste volumes, encourage breakdown of molecules, and create byproducts that can be reused beneficially. These technologies may use heat, agitation and many other forms of waste manipulation to control the reduction environment and stimulate the desired reactions. The biological technologies we reviewed were anaerobic digestion, aerobic digestion/composting, thermal depolymerization and steam classification. The chemical technologies we reviewed were waste-to-ethanol and catalytic cracking.
Anaerobic Digestion Anaerobic digestion is a biological process that entails microbial breakdown of large organic molecules into methane and carbon dioxide in the absence of oxygen. A useful product of anaerobic digestion is biogas (methane and carbon dioxide), which can be burned to generate steam and electricity. In addition to generating gas, anaerobic digestion produces a residue that contains inorganics, non-degradable organics, and other materials. Following the digestion process, these solids may be cured in standard composting type processes to produce a usable compost product.
For the processing of mixed municipal solid waste streams similar to that of the County, an anaerobic digestion facility has significant drawbacks. While anaerobic digestion has been used for decades to process solids removed at wastewater treatment plants, it has been used more recently, mostly in Europe, to process source-separated organics from municipal solid waste. However, the non-degradable materials that exist in municipal solid waste which has not been source-separated are very problematic for this technology, and this shortcoming is a major obstacle for the use of this technology in the County’s general waste stream. These contaminants, if not removed from the feedstock, will remain in the solid byproduct and significantly reduce the value and usability of the resulting compost. Furthermore, some of these materials pose an operational problem as they can damage the equipment in the digester. For the County’s mixed municipal solid waste, an anaerobic digestion facility would require significant preprocessing of the waste prior to digestion and a significant portion of the waste stream would require landfilling or recovery (roughly 32 percent of the County’s waste stream). If this preprocessing step is not successful at removing contaminants, it is likely that the compost material would not be usable and would also have to be landfilled, resulting in significant decreases in waste reduction and significant increases in the County’s cost of waste disposal. Finally, R. W. Beck was not able to find any operating data that shows that anaerobic digestion facilities can preprocess and digest a waste stream with characteristics or tonnages equivalent to those of the County. Based on these limitations we did not attempt to estimate possible operating parameters, capital costs, and operation and maintenance expenses for an anaerobic digestion facility in the County. Anaerobic digestion was not reviewed further for this report.
In our opinion, however, the County should monitor this technology for future developments and breakthroughs because certain methods of preprocessing employed at anaerobic digestion facilities have shown promise in the management of mixed
Section 3
3-20 R. W. Beck 001640 | 11-01056-10004 | 6/8/2007
municipal solid waste. Furthermore, if the County decides in the future to implement source-separation of its organics, the County should look at anaerobic digestion as a potentially viable waste conversion alternative. Its ultimate viability will depend on the expected quality of the organic feedstock and the ability of the local compost market to handle the byproducts.
Waste-to-Ethanol Waste-to-ethanol is a new technology that uses hydrolysis and other processes to break down the organic fraction of the waste (paper, food waste, yard waste, etc.) into sugars which are then distilled into ethanol. For implementation in the County, a waste-to-ethanol facility would have to include a preprocessing step, likely a materials recovery facility, to remove contaminants from the organic portion of the waste stream.
There are no waste processing facilities in operation that convert municipal solid waste into ethanol, and therefore no available operating or cost data; however, one such facility is currently being planned in Middletown, New York by Masada Oxynol LLC. Masada employs a process that uses strong acid hydrolysis to convert the cellulosic fraction of waste to sugars. The sugars are then fermented to ethanol using conventional yeasts. The non-cellulosic fraction of the waste (plastics, metals, glass, etc.) is either recycled from a front-end materials recovery plant or is converted to energy to provide energy to the process. R. W. Beck previously reviewed the proposed technology at the Masada facility. The developer proposed to co-dispose of municipal solid waste and sewage sludge. The Masada project has been in development stage for over six years. The potential for the technology holds some promise for the future because of the projected size of the Middleton facility (753 TPD), the modular nature of the technology, the small amount of residuals requiring landfilling (theoretically less than 10 percent), and the expected market for ethanol. We recommend that the County monitor the progress of this technology, and specifically the Masada facility, if and when that facility is further developed.
Aerobic Digestion/Municipal Solid Waste Composting Aerobic digestion, when employed for the management of municipal solid waste, is also called aerobic municipal solid waste composting. It involves the decomposition of large organic molecules in the presence of oxygen. Aerobic digestion uses biological processes to break down the organic portion of the municipal solid waste stream to reduce the volume of waste and to produce compost for soil amendment or fertilizer. The quality of the compost is sensitive to both the process and the degree to which undesirable material has been excluded from the waste.
To process a municipal solid waste stream similar to the County’s, an aerobic digestion facility would require a preprocessing step to remove non-compostable materials and to prepare the remaining materials for composting. Aerobic composting includes a variety of technologies, both enclosed (in-vessel) and open systems. Open systems commonly use windrows that can either be static piles with forced aeration or piles that are turned with specialized equipment to expose the material to air. In-

REVIEW OF CONVERSION TECHNOLOGIES
001640 | 11-01056-10004 | 6/8/2007 R. W. Beck 3-21
vessel systems, though higher in capital cost, provide the best control of the composting process and limit the odor issues that may arise.
While aerobic digestion has been widely implemented, especially in Europe, about a quarter of the aerobic facilities located in the United States were shut down between 1992 and 1995 due to public opposition and technical problems, especially with odor control. No additional aerobic digestion facilities for municipal solid waste have been developed in the United States in the last six years and the commercial viability of the technology is currently in question because most vendors are unwilling to provide performance guarantees, especially for odor control, when using municipal solid waste as the primary feedstock. Most of the new composting facilities are using source-separated organics from the residential and/or commercial solid waste streams for feedstock. They do not process mixed municipal solid waste as would be the case in King County. Due to the technical limitations, we did not attempt to compile operating and cost data for aerobic digestion facilities. We do not think the aerobic digestion technology qualifies for further review at this time.
Thermal Depolymerization/Plastics-to-Oil Thermal depolymerization is a process to reduce complex organic materials into crude oil. It is similar to the processes that occur in nature to create fossil fuels, but this process requires only hours to be completed. In thermal depolymerization, feedstock materials, currently agricultural and animal waste, are ground into chunks and mixed with water. They are then subjected to heat and pressure for about 15 minutes. The pressure is then released rapidly and the water is boiled off. The remaining materials are separated into hydrocarbons and other materials. The hydrocarbons are then broken down and distilled to produce crude oil. Also produced in the process are fatty acid oils used in various cleaners and pharmaceuticals, and minerals used in fertilizer products.
Since 2005, a 200-TPD facility has been operating in Carthage, Missouri that processes the feathers, heads, legs, and other unsaleable parts of turkeys from a nearby ConAgra turkey processing plant. The facility reports it is capable of producing 500 barrels of oil a day. Because that facility using agricultural and food processing waste as the feedstock, there are no residuals which must be landfilled. The vendor plans to develop a plant that uses municipal solid waste as a feedstock for this technology, but no such plants are currently in existence. That vendor deems most other details of the process and its operation (specifically, efficiency and economics) to be confidential information and was unwilling to provide any information to R. W. Beck.
Because the current focus of the technology is on agricultural waste and there are only a few plants that are operating or in the planning stages, we did not attempt to compile or estimate operating or cost data for a thermal depolymerization facility in the County. In our opinion, this technology is many years away from being feasible for processing a waste stream of the size and composition of the County’s. For these reasons, we did not conduct any further review of thermal depolymerization for this report.

Section 3
3-22 R. W. Beck 001640 | 11-01056-10004 | 6/8/2007
Steam Classification/Autoclave Technology Autoclave technology is currently used for the management of medical waste and has seen some limited use in the disposal of mixed municipal solid waste. With this technology, waste is placed into large sealed containers called autoclaves. Through exposure to a specific combination of temperature, moisture, pressure and agitation, the waste is sterilized and its volume reduced. Once processed, some of the remaining waste can be separated and recovered. Specifically, pulp from paper and other fiber-based waste can potentially be reused by box-makers or combusted as refuse-derived fuel. Most non-recoverable waste is reduced in volume by 50 to 60 percent and is intended to be safe for landfilling.
Since the technology has shown volume reduction and resource recovery benefits, it is being employed experimentally with mixed municipal solid waste as a feedstock. The County’s most important considerations for the application of this technology include the strength of markets for the cellulose pulp (either box-makers or an RDF facility) and the fact that the process consumes energy. Several companies are involved in developing the technology and others have expressed interest. World Waste Technologies, Inc. recently constructed a facility in Anaheim, California which, once fully operational, is planned to be able to process 500 tons of residue from a materials recovery facility each day. World Waste Technologies reports than it is also planning to build another facility in Anaheim that will process 2,000 TPD. Currently, the first Anaheim facility is reported to be operating, but not at its full capacity, as World Waste Technologies continues to look for ways to increase efficiency and improve the process.
While other public entities, specifically Salinas Valley, California, have reportedly expressed an interest in steam classification, the lack of operating record with municipal solid waste as a feedstock at the size necessary for King County makes it an untested process for the County at this time. The first Anaheim facility has not operated for sufficient duration or at the scale required for the County. In addition, the energy required to operate the facility at the temperatures and pressures required to autoclave the waste results in lower net energy production than other technologies. For these reasons, we did not conduct any further review of steam classification/autoclave technology for this report.
In our opinion, the County should monitor this technology because it does show some promise for the management of municipal solid waste, but it is currently unproven in the processing of waste in the quantities required by the County. The development of the Anaheim facilities by World Waste Technologies and the progress of Salinas Valley are specific projects that the County should watch closely.
Catalytic Cracking Catalytic cracking is a thermochemical conversion process that uses catalysts to accelerate the breakdown of polymers such as plastics into their basic unit, called a monomer. The monomers can then be processed using typical cracking methods, often used in oil refinery operations, to produce fuels such as low-sulfur diesel and gasoline.

REVIEW OF CONVERSION TECHNOLOGIES
001640 | 11-01056-10004 | 6/8/2007 R. W. Beck 3-23
A facility using this process has reportedly been operating in Poland at commercial scale, reportedly at 260 TPD, for a number of years. This process can complement conventional plastic recycling, especially for low-quality co-mingled plastic streams that often end up in the landfill.
Based on the results of the County’s Waste Characterization Study as discussed in Section 2, plastics would represent only about 11 percent by weight of the County’s solid waste feedstock for a Conversion Facility(ies). This technology may be suitable for only a limited fraction of the County’s solid waste. Since catalytic cracking processes only a small portion of the County’s waste stream, we did not conduct any further review of this technology for this report.
Additional Criteria for the County’s Consideration As discussed previously, the County selected a set of criteria to be applied for the initial screening of different Conversion Technologies. In the event the County eventually determines to proceed with the procurement of a vendor of one of the Conversion Technologies, we recommend that the County consider using some additional criteria as part of its procurement process. These recommendations are based on our previous experience in assisting public entities in the procurement of private vendors of solid waste management facilities. The additional criteria for consideration by the County are as follows:
1. Demonstrated capability of the vendor to operate a facility of the size required to meet the County’s needs. There have been examples where Conversion Technologies that were successfully applied in one situation, failed to operate as expected because of the failure of the operator.
2. Presence in the United States of the personnel who will design, operate, and maintain a facility of the size proposed. In our experience, it is important to have the required personnel immediately accessible to the project.
3. Presence in the United States of the ability to manufacture or supply all required replacement parts that are unique to the proposed technology. Delays in international shipments of necessary parts can have a serious impact on the annual availability of any Conversion Technology.
4. Demonstrated ability of the vendor to obtain and maintain the required performance bonds and any credit enhancement facilities, such as a letter of credit or a line of credit. A vendor’s inability to obtain such bonds is indicative that some other party is reluctant to step into the place of the vendor.
5. Demonstrated creditworthiness of the vendor. The County could be looking at a facility or facilities that cost between $500 million and $1 billion. The County will be looking to the vendor to provide meaningful performance guarantees, including:
Annual plant availability Maximum capacity rating Tons processed
Section 3
3-24 R. W. Beck 001640 | 11-01056-10004 | 6/8/2007
Energy generation Waste reduction Residue generation Ability to meet permit requirements Fixed construction price Fixed operating and maintenance expenses.
Such operating guarantees will be backstopped by financial guarantees in the form of liquidated damage payments or penalties. It will be critical for the County to have a vendor who has the financial capability to stand behind such financial guarantees.
Recommendation of Technologies for Further Review Table 3-5 presents the results of R. W. Beck’s review using the four basic evaluation criteria selected by the County.
It is important to note that all but four of the Conversion Technologies identified in Table 3-5 have not been commercially demonstrated in sizes anywhere close to what the County will require during the 20-year planning period. We estimate that by 2016, the County will need approximately 3,000 TPD of disposal capacity. All of the emerging Conversion Technologies are currently operating at sizes of approximately 170 TPD or less. In our opinion, significant scale-up challenges will have to be addressed if any of these technologies were to be pursued, and we are concerned that such issues could not be properly addressed by 2010, which is the latest date that permitting and construction of a Conversion Facility would have to commence to meet a 2016 on-line date.
With respect to Criterion 3, which is related to the Conversion Facility’s ability to meet state permit requirements, we have identified a potential concern regarding the ability of the rotary combustor technology and the RDF technology to meet the air permit requirements in Washington State. The ability of these two technologies to meet such requirements will depend on the permit requirements that would be imposed on the Conversion Facility. For example, the rotary combustor technology has historically had a problem with meeting a combustion temperature of 1,800°F for 1 second residence time; if this requirement was part of the air permit, then that technology may not be a suitable choice. In the case of the RDF system, a 50 parts per million carbon monoxide limit, if required as part of the air permit obtained by the County, would be very difficult for an RDF system to comply with. For these reasons, we have noted that Criterion 3 presents a possible problem for these two technologies. The feasibility of the rotary combustor technology (Mass Burn – modular with excess air) is also in question because, while there is one facility in existence utilizing the technology, the County would have difficulty finding a vendor offering it. For this reason Mass Burn modular excess air was not reviewed further.
Based on our review and the County’s criteria, we selected the following Conversion Technologies for further review and to serve as the basis of the remaining sections of this report to be compared to the Waste Export Disposal Option:

REVIEW OF CONVERSION TECHNOLOGIES
001640 | 11-01056-10004 | 6/8/2007 R. W. Beck 3-25
1. Mass burn waste-to-energy waterwall. This technology has been commercially demonstrated in the United States for 30 years. Individual facilities have been constructed and operated to receive and process 3,000 TPD. These facilities are able to accept approximately 90 to 97 percent of the municipal solid waste generated. They generate net electricity at a rate of approximately 500 to 550 kWh per ton of waste processed. The facility in Spokane has met its air permit requirements of the state of Washington since going on-line in 1991. These facilities generate a residue product which can be disposed of or resized in accordance with the current solid waste handling requirements of the state. These facilities have demonstrated the ability to reduce the volume of solid waste by 90 percent and the weight of solid waste by 70 percent.
2. RDF waste-to-energy. This technology has been commercially demonstrated in the United States for 20 years. Individual facilities have been sized to accept and process more than 2,500 TPD. These facilities are able to accept approximately 90 to 93 percent of municipal solid waste. They generate electricity for sale. A careful review will have to be undertaken of the ability of the RDF technology to meet the air permit requirements of the state of Washington.
3. Advanced thermal recycling. Although this technology has not yet been constructed in the United States, it has been in successful commercial operation in Germany for more than three years and has operating units which could be sized to meet the County’s waste disposal requirements. The technology is capable of generating power for sale and the vendor makes claims for improved emissions control. If the claims prove to be correct, this technology should represent limited technical risk to the County.

REVIEW OF CONVERSION TECHNOLOGIES
001640 | 11-01056-10004 | 6/8/2007 R. W. Beck 3-26
Table 3-5 Evaluation of Criteria for Conversion Technologies
Criterion 1 (1) Criterion 2 (2) Criterion 3 (3) Criterion 4 (4)
Conversion Technology At Least Three Years of Operation
Commercially Demonstrated Size to Process King County
Waste
Demonstrated Capability to
Produce a Useful Byproduct
Demonstrated Capability to Meet Permit
Requirements
Demonstrated Capability to
Produce Acceptable Ash or
Residue Recommendation
Emerging Thermal Pyrolysis Yes No Yes (electricity) Yes Yes Do not pursue Gasification Yes No Yes (electricity) Yes Yes Monitor Plasma Arc Yes No Yes (electricity) Yes Yes Monitor
Proven Thermal Mass burn WTE – modular with starved air No No Not applicable Not likely Yes Do not pursue
Mass burn WTE – modular with excess air Yes Yes Yes (electricity/steam)
Perhaps/ Yes Yes Do not pursue
Mass burn WTE – waterwall Yes Yes Yes (electricity/steam) Yes Yes Pursue further
RDF WTE Yes Yes Yes (electricity/steam)
Perhaps/ Yes Yes Pursue further
Advanced Thermal Recycling Yes Yes Yes (electricity/steam) Yes Yes Pursue further
Biological and Chemical Catalytic Cracking No No Yes (fuel oil) No No Do not pursue
Anaerobic Digestion Yes No Yes (electricity, compost) No No Monitor
Waste-to-Ethanol No No Yes (ethanol) No No Monitor Steam Classification/Autoclave No No Yes (cellulose fiber) No No Monitor Aerobic Composting Yes No Yes (compost) No No Do not pursue Thermal Depolymerization Yes No Yes (oil) No No Do not pursue
(1) Criterion 1: Previously demonstrated capability of the technology, over a minimum three-year period, to process the approximate quantities and composition of waste being managed by the County at the Cedar Hills Regional Landfill
(2) Criterion 2: Demonstrated capability to produce energy or another byproduct for which there is a proven market and which can be sold in the quantities that the facility will produce (3) Criterion 3: Demonstrated capability of the technology, over a minimum three-year period, to operate within the permit requirements that will be imposed by the state (4) Criterion 4: Demonstrated capability, over a minimum three-year period, to produce a residue product that can be disposed of or reused in accordance with state solid waste handling permit requirement
Section 4 ANNUAL FACILITY AVAILABILITY
OF CONVERSION TECHNOLOGIES
001640 | 11-01056-10004 | 6/8/2007
Section 4 ANNUAL FACILITY AVAILABILITY OF
CONVERSION TECHNOLOGIES
The Conversion Technologies under evaluation must provide reliable processing of King County’s solid waste stream by 2016. Annual availability for a Conversion Facility represents the percentage of time the Conversion Facility is able to perform during the year. Processing unit availability has a direct effect on the amount of MSW that a Conversion Facility can process and the amount of energy it can generate. Downtime due to lack of MSW deliveries is not counted against annual availability, but instead is taken into account when calculating the annual plant capacity factor, which takes into account both the amount of time the facility is available and how much of the available capacity is consistently utilized for processing waste.
This section focuses on the key aspects of the annual availabilities of Conversion Facilities including:
General concepts;
Scheduled and unscheduled outages;
Important applications; and
Reported historical availabilities of currently operating Conversion Facilities.
This section also discusses, based on these concepts, the assumed annual availabilities we have used in subsequent sections for evaluating the three selected Conversion Technologies.
General Concepts Conversion Facilities are intended to maintain very high overall availabilities due to the constant need for both disposal capacity and electricity generation. They are capital-intensive units designed to operate every hour of every day except when they require maintenance or repair. The two critical components of Conversion Facilities are the Conversion Technology processing units and the energy generation units. In general, existing Conversion Facilities each have at least two processing units or lines, so that the facility can continue to accept and process waste even when one of the processing units is down. Since the energy generation component, the steam turbine-generator, is able to realize very high annual availabilities and requires relatively little maintenance, only one energy generation unit is typically included in a Conversion Facility.
The annual plant capacity factor for a Conversion Facility is calculated by dividing the actual processing capacity experienced by that facility during the year by the
Section 4
4-2 R. W. Beck 001640 | 11-01056-10004 | 6/8/2007
maximum processing capacity of the facility. The annual availability, on the other hand, is determined by first dividing the number of hours each processing line was available to operate by the number of hours in a year. The annual availability factors for the processing lines are combined to produce the annual availability factor for the Conversion Facility.
Processing unit and energy generation unit availability have a direct effect on the amount of waste that a Conversion Technology facility can process and the amount of energy it can generate, so facilities are intended to be operated at as high an annual availability as practical.
Scheduled and Unscheduled Outages Scheduled outages at Conversion Facilities occur when facility operators deem it necessary to take either the processing units or turbine-generators off-line to perform preventative maintenance. For example, with the mass burn waste-to-energy waterwall Conversion Technology, major scheduled outages for each processing unit typically require 18 to 20 days of downtime per year. This is equivalent to approximately 5 percent of the available time in any year. To minimize the need to bypass processible waste to backup disposal facilities, operators review monthly MSW generation and deliveries and, based on such review, schedule major outages to occur during minimum waste delivery periods of the year.
Unscheduled outages at Conversion Facilities occur when operators shut down a processing unit or turbine-generator due to an unscheduled equipment or system failure. For properly operated and maintained facilities, the percentage of scheduled outages should be greater than the unscheduled downtime. While it is nearly impossible to avoid unscheduled downtime, it is important to minimize the number and duration of unscheduled outages because they not only result in lost production but also result in increased repair costs, often due to the overtime labor charges incurred.
For existing mass burn waste-to-energy waterwall and advanced thermal recycling facilities, the most common reasons for scheduled and unscheduled outages include boiler tube leaks and cleaning, grate bar replacements, and combustion residue extractor plugs. While grate bar replacements and residue extractor failures result in relatively short outages compared to boiler tube leaks, they adversely affect performance nonetheless and result in the need to consume auxiliary fossil fuel.
For existing RDF waste-to-energy facilities, the front-end waste processing of MSW (prior to introduction as fuel to the boilers) causes the most scheduled and unscheduled downtime. Failure and blockage of the shredders and the trommel screens are common reasons for unscheduled downtime of RDF facilities. Since the processed RDF is generally a more homogeneous fuel than unprocessed MSW, the boiler and combustion residue conveying systems of RDF facilities can potentially operate more reliably than mass burn waste-to-energy waterwall systems and advanced thermal recycling facilities.
ANNUAL FACILITY AVAILABILITY OF CONVERSION TECHNOLOGIES
001640 | 11-01056-10004 | 6/8/2007 R. W. Beck 4-3
Unscheduled outages will vary from year to year due to the age of equipment and the preventative maintenance program, but for the purposes of this report, we have assumed unscheduled outages will be equal 16 to 18 days per year, which is supported by industry experience. A single unscheduled outage can range from as little as one or two days to as much as a week or more, depending on the nature of the problem. Combustion units have to be allowed to cool down sufficiently so that, if necessary, workers can enter the unit to undertake repairs. Following the repair, the unit must be brought back on-line. The amount of downtime can be impacted by the availability of spare parts, the availability of skilled labor, and the extent of the repair.
Steam turbine-generator units are extremely reliable and generally have a very high annual availability of 98 to 99 percent. The turbine-generators are taken off-line once per year generally for a short scheduled adjustment and fine-tuning. Also, turbine generators are taken off-line approximately once every five years for major inspection and preventative maintenance services. During that year, the annual availabilities of the turbine-generators are slightly lower.
The total amount of scheduled and unscheduled outages can reasonably be expected to be equal to approximately 10 to 15 percent of the total year, resulting in an annual availability of approximately 85 to 90 percent. Some facilities have reported annual availabilities of up to 92 to 93 percent, but we believe that is a very optimistic assumption for the 20-year planning period used in this report.
Applications of Availability The effects of high or low availabilities at Conversion Facilities are the increased or decreased opportunities, respectively, to process waste and create energy. The ability to operate reliably is important for recovering the cost of constructing and operating the Conversion Facility and handling the constant stream of waste. Also, since availability assumptions are used extensively in planning and contracting, maintaining a high availability is important for the overall economies of the Conversion Facility.
For example, in order to obtain revenue bond financing for a Conversion Technology project, the owner/operator of the facility will need to demonstrate: 1) an adequate waste supply to support the project, 2) the ability to process waste, 3) the ability to collect tipping fees, and 4) the ability to execute energy sales agreements as one source of revenues to pay the bonds. These agreements will be based to a significant degree on the expected operation of the facility and will include consideration of the anticipated annual plant availability.
In addition, the County must make arrangements for backup disposal capacity based on an assumed annual plant availability. If a Conversion Facility fails to process the guaranteed waste tonnage, the County will have to ensure an environmentally sound and proper disposal of the bypassed waste.
Finally, in energy sales agreements, the owner of the Conversion Facility may be required to guarantee to deliver to the energy purchaser a certain quantity of electric power or thermal energy either annually, hourly, or daily. Such level of guarantees will depend upon the Conversion Facility’s expected annual plant availability. In
Section 4
4-4 R. W. Beck 001640 | 11-01056-10004 | 6/8/2007
electricity sales agreements, an electric utility may provide a Conversion Technology facility with two types of payments—an energy charge and a capacity charge. The electric utility will provide energy payments for the electricity actually delivered to the grid over the year. Capacity charges are provided to facilities that can deliver and guarantee a base load of electricity to the grid. If the annual availability of the facility is too low, the facility may not meet the contractual obligations for the energy capacity payments. Also, if the annual availability of a facility decreases to the point where the minimum energy delivery rates are not satisfied, this could also adversely affect the payment provisions.
Ultimately, most of the contractual obligations related to the operation of a Conversion Facility are tied to an expected level of availability to process MSW and generate electricity. For this reason, it is crucial for the Conversion Facility to be operated to maintain the highest level of availability possible.
Reported Plant Availability at Reference Facilities As part of our review regarding annual availability for Conversion Technologies, R. W. Beck contacted the owners and/or operators of currently operating Conversion Facilities and obtained data on the recent annual availabilities for the three selected Conversion Technologies. We also reviewed historical data regarding annual availability. Table 4-1 lists the annual availability data for the reference facilities utilizing the three selected Conversion Technologies.
The information in Table 4-1 indicates that the annual availabilities for the reference facilities of the mass burn waste-to-energy waterwall and advanced thermal recycling technologies averaged in the low 90 percent range. The annual facility availabilities for reference RDF waste-to-energy facilities were slightly lower, averaging around 86 percent.

ANNUAL FACILITY AVAILABILITY OF CONVERSION TECHNOLOGIES
001640 | 11-01056-10004 | 6/8/2007 R. W. Beck 4-5
Table 4-1 Annual Facility Availability for Three Selected Conversion Technologies
Range (%)
Location
No. of Processing
Units (1)
Rated Facility
Processing Capacity (1)
(TPD) Minimum Maximum Average
(%)
No. of Years
Reviewed
Mass Burn Waste-To-Energy Waterwall Spokane, WA 2 835 92 94 93 3 Marion Co., OR (2) 2 550 92 95 93 6 Stanislaus, CA 2 840 84 89 87 3 Kent Co., MI 2 625 91 93 92 16 Lancaster Co., PA 3 1,200 91 94 92 8 RDF Waste-To-Energy Norfolk, VA 4 2,000 79 87 83 2 Detroit, MI (3) 3 3,300 88 89 89 3 Honolulu, HI 2 1,708 78 90 85 3 Advanced Thermal Recycling MVR Hamburg, Germany 2 1,100 92 93 92 4 MVB Hamburg, Germany 2 1,100 92 94 93 4 (1) The number of units and rated processing capacities for U.S. plants were obtained from The 2004 IWSA Directory of Waste-to-Energy Plants
(Washington, D.C.: Integrated Waste Services Association, 2004). (2) Marion County determines the annual availability data on a fiscal year beginning July 1. Data for 2005 was not included due to an anomaly
occurring in operations. (3) The third unit is a standby and the environmental permit allows only two units to operate simultaneously.
Summary For the purpose of this report and based on our review of the data presented in Table 4-1, we have developed planning estimates of the annual availabilities for the three Conversion Technologies, as listed in Table 4-2.
Table 4-2 Annual Facility Availability for Three Selected Conversion Technologies
Conversion Technology Annual Facility Availability
(%)
Mass Burn Waste-To-Energy Waterwall 90 RDF Waste-To-Energy 87 Advanced Thermal Recycling 90

Section 4
4-6 R. W. Beck 001640 | 11-01056-10004 | 6/8/2007
Based both on the data we have reviewed and our previous experience, we believe that these assumed annual plant availability rates are reasonable for the planning purposes of this report. As discussed previously, we believe availability estimates above 90 percent for the entire 20-year planning period would be overly optimistic.
We have used these assumed annual availability factors in Section 6, “Conversion Technology and Waste Export Facility Considerations,” Section 8, “Backup Disposal Capacity for Conversion Facilities,” and Section 12, “Projected Energy Revenues.”

Section 5 NON-PROCESSIBLE WASTE
AT CONVERSION FACILITIES
001640 | 11-01056-10004 | 6/8/2007
Section 5 NON-PROCESSIBLE WASTE
AT CONVERSION FACILITIES
It is important to note that none of the Conversion Technologies will be able to process 100 percent of the municipal solid waste currently delivered to the Cedar Hills Regional Landfill. Because of solid waste size or composition constraints, some portion of that municipal solid waste will require disposal by some other means, most likely landfilling. In such an event, the County must arrange for disposal of such material. This section of the report presents a discussion of the estimated type and amount of non-processible waste, for each Conversion Technology, that would require alternate disposal.
What Constitutes Non-Processible Waste Many of the currently operating waste-to-energy facilities have operating agreements that categorize waste as either “acceptable” or “unacceptable” depending on whether or not such types of waste can even be delivered to the facility. Examples of unacceptable waste could include contaminated soils, sludges, ashes, large dead animals, construction and demolition material, and large quantities of yard waste. What constitutes unacceptable waste is impacted by, among other things, the type of Conversion Technology used. Also included as “unacceptable” is the category currently deemed “Special Waste” by the County. This category makes up less than 1 percent of the waste currently delivered to the Cedar Hills landfill and includes waste such as asbestos, large amounts of spoiled food, dead animals, and oversized items like boats and trailers. We have assumed that all items currently identified by the County as unacceptable waste would not be delivered to the Conversion Facility and would require alternate disposal.
The operators of Conversion Facilities may further categorize the “acceptable” waste, which is delivered to the Conversion Facility, as either “processible” or “non-processible.” For example, the operator of a Conversion Facility may accept such items as rolled carpet, white goods (refrigerators, stoves, etc.), or engine blocks, but the operator may segregate such items after they have been delivered and classify them as “non-processible.” While such non-processible items are delivered and accepted at the Conversion Facility, they are not introduced into the conversion process and are instead sent to alternate disposal, such as landfilling or recycling.
For the purpose of this report, because “unacceptable” waste generated in the County is assumed to be diverted prior to delivery to the Conversion Facility (or Cedar Hills landfill), all waste delivered to the Conversion Facility is assumed to be “acceptable” and any waste diverted from the Conversion Facility to alternate disposal prior to

Section 5
5-2 R. W. Beck 001640 | 11-01056-10004 | 6/8/2007
processing is considered “non-processible.” Furthermore, it is assumed that any “unacceptable” waste was either recycled, recovered or disposed of using alternate, in-county methods, and that only “non-processible” waste accepted by the Conversion Facility will require disposal by the County at a landfill. Our primary focus in this section of the report is to develop an estimate of the amount of non-processible waste that must be disposed of at a landfill or by some other means.
Generally speaking, non-processible waste is municipal solid waste that, if received and processed by the specific Conversion Technology, could potentially adversely affect the operation of the facility, be a threat to health or safety, and/or violate permits or other regulations.
Municipal solid waste can be deemed non-processible due to its size, chemical composition, moisture content, or thermal properties, or because of regulatory constraints. Examples of typical non-processible materials for the three Conversion Technologies under consideration are listed in Table 5-1.
Table 5-1 Typical Non-Processible Materials
Material Categories7
Hazardous material Asbestos Rocks, dirt, concrete Large dead animals Construction and demolition debris Batteries (vehicle, household, alkaline/button cell batteries) Paint (latex and oil based) Computer monitors, televisions, cell phones White goods Large machinery and equipment Motor vehicles and parts Sludge, sewage, wastewater and other liquid wastes Thermometers, fluorescent lights, oil, acids, caustics, poisons and other household hazardous waste
In addition, there are some differences between the different Conversion Technologies in the materials that are considered non-processible. Most of these differences are due to the capabilities of the front-end processing equipment required at RDF facilities. RDF technology employs separation and shredding equipment that is not capable of processing large items such as oversized bulky items and larger metal items. Conversely, large items may be considered processible at mass burn or advanced thermal recycling facilities as long as the items will fit into the boiler and have heating value.
NON-PROCESSIBLE WASTE AT CONVERSION FACILITIES
001640 | 11-01056-10004 | 6/8/2007 R. W. Beck 5-3
An important consideration in determining what waste is processible is the list of materials that are prohibited from combustion by the regulatory agencies. Typically, it is desirable that household hazardous waste, such as paints, batteries, used oils, thermometers, and electronic equipment, is not disposed of at Conversion Facilities either because these items may be a hazard to the Conversion Facility and its operators, or because their combustion will result in air emissions or residue ash that may affect human health and safety. Also, operators may deem some materials such as gypsum scrap (drywall) to be non-processible because, when combusted, it results in significant increases in specific types of air emissions or residue contamination. While the operators are still required to accept such material and should be prepared to process it, they can deem it non-processible and divert it.
Materials that have little or no heating value are also often considered non-processible and may be diverted prior to processing. Examples of these materials are dirt, rocks, concrete, and other inerts. The introduction of these materials to a thermal process results in little if any energy generation and will just take up space in a boiler and cause erosion of the equipment. Also, once these materials are put through the process they become residue of the facility and must be handled as such. By diverting such materials prior to their being processed, the operator can often dispose of them more easily, decreasing the amount of ash residue which may have to be disposed of differently, and potentially more expensively, than dirt and inerts. In general, these materials are diverted based on the ease with which they can be removed prior to processing. It is common for materials such as ferrous metals and large pieces of concrete to be removed because the level of effort is reasonable. Alternatively, objects such as broken glass and non-ferrous metals are usually sent through the process because, while they add little or no heating benefits, their presence does not result in significant inefficiencies and their removal would be very difficult. Operators have found that in the case of both ferrous and non-ferrous metals, these can often be removed more easily from the residue once the solid waste has been processed.
Estimated Quantity of Non-Processible Waste In order to develop an estimate of the amount of non-processible waste to be disposed of by the County, we considered:
1. The reported percentages of non-processible waste at existing waste-to-energy facilities;
2. The differences in types of waste that can be processed between the three Conversion Technologies being considered in this report; and
3. The composition of the County’s municipal solid waste as quantified in the County’s Waste Characterization Study (discussed in Section 3) and the County’s estimate of projected future recycling rates (discussed in Section 7).

Section 5
5-4 R. W. Beck 001640 | 11-01056-10004 | 6/8/2007
Amount of Non-Processible Waste at Existing Facilities As part of this report, we contacted the operators of several Conversion Facilities to obtain data on the amount of non-processible waste they currently receive at their facilities. Based on these conversations, the amount of non-processible waste reported by mass burn operators ranged from 1 to 11 percent. We expect that the average range for an RDF facility will be slightly higher because of the more complicated front-end processing.
Non-Processible Waste in King County We reviewed the results of the County’s Waste Characterization Study to identify what components in the waste stream we would expect to be non-processible at the Conversion Facilities. It should be noted that the Waste Characterization Study was based on waste delivered to the Cedar Hills landfill, which by rule is not supposed to receive construction and demolition material, biosolids, sludges, and yard waste. As discussed above, since these components of the waste stream represent a significant portion of the material that would be considered unacceptable waste at a Conversion Facility, we have assumed that all of the waste currently being received at the Cedar Hills landfill would be accepted at a Conversion Facility, but that not all of it would be classified as processible.
Presented in Table 5-2 is a summary of our estimate of the processible and non-processible portions of the King County waste stream for 2016, based on the County’s assumed recycling program and waste generation projections. This information is generally comparable to the reported results of the existing waste-to-energy facilities with which we are familiar. Therefore, for the purposes of this report, we have assumed that 5 to 9 percent of the County’s waste stream will be deemed non-processible by the Conversion Facilities and will require disposal at an alternate disposal facility.

NON-PROCESSIBLE WASTE AT CONVERSION FACILITIES
001640 | 11-01056-10004 | 6/8/2007 R. W. Beck 5-5
Table 5-2 Assumed King County Processible Percentages and Tonnages by Conversion Technology
(2016 Tons)
Mass Burn RDF Advanced Thermal Recycling
Category Percentage Tons Percentage Tons Percentage Tons
Paper 100% 270,571 100% 270,571 100% 270,571 Plastic 100% 125,673 100% 125,673 100% 125,673 Wood/Yard/Food Organics 100% 396,631 100% 396,631 100% 396,631
Other Organics 100% 124,279 100% 124,279 100% 124,279 Glass 100% 35,057 100% 35,057 100% 35,057 Metal 100% 80,844 100% 80,844 100% 80,844 Other Wastes 60% 74,173 19% 24,045 60% 74,173 Household Hazardous 0% 0 0% 0 0% 0
Total Processible Percentage
95% 91% 95%
Total Processible Tons
1,107,228 1,057,099 1,107,228
Total Non-Processible Tons
57,073 107,202 57,073
Impact of Recycling on Non-Processible Waste It should be expected that the current recycling programs in King County will change over time. In undertaking this analysis, we have included consideration of the County’s proposed increase in the current level of recycling. In developing the information and discussion of a possible Conversion Facility, we assumed that the Conversion Facility would complement the County’s current recycling goals. There are certain recyclable materials that have strong and long-standing markets for sale. Portions of these types of materials continue to be disposed of at the Cedar Hills landfill and they are categories of waste that are considered processible in the three Conversion Technologies we are considering. King County has highlighted organics as a particular category of the waste stream that will likely see an increase in recycling attention by the County. In addition, the County has advised that it plans to take steps to maximize existing efforts to recycle glass and plastic. For these reasons, we expect that any changes in the County’s recycling rate will affect only the Total Processible Tons shown in Table 5-2. Therefore, we anticipate that changes in recycling will have very little, if any, effect on the Total Non-Processible Tons shown in Table 5-2.
Section 6 CONVERSION TECHNOLOGY AND
WASTE EXPORT FACILITY CONSIDERATIONS

001640 | 11-01056-10004 | 6/8/2007
Section 6 CONVERSION TECHNOLOGY AND WASTE
EXPORT FACILITY CONSIDERATIONS
In this section of the report, we discuss the specific facility considerations for the implementation both the Conversion Technology Disposal Option and the Waste Export Disposal Option. For the Conversion Technology Disposal Option, this entails making specific assumptions about the operational aspects of each of the commercially proven Conversion Technologies and creating a theoretical facility that will be used in analyses in later sections of this report. For the Waste Export Disposal Option, this involves discussion of contracting with disposal companies and specific considerations related to intermodal capacity and operation.
Conversion Technology Considerations For the purposes of organization and simplification of the information, we separately discuss the “capacity” and the “number” of Conversion Facilities. By “capacity” we mean the total amount of disposal or processing capacity the County needs in any year to accommodate the amount of waste that requires disposal in that year. The “number” of facilities refers to the number of different sites that will be required or recommended in order to meet the determined capacity. These two issues are discussed separately because their key issues and considerations are fairly distinct.
The capacity of the Conversion Facilities is mainly a function of waste stream characteristics and specific operating aspects of the Conversion Technologies themselves. Specifically, to determine the capacity, the County must evaluate: 1) projected quantity of waste generated; 2) projected quantity of waste to be recycled, with the remainder to be disposed of; 3) projected quantity of non-processible waste for each type of Conversion Technology; 4) expected annual availability of each Conversion Technology; 5) the heating value of the waste; 6) monthly and seasonal fluctuations in the generation of waste; 7) the timing of additional disposal capacity; and 8) the number and size of processing lines to be used.
Alternatively, the determination of the number of Conversion Facilities is more a function of siting and permitting considerations. Included in these considerations are: 1) the cost and ease of siting and permitting; 2) varying development, construction, and operations costs; 3) maximizing economies of scale; 4) the flexibility and robustness of the system; 5) the maximization/utilization of existing and planned solid waste system infrastructure (transfer stations, collection equipment); and 6) impacts on the immediate geographic area of the site(s) of the facility(ies).
Section 6
6-2 R. W. Beck 001640 | 11-01056-10004 | 6/8/2007
Below, we discuss all of these considerations and, based on the County’s priorities established in discussion with County staff, identify various issues for the County to consider.
The information in this section relies upon and builds upon information developed in the following other sections of this report:
Section 2 – Solid Waste Quantity and Composition
Section 4 – Annual Facility Availability of Conversion Technologies
Section 5 – Non-Processible Waste at Conversion Facilities
Identification of County Priorities Decisions related to the capacity and number of Conversion Facilities are complicated by the fact that so many of the parameters are interrelated. Different parameters may have positive and negative ramifications for costs, level of effort, and risks to the County. For this reason it is important to establish and understand the County’s priorities related to these parameters. The following decision-making criteria are based on directions provided by the County. Recognizing that the criteria are interrelated, they are listed in two groups, high priority and lower priority:
High Priority Minimize capital and operating costs.
Maximize the ability to recover energy and other beneficial products.
Minimize the number of sites that will have to be obtained and permitted.
Lower Priority
Minimize the amount of bypass waste.
Minimize the expense of local solid waste transport.
We have applied these five criteria in developing our analysis of the assumed capacity and number of facilities.
Factors Impacting the Capacity of a Conversion Facility Projected Base Case Quantities of Waste Requiring Disposal For the purpose of this analysis, and based on data provided by the County, we developed projections for waste generation, recycling, and disposal. These projections are based on the County’s assumption of a consistent increase in the recycling rate of 0.3 percent per year from a benchmark of 43.7 percent in 2004. These projections are presented in Table 6-1 for the planning period of 2016 to 2036.
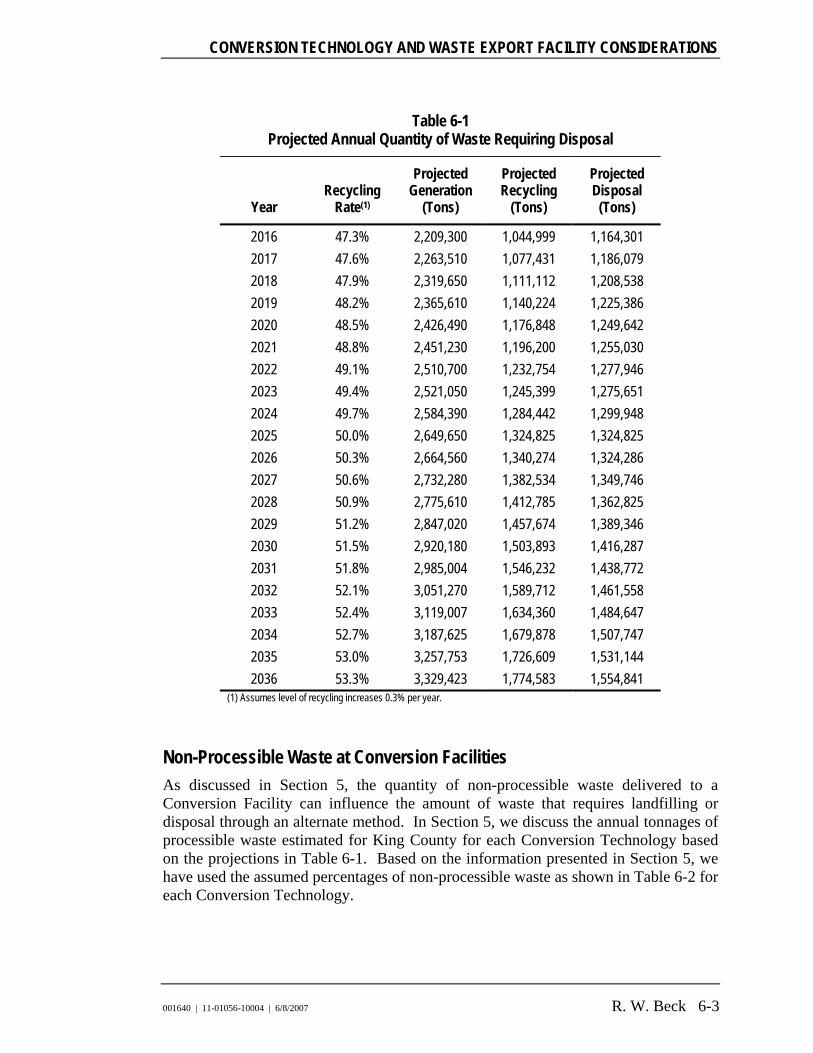
CONVERSION TECHNOLOGY AND WASTE EXPORT FACILITY CONSIDERATIONS
001640 | 11-01056-10004 | 6/8/2007 R. W. Beck 6-3
Table 6-1 Projected Annual Quantity of Waste Requiring Disposal
Year Recycling
Rate(1)
Projected Generation
(Tons)
Projected Recycling
(Tons)
Projected Disposal
(Tons)
2016 47.3% 2,209,300 1,044,999 1,164,301 2017 47.6% 2,263,510 1,077,431 1,186,079 2018 47.9% 2,319,650 1,111,112 1,208,538 2019 48.2% 2,365,610 1,140,224 1,225,386 2020 48.5% 2,426,490 1,176,848 1,249,642 2021 48.8% 2,451,230 1,196,200 1,255,030 2022 49.1% 2,510,700 1,232,754 1,277,946 2023 49.4% 2,521,050 1,245,399 1,275,651 2024 49.7% 2,584,390 1,284,442 1,299,948 2025 50.0% 2,649,650 1,324,825 1,324,825 2026 50.3% 2,664,560 1,340,274 1,324,286 2027 50.6% 2,732,280 1,382,534 1,349,746 2028 50.9% 2,775,610 1,412,785 1,362,825 2029 51.2% 2,847,020 1,457,674 1,389,346 2030 51.5% 2,920,180 1,503,893 1,416,287 2031 51.8% 2,985,004 1,546,232 1,438,772 2032 52.1% 3,051,270 1,589,712 1,461,558 2033 52.4% 3,119,007 1,634,360 1,484,647 2034 52.7% 3,187,625 1,679,878 1,507,747 2035 53.0% 3,257,753 1,726,609 1,531,144 2036 53.3% 3,329,423 1,774,583 1,554,841
(1) Assumes level of recycling increases 0.3% per year.
Non-Processible Waste at Conversion Facilities As discussed in Section 5, the quantity of non-processible waste delivered to a Conversion Facility can influence the amount of waste that requires landfilling or disposal through an alternate method. In Section 5, we discuss the annual tonnages of processible waste estimated for King County for each Conversion Technology based on the projections in Table 6-1. Based on the information presented in Section 5, we have used the assumed percentages of non-processible waste as shown in Table 6-2 for each Conversion Technology.

Section 6
6-4 R. W. Beck 001640 | 11-01056-10004 | 6/8/2007
Table 6-2 Assumed Non-Processible Percentage by Conversion
Technology
Technology Non-Processible Waste
(%)
Mass Burn Waste-to-Energy Waterwall 5 RDF Waste-to-Energy 9 Advanced Thermal Recycling 5
Annual Availability of the Conversion Facilities As outlined in Section 4, the expected annual availability of a Conversion Facility is anticipated to vary slightly depending on the Conversion Technology employed. Table 6-3 summarizes the reported range of annual facility availabilities for each of the technologies considered in this report.
Table 6-3 Reported Annual Facility Availability for each Conversion
Technology
Conversion Technology
Facility Availability (%)
Mass Burn Waste-to-Energy Waterwall 87–93 RDF Waste-to-Energy 83–89 Advanced Thermal Recycling 92–93
As discussed in Section 4, we believe it would be overly aggressive to assume for this report that any of the Conversion Technologies will be able to realize a 92 to 93 percent average annual availability over the 20-year planning period. While we recognize that in some years facilities may be able to reach these reported levels, in our experience average availabilities over multi-year operating periods are generally lower than the reported numbers shown in Table 6-3. The assumptions we have used in the report are summarized in Table 6-4.
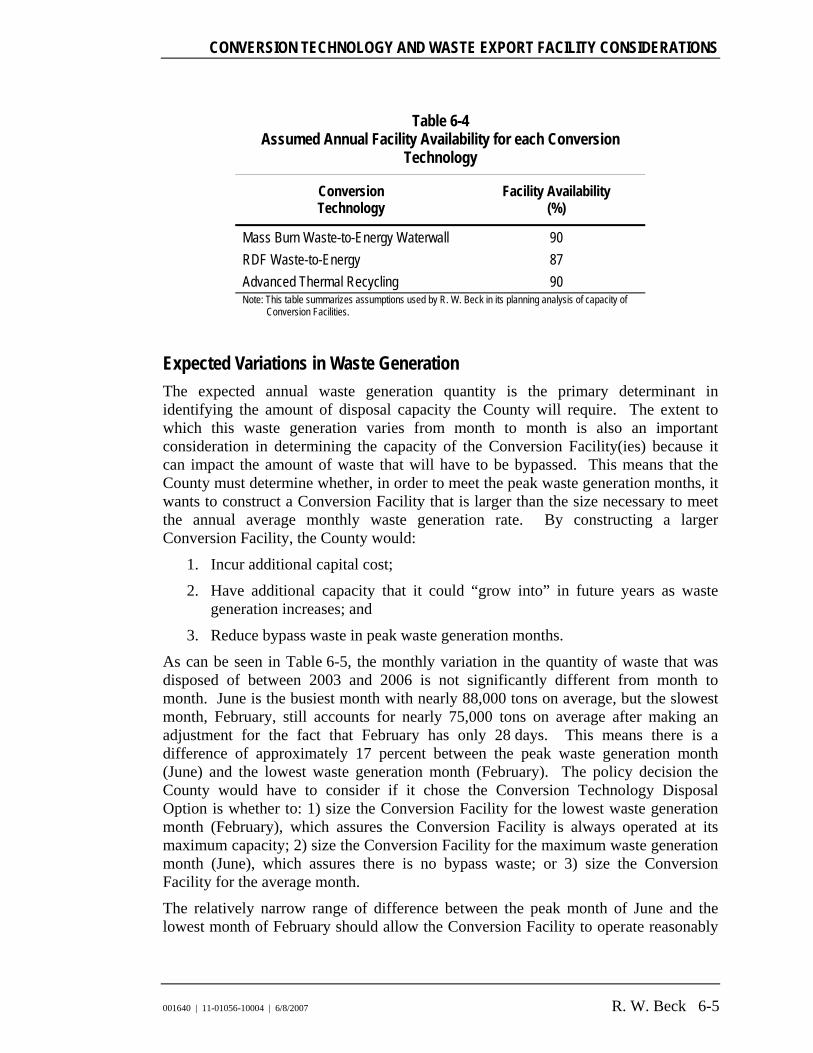
CONVERSION TECHNOLOGY AND WASTE EXPORT FACILITY CONSIDERATIONS
001640 | 11-01056-10004 | 6/8/2007 R. W. Beck 6-5
Table 6-4 Assumed Annual Facility Availability for each Conversion
Technology
Conversion Technology
Facility Availability (%)
Mass Burn Waste-to-Energy Waterwall 90 RDF Waste-to-Energy 87 Advanced Thermal Recycling 90 Note: This table summarizes assumptions used by R. W. Beck in its planning analysis of capacity of
Conversion Facilities.
Expected Variations in Waste Generation The expected annual waste generation quantity is the primary determinant in identifying the amount of disposal capacity the County will require. The extent to which this waste generation varies from month to month is also an important consideration in determining the capacity of the Conversion Facility(ies) because it can impact the amount of waste that will have to be bypassed. This means that the County must determine whether, in order to meet the peak waste generation months, it wants to construct a Conversion Facility that is larger than the size necessary to meet the annual average monthly waste generation rate. By constructing a larger Conversion Facility, the County would:
1. Incur additional capital cost;
2. Have additional capacity that it could “grow into” in future years as waste generation increases; and
3. Reduce bypass waste in peak waste generation months.
As can be seen in Table 6-5, the monthly variation in the quantity of waste that was disposed of between 2003 and 2006 is not significantly different from month to month. June is the busiest month with nearly 88,000 tons on average, but the slowest month, February, still accounts for nearly 75,000 tons on average after making an adjustment for the fact that February has only 28 days. This means there is a difference of approximately 17 percent between the peak waste generation month (June) and the lowest waste generation month (February). The policy decision the County would have to consider if it chose the Conversion Technology Disposal Option is whether to: 1) size the Conversion Facility for the lowest waste generation month (February), which assures the Conversion Facility is always operated at its maximum capacity; 2) size the Conversion Facility for the maximum waste generation month (June), which assures there is no bypass waste; or 3) size the Conversion Facility for the average month.
The relatively narrow range of difference between the peak month of June and the lowest month of February should allow the Conversion Facility to operate reasonably
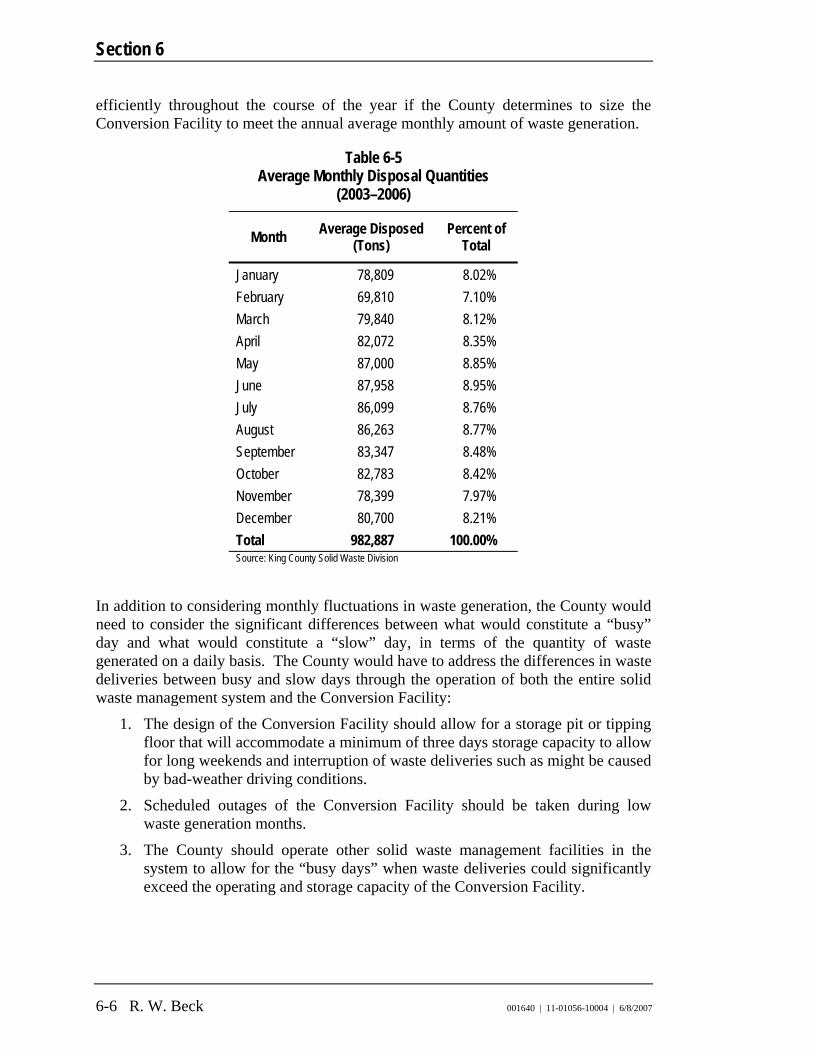
Section 6
6-6 R. W. Beck 001640 | 11-01056-10004 | 6/8/2007
efficiently throughout the course of the year if the County determines to size the Conversion Facility to meet the annual average monthly amount of waste generation.
Table 6-5 Average Monthly Disposal Quantities
(2003–2006)
Month Average Disposed (Tons)
Percent of Total
January 78,809 8.02% February 69,810 7.10% March 79,840 8.12% April 82,072 8.35% May 87,000 8.85% June 87,958 8.95% July 86,099 8.76% August 86,263 8.77% September 83,347 8.48% October 82,783 8.42% November 78,399 7.97% December 80,700 8.21% Total 982,887 100.00% Source: King County Solid Waste Division
In addition to considering monthly fluctuations in waste generation, the County would need to consider the significant differences between what would constitute a “busy” day and what would constitute a “slow” day, in terms of the quantity of waste generated on a daily basis. The County would have to address the differences in waste deliveries between busy and slow days through the operation of both the entire solid waste management system and the Conversion Facility:
1. The design of the Conversion Facility should allow for a storage pit or tipping floor that will accommodate a minimum of three days storage capacity to allow for long weekends and interruption of waste deliveries such as might be caused by bad-weather driving conditions.
2. Scheduled outages of the Conversion Facility should be taken during low waste generation months.
3. The County should operate other solid waste management facilities in the system to allow for the “busy days” when waste deliveries could significantly exceed the operating and storage capacity of the Conversion Facility.

CONVERSION TECHNOLOGY AND WASTE EXPORT FACILITY CONSIDERATIONS
001640 | 11-01056-10004 | 6/8/2007 R. W. Beck 6-7
Timing of Additional Disposal Capacity A key consideration in determining the best approach to sizing the Conversion Facility(ies) is the County’s preferred timing for constructing additional disposal capacity after 2016. These policy decisions would have a significant impact on the amount of bypassed waste which must be landfilled each year as a result of peak waste periods and the growth of the waste stream. There are several different approaches the County could consider related to the timing of increasing the capacity of the Conversion Facility(ies) after 2016. These different approaches and the resulting impact are summarized in Table 6-6.
Table 6-6 Approaches to Timing Disposal Capacity Additions
Approach Impact
1. Add disposal capacity as early as is required to avoid the need to bypass any waste.
This is the most expensive approach in terms of capital cost and having waste disposal and energy generation capacity that may not be fully utilized throughout the year. It would minimize the amount of backup disposal capacity required.
2. Add disposal capacity when such capacity would meet the annual average disposal requirements during the year.
This would result in better utilization of the disposal capacity/energy capability of the Conversion Facility and would be more cost effective than Approach 1. It would result in the need to bypass waste during certain months in the early years until the additional capacity came on line.
3. Add disposal capacity only when the disposal capacity would be fully utilized throughout the year.
This is the most cost efficient approach in terms of fully utilizing the disposal capacity/energy generation capability of the Conversion Facility. It would result in the need to bypass waste during busier months from the outset of operation, with increasing quantities of bypassed waste until the additional capacity came on line.
Number of Processing Lines The number of processing lines can influence the flexibility of operation and therefore impact the amount of bypassed waste and overall efficiency of the Conversion Facility. In general, the more processing lines there are in the Conversion Facility, the easier it is to phase the scheduled downtimes and maintain a high level of efficiency during unscheduled downtimes. For example, if a 3,000 TPD Conversion Facility has four processing trains (750 TPD each), the outage of one processing train represents 25 percent of the processing capacity of the Conversion Facility and leaves a running capacity of 2,250 TPD. If, on the other hand, the Conversion Facility has two larger processing trains (1,500 TPD each) and one of them is taken out of operation, 50
Section 6
6-8 R. W. Beck 001640 | 11-01056-10004 | 6/8/2007
percent of the processing capacity of the Conversion Facility is not available, leaving only 1,500 TPD of capacity and potentially increasing the amount of bypassed waste.
When considering the number of processing lines, it is important to consider the expected economies of scale and the expected variation of the waste stream. As is typical with many aspects of Conversion Facilities, the larger the processing line that can be constructed, the greater the economies of scale. Based on demonstrated performance at existing Conversion Facilities, our opinion is that the County should consider individual processing lines sized at no more than 1,000 TPD. As this size is decreased, the unit costs for construction, operation, and maintenance of the line can be expected to increase. However, as discussed above, with larger processing lines comes reduced scheduling flexibility and less capability to handle variations in the amount of waste generated. The County would need to consider the trade-off of lower costs against increased bypass waste.
Waste Simulation Model To help evaluate all of the above factors, we prepared a model of the operation of a Conversion Facility (the “Waste Simulation Model”) that uses historic daily tonnages from the County waste stream, projects them for future years, and produces estimated tonnages of the amount of waste requiring landfilling (bypassed, non-processible, and residue) and processing.
The Waste Simulation Model was developed to allow the County to evaluate the effect of making changes to certain of the assumed operational metrics of a Conversion Facility. The Waste Simulation Model allows the user to modify the values of a variety of parameters related to the estimated quantities of solid waste and the design of the Conversion Facility. Using this information, the model calculates an estimate of the amounts of processed waste, bypassed waste, residue, and plant efficiency under different operating assumptions. Presented below is a brief discussion of the specific inputs and outputs of the Waste Simulation Model.
Tonnages In order to simulate the operation of a Conversion Facility, the Waste Simulation Model projects daily tonnages assumed to be delivered to the Conversion Facility for an entire calendar year. To do this, the Waste Simulation Model uses the actual waste delivery data for the Cedar Hills landfill for 2003 through 2006. It calculates the four-year average for each day of one year, lining up weekdays and weekends, to create an expected weighted average schedule of waste delivery for the year. The user can then enter a “Projected Total Annual Tonnage” for a future year and the Waste Simulation Model will create a waste schedule for the simulated year by increasing the average daily tonnages by a “Projection Factor.” The Projection Factor is calculated as:
Projection Factor = Future Year Tonnage ÷ Four-Year Average Tonnage

CONVERSION TECHNOLOGY AND WASTE EXPORT FACILITY CONSIDERATIONS
001640 | 11-01056-10004 | 6/8/2007 R. W. Beck 6-9
Assumed Operational Inputs For the Waste Simulation Model to develop an estimate of a Conversion Facility’s operation for a particular quantity of “Projected Waste Deliveries,” the model requires the user to make assumptions about the operation and number of processing lines of the assumed Conversion Facility. These assumptions and their use in the model are discussed in detail below.
Number and Size of Processing Lines The Waste Simulation Model requires an assumption be made regarding the number and size of the processing lines employed at the simulated Conversion Facility. This allows the user to simulate facilities with similar rated capacities (the number of processing lines multiplied by their size in tons per day) but with different processing line configurations to determine how much of a difference changes in the number and size of processing lines make in the operational efficiency of the Conversion Facility.
Facility Availability Facility availability is used by the Waste Simulation Model to create an outage schedule (scheduled and unscheduled) that is used to simulate the actual processing capacity of the Conversion Facility when a processing line is not operating due to maintenance or repair. The Waste Simulation Model allows the user to enter the number of days that each processing line is assumed to be off-line for both scheduled and unscheduled outages. The Waste Simulation Model assumes that scheduled outages take place during the months of the year when the waste deliveries are lowest, and, to be conservative, assumes that unscheduled outages occur when the waste deliveries are highest.
Percentage of Non-Processible Waste The Waste Simulation Model requires a user to make an assumption regarding the percentage of non-processible waste delivered to a Conversion Facility since this metric varies depending on the selected Conversion Technology and the quantity of waste. During the simulation, the Waste Simulation Model removes this percentage of the waste prior to processing, assuming that non-processible waste will not be introduced into the conversion process. Therefore, non-processible waste is not considered as part of the processing capacity of the Conversion Facility. The amount, expressed in tons, of non-processible waste is also one of the outputs of the Waste Simulation Model.
Residue Production Residue production is defined as the amount, expressed as a percent by weight, of material that results from the processing of the solid waste compared to the amount of processible waste that is introduced into the conversion process. This metric can vary depending on the type of Conversion Technology, the operation of the facility, and specific characteristics of the waste stream.

Section 6
6-10 R. W. Beck 001640 | 11-01056-10004 | 6/8/2007
Facility Storage Facility storage refers to the number of tons that a Conversion Facility can store in its pit, or in other parts of the County’s solid waste management system, when the processing components are either at capacity or not operating. Facility storage is a part of the design of every Conversion Facility and is used to increase its operational flexibility. Storage is used when the Conversion Facility is receiving more waste than it can currently process and allows the Conversion Facility to accommodate variations in the amount of waste that is received from day to day. In the Waste Simulation Model, if more waste is delivered than the facility has capacity to process, the excess waste is assumed to be stored. If the amount of stored waste reaches the assumed facility storage amount, then the Waste Simulation Model assumes that excess waste will start to be bypassed. However, in reality, some of this excess waste could possibly be held in the storage areas at the transfer stations for short periods of time.
Model Outputs The Waste Simulation Model uses the Assumed Operational Inputs provided by the user and runs a hypothetical year of facility operation based on the Projected Waste Delivery Schedule for that particular year. Outputs of the simulation include “Tonnage Processed,” “Tonnage Non-Processible,” “Tonnage and Percent Bypassed” (percent of “Total Tonnage Delivered”), “Residue Tonnage,” and the “Plant Capacity Factor” (“Total Utilized Capacity” ÷ “Rated Capacity”). These outputs can help the user evaluate changes in waste processing capability and quantity of bypassed waste under different assumed operational and design aspects of the Conversion Facility.
Simulation Results Tables 6-7, 6-8, and 6-9 show the results of simulations for each Conversion Technology with four processing lines, each with an assumed capacity of 800 TPD per processing line. The results of simulations for 2016, 2026, and 2036 are presented in the tables. These results demonstrate the effect of the growing waste stream and the estimated operating differences between each Conversion Technology at identical sizes.

CONVERSION TECHNOLOGY AND WASTE EXPORT FACILITY CONSIDERATIONS
001640 | 11-01056-10004 | 6/8/2007 R. W. Beck 6-11
Table 6-7 Simulation Results
2016 Projected Tonnage
Conversion Technology Mass Burn RDF
Advanced Thermal
Recycling
Inputs Processing Lines 4 4 4 Line Capacity (tpd) 800 800 800 Facility Availability 90% 87% 90% Non-Processible Percentage 5% 9% 5% Residue Production 25% 20% 22% Facility Storage (tons) 10,000 10,000 10,000 Outputs Tonnage Processed 1,042,993 999,216 1,042,993 Tonnage Non-Processible 58,215 104,787 58,215 Tonnage By-Passed 58,528 54,733 58,528 Total Waste Landfilled 116,743 159,520 116,743 Residue Tonnage 260,748 199,843 229,458 Percent Landfilled 10.07% 13.77% 10.07% Plant Capacity Factor 89% 86% 89%

Section 6
6-12 R. W. Beck 001640 | 11-01056-10004 | 6/8/2007
Table 6-8 Simulation Results
2026 Projected Tonnage
Conversion Technology Mass Burn RDF
Advanced Thermal
Recycling
Inputs Processing Lines 4 4 4 Line Capacity (tpd) 800 800 800 Facility Availability 90% 87% 90% Non-Processible Percentage 5% 9% 5% Residue Production 25% 20% 22% Facility Storage (tons) 10,000 10,000 10,000 Outputs Tonnage Processed 1,050,400 1,015,200 1,050,400 Tonnage Non-Processible 66,214 119,186 66,214 Tonnage By-Passed 199,939 182,746 199,939 Total Waste Landfilled 266,154 301,932 266,154 Residue Tonnage 262,600 203,040 231,088 Percent Landfilled 20.22% 22.92% 20.22% Plant Capacity Factor 90% 87% 90%

CONVERSION TECHNOLOGY AND WASTE EXPORT FACILITY CONSIDERATIONS
001640 | 11-01056-10004 | 6/8/2007 R. W. Beck 6-13
Table 6-9 Simulation Results
2036 Projected Tonnage
Conversion Technology Mass Burn RDF
Advanced Thermal
Recycling
Inputs Processing Lines 4 4 4 Line Capacity (tpd) 800 800 800 Facility Availability 90% 87% 90% Non-Processible Percentage 5% 9% 5% Residue Production 25% 20% 22% Facility Storage (tons) 10,000 10,000 10,000 Outputs Tonnage Processed 1,050,400 1,015,200 1,050,400 Tonnage Non-Processible 77,742 139,936 77,742 Tonnage By-Passed 416,699 390,261 416,699 Total Waste Landfilled 494,441 530,197 494,441 Residue Tonnage 262,600 203,040 231,088 Percent By-Passed 32.01% 34.31% 32.01% Plant Capacity Factor 90% 87% 90%
The results of this analysis demonstrate that a Conversion Facility originally sized at 3,200 TPD is projected to have a minimal amount of bypass waste in 2016, estimated to be between 1 and 5 percent. However, the model calculates that by 2026, the County will have between 150,000 TPY and 200,000 TPY of bypassed waste depending on the technology employed. This would require approximately 400 TPD to 600 TPD of additional disposal capacity in 2026.
By running a simulation for the entire 20-year operating period the Waste Simulation Model can also estimate the timeline for adding additional disposal capacity to the County’s system. For a Conversion Facility with four processing lines with capacities of 800 TPD, we estimate that a fifth processing line of 800 TPD would be fully utilized by between about 2026 and 2030, depending on the technology employed.
Factors Impacting the Number of Conversion Facilities While the siting of multiple Conversion Facilities can result in some efficiencies in the hauling of waste and some sharing of waste management impacts, the County must carefully consider several issues in evaluating this decision.

Section 6
6-14 R. W. Beck 001640 | 11-01056-10004 | 6/8/2007
Economies of Scale One advantage of fewer Conversion Facilities with larger individual capacities is the utilization of economies of scale. This refers to the fact that the capital and operating costs associated with processing waste are not linear. As the amount of waste processed by a single Conversion Facility increases, the unit cost and effort to process each additional ton decreases. This is because some activities require the same level of expenditure and complexity regardless of the amount of waste processed, making it more cost effective to maximize the amount of waste related to that activity. When considering multiple Conversion Facilities, the County must consider the financial benefits of these economies of scale to ensure that each Conversion Facility is sufficiently sized to reduce its overall cost.
Siting Considerations The County must evaluate the difficulty in siting and permitting multiple Conversion Facilities. Historically, Conversion Facilities have not been a welcomed neighbor by residents and stakeholders and the County can reasonably expect to experience similar objections. As discussed in Section 14, it is likely that proceeding through the siting and permitting of a Conversion Facility will be a long, difficult, and expensive process.
The County is likely to find it a challenge to identify sites of the size and with the infrastructure and land use requirements that will allow Conversion Facilities to be constructed and operated efficiently. Considerations such as access to major roadways, power lines, other utilities, and rail lines will dictate whether the Conversion Facility can be sited and meet the required functions. A specific example would be if the site does not have access to rail lines, requiring all transport of waste and residual to occur by use of trucks.
Transportation Costs Another aspect for the County to consider when siting a Conversion Facility is the cost of transportation incurred by solid waste collection vehicles and long-haul vehicles. In the system’s current configuration, collection vehicles generally bring collected waste to transfer stations where it is loaded and compacted into trailers that haul the waste to the Cedar Hills landfill. Proper siting of a Conversion Facility should attempt to minimize the distances that collection vehicles and haul vehicles have to travel in order to reduce the total cost of the County’s solid waste management system. It is also possible that one or more Conversion Facilities could replace one or more existing or planned transfer stations as the destination for collection trucks. Decisions by the County to replace a transfer station must be made carefully to ensure system efficiencies are maintained and the County’s investment in transfer station development is considered.
Advantages and Disadvantages of each Scenario The advantages and disadvantages for both a single facility, and two facilities or more, are shown in Tables 6-10 and 6-11, respectively.

CONVERSION TECHNOLOGY AND WASTE EXPORT FACILITY CONSIDERATIONS
001640 | 11-01056-10004 | 6/8/2007 R. W. Beck 6-15
Table 6-10 Advantages and Disadvantages of a Single Facility
Advantages Disadvantages
Siting and permitting costs would be less than for multiple-facility options and potentially easier due to the likely public resistance, location of interconnection and other utilities, etc.
Residue transfer to disposal site is more consolidated than for the multiple-facility options and therefore is likely less expensive
Takes greater advantage of economies of scale in larger facility in terms of development and operating and maintenance costs
Depending on location, could displace one or more existing or planned transfer stations and the required investment in these facilities
Demands on internal County resources during development and operation likely to be less than for multiple-facility options
If County chooses to contract with a private operator, the single-facility option would result in fewer operating contracts and possibly lower administrative cost than multiple-facility options where each facility would likely have its own operating contract
Siting and permitting of a single large facility may be more challenging size of plant footprint and because of issues of inequitable distribution of impacts in County
In-county backup or redundant disposal capacity centered at one location which could prove a vulnerability if facility becomes isolated in a catastrophe or if facility goes off-line because of some local plant event
Longer collection haul routes to facility from some areas of the County than in multiple-facility options and therefore higher hauling costs from transfer stations
Results in a potentially inequitable distribution of impacts because one geographic section of the County is the recipient of all the solid waste
Depending on location, could make redundant one or more existing transfer stations and the investment made in these facilities

Section 6
6-16 R. W. Beck 001640 | 11-01056-10004 | 6/8/2007
Table 6-11 Advantages and Disadvantages of Multiple Facilities
Advantages Disadvantages
Siting of multiple smaller facilities versus a single large facility may be less challenging because of the reduced size of plant footprints and because of issues of inequitable distribution of impacts to County
Shorter haul routes to facilities from some areas of the County compared to routes for a single facility, therefore lower hauling cost
Distributed facilities more likely to result in more equitable distribution of impacts than single facility
Multiple facilities result in more redundancy than a single facility, making the system less vulnerable to disruption
Depending on facility locations, could displace one or more planned transfer stations and the required investment in these facilities
Siting and permitting are more expensive than for a single facility
Higher development and operating and maintenance costs than single facility due to reduced economy of scale
Residue transfer to disposal site is less consolidated than for a single facility, likely to be more expensive
Depending on facility locations, could make redundant one or more existing transfer stations and the investment made in these facilities
Demands on internal County resources during development and operation likely to be more than for single facility
If County chooses to contract with a private operator(s), would likely involve separate operating contracts for each facility, resulting in a greater administrative burden on the County than for single facility
Conclusions Regarding Capacity and Number of Conversion Facilities We have identified a planning estimate of the capacity and number of Conversion Facilities based on the County’s priorities, as discussed above. Our analysis is based on the assumption that the County will generate waste and realize an escalating recycling rate as outlined in Table 6-1. Using these criteria, we estimate that the County will require approximately 3,200 TPD of disposal capacity in 2016. The County’s three higher priorities could be met by siting a single Conversion Facility consisting of four conversion processing lines each sized at approximately 800 TPD. This configuration would represent the least expensive option in terms of capital cost and operating expenses; it would be the most efficient in terms of generating power, and it would result in the smallest number of sites that would have to be permitted.
This Conversion Facility should be designed to accommodate the future addition of a fifth conversion line also sized at 800 TPD. We recommend the County consider having any additional processing lines sized the same as the first four lines. We believe that this will help in terms of scheduling downtime, ordering replacement parts and supplies, and operator familiarity with the units. It should be noted that an additional conversion line of 800 TPD is large and our analysis estimates that it would not be fully utilized until around 2030. On the other hand, if the County decides to

CONVERSION TECHNOLOGY AND WASTE EXPORT FACILITY CONSIDERATIONS
001640 | 11-01056-10004 | 6/8/2007 R. W. Beck 6-17
wait to build a fifth processing line until enough waste is generated to use the full capacity of an additional 800 TPD line, it could result in the landfilling of significant quantities of bypass waste prior to the commencement of its operation. The County could consider a scenario in which it would install the additional disposal capacity earlier than would be required for its own disposal needs and accept solid waste from outside of the County on a short-term basis until the County requires all of the capacity itself. This would provide a source of tipping fee revenues to the County while assuring that the additional capacity is operated at its most efficient energy-generation level.
The construction of a single Conversion Facility of 3,200 TPD does not address the County’s two lower priorities—to minimize bypass waste and to minimize system hauling costs—as well as a scenario with more processing lines and multiple facilities would. In addition, the construction of a single Conversion Facility means that one geographic area of the County would assume the full impact of the County’s waste disposal solution.
It is important to recognize that the purpose of this analysis is not to arrive at one optimal solution but rather to indicate the many different parameters that the County will have to consider if it selects the Conversion Technology Disposal Option. There are a large number of possible combinations of processing line configurations and sizes. The discussion of a single Conversion Facility initially sized at 3,200 TPD with four processing lines is based on reasonable planning assumptions regarding the County’s waste and the state of the technologies. Our intent is for the County to use this discussion to further consider the benefits and drawbacks of different sized Conversion Technologies so that the County can gain an understanding of its options. Our intent is not to suggest that the Conversion Facility discussed here is the only, or most preferable, method for implementation of a Conversion Facility.
Size of Facility Sites The size of the required site for a Conversion Facility will be dependent upon its processing capacity and plans for future expansion. Private waste haulers are particularly concerned about unloading their collection vehicles as quickly as possible in order to return to the collection route. Therefore, it will be important for the Conversion Facility to have a sufficient number of tipping bays allowing vehicles to unload efficiently. In addition, the Conversion Facility should have a storage pit or tipping floor that is sized to store a minimum of three days of waste supply. Further, the County will want a facility site large enough to allow collection and transfer vehicles to queue up on-site rather than back up onto public roads.
The required size of the site will be different for construction-related activities as compared to the actual operation of the Conversion Facility. The County may need to consider using adjacent parcels of land for laydown area during the construction phase.
Based on these requirements, our opinion is that the County should consider facility sites of at least approximately 15 to 20 usable acres for the operation of a single Conversion Facility sized at 3,200 TPD. A larger site results in greater flexibility in

Section 6
6-18 R. W. Beck 001640 | 11-01056-10004 | 6/8/2007
accepting solid waste deliveries and general operation of the Conversion Facility. The size of the site would also be impacted by decisions the County makes regarding the types of vehicles that can access the site. If collection vehicles deliver directly to the Conversion Facility, more space and tipping bays will be required for the larger number of vehicles. This could be reduced if the County only allows transfer vehicles to access its site. If the County should opt for multiple facilities of smaller size, our opinion is that the County would need a facility site of approximately 10 to 12 usable acres for the operation of a Conversion Facility sized at 1,000 TPD. It should be noted that at most sites, the number of usable acres may be less than the total area of the site due to potential constraints such as wetlands, streams, slopes, and sensitive area buffers. For estimating purposes we have assumed that the actual site size for a Conversion Facility will be approximately 125% of the estimated usable size required.
Combination of Facilities Required In addition to the Conversion Facility discussed in this section, Table 6-12 lists other solid waste management facilities the County would need to ensure proper operation of a Conversion Facility. This assumes that the non-processible waste is not recycled or reused, and that no beneficial use is found for the resulting residue ash. If such uses are implemented these requirements will be significantly less than shown in Table 6-12. Also inherent in this discussion is the assumption that the Conversion Facility will operate as expected and that the composition and quantity of the waste stream will not change significantly from that discussed in this report. If the waste processing capabilities of the Conversion Facility are reduced or if waste generation is greater than expected, for example, due to natural disaster or lower-than-assumed recycling rates, the requirements may be significantly greater than the ranges shown in Table 6-12.
Table 6-12 Other Facility Requirements Required in 2016
Bypass and Non-Processible Disposal Capacity at a Landfill
115,000–160,000 TPY
Residue Ash Disposal Capacity at a Landfill or through Beneficial Reuse
200,000–260,000 TPY
Truck-to-rail intermodal capacity will be required for the disposal of these bypass and non-processible wastes as well as the residue ash. Due to the smaller tonnages requiring disposal at a landfill, the Conversion Technology Disposal Option is not as taxing on the existing truck-to-rail intermodal capacity in King County (see discussion below). For this reason, it is likely more cost effective for the County to obtain these services through a contract as opposed to building its own dedicated intermodal facility.

CONVERSION TECHNOLOGY AND WASTE EXPORT FACILITY CONSIDERATIONS
001640 | 11-01056-10004 | 6/8/2007 R. W. Beck 6-19
Waste Export Disposal Option Facility Considerations Truck-to-rail intermodal capacity will be required to a significantly greater extent for the Waste Export Disposal Option than for the Conversion Technology Disposal Option. This capacity could be provided through contract with private industry or it could be constructed by the County with the option of County operation or contracted operation. An important aspect of intermodal rail operation is that it requires very close cooperation with, and dependence on, the serving railroad company(ies) to which the waste hauling is being consigned. Long hauling of waste by truck to the regional landfills in eastern Washington and Oregon, or even farther to Idaho, is not considered practical or cost competitive with rail due to the long distances involved and the increasing cost of diesel fuel. Currently there is insufficient developed truck-to-rail intermodal capacity in King County to handle the quantity of County waste forecast in the years 2016 through 2036, and there is a growing demand for what intermodal capacity does exist. Therefore, under the Waste Export Disposal Option it will be necessary for either the County or a private entity to site and build additional intermodal capacity to satisfy the County’s needs. If the County adopts a Conversion Technology that produces residue ash, there may be sufficient intermodal capacity to handle the smaller quantities of ash that would likely need to be shipped to a remote landfill. For this latter option, we would suggest that the County consider obtaining those intermodal services through a contract. The County’s transfer station system will be an integral part of the Waste Export Disposal Option. Depending on the siting of the intermodal facility, one of these stations might be co-located at the intermodal facility if the County is the owner of the intermodal facility. Since the most likely site for a new intermodal facility would be in the South County area where some sufficiently large parcels of land still exist with potential access to the two railroad mainlines, the South County transfer station proposed in the draft Waste Export Plan would be a likely candidate facility to co-locate at an intermodal facility built by the County.
Siting of Intermodal Facilities Siting an intermodal rail facility requires a site that can accommodate a full train and that provides access, either direct or via one of the two railroad companies, Burlington Northern Santa Fe (BNSF) and Union Pacific (UP), to both of the mainlines that serve King County. Ideally, the intermodal site must allow a full train (approximately 6,500 lineal feet) to completely exit the mainline without uncoupling and conversely must allow the makeup of a full train, including brake testing, before it enters the mainline. Truck-to-rail intermodal sites must obviously be sited with access to a rail line. To provide the County with cost competitive access to all of the regional landfills in the Northwest (Washington, Oregon and Idaho), the intermodal facility will need access to both the BNSF and UP railroads. Depending on the location in the County, some
Section 6
6-20 R. W. Beck 001640 | 11-01056-10004 | 6/8/2007
intermodal sites could access both railroad companies’ mainlines even if they only have access to one of the mainlines, due to the existence of reciprocal switching agreements between the two railroad companies. At other locations where a reciprocal switching agreement does not exist, the cost to switch from one line to the other could be prohibitively high, effectively denying the County access to one or more of the regional landfills. The intermodal site will also require good access from one or more major arterial highways to facilitate rapid transfer truck access. Since the intermodal facility is likely to be operated as much as 24 hours a day, seven days per week, the site should be located where it does not have sensitive noise receptor neighboring properties such as properties zoned Rural.
Sizing of Intermodal Facilities Based on our previous experience with conceptual design and site evaluations for an intermodal facility for King County at two other sites, we estimate that at a minimum a site of 30 to 40 usable acres will be required and the site will need a 6,500-foot running track/lead and three pairs of intermodal loading tracks 14 feet on center with 70- to 80-foot aprons between the track pairs. The sizing of the intermodal facility should take into account that there will be times when there may need to be a significant number of empty and/or full export containers stored on the site due to upset conditions either along the railroad or at the landfill end of the disposal system. Laydown area for storing up to two days of full or empty containers is recommended. Approximately 140 containers will be required to store one day’s waste generation at the current recycling rate of 43 percent. It may also be advisable to consider having laydown room for waste containers from other jurisdictions as well if the County’s site is large enough to accommodate these additional containers. If the site will also host a new transfer station, the site area should be increased by at least an additional 10 usable acres.
Other Facility Requirements The transfer station requirements for the waste export system have been identified by the County in the draft Waste Export Plan. We do not foresee a need to modify the suggested station requirements set forth in the Waste Export Plan. A single truck-to-rail intermodal facility is also discussed in the Waste Export Plan with the possibility of multiple facilities under certain circumstances. Intermodal facilities are like Conversion Facilities in that there is an economy of scale both in capital cost and in operation and maintenance costs in a single large facility versus two or more smaller facilities. For the purposes of this report, we have assumed that a single truck-to-rail intermodal facility, publicly or privately owned, would be located in the South County area, where access to both railroad companies’ mainline tracks is most likely, and would operate in conjunction with the transfer/recycling stations defined in the County’s draft Waste Export Plan.
Section 7 POTENTIAL IMPACTS OF RECYCLING ON
CONVERSION TECHNOLOGIES

001640 | 11-01056-10004 | 6/8/2007
Section 7 POTENTIAL IMPACTS OF RECYCLING ON
CONVERSION TECHNOLOGIES
King County has proven to be a leader in recycling and waste diversion efforts and its programs rank among the most successful in the nation. This section of the report discusses the potential impacts of the County’s current and proposed recycling programs on the operations of the recommended Conversion Technologies. This section also discusses the potential impact on the energy generation function of the Conversion Technologies if, in the future, the County increases the quantities of recycled materials currently being removed from the waste stream.
King County Code, Chapter 10.14, states that “it is recognized that waste reduction and recycling are the highest priority of the viable solid waste management options” and that the County has adopted the goal “to achieve zero waste of resources by 2030.” This shows that the County hierarchy of solid waste options places greater emphasis on waste reduction and recycling than it places on the permitting, siting, and development of a Conversion Facility.
Current Recycling Program The County has numerous programs in place to divert and recycle specific materials from the waste stream. County programs serve the residents of the unincorporated areas of the County as well as 37 of the 39 cities, excluding Seattle and Milton. These programs include the residential curbside, multi-family, commercial, drop-box and construction recycling, as well as programs for hazardous waste management and other problem materials. A description of County programs and historical recycling rates is provided in Appendix A.
Future Recycling Program Public entities can attempt to increase the amount of material they recycle through some combination of the following: increased types of materials that are targeted for recycling, increased levels of participation and/or separation efficiency, or changes in the methods in which the material is collected. The following discussion identifies potential changes the County could consider and the potential impact that each change could have on the County’s current level of recycling.
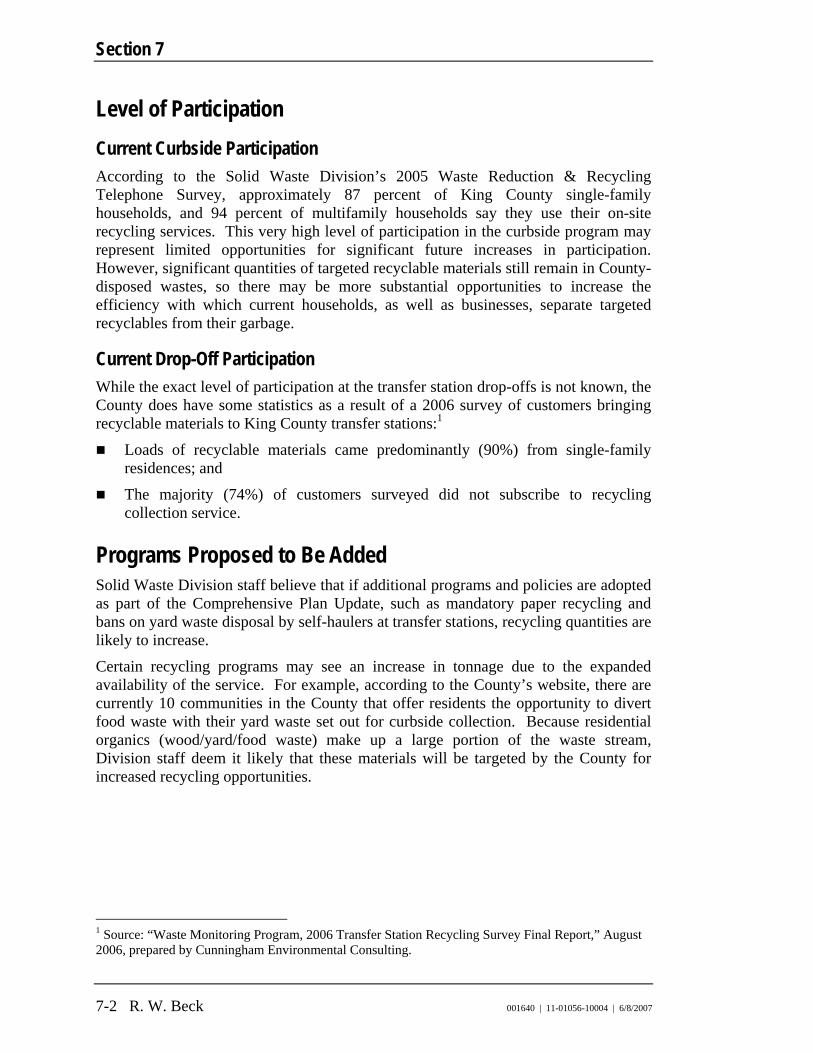
Section 7
7-2 R. W. Beck 001640 | 11-01056-10004 | 6/8/2007
Level of Participation Current Curbside Participation According to the Solid Waste Division’s 2005 Waste Reduction & Recycling Telephone Survey, approximately 87 percent of King County single-family households, and 94 percent of multifamily households say they use their on-site recycling services. This very high level of participation in the curbside program may represent limited opportunities for significant future increases in participation. However, significant quantities of targeted recyclable materials still remain in County-disposed wastes, so there may be more substantial opportunities to increase the efficiency with which current households, as well as businesses, separate targeted recyclables from their garbage.
Current Drop-Off Participation While the exact level of participation at the transfer station drop-offs is not known, the County does have some statistics as a result of a 2006 survey of customers bringing recyclable materials to King County transfer stations:1
Loads of recyclable materials came predominantly (90%) from single-family residences; and
The majority (74%) of customers surveyed did not subscribe to recycling collection service.
Programs Proposed to Be Added Solid Waste Division staff believe that if additional programs and policies are adopted as part of the Comprehensive Plan Update, such as mandatory paper recycling and bans on yard waste disposal by self-haulers at transfer stations, recycling quantities are likely to increase.
Certain recycling programs may see an increase in tonnage due to the expanded availability of the service. For example, according to the County’s website, there are currently 10 communities in the County that offer residents the opportunity to divert food waste with their yard waste set out for curbside collection. Because residential organics (wood/yard/food waste) make up a large portion of the waste stream, Division staff deem it likely that these materials will be targeted by the County for increased recycling opportunities.
1 Source: “Waste Monitoring Program, 2006 Transfer Station Recycling Survey Final Report,” August 2006, prepared by Cunningham Environmental Consulting.

POTENTIAL IMPACTS OF RECYCLING ON CONVERSION TECHNOLOGIES
001640 | 11-01056-10004 | 6/8/2007 R. W. Beck 7-3
Goals and Objectives Projected Types and Quantities of Material to Be Recycled in the Future The County developed an estimate of future recycling quantities based on estimated municipal solid waste generation and assuming a 44.6 percent recycling rate in 2007 with a 0.3 percent annual increase each year through 2036, as shown below in Table 7-1. We have identified this scenario as the “Base Case.”
Table 7-1
Projected Quantities of Materials to be Recycled and Disposed of in King County through 2036 Based on Current Recycling Rate
(Base Case)
Year
Projected MSW
Generation (Tons)
Projected Recycling
Rate(1) Projected Tons
Recycled Projected Tons
Disposed
2007 1,775,000 44.6% 769,700 1,005,000 2016 2,209,300 47.3% 1,044,999 1,164,301 2026 2,664,560 50.3% 1,340,274 1,324,286 2036 3,329,423 53.3% 1,774,583 1,554,841
Source: King County Solid Waste Division. (1) Projected annual recycling rate, provided by the County, is assumed to be 44.6% in 2007 with an increase of 0.3% per year
thereafter.
Using the projected quantities of tons recycled shown in Table 7-1 and applying the percentages of each commodity based on 2003 waste and recycling composition data, R. W. Beck developed a planning-level estimate of the quantities of each commodity which could be recycled for the period 2016 through 2036. These recycled material breakdowns for the Base Case are shown in Table 7-2. In developing the numbers shown in Table 7-2, we assumed each type of recycled material would increase at a rate of 0.3 percent per year.

Section 7
7-4 R. W. Beck 001640 | 11-01056-10004 | 6/8/2007
Table 7-2 Projected Quantities of Material Recycled by Commodity in King County
2016 through 2036 (in Tons) (Base Case)
2016 2026 2036
Aluminum Cans 8,914 10,751 13,433 Tin Cans 6,459 10,127 15,574 OCC 204,925 247,153 308,822 High Grade Paper 30,741 38,400 49,637 Mixed Paper(1) 134,280 167,735 216,815 Newspaper 130,491 157,381 196,650 HDPE 5,699 8,019 11,451 PETE 6,375 8,970 12,810 LDPE 11,341 13,678 17,091 Other Plastic(2) 3,562 5,012 7,157 Container Glass 54,061 65,202 81,471 Food Waste(3) 86,970 140,001 218,804 Yard Waste 257,051 329,117 435,101 Wood Waste 8,218 19,823 37,153 Ferrous Metals 80,375 100,169 129,201 Nonferrous Metals 15,536 18,737 23,412 Total 1,044,999 1,340,274 1,774,583 OCC = old corrugated cardboard; HDPE = high density polyethylene; PETE = polyethylene terephthalate; LDPE = low density polyethylene Note: The Base Case includes an assumed recycling rate increase of 0.3% per year for each material, with a beginning rate of 44.6% in 2007. (1) Mixed paper includes bleached polycoat paper. (2) Other plastic includes polystyrene foam (3) Food waste includes compostable paper.
For the purpose of identifying the potential impact on the heating value of the MSW being delivered to a Conversion Facility under the Base Case, we have developed planning estimates of the quantities of all material that will be delivered to a disposal facility under the Base Case recycling scenario. The results of that comparison are presented in Table 7-3.

POTENTIAL IMPACTS OF RECYCLING ON CONVERSION TECHNOLOGIES
001640 | 11-01056-10004 | 6/8/2007 R. W. Beck 7-5
Table 7-3 Comparison of Material Being Delivered to a Conversion Facility
(Base Case)
2003 2016 2036
Type of Material Quantity (Tons)
% of Total
Quantity (Tons)
% of Total
Quantity (Tons)
% of Total
Aluminum Cans 3,532 0.38% 2,228 0.19% 3,358 0.22% Tin Cans 6,973 0.74% 6,459 0.55% 3,894 0.25% Newspaper* 25,362 2.70% 32,623 2.80% 49,163 3.16% OCC* 43,338 4.61% 51,231 4.40% 77,206 4.97% Low Grade Paper* 58,606 6.23% 57,549 4.94% 72,272 4.65% High Grade Paper* 15,277 1.63% 13,175 1.13% 16,546 1.06% Compostable Paper* 52,054 5.54% 58,037 4.98% 71,063 4.57% Other Paper* 23,815 2.53% 33,191 2.85% 50,018 3.22% PETE* 5,981 0.64% 4,250 0.37% 3,203 0.21% HDPE* 4,739 0.50% 3,799 0.33% 2,863 0.18% LDPE* 47,027 5.00% 64,267 5.52% 96,851 6.23% Other Plastic* 43,718 4.65% 59,938 5.15% 88,538 5.69% Glass 28,304 3.01% 26,465 2.27% 39,884 2.57% Yard Waste 47,127 5.01% 63,748 5.48% 48,345 3.11% Food Waste 187,824 19.98% 217,381 18.67% 256,253 16.48% Other Woody Organics* 85,279 9.07% 110,634 9.50% 141,957 9.13% Textiles* 43,940 4.67% 61,238 5.26% 92,286 5.94% Disposable Diapers 25,754 2.74% 35,893 3.08% 54,091 3.48% Other Organics* 30,646 3.26% 42,711 3.67% 64,365 4.14% Ferrous Metals 22,367 2.38% 26,792 2.30% 32,300 2.08% Nonferrous Metals 690 0.07% 818 0.07% 1,232 0.08% Other Metals 31,709 3.37% 44,192 3.80% 66,598 4.28% C&D 47,309 5.03% 65,934 5.66% 99,362 6.39% Furniture and Mattresses 25,572 2.72% 35,639 3.06% 53,708 3.45% Other Waste 27,477 2.92% 38,294 3.29% 57,709 3.71% HHW 5,607 0.60% 7,814 0.67% 11,776 0.76% Total 940,027 100.00% 1,164,301 100% 1,554,840 100.00% OCC = old corrugated cardboard; HDPE = high density polyethylene; PETE = polyethylene terephthalate; LDPE = low density polyethylene; C&D = construction and demolition debris; HHW = household hazardous waste * Represents a component of the waste stream with high energy content.

Section 7
7-6 R. W. Beck 001640 | 11-01056-10004 | 6/8/2007
Based on a review of the information in Table 7-3 and the quantities and percentages of combustible MSW assumed to be delivered to a Conversion Facility in 2016 and 2036, it appears that reaching the Base Case recycling goals would not have any significant impact on a Conversion Facility (assumed to be sized at 3,200 TPD, as discussed in Section 6) in terms of either sufficient waste supply or the heating value of the waste delivered to the facility. The data in Table 7-3 indicate that in 2016, more than 1,164,000 tons of waste are projected to be available to a Conversion Facility. In 2036 that number grows to approximately 1,555,000. Since the assumed 3,200 TPD Conversion Facility would process approximately 1,151,000 tons per year (considering the assumed facility availability), the supply projected to be available throughout the study period is more than adequate. In reviewing the assumed composition of the waste stream in 2036, we note that there are still significant quantities of the waste stream that are identified as having high energy content and what they represent as a percent of the waste stream has not been significantly reduced.
Based on this data, our opinion is that if the County reaches the Base Case recycling goals, this should not have any significant impact on the operation of a Conversion Facility of the size assumed in this report.
Increased Levels of Recycling For comparative purposes, we developed two analyses which assumed the County increased its total level of recycling above the Base Case.
The 60 Percent Level We developed an estimate of future recycling quantities based on the same estimated MSW generation as the Base Case and assuming that a 60 percent recycling rate would be achieved by 2036. The results of the 60 percent projections are shown in Table 7-4.
Table 7-4 Projected Quantities of Materials to be Recycled and Disposed of in King County
through 2036 at a 60% Recycling Rate
Year
Projected MSW
Generation (Tons)
Projected Recycling
Rate Projected Tons
Recycled Projected Tons
Disposed
2007 1,775,000 44.6% 769,700 1,005,000 2016 2,209,300 47.3% 1,045,622 1,163,678 2026 2,664,560 53.7% 1,429,553 1,235,007 2036 3,329,423 60.0% 1,996,756 1,332,667
In order to increase the recycling rate from the Base Case amount of 53 percent to 60 percent by 2036, the County would have to recycle 60 percent of the projected
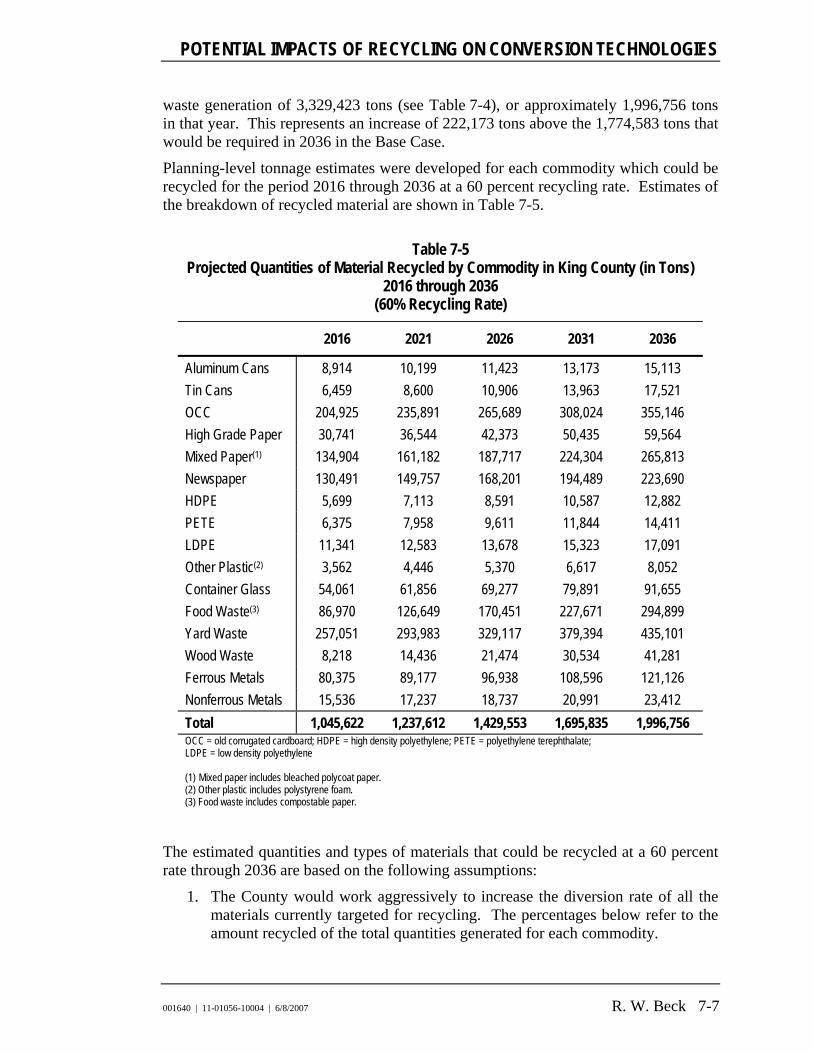
POTENTIAL IMPACTS OF RECYCLING ON CONVERSION TECHNOLOGIES
001640 | 11-01056-10004 | 6/8/2007 R. W. Beck 7-7
waste generation of 3,329,423 tons (see Table 7-4), or approximately 1,996,756 tons in that year. This represents an increase of 222,173 tons above the 1,774,583 tons that would be required in 2036 in the Base Case.
Planning-level tonnage estimates were developed for each commodity which could be recycled for the period 2016 through 2036 at a 60 percent recycling rate. Estimates of the breakdown of recycled material are shown in Table 7-5.
Table 7-5
Projected Quantities of Material Recycled by Commodity in King County (in Tons) 2016 through 2036
(60% Recycling Rate)
2016 2021 2026 2031 2036
Aluminum Cans 8,914 10,199 11,423 13,173 15,113 Tin Cans 6,459 8,600 10,906 13,963 17,521 OCC 204,925 235,891 265,689 308,024 355,146 High Grade Paper 30,741 36,544 42,373 50,435 59,564 Mixed Paper(1) 134,904 161,182 187,717 224,304 265,813 Newspaper 130,491 149,757 168,201 194,489 223,690 HDPE 5,699 7,113 8,591 10,587 12,882 PETE 6,375 7,958 9,611 11,844 14,411 LDPE 11,341 12,583 13,678 15,323 17,091 Other Plastic(2) 3,562 4,446 5,370 6,617 8,052 Container Glass 54,061 61,856 69,277 79,891 91,655 Food Waste(3) 86,970 126,649 170,451 227,671 294,899 Yard Waste 257,051 293,983 329,117 379,394 435,101 Wood Waste 8,218 14,436 21,474 30,534 41,281 Ferrous Metals 80,375 89,177 96,938 108,596 121,126 Nonferrous Metals 15,536 17,237 18,737 20,991 23,412 Total 1,045,622 1,237,612 1,429,553 1,695,835 1,996,756 OCC = old corrugated cardboard; HDPE = high density polyethylene; PETE = polyethylene terephthalate; LDPE = low density polyethylene (1) Mixed paper includes bleached polycoat paper. (2) Other plastic includes polystyrene foam. (3) Food waste includes compostable paper.
The estimated quantities and types of materials that could be recycled at a 60 percent rate through 2036 are based on the following assumptions:
1. The County would work aggressively to increase the diversion rate of all the materials currently targeted for recycling. The percentages below refer to the amount recycled of the total quantities generated for each commodity.

Section 7
7-8 R. W. Beck 001640 | 11-01056-10004 | 6/8/2007
ONP (newspaper), OCC (corrugated cardboard), and mixed paper all reach a recycling rate of 90 percent or higher by 2036;
Glass, metal, and plastic bottles (PETE and HDPE) all attain a 90 percent recycling rate by 2036;
Bleached polycoat paper (aseptic containers such as milk and juice cartons) collected for recycling would dramatically increase. Fifteen percent of polycoat generated would be recycled by 2016 and by 2036, 90 percent would be recycled;
Plastic containers (other than #1 and #2 bottles) attain a 30 percent recycling rate by 2016 and 45 percent by 2036;
Plastic film and bags attain a 15 percent recycling rate by 2036;
Yard waste recycling would reach 90 percent by 2036; and
Food waste would attain a 25 percent recycling rate by 2016 and 55 percent by 2036.
2. The County would focus its efforts on recycling/diverting/composting additional organic materials such as dimensional lumber, stumps and large prunings beginning in 2016 and reaching a 50 percent recycling rate by 2036.
3. By 2036, 50 percent of the compostable paper generated would be diverted from disposal as part of the food waste recycling program.
For the purpose of identifying the potential impact on the heating value of the MSW being delivered to a Conversion Facility at a 60 percent recycling rate, we have developed planning estimates of the quantities of all material that will need to be sent to a disposal facility at a 60 percent recycling rate. The results of that comparison are shown in Table 7-6.
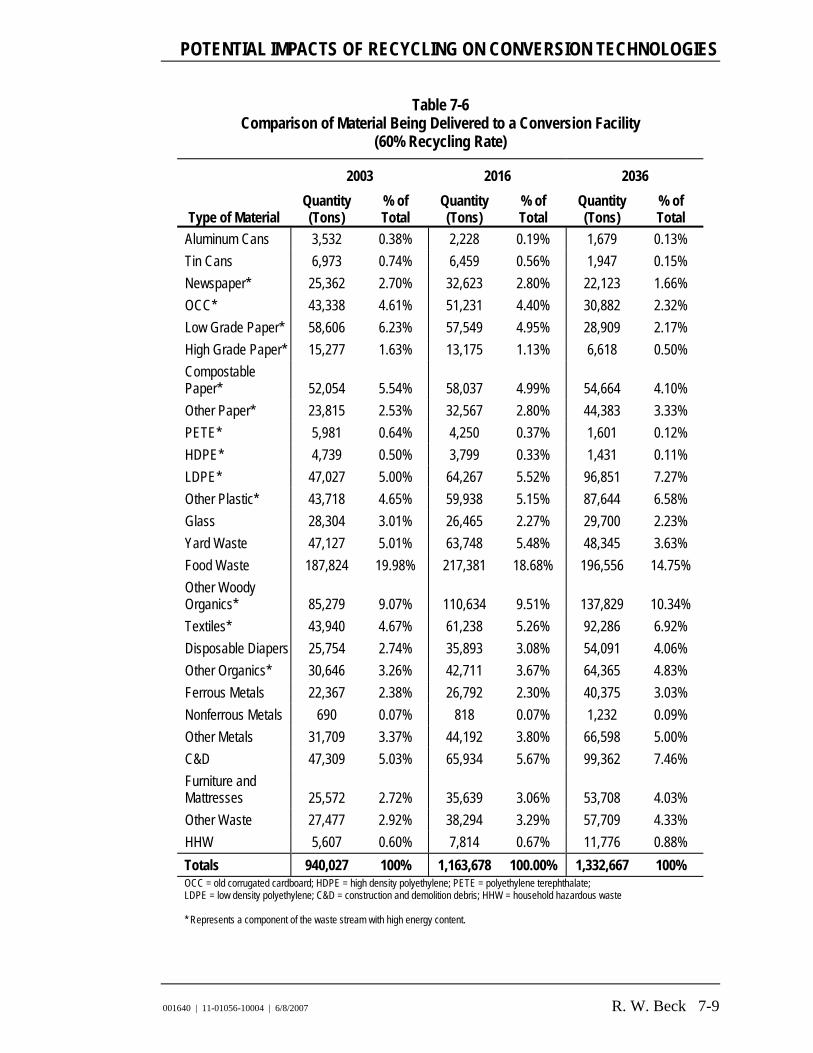
POTENTIAL IMPACTS OF RECYCLING ON CONVERSION TECHNOLOGIES
001640 | 11-01056-10004 | 6/8/2007 R. W. Beck 7-9
Table 7-6 Comparison of Material Being Delivered to a Conversion Facility
(60% Recycling Rate)
2003 2016 2036
Type of Material Quantity (Tons)
% of Total
Quantity (Tons)
% of Total
Quantity (Tons)
% of Total
Aluminum Cans 3,532 0.38% 2,228 0.19% 1,679 0.13% Tin Cans 6,973 0.74% 6,459 0.56% 1,947 0.15% Newspaper* 25,362 2.70% 32,623 2.80% 22,123 1.66% OCC* 43,338 4.61% 51,231 4.40% 30,882 2.32% Low Grade Paper* 58,606 6.23% 57,549 4.95% 28,909 2.17% High Grade Paper* 15,277 1.63% 13,175 1.13% 6,618 0.50% Compostable Paper* 52,054 5.54% 58,037 4.99% 54,664 4.10% Other Paper* 23,815 2.53% 32,567 2.80% 44,383 3.33% PETE* 5,981 0.64% 4,250 0.37% 1,601 0.12% HDPE* 4,739 0.50% 3,799 0.33% 1,431 0.11% LDPE* 47,027 5.00% 64,267 5.52% 96,851 7.27% Other Plastic* 43,718 4.65% 59,938 5.15% 87,644 6.58% Glass 28,304 3.01% 26,465 2.27% 29,700 2.23% Yard Waste 47,127 5.01% 63,748 5.48% 48,345 3.63% Food Waste 187,824 19.98% 217,381 18.68% 196,556 14.75% Other Woody Organics* 85,279 9.07% 110,634 9.51% 137,829 10.34% Textiles* 43,940 4.67% 61,238 5.26% 92,286 6.92% Disposable Diapers 25,754 2.74% 35,893 3.08% 54,091 4.06% Other Organics* 30,646 3.26% 42,711 3.67% 64,365 4.83% Ferrous Metals 22,367 2.38% 26,792 2.30% 40,375 3.03% Nonferrous Metals 690 0.07% 818 0.07% 1,232 0.09% Other Metals 31,709 3.37% 44,192 3.80% 66,598 5.00% C&D 47,309 5.03% 65,934 5.67% 99,362 7.46% Furniture and Mattresses 25,572 2.72% 35,639 3.06% 53,708 4.03% Other Waste 27,477 2.92% 38,294 3.29% 57,709 4.33% HHW 5,607 0.60% 7,814 0.67% 11,776 0.88% Totals 940,027 100% 1,163,678 100.00% 1,332,667 100% OCC = old corrugated cardboard; HDPE = high density polyethylene; PETE = polyethylene terephthalate; LDPE = low density polyethylene; C&D = construction and demolition debris; HHW = household hazardous waste * Represents a component of the waste stream with high energy content.

Section 7
7-10 R. W. Beck 001640 | 11-01056-10004 | 6/8/2007
Based on a review of the information in Table 7-6 and the quantities and percentages of combustible MSW assumed to be delivered to a Conversion Facility in 2016 and 2036, it appears that reaching a 60 percent recycling level would not impact the quantity of waste required to operate a Conversion Facility sized at 3,200 TPD, as just under 1,164,000 tons are projected to be available in 2016 for a Conversion Facility assumed to process 1,051,000 tons per year. This tonnage also increases through the study period to approximately 1,330,000 tons in 2036. However, the amount of higher energy waste components assumed to be in the waste stream is reduced both in terms of total quantity as well as a percentage of the total waste stream. This is true for newspaper, old corrugated cardboard, low- and high-grade paper, compostable paper, and PETE and HDPE bottles. These seven materials are projected to represent approximately 19 percent of the total waste delivered to a Conversion Facility in 2016. By 2036, those components are projected to represent approximately 11 percent of the total waste delivered to a Conversion Facility. We also note, however, that the percentages of certain other high-energy components are projected to increase between 2016 and 2036. These components include other paper, LDPE, other plastic, other woody organics, textiles, and other organics. These materials are projected to represent approximately 32 percent of the incoming waste in 2016 and approximately 39 percent of the incoming waste in 2036.
Based on this data, our opinion is that the implementation of a 60 percent recycling level may have a relatively small effect on the heating value of the waste received at a Conversion Facility which, in turn, may have a relatively small effect on the amount of energy generated per ton of waste processed.
The 70 Percent Level We undertook a similar analysis which assumed the recycling level increased from the Base Case to 70 percent by 2036. Projected quantities of materials recycled and disposed of based on a 70 percent recycling rate are shown in Table 7-7.
Table 7-7 Projected Quantities of Materials to be Recycled and Disposed of in King County
through 2036 at a 70% Recycling Rate
Year
Projected MSW
Generation (Tons)
Projected Recycling
Rate Projected Tons
Recycled Projected Tons
Disposed
2007 1,775,000 44.6% 769,700 1,005,000 2016 2,209,300 52.0% 1,148,312 1,060,988 2026 2,664,560 61.0% 1,626,650 1,037,910 2036 3,329,423 70.1% 2,334,556 994,867
Planning level tonnage estimates per commodity at a 70 percent recycling rate are shown in Table 7-8.
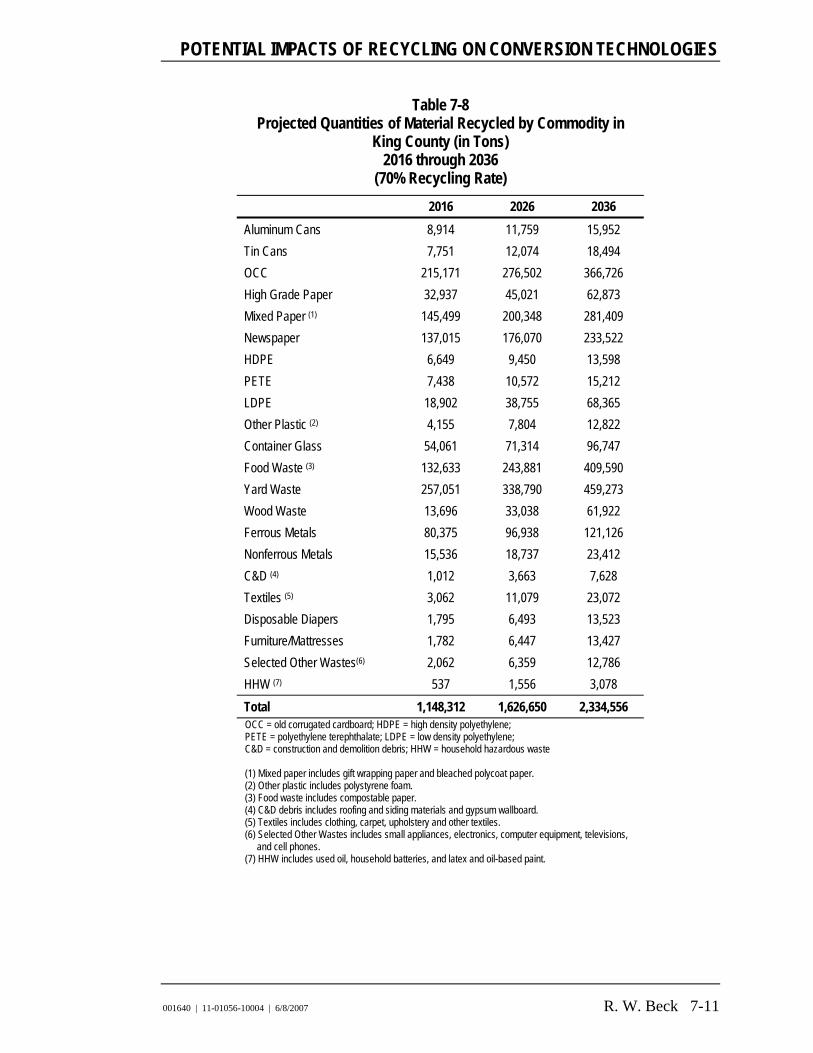
POTENTIAL IMPACTS OF RECYCLING ON CONVERSION TECHNOLOGIES
001640 | 11-01056-10004 | 6/8/2007 R. W. Beck 7-11
Table 7-8 Projected Quantities of Material Recycled by Commodity in
King County (in Tons) 2016 through 2036
(70% Recycling Rate) 2016 2026 2036
Aluminum Cans 8,914 11,759 15,952 Tin Cans 7,751 12,074 18,494 OCC 215,171 276,502 366,726 High Grade Paper 32,937 45,021 62,873 Mixed Paper (1) 145,499 200,348 281,409 Newspaper 137,015 176,070 233,522 HDPE 6,649 9,450 13,598 PETE 7,438 10,572 15,212 LDPE 18,902 38,755 68,365 Other Plastic (2) 4,155 7,804 12,822 Container Glass 54,061 71,314 96,747 Food Waste (3) 132,633 243,881 409,590 Yard Waste 257,051 338,790 459,273 Wood Waste 13,696 33,038 61,922 Ferrous Metals 80,375 96,938 121,126 Nonferrous Metals 15,536 18,737 23,412 C&D (4) 1,012 3,663 7,628 Textiles (5) 3,062 11,079 23,072 Disposable Diapers 1,795 6,493 13,523 Furniture/Mattresses 1,782 6,447 13,427 Selected Other Wastes(6) 2,062 6,359 12,786 HHW (7) 537 1,556 3,078 Total 1,148,312 1,626,650 2,334,556 OCC = old corrugated cardboard; HDPE = high density polyethylene; PETE = polyethylene terephthalate; LDPE = low density polyethylene; C&D = construction and demolition debris; HHW = household hazardous waste (1) Mixed paper includes gift wrapping paper and bleached polycoat paper. (2) Other plastic includes polystyrene foam. (3) Food waste includes compostable paper. (4) C&D debris includes roofing and siding materials and gypsum wallboard. (5) Textiles includes clothing, carpet, upholstery and other textiles. (6) Selected Other Wastes includes small appliances, electronics, computer equipment, televisions,
and cell phones. (7) HHW includes used oil, household batteries, and latex and oil-based paint.

Section 7
7-12 R. W. Beck 001640 | 11-01056-10004 | 6/8/2007
The estimated quantities and types of materials that could be recycled at a 70 percent rate through 2036 are based on the following assumptions, in addition to those listed for the 60 percent projections:
1. Gift wrapping paper would be added to the mixed paper category. By 2016, 30 percent would be recycled and by 2036, 95 percent of gift wrapping paper would be recycled.
2. Polystyrene foam would be accepted for recycling. Approximately 25 percent of polystyrene waste generated by 2036 would be recycled.
3. Plastic containers (other than #1 and #2 bottles) and plastic film and bags all attain a 60 percent recycling rate by 2036.
4. Yard waste recycling would reach 95 percent by 2036.
5. Food waste, including compostable paper, would attain a 75 percent recycling rate by 2036.
6. Additional construction and demolition (C&D) materials would be recycled, including 25 percent of all roofing and siding materials and gypsum wallboard by 2036.
7. Recycling opportunities would be available to divert approximately 25 percent of all textiles (including carpet and upholstery), disposable diapers, furniture and mattresses generated.
8. Increased efforts would be made to divert or recycle approximately 95 percent of selected other wastes (small appliances, electronics, and computer equipment) and household hazardous waste.
For the purpose of identifying the potential impact on the heating value of the MSW delivered to a Conversion Facility at a 70 percent recycling rate, we have developed planning estimates of the quantities of all material that will be delivered to a disposal facility at a 70 percent recycling rate. The results of that comparison are shown in Table 7-9.

POTENTIAL IMPACTS OF RECYCLING ON CONVERSION TECHNOLOGIES
001640 | 11-01056-10004 | 6/8/2007 R. W. Beck 7-13
Table 7-9 Comparison of Material Being Delivered to a Conversion Facility
(70% Recycling Rate)
2003 2016 2036 Type of Material Quantity
(Tons) % of Total
Quantity (Tons)
% of Total
Quantity (Tons)
% of Total
Aluminum Cans 3,532 0.38% 2,228 0.21% 840 0.08% Tin Cans 6,973 0.74% 5,167 0.49% 973 0.10% Newspaper* 25,362 2.70% 26,098 2.46% 12,291 1.24% OCC* 43,338 4.61% 40,985 3.86% 19,301 1.94% Low Grade Paper* 58,606 6.23% 47,957 4.52% 14,454 1.45% High Grade Paper* 15,277 1.63% 10,979 1.03% 3,309 0.33% Compostable Paper* 52,054 5.54% 47,155 4.44% 27,332 2.75% Other Paper* 23,815 2.53% 31,563 2.97% 43,242 4.35% PETE* 5,981 0.64% 3,188 0.30% 801 0.08% HDPE* 4,739 0.50% 2,849 0.27% 716 0.07% LDPE* 47,027 5.00% 56,706 5.34% 45,577 4.58% Other Plastic* 43,718 4.65% 59,068 5.57% 82,873 8.33% Glass 28,304 3.01% 26,465 2.49% 24,608 2.47% Yard Waste 47,127 5.01% 63,748 6.01% 24,172 2.43% Food Waste 187,824 19.98% 182,600 17.21% 109,198 10.98% Other Woody Organics* 85,279 9.07% 104,734 9.87% 114,014 11.46% Textiles 43,940 4.67% 58,176 5.48% 69,215 6.96% Disposable Diapers 25,754 2.74% 34,098 3.21% 40,568 4.08% Other Organics* 30,646 3.26% 42,711 4.03% 64,365 6.47% Ferrous Metals 22,367 2.38% 26,792 2.53% 40,375 4.06% Nonferrous Metals 690 0.07% 818 0.08% 1,232 0.12% Other Metals 31,709 3.37% 44,192 4.17% 66,598 6.69% C&D 47,309 5.03% 65,343 6.16% 94,908 9.54% Furniture and Mattresses 25,572 2.72% 33,857 3.19% 40,281 4.05% Other Waste 27,477 2.92% 36,948 3.48% 49,021 4.93% HHW 5,607 0.60% 6,561 0.62% 4,601 0.46% Total: 940,027 100% 1,060,988 100% 994,867 100% OCC = old corrugated cardboard; HDPE = high density polyethylene; PETE = polyethylene terephthalate; LDPE = low density polyethylene; C&D = construction and demolition debris; HHW = household hazardous waste * Represents a component of the waste stream with high energy content.

Section 7
7-14 R. W. Beck 001640 | 11-01056-10004 | 6/8/2007
Based on a review of the information in Table 7-9 and the quantities and percentages of combustible MSW assumed to be delivered to a Conversion Facility in 2016 and 2036, it appears that reaching a 70 percent recycling level would impact both the quantity and heating value of waste required to efficiently operate a Conversion Facility sized at 3,200 TPD. The total quantity of waste assumed to require disposal in 2016 is approximately 1,061,000 tons, but by 2036 this number decreases to approximately 995,000 tons. This is somewhat less than the assumed annual processing capacity of 1,051,000 tons. The following high-energy waste components are forecast to decrease between 2016 and 2036: newspaper, old corrugated cardboard, low-grade paper, high-grade paper, compostable paper, PETE, HDPE, and LDPE. These materials are forecast to decrease from approximately 22 percent of the waste stream requiring disposal in 2016 to approximately 12 percent in 2036.
Based on this data, we believe the implementation of the 70 percent recycling level would have an impact on the heating value of the waste received at a Conversion Facility. This would affect decisions related to the size and operation of a Conversion Facility.
Recycling by Conversion Facilities The following discussion provides background information on existing practices and potential opportunities to recover material from the three selected Conversion Technologies. Conversion Facilities recover some recyclables on the tipping floor or storage pit. In the waste receiving areas at Conversion Facilities, operators remove non-processable, bulky metal items (e.g., white goods, etc.) that are then recycled. Section 8 identifies materials in the County’s MSW that the three selected Conversion Technologies cannot process. Section 10 reviews beneficial reuse potential in the state of Washington.
Mass Burn Waste-To-Energy Waterwall Mass burn waste-to-energy facilities generally practice post-combustion materials recovery. In the United States, mass burn facilities combine the quenched bottom ash from the furnace-boiler and the fly ash from the upper boiler and economizer hoppers and the air emissions control system. Post-combustion material recovery consists of metals removal from the resulting residue. Possible processing steps include screening with a grizzly scalper, multiple stages of magnetic separation, and an eddy current separator for aluminum. The grizzly scalper separates the oversized bulky ferrous metal. The undersized ferrous metal and combustion residue fall for further processing. Metal recovery rates of over 80 percent are achievable. The recovered ferrous metal is entrained with ash and is highly oxidized, which reduces its market value. In the United States, beneficial reuse of the remaining combustion residue as alternative daily cover is widely practiced at MSW landfills.
Covanta Energy Corporation’s Fairfax County Resource Recovery Facility in Virginia, Covanta’s Niagara Falls Resource Recovery Facility in New York, and Wheelabrator Technologies’ Pinellas Resource Recovery Facility in Florida all use

POTENTIAL IMPACTS OF RECYCLING ON CONVERSION TECHNOLOGIES
001640 | 11-01056-10004 | 6/8/2007 R. W. Beck 7-15
eddy current separators and other methods to remove and recover nonferrous metals from post-combustion residue.
As described in Appendix B, the Spokane mass burn facility utilizes ferrous metal recovery from the residue ash and white goods recovery from the receiving floor to increase materials recovery. To the extent that a King County Conversion Facility would use similar methods, there is a potential for the County’s overall recycling rate to be increased by an additional 3 to 4 percent.
RDF Waste-To-Energy Front-end RDF processing generally results in converting 90 percent of the solid waste to a combustible fuel. The remaining 10 percent typically consists of recovered materials and process residue. Ferrous and nonferrous metals are recovered on the front-end using several processing steps which can include size reduction with shredders, screening with trommels, multiple stages of magnetic separation, and an eddy current separator for aluminum. Metal recovery rates of over 80 percent are achievable, but the recovered ferrous metal, which is contaminated with RDF products, has a lower market value than clean ferrous metal. To increase the RDF process yield and because of the minimal market value of mixed glass cullet, several RDF processing facilities in the United States have sealed the first-stage holes in the trommel screens.
The Southeastern Public Service Authority of Virginia’s RDF Plant and Covanta’s SEMASS Resource Recovery Facility in Massachusetts recover ferrous metal in the combined combustion residue. Based on the experiences at these facilities, it is clear that high recovery rates of metals in the combustion residue are achievable. In addition, beneficial reuse of the remaining combustion residue as alternative daily cover is practiced at many MSW landfills in the United States.
Advanced Thermal Recycling Two advanced thermal recycling facilities, MVB and MVR, operate in Hamburg, Germany. Unlike waste-to-energy facilities in the United States, the bottom ash and fly ash streams are kept separate at the German facilities. This separation facilitates the beneficial use of the combustion residue. The bottom ash is used as construction fill in the port area of Hamburg. The fly ash is stabilized with cement and used to reclaim abandoned salt mines.
The bottom ash collects in a water bath at the bottom of the furnace-boiler units. After discharging from the removal system, the bottom ash is sieved and crushed followed by magnets and eddy current separators to remove ferrous and nonferrous metals. Riddlings (grate siftings), and floating and suspended solids are returned to the waste storage pit and mixed with the incoming waste. Soluble salts left in the wash water are pumped to the process water treatment system for cleaning and reuse. The washed, processed bottom ash is then conveyed to the storage area. Following removal and washing, the bottom ash is crushed, screened, and conveyed to the storage area.
Section 7
7-16 R. W. Beck 001640 | 11-01056-10004 | 6/8/2007
Fly ash, which is collected from the boiler and economizer hoppers and the two baghouses, represents about 3 percent by weight of the waste feedstock. In the air emission control system, the first baghouse is followed by a two-stage wet scrubber.
The flue gases first enter the hydrochloric acid (HCl) wet scrubber, which uses water to remove highly soluble, HCl from the flue gas stream. A 10 to 12 percent HCl solution is formed in the recirculating stream. The HCl scrubber blowdown is further treated in the HCl rectification system, which cleans and concentrates the HCl to a 30 percent solution for sale in the water treatment industry. The HCl recovery rate is typically 1.3 percent by weight of the waste feedstock.
The flue gases then enter the sulfur dioxide (SO2) scrubber, which uses lime to react with and remove SO2 from the flue gas. The reaction of lime and SO2 with the oxygen in the process forms calcium sulfate, or gypsum. The gypsum is washed and dewatered in a centrifuge to meet a specified solids content (<10 percent) for sale to the cement and wallboard industries. The gypsum recovery rate is typically 0.3 percent by weight of the waste feedstock.
These treatment processes result in materials that are recoverable as a marketable byproduct: stabilized bottom ash, HCl, and gypsum. While these processes occur after combustion of the waste, they are often considered another form of recycling and will decrease the amount of waste or ash requiring disposal in a landfill.
Compatibility of Conversion Technologies and Recycling In 2002 the Integrated Waste Services Association (IWSA), a waste-to-energy industry trade association, conducted a nationwide survey to re-examine whether recycling and WTE were compatible. An initial study by IWSA in 1992 had demonstrated that recycling and WTE support one another in many ways. The findings of the 2002 survey findings include:2
100 percent of WTE plants are linked to off-site recycling programs;
82 percent of WTE facilities have on-site recycling (e.g., metals, ash reuse, other);
57 percent of WTE communities have higher recycling rates than the national rate (at the time of the study) of 28%. The average recycling rate for WTE communities across the United States was 33%; and
100 percent of respondents surveyed provided evidence supporting WTE and recycling compatibility.
It should be noted that as a trade association of conversion technology vendors, IWSA may be motivated to demonstrate the compatibility of recycling and conversion technologies.
2 Jonathan V.L. Kiser, “Recycling and Waste-to-Energy: The Ongoing Compatibility Success Story,” MSW Management, May/June 2003.

POTENTIAL IMPACTS OF RECYCLING ON CONVERSION TECHNOLOGIES
001640 | 11-01056-10004 | 6/8/2007 R. W. Beck 7-17
Impact of Recycling on Conversion Facilities Our review indicates that the County’s stated intention to increase the level of recycling from 44 to 60 percent would influence a Conversion Facility in one of three ways:
1. Size. How much disposal capacity should the Conversion Facility(ies) be designed to accommodate?
2. Timing. When should the County plan to have additional processing units of a Conversion Facility constructed to meet future increases in the quantity of solid waste generated?
3. Energy Generation. Depending upon the types of recyclable materials the County focuses on, the impact on a Conversion Facility’s ability to generate power could be positive, negative, or neutral.
Presented below is a discussion of the interrelationship between changes in the County’s recycling program and the development of a Conversion Facility.
Required Disposal Capacity As discussed in Section 6, one of the most important considerations if the County were to proceed with a Conversion Facility would be how large the Conversion Facility should be and how many Conversion Facilities should be constructed. The capacity and number of the Conversion Facilities will be directly impacted by the assumed level of recycling in the future.
To illustrate the beneficial impact of recycling, if each year the County continued to recycle only 44.6 percent of the solid waste generated in the County, we estimate that in 2016 it would need a Conversion Facility sized at approximately 3,700 TPD to dispose of the 1,224,000 tons of waste requiring disposal (from Table 7-1, 2,209,300 tons multiplied by 55.4%) instead of the 3,200 TPD facility assumed under the Base Case recycling scenario, which assumes the level of recycling has increased from 44.6 percent in 2007 to 47.3 percent in 2016.
Similarly, by 2036, with no increase in the current level of recycling of 44.6 percent, we estimate the County would require Conversion Facility disposal capacity sized at approximately 5,600 TPD, assuming 90 percent annual availability. Under the Base Case scenario, we estimate that in 2036, the County will require approximately 4,700 TPD of disposal capacity, a difference of 900 TPD of disposal capacity that would have been required if the current recycling level of 44.6 percent was not increased to 53.3 percent.
If one were to assume that the capital cost of a Conversion Facility was approximately $175,000 per ton in 2007 dollars, reducing the amount of required disposal capacity by 900 TPD would save the County approximately $158,000,000 in capital costs, expressed in 2007 dollars.

Section 7
7-18 R. W. Beck 001640 | 11-01056-10004 | 6/8/2007
If in the future the County determines to proceed with the development of a Conversion Facility, it will be critical for the County to identify what represents an attainable recycling level by 2016.
Need for Additional Disposal Capacity As the amount of waste generated in the County increases in the future, and if the County were to proceed with a Conversion Facility, it is likely that the County will require the installation of additional disposal capacity after 2016. How much additional disposal capacity will be required will be influenced by the amount of waste the County is able to recycle. The initial design of a Conversion Facility should include consideration of the construction of additional processing lines in the future and should also consider the likelihood of attaining increased levels of recycling. This will require careful consideration by the County in terms of having the necessary disposal capacity on a timely basis but not installing it so early that the County has tens of millions of dollars invested in equipment that is being operated at a low, inefficient rate. The County could expect to realize economies of scale by adding additional processing lines that are similar in size to the existing lines.
Impact on Ability to Generate Energy Just as the size of a Conversion Facility will be impacted by the level of recycling achieved in the County, so will the amount of energy a Conversion Facility can generate. The impact may be positive, negative, or neutral. For illustrative purposes, presented below is a discussion of different ways that energy production could be impacted under various approaches to recycling that differ from the Base Case discussed previously.
A review of the data in Table A-1 in Appendix A indicates that a significant portion of the material reported to have been recycled in the County would not be good sources of feedstock for the recommended Conversion Technologies. Table 7-10 presents a summary of those materials, in 2004 tons, that are not ideal types of feedstock at a Conversion Facility.

POTENTIAL IMPACTS OF RECYCLING ON CONVERSION TECHNOLOGIES
001640 | 11-01056-10004 | 6/8/2007 R. W. Beck 7-19
Table 7-10 Recycled Material Which are Not a Good Source of Feedstock
for the Recommended Conversion Technologies
Material Tons (2004)
% of Total for 2004
Aluminum cans 3,534 0.52 Tin cans 2,857 0.42 Container glass 24,503 3.59 Food waste 32,900 4.83 Yard waste 222,701 32.67 Ferrous metals 53,979 7.92 Non-ferrous metals 16,733 2.45 Mixed tin, alum., plastic, glass from County transfer station drop-off sites 1,325 0.19 Total 358,532 52.59%
Note: Values from Appendix A, Table A-1.
The information in Table 7-10 indicates that approximately 53 percent of the material that the County recycled in 2004 would not be a good feedstock for the recommended Conversion Technologies.
We have developed estimates of the quantities of the same recyclable material shown in Table 7-10 through 2036 at 60 and 70 percent recycling rates. The results of this analysis are provided in Table 7-11.
Table 7-11 Recycled Material Which are Not a Good Source of Feedstock
for the Recommended Conversion Technologies
Material Tons at 60%
(2036) % of Total
at 60% Tons at 70%
(2036) % of Total
at 70%
Aluminum cans 15,113 0.76% 15,952 0.68% Tin cans 17,521 0.88% 18,494 0.79% Container glass 91,655 4.59% 96,747 4.14% Food waste 294,899 14.77% 409,590 17.54% Yard waste 435,101 21.79% 459,273 19.67% Ferrous metals 121,126 6.07% 121,126 5.19% Non-ferrous metals 23,412 1.17% 23,412 1.00% Total 998,827 50.02% 1,144,594 49.03%
Note: Values from Tables 7-5 and 7-8.
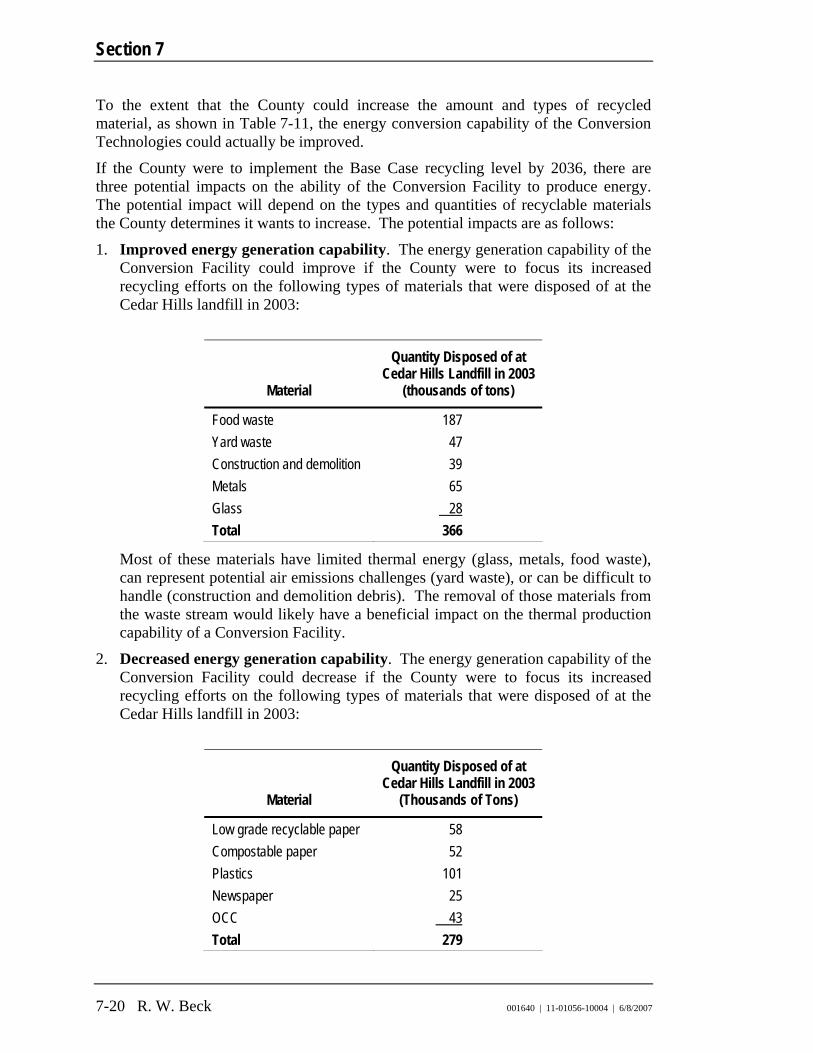
Section 7
7-20 R. W. Beck 001640 | 11-01056-10004 | 6/8/2007
To the extent that the County could increase the amount and types of recycled material, as shown in Table 7-11, the energy conversion capability of the Conversion Technologies could actually be improved.
If the County were to implement the Base Case recycling level by 2036, there are three potential impacts on the ability of the Conversion Facility to produce energy. The potential impact will depend on the types and quantities of recyclable materials the County determines it wants to increase. The potential impacts are as follows:
1. Improved energy generation capability. The energy generation capability of the Conversion Facility could improve if the County were to focus its increased recycling efforts on the following types of materials that were disposed of at the Cedar Hills landfill in 2003:
Material
Quantity Disposed of at Cedar Hills Landfill in 2003
(thousands of tons)
Food waste 187 Yard waste 47 Construction and demolition 39 Metals 65 Glass 28 Total 366
Most of these materials have limited thermal energy (glass, metals, food waste), can represent potential air emissions challenges (yard waste), or can be difficult to handle (construction and demolition debris). The removal of those materials from the waste stream would likely have a beneficial impact on the thermal production capability of a Conversion Facility.
2. Decreased energy generation capability. The energy generation capability of the Conversion Facility could decrease if the County were to focus its increased recycling efforts on the following types of materials that were disposed of at the Cedar Hills landfill in 2003:
Material
Quantity Disposed of at Cedar Hills Landfill in 2003
(Thousands of Tons)
Low grade recyclable paper 58 Compostable paper 52 Plastics 101 Newspaper 25 OCC 43 Total 279

POTENTIAL IMPACTS OF RECYCLING ON CONVERSION TECHNOLOGIES
001640 | 11-01056-10004 | 6/8/2007 R. W. Beck 7-21
These materials have significant energy content and their removal from the waste stream could decrease the amount of energy a Conversion Facility could generate.
3. No net effect. There could be no net effect on the generating capability of a Conversion Facility if the County were to focus its increased recycling efforts on an even distribution of the recyclable materials along the line of what was presented in the previous two tables. For example, if the County removed some combination of glass, metals, yard waste, food waste, lumber and OCC, there may be a trade-off between the loss of heat content in OCC and the removal of glass and metal that have little heating value.
Summary It is clear that future changes in the level of recycling in the County could have a significant impact on the development of a Conversion Facility. This is particularly true in determining the amount of disposal capacity to be installed and the frequency with which new disposal lines should be added.
Our review of the estimated quantity and composition of the solid waste assumed to be delivered to a Conversion Facility under the Base Case scenario indicates that this assumed level of recycling should not have a significant impact on the energy generating capability of a Conversion Facility and there should be a more than sufficient quantity of waste. It should be anticipated that the net energy generation of the facility (expressed as KWh/ton of waste processed) will decrease as the level of recycling increases to 70 percent.
The data we developed for a 60 percent recycling level indicates that throughout the 20-year study period there will still be a more than sufficient supply of solid waste but that there may be a small decrease in the amount of energy generated per ton of waste processed.
At a 70 percent recycling level, the data indicates that by 2036, a small shortfall of solid waste is forecast and the heating value of the solid waste will somewhat reduce the net energy generation.
The level of future recycling is a critical policy decision that the County must address as it proceeds to evaluate its waste disposal options. By achieving the Base Case recycling goal, the County could potentially save hundreds of millions of dollars in construction costs by constructing a smaller Conversion Facility. However, if the County proceeds with the construction of a smaller Conversion Facility and fails to achieve its recycling goals, it could be faced with a significant shortfall in disposal capacity.
The County must set recycling goals it realistically believes it can achieve and must dedicate the time, effort and money required to meet these goals.

Section 8 BACKUP DISPOSAL CAPACITY FOR CONVERSION FACILITIES
001640 | 11-01056-10004 | 6/8/2007
Section 8 BACKUP DISPOSAL CAPACITY FOR CONVERSION FACILITIES
For the purposes of this section of the report, the term “Backup Disposal Capacity” refers to the method(s) the County must have in place to meet its total disposal needs in the event that the primary disposal method(s) are not available either in total or in part. Backup Disposal Capacity is a key consideration regardless of which method of disposal the County selects. However, the employment of the Conversion Technology Disposal Option would require the County to consider certain aspects that would not be associated with the Waste Export Option and are beyond those outlined in the County’s Waste Export Plan.
Need for Backup Disposal Capacity The County may require Backup Disposal Capacity for several reasons, including:
The required disposal of non-processible and unacceptable wastes;
Scheduled and unscheduled maintenance of Conversion Facility(ies);
A natural disaster or a force majeure event that affects either the primary disposal method or ancillary systems such as the long-haul system;
Lack of market or use for residual waste;
Unexpected increase in waste generation or change in composition; or
Increase in waste generation before additional processing lines have been added to the Conversion Facility.
To a certain extent, the need for Backup Disposal Capacity may be able to be reduced through appropriate and considered design and operation of the transfer stations in conjunction with the Conversion Facility as well as the potential use and recovery of non-processible waste and beneficial use of residuals. Even if these efforts are successful, they will not eliminate the need for a plan for Backup Disposal Capacity in the event currently unexpected problems are encountered.
Backup Disposal Capacity Options Presented below is a discussion of options that may be available to the County as ways to approach the need for Backup Disposal Capacity.

Section 8
8-2 R. W. Beck 001640 | 11-01056-10004 | 6/8/2007
Conversion Technology Redundancy If the County were to build redundancy into its Conversion Technology system, the amount of Backup Disposal Capacity required could be reduced. This redundancy could come in two ways, each of which provides different benefits related to backup disposal requirements. First, the County could choose to build multiple processing trains at the Conversion Facility. As discussed in Section 6, this would provide some flexibility during scheduled and unscheduled outages. This method could lose some economies of scale as a result of using smaller processing trains, but if the size of the trains stays above a specific threshold, the impact of this increased cost can be reduced. The second method the County could use to build in redundancy would be to locate these multiple processing trains on multiple sites, effectively building two or more different Conversion Facilities. This option takes advantage of the flexibility of multiple processing trains and also insulates the County from risks that could impact one Conversion Facility while leaving the other Conversion Facilities unaffected. While these two options address the County’s need for backup due to scheduled and unscheduled outages as well as logistical problems, they may not sufficiently address backup needs as a result of unforeseen waste generation increases or less-than-expected recycling and reuse quantities.
To address these issues, the County could incorporate excess capacity into the Conversion Facilities. Excess design capacity could be provided from the outset either as larger-sized processing trains, or as additional processing trains beyond the number initially required to handle the expected waste quantities. While this method of sizing can accommodate, among other things, an unexpected growth in the waste stream, increased waste tonnages resulting from a catastrophic event, or less than planned recycling or reuse, it is often not a cost effective way of providing Backup Disposal Capacity based on the high capital cost of Conversion Facilities.
In-County Disposal Currently, the County expects the Cedar Hills Regional Landfill to have permitted capacity for County waste at least until 2016. With the implementation of more aggressive recycling programs and the construction of Conversion Facilities that could be operational prior to 2016, the amount of waste requiring landfilling would decrease significantly, potentially extending the life of Cedar Hills even further. The County could also elect to develop one or more additional cells at Cedar Hills, thereby increasing the available volume for future backup disposal needs. Finally, if the County were to employ early waste export as outlined in the current Waste Export Plan, the life of the Cedar Hills landfill could be further extended. By using these methods to preserve the airspace at Cedar Hills, the landfill could provide the County with backup disposal that could be utilized for any scenario where backup disposal may be necessary. By keeping an in-county backup disposal facility, the County would be able to maintain stronger control of its waste management responsibilities as well as avoid the cost and energy required of long-hauling waste. Since the amount of waste requiring disposal, either as normal bypass waste or as unprocessed waste when the Conversion Facilities are not in service, would be significantly less than is currently disposed of at Cedar Hills, the operation requirements at Cedar Hills would

BACKUP DISPOSAL CAPACITY FOR CONVERSION FACILITIES
001640 | 11-01056-10004 | 6/8/2007 R. W. Beck 8-3
also be significantly reduced. This would likely save the County landfill operation costs but would also sacrifice some economies of scale it currently realizes at the Cedar Hills landfill.
Long-Haul to Regional Landfill A third backup disposal option available to the County is long-haul to a regional landfill. The three typical methods of long-haul are rail, truck, and barge, with rail being the current method of choice in the northwestern United States. Long-haul and disposal would likely be contracted services. Ownership and operation of an intermodal facility (truck-to-rail or possibly truck-to-barge) would likely depend on the quantity of waste material handled. In our opinion, given the likely amount of normal bypass waste and backup disposal waste, the County should give serious consideration to contracting out intermodal service. In addition, the County would need to make arrangements for the use or disposal of residue ash from the Conversion Facility, as discussed in Section 9. In the event the County is not able to get permission from regulators to utilize a more beneficial use for such residue ash and it must be landfilled, the County may find it helpful to combine the arrangements for the long-haul and disposal of both residue ash and any solid waste which cannot be processed by the Conversion Facility. The advantage of long-hauling waste to a regional landfill is that the County would no longer have to operate the Cedar Hills landfill to handle a much smaller amount of waste. Also, much, but probably not all, of the permitting and environmental risks of disposing of the waste would be delegated to the operator of the regional facility. It is not clear whether this option would cost more or less than the in-county backup disposal option, as the actual final costs would depend on the amount of waste that requires disposal, the terms of the contract, and the type of material being disposed of.
For comparison, the Spokane Regional Waste-to-Energy Facility utilizes long-hauling via rail to a regional landfill in central Washington for both the disposal of its bypassed waste and the disposal of its residue ash. The Spokane System1 pays tipping fees of $45.49 per ton for its ash residue ($22.26 of this cost is due to transportation). It also pays $47.83 per ton for disposal of up to 10,000 tons of bypassed waste and $45.44 per ton above 10,000 tons.
Backup Disposal at Other Conversion Facilities In order to help inform the County’s consideration of backup disposal options, Table 8-1 provides the backup disposal methods selected by other owners of Conversion Facilities.
1 As discussed in Section 6, the Spokane Regional Solid Waste System (“Spokane System”) includes Spokane County, the City of Spokane, 12 other cities and towns, and Fairchild Air Force Base.

Section 8
8-4 R. W. Beck 001640 | 11-01056-10004 | 6/8/2007
Table 8-1 Methods of Backup Disposal at Existing Conversion Facilities
Material Requiring Backup Disposal
Facility Conversion Technology
MSW Stream(1)
Residue Ash(2)
Marion County, OR Mass Burn Trucked to Private Landfill
Trucked to County Monofill
Spokane, WA Mass Burn Rail to Private Landfill Rail to Private Landfill (Monofill)
Stanislaus, CA Mass Burn Trucked to Landfill Trucked to Landfill (Monofill)
Kent County, MI Mass Burn Trucked to County Landfill
Trucked to County Landfill (Monofill)
Lancaster County, PA Mass Burn Trucked to Landfill Trucked to Landfill (Daily Cover)
Baltimore, MD Mass Burn Trucked to Landfill Trucked to Landfill (Monofill)
Detroit, MI RDF Trucked to Landfill Trucked to Landfill (Monofill)
Hartford, CT RDF Trucked to Landfill Trucked to Landfill (Monofill)
Norfolk, VA RDF Trucked to Landfill Trucked to Landfill (Daily Cover)
SEMASS, MA RDF Trucked to Landfill Trucked to Landfill (Monofill)
Hamburg, Germany (MVR)
Advanced Thermal Recycling
Diverted to other Conversion Facilities
Used as Base for Adjacent Port
Hamburg, Germany (MVB)
Advanced Thermal Recycling
Diverted to other Conversion Facilities
Used as Base for Adjacent Port
(1) When the Conversion Facility is not available. (2) When residue disposal or recovery system is not available.
Conclusions Backup Disposal Capacity would be necessary if the primary disposal method for County waste were a Conversion Facility. There are three principal backup disposal options for Conversion Facilities in this region: waste export to a regional landfill; in-county landfilling at the County’s Cedar Hills landfill where options exist to extend the capacity and life of the landfill; and, to a lesser degree, construction of excess capacity at the Conversion Facility(ies).
As discussed in Section 6, R. W. Beck believes that if the County decides to proceed with a Conversion Facility, the County should employ multiple processing trains to take advantage of operating and scheduling flexibilities. Nevertheless, the siting of oversized or multiple facilities, even when considering the backup disposal advantages, may not be the County’s most cost effective alternative. Furthermore,

BACKUP DISPOSAL CAPACITY FOR CONVERSION FACILITIES
001640 | 11-01056-10004 | 6/8/2007 R. W. Beck 8-5
based on the information presented in this section and in other sections of this report, in our opinion the County should consider the advantages of preserving airspace at the Cedar Hills landfill as one way of providing Backup Disposal Capacity. If the County decides at some point to develop the Conversion Technology Disposal Option, it is likely that the choice for backup disposal will be between long-hauling to a regional landfill, continued landfilling at the Cedar Hills landfill, or a combination of the two.

Section 9 RESIDUE ASH MANAGEMENT

001640 | 11-01056-10004 | 6/8/2007
Section 9 RESIDUE ASH MANAGEMENT
It is important to understand that the three Conversion Technologies under review will generate residue ash that, under current State of Washington regulations, must be landfilled. The Conversion Technologies should be capable of reducing the volume of the incoming solid waste by up to 90 percent as outlined in Table 3-1. However, the weight of the residue ash can be expected to be approximately 20 to 25 percent of the incoming waste. The Conversion Technologies can save airspace in landfills, but they do not eliminate the need for proper disposal and/or beneficial use of the residue.
The composition and classification of residue ash from Conversion Facilities is important to the County because these aspects impact the manner in which it must be disposed of, which in turn will impact the County’s overall cost of solid waste management and its flexibility in disposal of residue ash.
As part of the review of the potential for the beneficial uses and/or disposal of residue ash at Conversion Facilities in King County, R. W. Beck relied both upon our experience in the industry and on information provided by the Washington State Department of Ecology (DOE). We discussed the residue ash disposal matter with DOE as well as the operators of existing Conversion Facilities. The purpose of these discussions was to gain an understanding of the issues that are most important to state regulators regarding the composition, recovery and disposal of residue ash generated by Conversion Facilities. We also reviewed available reports and studies from other Conversion Facilities.
This section of the report presents a discussion of the following key issues regarding residue ash from Conversion Facilities, specifically:
The existing regulatory framework for residue ash in Washington State;
Factors that impact residue ash management;
Potential uses for residue ash;
Potential markets for residue ash;
Disposal of residue ash; and
Likelihood that residue ash from a Conversion Facility could receive a beneficial use designation.

Section 9
9-2 R. W. Beck 001640 | 11-01056-10004 | 6/8/2007
Existing Regulatory Framework for Residue Ash in Washington The state’s regulations address residue ash from Conversion Facilities as “Special Incinerator Ash.” Under chapter 70.138.020 Revised Code of Washington (RCW), “Special Incinerator Ash” means residues resulting from the operation of incinerators or energy recovery facilities managing municipal solid waste, including solid waste from residential, commercial, and industrial establishments, if the residues (a) would otherwise be regulated as hazardous wastes under chapter 70.105 RCW; and (b) are not regulated as a hazardous waste under the federal Resource Conservation and Recovery Act, 42 U.S.C. Sec. 6901 et seq. The procedures for determining whether a residue ash is a hazardous waste, as defined in chapter 70.105 RCW, are contained in Washington Administrative Code (WAC) 173-303.
Applicable Designation Tests The specific procedures required in the state of Washington to determine whether a residue ash or a solid waste is a dangerous waste are contained in paragraph (3) of WAC 173-303-070. These procedures, briefly described in the following paragraphs, would be applied to the residue ash expected to result from a Conversion Facility in King County.
First, the residue ash is not a discarded chemical product according to the criteria outlined in WAC 173-303-081.
Second, since the Conversion Facility is not a listed dangerous waste source and would not knowingly accept any hazardous waste, the residue ash is not from a listed dangerous waste source as described in WAC 173-303-082.
Third, the residue ash would be evaluated to see if it exhibited any of the dangerous waste characteristics identified under WAC 173-303-090. These characteristics include ignitability, corrosivity, reactivity, and toxicity. Residue ash is neither ignitable nor reactive. For purposes of determining corrosivity and toxicity, quarterly tests results would be performed on the residue ash from the Conversion Facility for several years. The analytical data are obtained using the Toxicity Characteristic Leaching Procedure (TCLP) and the pH of a solid method.
Finally, to determine if the residue ash would meet any dangerous waste criteria, either static acute fish toxicity tests or acute oral rat toxicity tests would be performed pursuant to WAC 173-303-110, using representative samples of the residue ash from the Conversion Facility. Fish toxicity test are typically applied, since they are shorter in duration, less costly, and more representative of the species most likely to be affected. The test is intended to determine whether any of the samples would be designated as either dangerous waste or extremely hazardous waste.
Also, to determine if the residue ash is a persistent dangerous waste pursuant to WAC 173-303-100, the polycyclic aromatic hydrocarbons (PAH) content of the

RESIDUE ASH MANAGEMENT
001640 | 11-01056-10004 | 6/8/2007 R. W. Beck 9-3
residue ash would be determined by testing a single composite sample representing multiple quarterly samples of residue, in accordance with WAC 173-303-110.
Changes in Applicable Designation Tests We discussed with representatives of DOE whether there are any anticipated changes in its current applicable designation tests. We were informed that DOE does not currently have any plans to modify any of the aforementioned testing requirements because DOE believes the existing tests are suitable for determining whether residue ash from Conversion Facilities represents a potential hazard to the environment.
Factors that Impact Residue Ash Management Composition of Incoming Waste The actual composition of residue ash is determined not so much by the manner in which it is processed by any technology, but rather by what is disposed of by the residents and businesses generating the solid waste that is received by solid waste disposal facilities. If it were possible to prevent such items as mercury-based thermometers, household cleaners, lead automobile batteries, and fluorescent light bulbs from being thrown out with other solid waste, the composition of residue ash would not be as problematic as it is. Unfortunately it is extremely unlikely that such items, as well as many others, will disappear from the waste stream. For planning purposes, it should be anticipated that the household hazardous waste item that is currently being disposed of in the wastebasket in someone’s kitchen may continue to find its way into the residue ash of a Conversion Facility.
Heavy metals such as mercury and lead are examples of contaminants that can have a significant impact on the composition of residue ash. In addition to being present in residual waste, heavy metals could also be introduced into the waste stream by various commercial and industrial enterprises. While the volume of the incoming waste is typically reduced by 90 percent by the Conversion Facility, the amount of heavy metals is not similarly reduced and contaminant levels in residue ash can become more concentrated. As discussed in the previous section, the actual level of such material in the residue ash will determine if the residue ash will be classified as a hazardous material by a regulatory agency. Significant progress has been made in recent years in: 1) reducing the amount of hazardous material used in the manufacture of goods; 2) educating the public about the problems with these items; 3) removing the materials from the waste stream by implementing household hazardous waste collection programs; and 4) treating residue ash prior to placement in a landfill to convert heavy metals to non-soluble forms. In spite of these improvements, it will be critical to continue monitoring the composition of residue ash.
Mercury is an example of a contaminant that remains a challenge. Our discussions with DOE representatives indicated that mercury is still a significant issue for the Spokane Conversion Facility, since mercury continues to be used in the manufacture of certain common items including batteries, switches, fluorescent lights, and toys.

Section 9
9-4 R. W. Beck 001640 | 11-01056-10004 | 6/8/2007
While the state of Washington has recently passed legislation (Engrossed Substitute House Bill 1002) banning mercury from selected consumer products, including mercury-added novelty items, manometers, and thermometers, the ban’s effect remains to be seen. If this ban and other management activities, especially recycling of fluorescent lamps and thermostats, are effectively implemented and enforced by the time a Conversion Facility would be operating in King County, the amount of mercury in the incoming waste stream could be reduced. This would result in decreases in the amount of mercury in the residue ash.
In addition to heavy metals, certain chemicals such as sulfur, chlorine, iodine, and bromine can also affect the composition of the residue ash and air emissions compositions if such chemicals are a part of the incoming waste stream. In addition to being present in certain household items, these chemicals can also be introduced into the waste stream as a part of construction waste and industrial chemicals (drywall, pool cleaning, etc.).
One approach for reducing the amount of certain contaminants that cannot be eliminated from consumer products, like mercury and sulfur, from entering the waste stream is through continuing education and diversion programs. The focus of such programs is to inform the public that these types of materials should never reach either the Conversion Facility or a landfill and residents should remove them from the waste stream as part of a household hazardous waste program. Education on topics such as the proper disposal of household hazardous waste and construction and demolition waste is important and is less expensive than the significant pre-processing or screening steps used to try to minimize and divert these contaminants once they have been introduced into the waste stream.
The County has already taken important steps to reduce the introduction of contaminants into the solid waste stream that would likely be processed by a Conversion Facility. Materials such as construction and demolition, hazardous, and green wastes are currently being diverted by the County, so that they are not supposed to be delivered to Cedar Hills Landfill. The results of the Waste Characterization Study discussed in Section 2 of this report indicate that the County has been relatively successful in its diversion efforts.
To the extent that the County can continue to expand its program to either eliminate the generation of, or divert, contaminants from the waste stream, the residue ash from a Conversion Facility would be positively impacted. Nevertheless, it should be anticipated that the composition of the residue ash from a Conversion Facility will have to be continually monitored, analyzed and evaluated throughout the Conversion Facility’s operating life.
Type of Conversion Technology Employed Each Conversion Technology uses very similar methods for combustion of the waste. The differences between the technologies are associated with the way that they process waste prior to the combustion, and the methods used to treat the resulting materials after combustion. For example, RDF facilities are characterized by their

RESIDUE ASH MANAGEMENT
001640 | 11-01056-10004 | 6/8/2007 R. W. Beck 9-5
shredding and sizing of materials into a more homogenous material (RDF) as compared to mass burn facilities which do very little of this pre-processing. Likewise, advanced thermal recycling facilities include treatment of bottom and fly ashes that is more extensive than existing mass burn or RDF facilities in the United States. Presented below is a discussion of how the differences in technology can impact the composition and characteristics of the residue ash.
Residue Treatment and Air Pollution Control Most of the mass burn, RDF, and advanced thermal recycling facilities currently employ relatively similar residue treatment and air pollution control processes, although typically to a greater extent and redundancy in advanced thermal recycling. These processes have improved significantly in the last 10 years as the requirements imposed by regulatory agencies have increased and the technologies have improved. Keep in mind that all three of the Conversion Technologies generally operate well within specified permit requirements, including the characteristics of the residue ash.
Control of the combustion process in the boiler is crucial for ensuring that the materials are combusted completely, that the process occurs efficiently, and that emissions associated with incomplete or poor combustion, such as dioxins and furans, are kept to a minimum. Maintaining proper temperature to assure combustion of certain pollutants is critical. Operators effectively manage the combustion process by controlling the temperature, the supply of air and the movement of the waste through the boiler.
The flue gases that result from the combustion process are subjected to certain processes to remove contaminants prior to the flue gas exiting the stack. Particulate matter that is recovered from the flue gas is referred to as “fly ash” and is one of the components of the residue ash that must be disposed of. Treatment of the flue gas often begins with the addition of ammonia at the proper temperature in a process called “selective non-catalytic reduction (SNCR) for nitrogen oxides (NOx)” which is designed to result in the removal of NOx gases. Carbon, in the form of charcoal, is also injected into the exhaust gas to remove mercury as well as certain other organics such as dioxins and furans. Exhaust gases are often treated in scrubbers (dry and wet) to neutralize contaminants like sulfuric and hydrochloric acids. Dry scrubbers involve spraying a mist of lime slurry into the flue gases, while wet scrubbers involve pulling the air through a liquid slurry of lime. Baghouses are used by Conversion Facilities to remove particulate matter and metals. Baghouses are basically made up of hundreds of fabric bags that filter the exhaust gas as it is drawn through them. The particulate material captured by the baghouses is the fly ash.
Another process developed by Wheelabrator and employed at many facilities in the United States and throughout the world is called Wes-PHix. Wes-PHix is a process that chemically transforms lead and other heavy metals in the fly ash into mineral compounds that substantially reduce solubility. It is used as a method to minimize leaching of heavy metals and improve TCLP test results.
The second component of the residue ash is the “bottom ash,” which represents the material removed from the boilers after combustion is complete. The efficiency of the
Section 9
9-6 R. W. Beck 001640 | 11-01056-10004 | 6/8/2007
combustion process is often measured by determining the amount of unburned carbon remaining in the bottom ash. The goal of a Conversion Facility is to reduce, to the greatest extent possible, the amount of unburned carbon in the bottom ash.
Following the combustion process, phosphoric acid is added to both the bottom and fly ashes at most facilities. The addition of phosphoric acid changes the pH of the ash material to make it more neutral. The acid also bonds with lead and cadmium particles to create complex phosphates that are intended to not leach when subjected to other acids. This step is crucial to ensure passage of the required TCLP test that is conducted periodically on residue ash.
The final design of any Conversion Facility would be carefully reviewed by DOE as a part of granting various operating permits. DOE will want to evaluate the ability of the proposed design to meet established permit requirements for both air emissions and residue ash. It should be anticipated that the design of a Conversion Facility would require design and installation of equipment capable of meeting the maximum available control technology (MACT) standards. This will include consideration of how the residue ash will have to be handled, treated, and disposed of.
Co-Mingling of Bottom and Fly Ash The composition of residue ash is impacted by whether the fly ash and bottom ash, which are generally collected separately, are co-mingled prior to disposal. Fly ash will often represent approximately 20 percent of the total residue ash with bottom ash representing approximately 80 percent. Certain heavy metals, such as mercury and lead, are volatized at high temperatures during the combustion process and become part of the flue gas. These materials are recovered by the scrubbers as part of the fly ash.
The question revolving around co-mingling of the ash streams is whether it is better to separate the fly ash and its heavy metals from the bottom ash. This could become important if a market for the bottom ash could ever be developed.
The answer to this question is not currently clear. Most Conversion Facilities currently mix the two ash streams. This is done because there are certain materials in the bottom ash that can stabilize certain metals in the fly ash, reducing their ability to leach out. Certain operators of Conversion Facilities add dolomite to the fly ash to help stabilize other metals. As previously discussed, other operators apply the WES-PHix process to the fly ash for the same reason. The potential problem of not mixing the two ash streams is that there is a possibility that, in certain circumstances, the fly ash may no longer be considered non-hazardous.
The determination by the County regarding whether to co-mingle bottom and fly ashes at a Conversion Facility would need to be made very carefully and must be made in consultation with DOE and the local health department. Since the history of the uses or disposal of these types of ash has required either monofilling or use as daily cover and road bases in landfills, many facilities currently mix the bottom and fly ashes from their facility to treat (neutralize) the hazardous constituents in both materials. However, as their specific characteristics have become better defined, and as

RESIDUE ASH MANAGEMENT
001640 | 11-01056-10004 | 6/8/2007 R. W. Beck 9-7
regulatory agencies have become more willing to consider their potential for beneficial use, the possible need to reconsider co-mingling has increased. Whether or not the current practice of co-mingling will change will depend on whether a positive economic benefit for the beneficial use of residue ash can be developed.
As discussed below, there are several potential uses for residue ash from Conversion Facilities and each use requires specific characteristics. Uses such as base courses for roads may require only the bottom ash, while segregated fly ash can be used as a binder in concrete. Ultimately, a Conversion Facility would need to be designed to meet the requirements specified by the state of Washington.
Potential Uses for Residue Ash Currently the most common method of disposal of residue ash, and the only acceptable method in Washington, is in landfills. This disposal often occurs in a monofill, which is a single cell separate from where other waste is placed. This is done because, due to its density, the same weight of residue ash takes up much less air space (volume) than MSW. Also, unlike MSW, regulations often allow the residue ash to be placed without being covered each day. Where the use of residue ash as a cover material is permitted by the state regulatory agency, landfill operators may also take advantage of these aspects by employing residue ash as daily cover over the MSW as well, instead of using soil. In addition, residue ash may also be used for the construction of access roads on the landfill (i.e., within the limits of the landfill liner system). If the residue ash can be used for such purposes, Conversion Facility operators may be able to obtain better disposal rates on their residue ash.
Attempts have been made for many years to find a beneficial use for residue ash outside of landfills. Since residue ash, especially bottom ash, often contains relatively few active contaminants and produces acceptable TCLP test results, reuse of the material has been considered and, if ever developed, would further increase the amount of waste diverted from landfills as a result of Conversion Facilities. Residue ash is being tested and used as a construction material, particularly in Europe. For example, several projects have used residue ash as structural fill, as aggregate in cement blocks, and as an additive in asphalt or concrete. Residue ash also has applicability in environmental remediation at brownfields or mines and in several agricultural applications. Ultimately, the beneficial reuse of the residue ash will be limited to the allowed uses as defined by the regulatory agencies.
Potential uses for residue ash are driven first by state regulatory requirements and second by demand for the material to fill a need. In Florida, for example, strides have been made in the use of bottom ash in road construction and the manufacture of concrete. This is partly because the demand for coarse aggregates in Florida far exceeds the supply. Since the soils in Florida are predominantly sandy, much of the needed coarse material must be trucked or shipped to the state, resulting in much higher unit prices. This environment has facilitated the process to make bottom ash an acceptable material for construction in Florida.

Section 9
9-8 R. W. Beck 001640 | 11-01056-10004 | 6/8/2007
Regardless of the suitability of the residue ash for the application, or the regulatory acceptance of these uses, in order for the activity to be sustainable, a strong market must exist for the resulting products. Since Washington does not have the same geologic constraints as Florida (good aggregates are generally abundant in Washington) the same market conditions will not apply. In order to be competitive and profitable, the County must either find a need in the market that ash residue can fill, or fill a need less expensively than it is currently being filled.
Likelihood that Conversion Technology Residue Could Receive a Beneficial Use Designation As discussed previously, in the state of Washington residue ash is designated as “Special Incinerator Ash” and is required to be disposed of separate from other solid wastes. To overcome the first barrier to offering new options for disposal and recycling of the residue ash the County would have to show through test results that its residue ash is not a dangerous waste and should therefore be designated a “Solid Waste.” This change will allow uses for the residue ash to include daily cover material in landfills and base material for access roads on a landfill. A classification of residue ash as Solid Waste would also allow the County to seek other methods of recovery and potentially find a use entirely separate from landfills.
The Spokane Regional Waste-to-Energy Facility, owned by the Spokane System,1 completed this process and was able to change its residue ash designation from “Special Incinerator Ash” to “Solid Waste.” This designation will allow the material to be disposed of with other solid wastes and opens up opportunities for the Spokane System to pursue reuse opportunities. It is our expectation that, since Spokane has already completed this step and DOE has approved this change, a re-designation of the County’s residue ash could be made easier. After startup of the Conversion Facility in King County, DOE’s concurrence of the residue ash as a Solid Waste would require several years of facility operation, residue sampling and testing. For illustrative purposes, we have included a more detailed discussion of Spokane’s residue ash management in Appendix B.
Conclusions The disposal of residue ash in the state of Washington is highly and carefully regulated by DOE, which has established a series of applicable designation tests which must be followed. Because the Spokane Conversion Facility has been able to produce a residue ash which meets or exceeds all permit requirements for disposal in a monofill at the Roosevelt Regional Landfill, it is reasonable to expect that the residue ash from a King County-owned Conversion Facility could do so as well.
1The Spokane Regional Solid Waste System (“Spokane System”) includes Spokane County, the City of Spokane, 12 other cities and towns, and Fairchild Air Force Base..
RESIDUE ASH MANAGEMENT
001640 | 11-01056-10004 | 6/8/2007 R. W. Beck 9-9
In March 2007, the Spokane Conversion Facility also received approval from DOE to modify the designation of its residue ash from “Special Incinerator Ash” to “Solid Waste.” This re-designation increases the potential to either find some possible beneficial use for the residue ash or an alternative means of disposal. It is likely that a King County-owned Conversion Facility could receive the same designation.
There are certain measures the County could take to further enhance the possibility of achieving a “Solid Waste” designation for the residue ash from a Conversion Facility. These measures include: 1) continuing to provide alternative means of disposal for problematic materials such as construction and demolition debris and household hazardous wastes; further 2) encouraging household hazardous waste collection programs; and 3) continuing its public education program highlighting the benefits of recycling and the problems associated with introducing hazardous material to the waste stream.
In our opinion, the current regulatory framework in the state of Washington and the efforts of the Spokane System provide several viable options for the County to consider regarding the disposal of residue ash. While some regulatory changes would be required to make other beneficial uses viable, we believe that DOE would be open to the development of these avenues if testing supported their safety.

Section 10 ESTIMATE OF NET EMISSIONS

001640 | 11-01056-10004 | 6/8/2007
Section 10 ESTIMATE OF NET EMISSIONS
This section of the report presents R. W. Beck’s estimates of net emissions for the Conversion Technology and Waste Export Disposal Options. For the Conversion Technology Disposal Option, we estimated emissions for each of the three Conversion Technologies evaluated in this report: 1) mass burn, 2) RDF, and 3) advanced thermal recycling. For the Waste Export Disposal Option, we developed estimates for two landfill gas technologies: 1) active gas collection with landfill gas flaring, and 2) active gas collection with energy generation.
This section also presents assumptions, emission calculation methods, and estimates of associated air quality impacts. Emissions estimates were developed based on the technology-specific activities that are described in this section for the disposal of County waste during the study period from 2016 through 2036.
The emission inventories include: 1) criteria pollutants, 2) toxic pollutants of importance in waste management, and 3) greenhouse gases. The criteria pollutants in the emission inventories include oxides of nitrogen (NOX), carbon monoxide (CO), sulfur dioxide (SO2), particulate matter with an aerodynamic diameter less than 10 micrometers (PM10), and lead. The toxic pollutants in the emission inventories include hydrochloric acid (HCl), mercury, and total chlorinated dibenzo-p-dioxins/dibenzofurans. The greenhouse gases include carbon dioxide (CO2), methane (CH4), and nitrous oxide (N2O).
With the exception of greenhouse gases, emission calculations for Conversion Technologies combusting waste are generally straightforward. Waste is burned and the emissions from the combustion of that waste are introduced to the air pollution control equipment in each facility. The emission inventories for the three Conversion Technologies include emissions for the study period 2016 to 2036. Estimating emissions from landfills is a bit more complicated. Emissions are constantly generated as the waste decomposes, and the waste deposited in a landfill can potentially take hundreds of years to decompose, although the emissions will be more intense soon after the waste is deposited in the landfill compared to later years. Emission calculations for landfills must therefore be completed for many years into the future, well beyond the study period of this report. In the emission inventories for the Waste Export Disposal Option we have included emissions from 2016 to 2200 in an attempt to include in the estimate all future emissions from waste that would be deposited in a landfill during the study period of 2016 through 2036.
Emission rates were calculated using published emission factors from the U.S. Environmental Protection Agency’s (EPA’s) AP-42 reference document and from the International Panel on Climate Change’s “Guidelines for National Greenhouse Gas

Section 10
10-2 R. W. Beck 001640 | 11-01056-10004 | 6/8/2007
Inventories.” Available source-specific emission information was also used to calculate the emission inventories.
Greenhouse gas emissions can be divided into two categories: 1) sustainably harvested biogenic sources (“biogenic”) and 2) fossil emissions. Biogenic greenhouse gas emissions are from biomass materials such as food, wood, and paper. Fossil greenhouse gas emissions are from materials with fossil origin (i.e., petroleum, coal, peat) including plastic and some textiles. The emission inventories included in this report are presented as total greenhouse gas emissions so that the technologies can be evaluated against each other.
Four of the technologies being considered in this report involve converting the waste to energy. All three Conversion Technologies use the heat from the combustion of waste to make steam for electricity generation. We have assumed that energy generation at a landfill will use internal combustion engine-driven generators to produce electricity from captured landfill gas. This is the technology employed at Roosevelt Regional Landfill in eastern Washington. The electricity generated from the County’s waste will offset some portion of electricity generated by other electrical utilities in Washington State and also avoid the greenhouse gas emissions that would be released by the electrical utilities generating the electricity. We have had discussions with representatives of Puget Sound Energy regarding the potential for the construction of a Conversion Facility. Puget Sound Energy advised that although waste-to-energy is not currently considered a renewable energy in the state of Washington, the utility could use the power produced by a Conversion Facility. Puget Sound Energy anticipates that the energy produced from a Conversion Facility would replace energy that would otherwise be generated by the combustion of natural gas. The Puget Sound Clean Air Agency does not currently have any guidance for calculating greenhouse gas emissions or avoided emissions from energy generation; however, the Energy Information Administration, an office of the U.S. Department of Energy, provides guidance on calculating the avoided greenhouse gas emissions for each state.
The criteria pollutant, toxic pollutant, and greenhouse gas emission inventories for the three Conversion Technologies and the two landfill gas technologies are presented in the following subsections, along with assumptions, calculations, and estimates of air quality impacts.
Methodology The following subsections present the assumptions, emission factors, and emission calculation methods that were used to estimate emissions of criteria pollutants, toxic pollutants, and greenhouse gases.
Criteria Pollutant and Toxic Pollutant Emission Calculations We calculated criteria and toxic pollutant emission rates for each of the technologies based on the use of emission factors from the EPA’s AP-42 reference document and emission source test data for similar waste disposal methods.

ESTIMATE OF NET EMISSIONS
001640 | 11-01056-10004 | 6/8/2007 R. W. Beck 10-3
Emission Calculations for the Waste Export Disposal Option To calculate the emissions for the two landfill gas technologies, we began by calculating the volume of landfill gas assumed to be generated by waste deposited in the landfill. Landfill gas is a product of waste material being decomposed by different bacteria in a landfill. For the purpose of estimating the emissions from solid waste generated by the County, we have assumed that County’s waste will be deposited into its own cells at a landfill, so we have only calculated the emissions associated with the County’s waste. In reality, a landfill would not be operated in this fashion. In addition, we have assumed that by volume, the landfill gas generated will be composed of 55 percent methane and 45 percent carbon dioxide with small amounts of nonmethane organic compounds (NMOC) and other inorganic compounds.
The volume of landfill gas generated at a landfill is calculated based on a first-order decomposition rate equation used in the EPA’s Landfill Gas Emissions Model (LandGEM) Version 3.02. The first-order decomposition rate equation (see Equation 1) calculates the methane emissions based on the amount of waste landfilled each year, the methane generation rate constant, and the potential methane generation capacity of the waste. Most of the private regional landfills available to the County are located in arid locations; LandGEM recommends a methane generation rate of 0.02 year–1 and a potential methane generation capacity of 100 cubic meters of methane per megagram of waste should be used for inventorying landfill emissions in arid areas.
Equation 1
ikti
n
ioCH eMkLQ −
=∑=
14
where
QCH4 = annual methane generation in the year of the calculation (m3/year),
i = 1-year time increment,
n = (year of the calculation) – (initial year of waste acceptance),
k = methane generation rate (year–1),
Lo = potential methane generation capacity (m3/Mg),
Mi = mass of waste accepted in the ith year (Mg),
ti = age of the section of waste mass Mi accepted in the ith year (years).
Landfill gas generation was calculated out to the year 2200 for the County waste deposited in the landfill during the study period of 2016 to 2036. The waste deposited in the landfill during the study period will continue to degrade and produce small volumes of landfill gas for many years past 2200. For this report, the emission

Section 10
10-4 R. W. Beck 001640 | 11-01056-10004 | 6/8/2007
inventories for the two landfill gas technologies are calculated based on the volume of landfill gas generated between 2016 and 2200.
We developed estimates of concentrations of mercury, reduced sulfur, chlorinated compounds, NMOC, and volatile organic compounds (VOC) in the landfill gas using the EPA’s AP-42 default compound concentrations for landfill gas (see Table 10-1). We assume 80 percent of the landfill gas generated is captured using landfill gas collection systems at both landfills, and fugitive landfill gas emissions result in 20 percent of the total landfill gas generated at both landfills. The 80-percent capture assumption is typical of actual performance at properly designed and operated landfills. The gas capture percentage at a landfill can reasonably be expected to increase over time as more of the surface area is under final cover. As an example, the estimated gas capture rate for the Roosevelt Regional Landfill in 2005 was 78.9 percent, based on measured gas capture rates and gas production estimates. Because this capture assumption is important in the overall assessment of the landfill gas technologies, we have performed a sensitivity analysis where the gas capture rate was alternatively assumed to be 70 percent and 90 percent.
Table 10-1 Pollutant Concentrations in Landfill Gas
Pollutant Molecular
Weight Concentration
(ppmv) (1)
Mercury 200.61 2.92E-04 Chlorinated Compounds 35.453 42 Reduced Sulfur Compounds 32.064 46.9 NMOC as hexane 86.18 2,420 VOC as hexane 86.18 2,057 ppmv = parts per million by volume (1) AP-42 Table 2.4-1, Default Concentrations for LFG Constituents
To calculate emissions for the two landfill gas technologies, R. W. Beck obtained data from two private regional landfills: Columbia Ridge Landfill in eastern Oregon and Roosevelt Regional Landfill in eastern Washington. The Columbia Ridge landfill combusts the captured landfill gas in a flare. The Roosevelt landfill has a contract with Klickitat Public Utility District (PUD) to combust captured landfill gas in internal combustion engines and generate electricity. Emission source test data for the Roosevelt landfill flare and emission source test data for the Klickitat PUD internal combustion engines were used to calculate NOX, CO, and PM10 emission rates for the two landfill gas technologies. SO2, VOC, HCl, and mercury emission rates for the two landfill gas technologies were calculated using a mass balance approach and the assumed composition of the landfill gas with typical pollutant control efficiencies for flares and internal combustion engines. Typical pollutant control efficiencies for combusting landfill gas in flares and internal combustion engines are presented in

ESTIMATE OF NET EMISSIONS
001640 | 11-01056-10004 | 6/8/2007 R. W. Beck 10-5
Table 10-2. Flare and internal combustion engine secondary emission factors are presented in Table 10-3.
Table 10-2 Typical Control Efficiencies for Landfill Gas Combustion
Typical Control Efficiency (%)
Pollutant Flare Internal Combustion
Engine
NMOC 99.2 97.2 Halogenated Species 98 93 Non-Halogenated Species 99.7 86.1 Mercury 0 0 Source: AP-42 Table 2.4-3, Control Efficiencies for LFG Constituents
Table 10-3 Secondary Pollutant Emission Factors
for Landfill Gas Combustion
Emission Factors (lb/106 dscf CH4)
Pollutant Flare (1) Internal Combustion
Engine (2)
NOX 20.2 130 CO 4.5 374 PM10 25.8 19 CH4 (3) -- 2.1 N2O (3) -- 0.2 (1) Derived from Klickitat PUD engine generator system at Roosevelt landfill (June 1999). (2) Derived from flare source test data at Roosevelt landfill (February 2003). (3) 2006 International Panel in Climate Change’s Guidelines for National Greenhouse Gas
Inventories, Volume 2. Energy, Table 2.2, corrected to 500 Btu per scf landfill gas.
Emission Calculations for the Conversion Technology Disposal Option We developed estimates of emissions for the mass burn and RDF Conversion Technologies using emission factors from AP-42 Chapter 2.1, “Refuse Combustion.” Note that AP-42 emission factors are average values from source tests representing a sample of mass burn and RDF facilities located across the United States; each of these facilities has a different waste stream composition. Where AP-42 emission factors do
Section 10
10-6 R. W. Beck 001640 | 11-01056-10004 | 6/8/2007
not represent a large sample of different facilities, the EPA gives those emission factors a rating of “Below Average.” Any AP-42 emission factor with a Below Average rating has been noted as such in Table 10-4.
From an air emissions standpoint, an advanced thermal recycling Conversion Facility can be considered to be a commercial mass burn facility with distinctive air pollution control devices compared to typical mass burn facilities currently in operation in the United States, most of which were placed into commercial operation 12 to 20 years ago. Waste Recovery Seattle International provided emission factors for the advanced thermal recycling Conversion Technology based on source test data for an advanced thermal recycling facility located in Hamburg, Germany. A typical advanced thermal recycling Conversion Technology includes a selective non-catalytic reduction (SNCR) system to control NOX emissions, an active carbon injection system followed by a baghouse to control particulate matter and mercury emissions, a two-stage HCl scrubber to control acid gas emissions, a single-stage scrubber with lime injection to control SO2 emissions, and a second active carbon injection system followed by a baghouse to further control particulate matter. Table 10-4 presents the mass burn, RDF, and advanced thermal recycling emission factors used in calculating the emission inventories for each Conversion Technology.
Air pollution control equipment at a typical mass burn or RDF facility currently in operation in the United States has not been as extensive as the proposed air pollution control equipment at an advanced thermal recycling facility. A typical mass burn or RDF facility includes an SNCR system, a spray dryer absorber for acid gas control, active carbon injection for mercury control, and a fabric filter baghouse. However, a mass burn or RDF facility could be designed to include the same air pollution control equipment used at an advanced thermal recycling facility which, in effect, would make it an advanced thermal recycling Conversion Facility. During the last 20 years, existing Conversion Facilities have been required to either initially install or undertake a retrofit of air pollution control equipment representative of the “maximum available control technology” (MACT). The MACT standards are set by the EPA based on the demonstrated performance of specific equipment in the United States. We are not aware of any technical reason that the construction of new mass burn and RDF facilities that included the same air pollution control equipment as advanced thermal recycling could not result in similar levels of emissions. For this reason, we would expect a newly constructed mass burn or RDF Conversion Facility to experience better emission factors than those shown in Table 10-4.

ESTIMATE OF NET EMISSIONS
001640 | 11-01056-10004 | 6/8/2007 R. W. Beck 10-7
Table 10-4 Emission Factors for Mass Burn, RDF, and
Advanced Thermal Recycling Conversion Technologies
Emission Factors
Criteria Pollutants Mass Burn (1)
(lb/ton) RDF (2) (lb/ton)
Advanced Thermal
Recycling (3) (lb/ton)
NOX (4) 1.96E+00 2.76E+00 4.91E-01 CO 4.63E-01 1.92E+00 1.27E-01 SO2 (5) 5.54E-01 4.41E-01 2.59E-02 PM10 6.20E-02 1.33E-01 6.06E-03 Toxic Air Pollutants CDD/CDF (6) 6.61E-08 2.44E-08 2.88E-12 Mercury (5) 2.20E-03 2.92E-04 1.88E-06 Lead (5) 2.61E-04 1.04E-03 4.50E-06 HCl 2.11E-01 5.28E-02 3.90E-03 CDD/CDF = Total chlorinated dibenzo-p-dioxins/dibenzofurans (1) AP-42 Tables 2.1-2 and 2.1-4, Emission Factors for Mass Burn Waterwall Combustors, Emission factors
for spray dryers with fabric filters. (2) AP-42 Table 2.1-8, Emission Factors for Refuse-Derived Fuel-Fired Combustors, Emission factors for
spray dryers with fabric filters (3) Provided by Waste Recovery Seattle International from 2005 source test data at MVR facility in
Hamburg, Germany. (4) Assume 45% NOX emission reduction for SNCR system at mass burn and RDF facilities. (5) RDF emission factors were given a “below average” rating. (6) Advanced thermal recycling CDD/CDF emission factor is in Toxic Equivalents.
Greenhouse Gas Emission Calculations We calculated greenhouse gas emission rates for each waste disposal option. Greenhouse gas emissions include provision for the transportation of solid waste and the greenhouse gas emissions generated by landfilling or combusting the waste. Transportation emissions are based on round-trip travel for each transportation mode and include:
Diesel trucks transporting waste from the King County transfer stations to either the intermodal facility for the Waste Export Disposal Options or the Conversion Technology facility (assume 27 tons of compacted waste per truck round trip);
Diesel trucks transporting non-processible waste and residual ash from the Conversion Technology facility to an intermodal facility (assume 27 tons per truck round trip); and
Section 10
10-8 R. W. Beck 001640 | 11-01056-10004 | 6/8/2007
Diesel locomotives transporting the waste from the intermodal facility to a landfill or diesel locomotives transporting the non-processible waste and the residual ash from the intermodal facility to a landfill.
We assumed equal deliveries of the projected County waste between the existing County transfer stations and the intermodal facility. We have also assumed the Conversion Technology facility would be located in South King County. The EPA’s Mobile 6 model calculated a diesel truck CO2 emission factor of 3.13 pounds CO2 per vehicle mile traveled. Greenhouse gas emission calculations for the locomotives are based on emission calculations shown in the 2006 King County Waste Export System Plan. The locomotives have an assumed fuel efficiency of 1,550 ton-miles per gallon of diesel fuel. A locomotive CO2 emission factor of 22.23 pounds CO2 per gallon of diesel fuel is based on the diesel fuel containing 6.12 pounds of carbon per gallon and 99 percent of the carbon being oxidized when the diesel fuel is burned.
Greenhouse gas emission inventories for the combustion and landfilling of waste in the five evaluated technologies are more complicated than the criteria pollutant and toxic pollutant emission inventories because they must consider two additional factors beyond the simple calculation of the CO2, CH4, or N2O emission rates. These factors are:
1. Some of the greenhouse gas emissions evolve from the decomposition of sustainably harvested biogenic materials and these emissions would have evolved over time even if the materials had been allowed to decompose naturally.
2. Landfilling, in particular, stores a certain quantity of biogenic carbon permanently, thus removing it from the natural cycle of decomposition to greenhouse gas and subsequent re-incorporation into biological material.
Accordingly, greenhouse gas emissions were not estimated using the same methods as the criteria and toxic pollutants, but rather were estimated in consideration of the specific waste profile for King County. A calculation spreadsheet was developed specifically for this project that simulates the EPA’s Waste Reduction Model (WARM), which allows consideration of the specific details of the King County waste disposal alternatives.
For the landfill gas technology that involves flaring, estimated greenhouse gas emissions include provisions for assumed CO2 emissions from captured landfill gas combustion in the flare and fugitive CO2 and CH4 emissions from landfill gas not collected by the landfill. However since virtually all the CO2 is of biogenic origin, the CO2 is not counted in the emission inventory. The CH4 is counted in the emission inventory, because even though it is of biogenic origin, it would not have evolved from normal aerobic decomposition in a natural environment, since methane is the product of an anaerobic process rather than an aerobic process.
For the landfill gas technology that involves energy generation, estimated greenhouse gas emissions include CO2, CH4, and N2O emissions from captured landfill gas combustion in internal combustion engines and the fugitive CO2 and CH4 emissions from landfill gas not collected by the landfill, although the CO2 is not counted for the

ESTIMATE OF NET EMISSIONS
001640 | 11-01056-10004 | 6/8/2007 R. W. Beck 10-9
same reasons as described above. The internal combustion engines will still produce some CH4 and N2O emissions (see Table 10-3).
For the purposes of this report, the greenhouse gas emissions from the three Conversion Technologies were considered together, even though there are differences between the three technologies due to different degrees of recycling. The three Conversion Technologies were combined into a single analysis for two reasons. First, the analysis conducted here was based on the EPA WARM model algorithm, which does not distinguish between different methods of waste combustion to generate energy. We believe the advantages that the WARM model offers, with its ability to adapt to the specific King County waste profile outweigh whatever inflexibility the model has in adapting to the differences in the combustion technologies. Second, since the major differences between the three Conversion Technologies for greenhouse gases will result from different degrees of recycling, we believe the three technologies eventually become very similar through the continued implementation of King County’s recycling program. The main purpose of the WARM model is to allow solid waste planners to evaluate the differences between waste-to-energy and landfilling with various recycling and recovery programs. The King County waste profile is used in the WARM model and the model computes greenhouse gas emissions for the Combustion Technologies, taking into consideration that portion of the waste which is biogenic.
The major adaptation to the WARM model used in this analysis is to allow specific information to be provided concerning avoided emissions. The standard version of the WARM model provided by the EPA provides unalterable factors for estimating the quantity of greenhouse gases from other sources of electrical generation that are offset as a result of the generation of electricity at the Conversion Facility. These factors are based on national averages for electrical generation and include a large percentage of coal combustion. Since combustion of coal produces the greatest amount of greenhouse gas per unit of electricity delivered, these factors are unrepresentative of Washington State, where electricity mostly comes from other sources. Based on our discussions with representatives of Puget Sound Energy, we believe that any new sources that might be constructed to meet future Washington State electrical demand would not be based on coal combustion. In this analysis, we considered two avoided emission scenarios. The first assumes the electricity avoided at a power plant as the result of the operation of the Conversion Facility follows the profile of how electricity is actually generated at present in Washington State. The second scenario assumes that 100 percent of the electricity that is offset would come from natural gas combustion in a modern, combined-cycle electrical generation facility.
The greenhouse gas emission factors for each Conversion Technology are presented in Table 10-5.
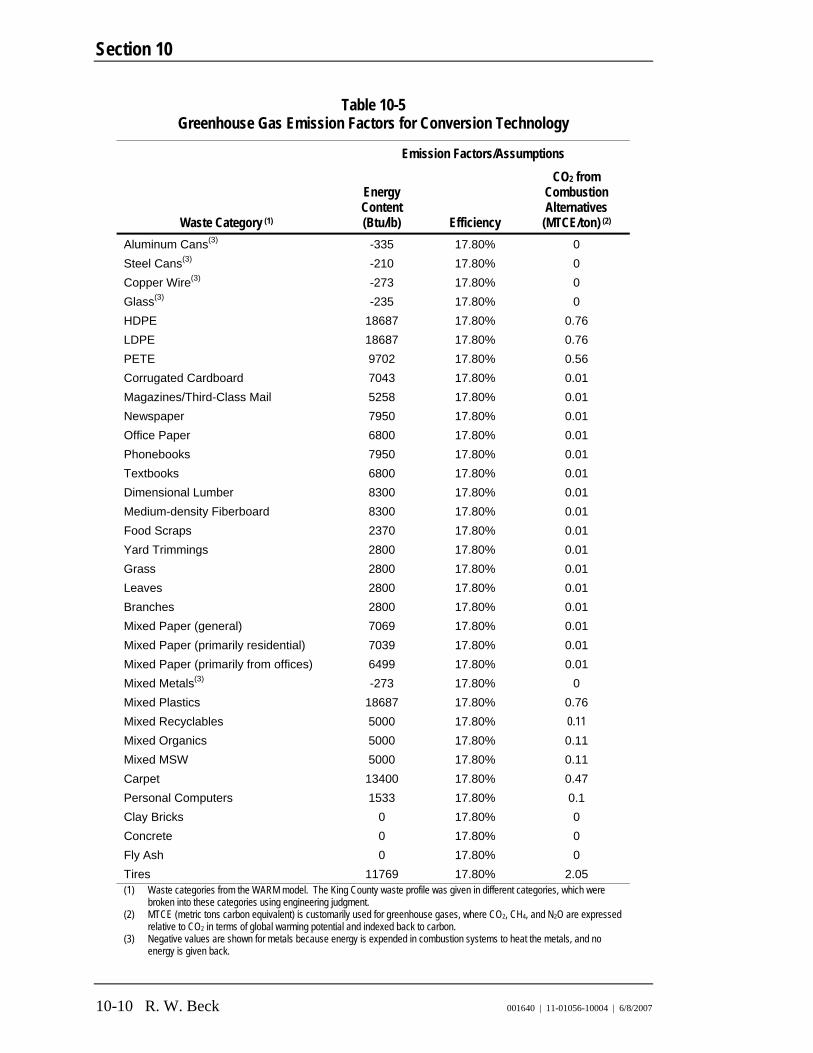
Section 10
10-10 R. W. Beck 001640 | 11-01056-10004 | 6/8/2007
Table 10-5 Greenhouse Gas Emission Factors for Conversion Technology
Emission Factors/Assumptions
Waste Category (1)
Energy Content (Btu/lb) Efficiency
CO2 from Combustion Alternatives
(MTCE/ton) (2)
Aluminum Cans(3) -335 17.80% 0 Steel Cans(3) -210 17.80% 0 Copper Wire(3) -273 17.80% 0 Glass(3) -235 17.80% 0 HDPE 18687 17.80% 0.76 LDPE 18687 17.80% 0.76 PETE 9702 17.80% 0.56 Corrugated Cardboard 7043 17.80% 0.01 Magazines/Third-Class Mail 5258 17.80% 0.01 Newspaper 7950 17.80% 0.01 Office Paper 6800 17.80% 0.01 Phonebooks 7950 17.80% 0.01 Textbooks 6800 17.80% 0.01 Dimensional Lumber 8300 17.80% 0.01 Medium-density Fiberboard 8300 17.80% 0.01 Food Scraps 2370 17.80% 0.01 Yard Trimmings 2800 17.80% 0.01 Grass 2800 17.80% 0.01 Leaves 2800 17.80% 0.01 Branches 2800 17.80% 0.01 Mixed Paper (general) 7069 17.80% 0.01 Mixed Paper (primarily residential) 7039 17.80% 0.01 Mixed Paper (primarily from offices) 6499 17.80% 0.01 Mixed Metals(3) -273 17.80% 0 Mixed Plastics 18687 17.80% 0.76 Mixed Recyclables 5000 17.80% 0.11 Mixed Organics 5000 17.80% 0.11 Mixed MSW 5000 17.80% 0.11 Carpet 13400 17.80% 0.47 Personal Computers 1533 17.80% 0.1 Clay Bricks 0 17.80% 0 Concrete 0 17.80% 0 Fly Ash 0 17.80% 0 Tires 11769 17.80% 2.05 (1) Waste categories from the WARM model. The King County waste profile was given in different categories, which were
broken into these categories using engineering judgment. (2) MTCE (metric tons carbon equivalent) is customarily used for greenhouse gases, where CO2, CH4, and N2O are expressed
relative to CO2 in terms of global warming potential and indexed back to carbon. (3) Negative values are shown for metals because energy is expended in combustion systems to heat the metals, and no
energy is given back.

ESTIMATE OF NET EMISSIONS
001640 | 11-01056-10004 | 6/8/2007 R. W. Beck 10-11
The WARM model analysis includes an estimate of the avoided greenhouse gas emissions for the amount of electricity generated from landfill gas and from the Conversion Technologies. The landfill gas-flaring technology does not generate electricity and, as a result, no avoided greenhouse gas emissions are calculated for that technology. The Energy Information Administration offers guidance for calculating avoided emissions and provides avoided greenhouse gas emission factors for each state. The Energy Information Administration has calculated, for each state, average CO2, CH4, and N2O emissions per kilowatt-hour of energy produced. Table 10-6 presents the avoided greenhouse gas emission factors for Washington based on the current electrical generation methods used in the state. Table 10-6 also shows emission factors for electrical generation assumed to result solely from natural gas combustion in a modern, combined-cycle electrical generation facility. The avoided greenhouse gas emissions are then subtracted from the total greenhouse gas emissions released by each evaluated technology. Note that the emission factors presented in Table 10-6 are based on actual generation methods used in Washington State, rather than an assumption that all of the avoided electrical generation results from fossil fuel combustion.
Table 10-6 Avoided Greenhouse Gas Emission Factors
Generation Scenario Emission Factors (1)
(MTCE/kWh)
Washington Current Electrical Generation(2) 30.4 Combined Cycle Natural Gas Plant(3) 125 (1) MTCE (metric tons carbon equivalent) is customarily used for greenhouse gases, where CO2,
CH4, and N2O are expressed relative to CO2 in terms of global warming potential and indexed back to carbon.
(2) Washington State actual emissions are based on Department of Ecology factor of 0.123 ton CO2 per kWh.
(3) Natural gas combustion emissions are based on 0.12 lb/MMscf (EPA – AP-42), 1,012 MMBtu/MMscf from WARM model, and assumption that 40% of input heat is turned into electricity.

Section 10
10-12 R. W. Beck 001640 | 11-01056-10004 | 6/8/2007
Emission Calculations This comparison analysis focuses on three overall categories of pollutants: criteria pollutants, toxic pollutants, and greenhouse gas pollutants. Each class of pollutant is treated differently depending upon on its type, its health/environmental effects, and its regulation.
Criteria Pollutants The Clean Air Act and its amendments were passed by Congress to provide a program to improve the quality of the air in the United States. The Clean Air Act of 1970 requires the EPA to set National Ambient Air Quality Standards (NAAQS) for the six so-called criteria pollutants: NOX, CO, SO2, particulate matter, ozone, and lead.
Particulate matter includes anything that exists in the atmosphere as particles. This can include dust, dirt, soot, smoke, and liquid droplets, including anything emitted as vapors but that condenses in the atmosphere. Particulate matter is usually divided into different classes based on size, ranging from total suspended particulate (TSP) to PM10 (particles less than 10 micrometers in mass-mean diameter) to PM2.5 (particles less than 2.5 micrometers). Currently, the EPA has issued NAAQS for PM10 and PM2.5.
Most ozone is not emitted directly; it is formed through reaction of NOX and VOC in the atmosphere. As such, ozone emissions are controlled through limitation of the VOC precursor.
These pollutants are called “criteria” air pollutants because they are regulated by developing human health-based and/or environmentally-based criteria (science-based guidelines) for setting permissible levels (i.e., NAAQS). The set of standards based on human health is called primary standards; another set of standards intended to prevent environmental and property damage is called secondary standards.
The NAAQS are an effort by the EPA to place an upper limit on the amount of pollutants in the air that will cause only limited health and environmental/property damage impacts. Currently, many ambient monitors are located throughout the United States that measure concentrations of the various criteria pollutants. These data are then compared with the NAAQS to determine the status of the ambient air in each defined area. In an area where the pollutant concentration is below the NAAQS threshold, it is called an attainment area (i.e., it has attained the threshold). Those areas that do not meet the NAAQS are called nonattainment areas. Washington State has had some nonattainment counties in the past, generally for PM10, ozone, and CO; currently, however, all of Washington State is in attainment.
To prevent regions where the air is in attainment from getting worse, the EPA published the Prevention of Significant Deterioration (PSD) program for projects at facilities located in attainment areas. This program focuses not only on the NAAQS but also limits the incremental changes in air quality. The applicability of this permitting program will have to be evaluated by the appropriate permitting agency if a new facility is proposed or a modification to an existing facility is necessary.
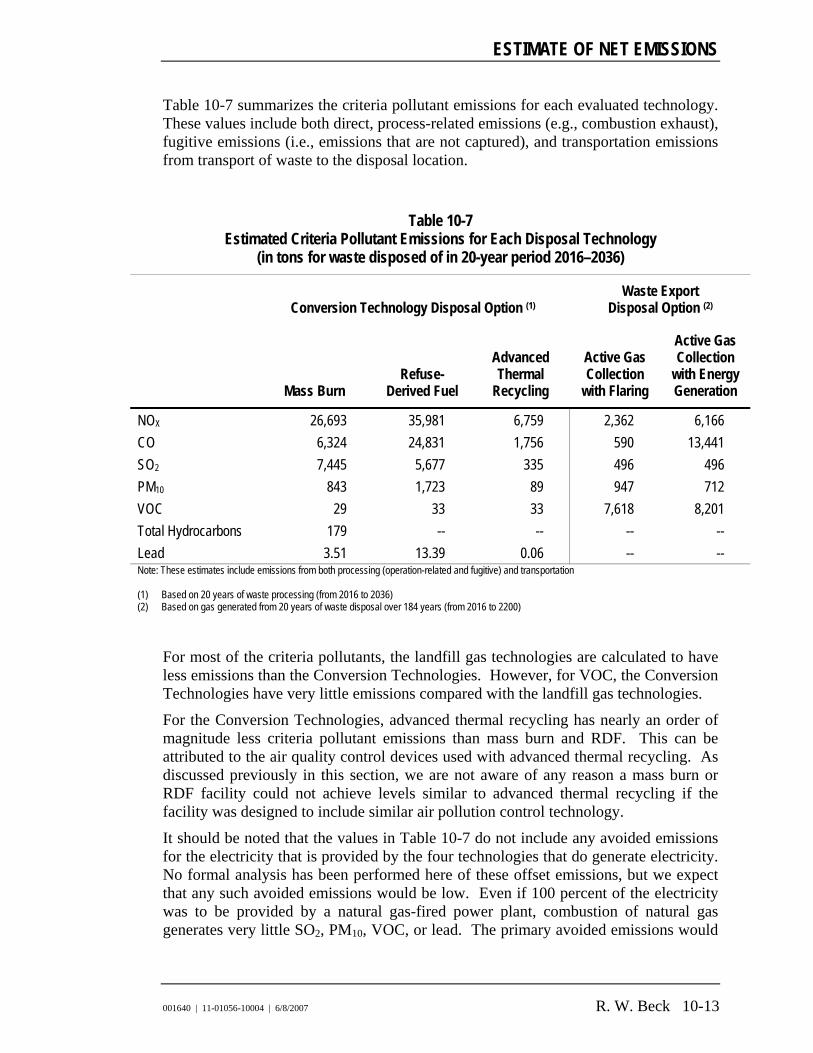
ESTIMATE OF NET EMISSIONS
001640 | 11-01056-10004 | 6/8/2007 R. W. Beck 10-13
Table 10-7 summarizes the criteria pollutant emissions for each evaluated technology. These values include both direct, process-related emissions (e.g., combustion exhaust), fugitive emissions (i.e., emissions that are not captured), and transportation emissions from transport of waste to the disposal location.
Table 10-7 Estimated Criteria Pollutant Emissions for Each Disposal Technology
(in tons for waste disposed of in 20-year period 2016–2036)
Conversion Technology Disposal Option (1) Waste Export
Disposal Option (2)
Mass Burn Refuse-
Derived Fuel
Advanced Thermal
Recycling
Active Gas Collection
with Flaring
Active Gas Collection
with Energy Generation
NOX 26,693 35,981 6,759 2,362 6,166 CO 6,324 24,831 1,756 590 13,441 SO2 7,445 5,677 335 496 496 PM10 843 1,723 89 947 712 VOC 29 33 33 7,618 8,201 Total Hydrocarbons 179 -- -- -- -- Lead 3.51 13.39 0.06 -- -- Note: These estimates include emissions from both processing (operation-related and fugitive) and transportation (1) Based on 20 years of waste processing (from 2016 to 2036) (2) Based on gas generated from 20 years of waste disposal over 184 years (from 2016 to 2200)
For most of the criteria pollutants, the landfill gas technologies are calculated to have less emissions than the Conversion Technologies. However, for VOC, the Conversion Technologies have very little emissions compared with the landfill gas technologies.
For the Conversion Technologies, advanced thermal recycling has nearly an order of magnitude less criteria pollutant emissions than mass burn and RDF. This can be attributed to the air quality control devices used with advanced thermal recycling. As discussed previously in this section, we are not aware of any reason a mass burn or RDF facility could not achieve levels similar to advanced thermal recycling if the facility was designed to include similar air pollution control technology.
It should be noted that the values in Table 10-7 do not include any avoided emissions for the electricity that is provided by the four technologies that do generate electricity. No formal analysis has been performed here of these offset emissions, but we expect that any such avoided emissions would be low. Even if 100 percent of the electricity was to be provided by a natural gas-fired power plant, combustion of natural gas generates very little SO2, PM10, VOC, or lead. The primary avoided emissions would
Section 10
10-14 R. W. Beck 001640 | 11-01056-10004 | 6/8/2007
be NOX, and even the NOX emissions from a modern natural gas electrical generation facility of 75 MW would be 50 tons per year or less.
Toxic Pollutants The 1990 amendments significantly modified the Clean Air Act. These amendments contained major new provisions for control of toxic air contaminants. The revised Clean Air Act requires regulation of 189 toxic chemicals, the so-called hazardous air pollutant (HAP) list. Generally, HAP chemicals are those that are not explicitly considered criteria pollutants. However, because most hazardous air pollutants are organic, they are included within the VOC category, as a precursor to ozone. The EPA may add chemicals to or delete chemicals from this list of 189. With the delisting of caprolactam and methyl ethyl ketone (MEK), there are currently 187 chemicals on the HAP list.
The 1990 Clean Air Act Amendments also mandated that the EPA set standards for all major sources of air toxics. These standards require major sources of toxic air pollution to use “maximum achievable control technology.” This is intended to ensure that both new and existing major sources of toxic air pollution will use the kind of technology which provides maximum control of toxics on an ongoing basis. An initial list of toxic source categories (i.e., industry types) was published in 1992 and includes municipal solid waste landfills.
State agencies can have the latitude to create their own programs to regulate toxic pollutants. At a minimum, all toxics on the federal HAP list must be included, but the state agencies can include any additional toxics they feel it necessary to regulate. Examples of toxic air pollutants include benzene, which is found in gasoline; perchloroethylene, which is emitted from some dry cleaning facilities; and methylene chloride, which is used as a solvent and paint stripper by a number of industries.
Due to the large list of toxics, evaluating emissions of each toxic can be a major task. As such, the toxics considered in this analysis are those that are considered representative of the range of toxics or that are of specific interest emitted by that source type. Please note that this review was limited to a few key pollutants. It is possible that others could be important at some future date. Table 10-8 summarizes the toxic pollutant emissions for each of the evaluated technologies.

ESTIMATE OF NET EMISSIONS
001640 | 11-01056-10004 | 6/8/2007 R. W. Beck 10-15
Table 10-8 Estimated Toxic Pollutant Emissions for Each Disposal Technology
(in tons for waste disposed of in 20-year period 2016–2036)
Conversion Technology Options (1) Waste Export
Disposal Option (2)
Mass Burn Refuse-Derived
Fuel Advanced Thermal
Recycling
Active Gas Collection
with Flaring
Active Gas Collection
with Energy
Generation
HCl 2,835 680 50 5 18 CDD/CDF (3) 0.0009 0.0003 -- -- -- PCDD/PCDF TEF (4) 5.24E-06 -- 3.71E-08 -- -- Mercury, total 29.6 3.8 0.02 0.012 0.012 Note: This analysis shows but a few representative toxics out of the 187 toxics on the EPA’s HAP list. (1) Based on 20 years of waste processing (from 2016 to 2036) (2) Based on gas generated over 184 years as a result of 20 years of waste disposal (from 2016 to 2200) (3) CDD/CDF = total tetra- through octa- chlorinated dibenzo-p-dioxin/chlorinated dibenzofurans, 2,3,7,8-tetrachlorodibenzo-p-dioxin, and
dibenzofurans. All are listed as HAPs in 1990 Clean Air Act. (4) Polychlorinated dibenzo-p-dioxin (PCDD) and polychlorinated dibenzofuran (PCDF) in Toxic Equivalency Factor (TEF)
The information in Table 10-8 indicates that the Conversion Technologies appear to have the potential for significantly greater HAP emissions than the landfill gas technologies. As discussed previously in this section, we believe that with the installation of similar air pollution control technology, the estimates for mass burn and RDF technologies could be similar to those of advanced thermal recycling. Note that in Table 10-7, the Conversion Technologies are shown to have very little VOC emissions compared to the landfill gas technologies. Because most toxics are organic, a high VOC emission rate is a potential indicator of high toxics. This is known to be the case for landfills, though this is not evident in the limited number of toxics shown in Table 10-8.
Greenhouse Gas Pollutants Gases that trap heat in the atmosphere are called greenhouse gases. Some greenhouse gases, such as carbon dioxide, occur naturally and are emitted to the atmosphere through natural processes and human activities. Other greenhouse gases, such as fluorinated gases, are created and emitted solely through human activities. The principal greenhouse gases that enter the atmosphere because of human activities are:
CO2: primarily emitted from fossil fuel combustion, solid waste, trees, and wood products.

Section 10
10-16 R. W. Beck 001640 | 11-01056-10004 | 6/8/2007
CH4: emitted during the production and transport of coal, natural gas, and oil. Methane emissions also result from livestock and other agricultural practices and from the decay of organic waste in municipal solid waste landfills.
N2O: emitted during agricultural and industrial activities, as well as during combustion of fossil fuels and solid waste.
Fluorinated Gases: hydrofluorocarbons, perfluorocarbons, and sulfur hexafluoride are synthetic, powerful greenhouse gases that are emitted from a variety of industrial processes.
In the case of municipal solid waste landfills and conversion of municipal solid waste, the primary greenhouse gases of concern are carbon dioxide, methane, and, to a lesser extent, nitrous oxide.
Each of these gases has a different capacity to trap heat (i.e., global warming potential), so comparing them directly is not sufficient. Factors have been developed based on the global warming potential of each greenhouse gas in order to allow direct comparisons between the greenhouse gases in terms of CO2 equivalents. Carbon dioxide has the least capacity, on a mass basis, of all the greenhouse gases to trap heat; it is assigned a global warming potential of 1. Methane has a higher global warming potential of 21 and nitrous oxide has a global warming potential of 310.1 CO2 equivalents are frequently converted to carbon equivalents, where only the weight of the carbon is counted.
For instance, for a project that is estimated to emit 150 tons of CO2, 90 tons of methane, and 8 tons of nitrous oxide, the global warming potential would be 4,520 tons CO2 equivalent (= 150 ton CO2 × 1 ton CO2 equiv/ton CO2 + 90 ton CH4 × 21 ton CO2 equiv/ton CH4 + 8 ton N2O × 310 CO2 equiv/ton N2O). This same quantity could be further reduced to carbon equivalents by multiplying by the ratio of the weights of carbon to CO2. So, in the above example, the global warming potential would be 1,233 (= 4,520 × 12/44) tons of carbon equivalents, or more commonly expressed in metric units as 1,118 metric tons of carbon equivalent (MTCE).
Criteria and toxic pollutants generally have relatively local impacts to human health and environmental and property damage. Greenhouse gases, on the other hand, act to trap heat in the atmosphere; hence, they have larger-scale environmental impacts.
Table 10-9 summarizes the greenhouse gas pollutant emissions for the evaluated technologies. As mentioned previously, the three Conversion Technologies have been combined because the EPA’s WARM model does not distinguish between different combustion alternatives. These values include both direct process-related emissions (e.g., combustion exhaust, landfill emissions) and fugitive emissions (i.e., emissions that are not captured), but do not include transportation emissions from transport of waste to the disposal location. These values also include the emissions that are avoided by replacing electricity produced in another fashion. These avoided emissions are subtracted from the emissions produced by the technologies to calculate the total net emissions associated with each technology. 1 Intergovernmental Panel on Climate Change, Climate Change 1995: The Science of Climate Change (Cambridge, UK: Cambridge University Press, 1996)

ESTIMATE OF NET EMISSIONS
001640 | 11-01056-10004 | 6/8/2007 R. W. Beck 10-17
Table 10-9 Estimated Greenhouse Gas Emissions for Disposal Options
Conversion Technology Disposal Option Waste Export Disposal Option
WARM Model Categories
Electric Utility Avoided CO2 (MTCE/t) (2)
Net (MTCE/t)
(MTCE)
Electric Utility Avoided CO2 (MTCE/t) (2)
Landfill Net Carbon
Storage (MTCE/t)
Net (MTCE/t)
Active Gas Collection with
Flaring (MTCE)
Active Gas Collection with
Energy Recovery (MTCE)
Aluminum Cans -0.0044 0.0044 727.30 0 0 0 - -
Steel Cans -0.0027 -0.4273 (89,656.35) 0 0 0 - -
Copper Wire -0.0036 0.0036 - 0 0 0 - -
Glass -0.0031 0.0031 2,612.74 0 0 0 - -
HDPE 0.2439 0.5161 73,599.13 0 0 0 - -
LDPE 0.2439 0.5161 - 0 0 0 - -
PET 0.1266 0.4334 77,999.64 0 0 0 - -
Corrugated Cardboard 0.0919 -0.0819 (106,854.94) 0.0396 0.2200 -0.1357 (177,014.60) (125,410.42)
Magazines/Third-Class Mail 0.0686 -0.0586 (5,259.84) 0.0160 0.2200 -0.1859 (16,681.09) (15,246.81)
Newspaper 0.1038 -0.0938 (71,568.91) 0.0140 0.3600 -0.3301 (251,951.11) (241,240.83)
Office Paper 0.0888 -0.0788 - 0.0689 0.0400 0.1067 - -
Phonebooks 0.1038 -0.0938 - 0.0140 0.3600 -0.3301 - -
Textbooks 0.0888 -0.0788 - 0.0689 0.0400 0.1067 - -
Dimensional Lumber 0.1083 -0.0983 (105,771.14) 0.0204 0.3100 -0.2665 (286,656.26) (264,696.75)
Medium-Density Fiberboard 0.1083 -0.0983 - 0.0204 0.3100 -0.2665 - -
Food Scraps 0.0309 -0.0209 (118,366.22) 0.0256 0.0200 0.0345 195,097.50 339,794.29
Yard Trimmings 0.0365 -0.0265 (1,375.76) 0.0152 0.1900 -0.1575 (8,163.87) (7,374.09)
Grass 0.0365 -0.0265 (18,825.61) 0.0086 0.0800 -0.0616 (43,699.81) (37,582.53)
Leaves 0.0365 -0.0265 (18,825.61) 0.0162 0.1900 -0.1556 (110,323.03) (98,863.32)
Branches 0.0365 -0.0265 (1,475.63) 0.0204 0.3100 -0.2665 (14,813.63) (13,678.83)
Mixed Paper (general) 0.0923 -0.0823 (363,380.16) 0.0374 0.2200 -0.1403 (619,505.31) (454,138.32)
Mixed Paper (primarily residential) 0.0919 -0.0819 - 0.0354 0.2300 -0.1545 - -
Mixed Paper (primarily from offices) 0.0848 -0.0748 - 0.0369 0.1800 -0.1015 - -
Mixed Metals -0.0036 0.0036 5,652.08 0 0 0 - -
Mixed Plastics 0.2439 0.5161 1,409,316.91 0 0 0 - -
Mixed Recyclables 0.0653 -0.0653 - 0 0 0 - -
Mixed Organics 0.0653 0.0447 154,994.76 0.0334 0.0200 0.0510 176,850.96 292,423.70
Mixed MSW 0.0653 0.0347 56,006.65 0.0334 0.1700 -0.0990 (159,558.13) (105,773.49)
Carpet 0.1749 0.2951 223,710.78 0 0 0 - -
Personal Computers 0.0200 -0.0400 (14,605.03) 0 0 0 - -
Clay Bricks 0.0000 0.0000 - 0 0 0 - -
Concrete 0.0000 0.0000 - 0 0 0 - -
Fly Ash 0.0000 0.0000 - 0 0 0 - -
Tires 0.1536 1.8664 333,174.15 0 0 0 - -
Totals 1,421,828.96 (1,316,418.38) (731,787.39) Note: Includes emissions from processing (operations-related and fugitive) but does not include transportation emissions. Also, emission inventories for both disposal options are based on 20 years of waste disposal (2016 to 2036). (1) Avoided emissions based on natural gas combustion in a combined-cycle plant with 40% efficiency. Lower values would be shown in both these columns if actual
Washington State electrical generation had been used. (2) Landfill emissions in this table are based on 80% capture of generated landfill gas.
Section 10
10-18 R. W. Beck 001640 | 11-01056-10004 | 6/8/2007
These greenhouse gas emissions totals illustrate the estimate of Total Net Emissions associated with the different technologies. The Waste Export Disposal Option places the waste in the ground where a certain amount will degrade into methane. Most of the methane is captured and burned to create CO2. The rest of the waste carbon is sequestered in the ground (carbon storage). In the case of the Conversion Technologies, all of the carbon from the waste is converted into CO2. As such, the Conversion Technologies generate significantly more CO2, and hence more carbon equivalents, than landfilling.
Greenhouse gases from transportation for each option have been treated separately because the WARM model does not allow the flexibility to treat multiple modes of transport. All of the options investigated here would include some combination of truck and rail movement to transport waste. However, transportation emissions add only approximately 28,000 MTCE for the Conversion Technology Disposal Option, and approximately 56,000 MTCE for the Waste Export Disposal Option. Thus, the impact of transportation emissions is minor and has no effect on the conclusions.
Because of the importance of greenhouse gas emissions, an additional sensitivity analysis was conducted to estimate the effects on the emission calculations if different assumptions had been made. One of the critical assumptions is the gas capture percentage for active gas collection at a landfill. The values in Table 10-9 reflect the assumption that 80 percent of the landfill gas will be captured and routed to some form of combustion. If the percentage assumed had instead been 90 percent, the greenhouse gas emissions for the Waste Export Disposal Option would be reduced significantly to around (2,304,400) MTCE for a landfill with energy recovery and (1,646,700) MTCE for a landfill without energy recovery (note that negative numbers are shown here in parenthesis). Conversely, if the gas capture percentage were to be reduced to 70 percent, greenhouse gas emissions for the Waste Export Disposal Option would be increased to (328,500) MTCE for a landfill with energy recovery and 183,100 MTCE for a landfill without energy recovery. While the effect of this assumption is very significant, it would not change the relative emissions of the Waste Export Disposal Option.
Air Quality Impacts Air quality emissions can cause a variety of different types of impacts. For the purpose of this report, the discussion of air quality impacts has been divided into of four categories: human health impacts, human welfare impacts, ecological damage, and global warming. Although there are areas of overlap, a separate discussion is presented below for each of these classes of air quality impacts.
Any specific proposal for a new facility, such as any of the Conversion Facilities considered here, would be subject to requirements to obtain one or more air quality permits. Air quality rules and regulations are in a constant state of change and it is likely that in 5 to 10 years, there will be new and/or different requirements for the Conversion Facilities. As part of these permit processes, a much more comprehensive

ESTIMATE OF NET EMISSIONS
001640 | 11-01056-10004 | 6/8/2007 R. W. Beck 10-19
and specific analysis of air quality impacts will be conducted. The science of impact analysis also changes over time, so there may be different ways of evaluating these impacts in the future.
For all of these reasons, the current impact analysis is unavoidably general in nature. The disposal options being considered in this report are several years in the future, and no specific designs are available. The discussion presented in the following paragraphs is mainly qualitative and is based on the general characteristics of the disposal options being considered. We have emphasized areas where there are significant differences between the disposal options being considered.
Human Health Impacts As discussed previously in this section, many of the air pollutants have the potential, if present in high enough concentrations, to impact human health. For the criteria pollutants, in particular, the EPA and others have conducted major human health investigations that allowed the establishment of NAAQS. These standards are effectively evaluation criteria for determining the acceptability or unacceptability of pollutant levels in the air we breathe. Table 10-10 is a list of existing NAAQS. Note that we have included Washington State standards as well as local standards administered by the Puget Sound Clean Air Agency, which in the current analysis would apply only to the Conversion Facilities. For the Waste Export Disposal Option, some of the landfills that the County may use are located in other states; although the Washington State regulations would not apply in those states, all states have similar standards.
All of the Conversion Technologies and landfill gas technologies being considered in this report emit every one of the pollutants listed in Table 10-10 with the exception of ozone. Ozone is not emitted directly by any of the facilities, but instead is formed in the atmosphere from VOCs and NOX, which are emitted by all the technologies. However, not all of the pollutants have the same potential air quality impacts. CO, for example, is primarily an urban pollutant caused by motor vehicles and residential heating system (oil and natural gas) combustion. Since none of the technologies emit CO in significant quantities, we would not expect there to be any CO issues arising from any of the technologies. Therefore, no further discussion is provided for this pollutant. Ozone is also a pollutant of primary concern in relation to the large-scale emissions from urban areas. Although ozone impacts have not been addressed directly in this report, the ozone precursor, VOCs, have been discussed here, mainly due to the VOC relationship with air toxic emissions.
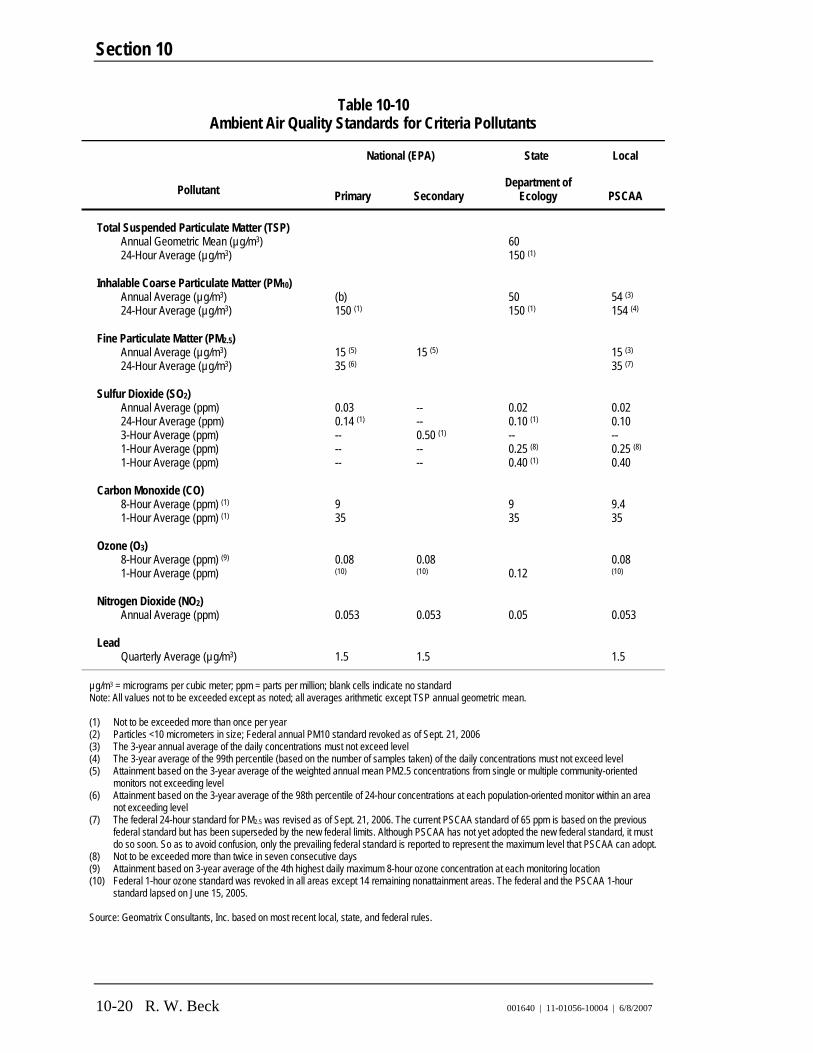
Section 10
10-20 R. W. Beck 001640 | 11-01056-10004 | 6/8/2007
Table 10-10 Ambient Air Quality Standards for Criteria Pollutants
National (EPA) State Local
Pollutant Primary Secondary Department of
Ecology PSCAA
Total Suspended Particulate Matter (TSP) Annual Geometric Mean (µg/m3) 24-Hour Average (µg/m3)
60 150 (1)
Inhalable Coarse Particulate Matter (PM10) Annual Average (µg/m3) 24-Hour Average (µg/m3)
(b) 150 (1)
50 150 (1)
54 (3) 154 (4)
Fine Particulate Matter (PM2.5) Annual Average (µg/m3) 24-Hour Average (µg/m3)
15 (5) 35 (6)
15 (5)
15 (3) 35 (7)
Sulfur Dioxide (SO2) Annual Average (ppm) 24-Hour Average (ppm) 3-Hour Average (ppm) 1-Hour Average (ppm) 1-Hour Average (ppm)
0.03 0.14 (1) -- -- --
-- -- 0.50 (1) -- --
0.02 0.10 (1) -- 0.25 (8) 0.40 (1)
0.02 0.10 -- 0.25 (8) 0.40
Carbon Monoxide (CO) 8-Hour Average (ppm) (1) 1-Hour Average (ppm) (1)
9 35
9 35
9.4 35
Ozone (O3) 8-Hour Average (ppm) (9) 1-Hour Average (ppm)
0.08 (10)
0.08 (10)
0.12
0.08 (10)
Nitrogen Dioxide (NO2) Annual Average (ppm)
0.053
0.053
0.05
0.053
Lead Quarterly Average (µg/m3)
1.5
1.5
1.5
µg/m3 = micrograms per cubic meter; ppm = parts per million; blank cells indicate no standard Note: All values not to be exceeded except as noted; all averages arithmetic except TSP annual geometric mean. (1) Not to be exceeded more than once per year (2) Particles <10 micrometers in size; Federal annual PM10 standard revoked as of Sept. 21, 2006 (3) The 3-year annual average of the daily concentrations must not exceed level (4) The 3-year average of the 99th percentile (based on the number of samples taken) of the daily concentrations must not exceed level (5) Attainment based on the 3-year average of the weighted annual mean PM2.5 concentrations from single or multiple community-oriented
monitors not exceeding level (6) Attainment based on the 3-year average of the 98th percentile of 24-hour concentrations at each population-oriented monitor within an area
not exceeding level (7) The federal 24-hour standard for PM2.5 was revised as of Sept. 21, 2006. The current PSCAA standard of 65 ppm is based on the previous
federal standard but has been superseded by the new federal limits. Although PSCAA has not yet adopted the new federal standard, it must do so soon. So as to avoid confusion, only the prevailing federal standard is reported to represent the maximum level that PSCAA can adopt.
(8) Not to be exceeded more than twice in seven consecutive days (9) Attainment based on 3-year average of the 4th highest daily maximum 8-hour ozone concentration at each monitoring location (10) Federal 1-hour ozone standard was revoked in all areas except 14 remaining nonattainment areas. The federal and the PSCAA 1-hour
standard lapsed on June 15, 2005. Source: Geomatrix Consultants, Inc. based on most recent local, state, and federal rules.

ESTIMATE OF NET EMISSIONS
001640 | 11-01056-10004 | 6/8/2007 R. W. Beck 10-21
The criteria pollutants typically of concern for the disposal options are SO2, NOX, lead, and various forms of particulate matter. These pollutants can have significant but localized impacts on human health. However, by virtue of the air permit requirement, it is unlikely that any of the disposal options considered here would have any significant impact on human health from criteria pollutants. There are differences between the technologies that are worth discussing even if all of the technologies have low overall impacts. In terms of NOX emissions in particular, the Conversion Technology option is calculated to have greater emissions than the Waste Export options. However, NOX emissions from advanced thermal recycling are only slightly greater than from energy generation from landfill gas. The mass burn and RDF technologies have much higher NOX emissions, owing mostly to the lower control efficiency assumed for the NOX removal systems on these units. The difference between the mass burn/RDF technologies and advanced thermal recycling reflects how currently operating facilities have been constructed, not any theoretical limit of the technology. We believe that mass burn and RDF facilities could achieve levels similar to those of advanced thermal recycling if those facilities were equipped with similar air pollution control equipment.
Estimated NOX emissions for the landfill gas technologies are lower simply because there is less combustion involved. The difference in NOX emissions between the two landfill gas technologies reflect the higher NOX emissions for engine generators versus the flare technology. In terms of air quality impacts, higher NOX emissions can result in higher ambient NO2 concentrations, but since Washington State has relatively low NO2 concentrations, this would not be expected to result in any significant human health impacts from direct NO2 exposure. Higher NOX can also result in greater ozone concentrations, more nitrate particles in the atmosphere, and increased acid rain. NO2 can irritate the lungs and lower resistance to respiratory infections such as influenza. The effects of short-term exposure are still unclear, but continued or frequent exposure to concentrations that are typically much higher than those normally found in the ambient air may cause increased incidence of acute respiratory illness in children.
SO2 emissions are a direct result of the sulfur found in the fuel. As with the NOX emissions, the Conversion Technologies are calculated to generate more SO2 simply because there is more combustion and a greater portion of the sulfur contained in the waste is transformed into sulfur dioxide. The differences between the three Conversion Technologies reflect the air pollution control systems assumed to be installed on the units. As with the NOX, these do not reflect an inherent limitation of the technology, but rather a typical difference in systems as previously constructed. Advanced thermal recycling is seen to have very low SO2 emissions due to the high level of acid gas scrubbing used in the design of these systems. Impacts from SO2 include direct inhalation impacts from both short-term and long-term exposures. The major health concerns associated with exposure to high concentrations of SO2 include effects on breathing, respiratory illness, alterations in pulmonary defenses, and aggravation of existing cardiovascular disease. Major subgroups of the population that are most sensitive to SO2 include asthmatics and individuals with cardiovascular disease or chronic lung disease (such as bronchitis or emphysema) as well as children and the elderly.
Section 10
10-22 R. W. Beck 001640 | 11-01056-10004 | 6/8/2007
Lead emissions occur only with the Conversion Technologies. However, because the vast majority of the lead is captured in particulate control systems that are an essential part of all solid waste conversion systems, lead emissions are calculated to be very small. Despite the presence of some lead in the three Conversion Technologies, lead emissions are sufficiently low that none of the Conversion Technologies has the potential for significant lead impacts to human health.
Regulations exist that address particulate matter as a whole, irrespective of the chemical constituency of the particles. Older regulations addressed a poorly defined pollutant known as TSP. Those regulations have mostly been replaced by regulations for particles with specific size specification, such as PM2.5 for particles smaller than 2.5 micrometers in mass-mean diameter. In the current discussion, we address particulate matter in general, but also provide qualitative discussion of the different particle sizes emitted by the solid waste options.
Particulate matter is formed in all combustion processes, especially with solid fuels. For the Conversion Technologies, there are extensive control systems installed to reduce particulate emissions. The particulate emissions quoted here reflect typical systems, but it is possible to reduce the emissions for all Conversion Technologies by increasing the capture efficiency of the control device. Advanced thermal recycling shows very low particulate emissions due to the two stages of particulate control used. The landfill gas technologies have significant particulate emissions, but it should be noted that much of the particulate at the landfill results not from the gas combustion systems, but rather as fugitive dust from the handling and movement of the solid waste. Typically the particle sizes for fugitive dust are larger, and hence have lower health impacts than the smaller particles from combustion. Major concerns for human health from exposure to particulate matter are: effects on breathing and respiratory systems, damage to lung tissue, cancer, and premature death. The elderly, children, and people with chronic lung disease, influenza, or asthma tend to be especially sensitive to the effects of particulate matter.
In addition to the criteria pollutants discussed above, there are a host of other air pollutants for which no ambient criteria exist. Those that have human health impacts are frequently called “air toxics” or “HAPs.” We have not attempted to quantify all these contaminants here, but rather focused on a few that are of particular interest in the solid waste industry. The general pollutant called VOCs includes a large number of these air toxics. Many, though not all, of the air toxic issues can be evaluated using VOC emission rates. In fact, as discussed previously, the issue of VOCs is one of the significant differences between the Conversion Technologies and the Waste Export Disposal Option. VOCs are essentially unburned gases and since the Conversion Technologies burn virtually all of the hydrocarbons in the solid waste, they have little to no VOC emissions. Landfills, on the other hand, create landfill gas and a certain percentage of this gas escapes as a fugitive emission. These fugitive emissions can contain a variety of chemical species, such as benzene or vinyl chloride, that are known carcinogens. Both landfill gas alternatives have significant emissions of VOCs compared with the Conversion Technologies. The private regional landfills considered in this report have significant buffer areas between the waste disposal areas

ESTIMATE OF NET EMISSIONS
001640 | 11-01056-10004 | 6/8/2007 R. W. Beck 10-23
and any off-site property, so concentrations of these gases in the ambient air are greatly diluted before reaching off-site areas.
The combustion of solid waste does, however, produce some air toxics that landfills do not produce in significant quantities. The burning of plastic material that contains chlorine, such as polyvinylchloride (PVC), produces higher HCl emissions than occur in a landfill. The advanced thermal recycling Conversion Technology has a specific scrubber designed to control these particular emissions. The other two Conversion Technologies have significant emissions of HCl compared with landfills, although both technologies could add similar scrubbers. HCl is an acid-forming gas that can impact human respiratory systems.
The family of compounds known as dioxins and furans are also produced in solid waste combustion. These highly carcinogenic compounds are always an important issue for any system that combusts solid waste. Modern solid waste combustion systems have been designed to minimize dioxin and furan emissions by maintaining high enough temperatures to destroy them in the combustion process. Especially with the advanced thermal recycling option, the reported emissions of these compounds are sufficiently low to not cause human health concerns.
Finally, mercury is an increasingly important pollutant in the solid waste industry. Landfill flares emit small amounts of mercury, but higher levels are found in direct solid waste combustion systems. Mercury emissions from the Conversion Technologies can be reduced with the use of carbon injection systems as part of the air pollution control equipment.
In summary, all five of the technologies considered in this section will be required to operate under the terms of an air quality permit, which will limit the potential for these facilities to impact human health. There are, however, differences between the technologies in terms of the residual impacts that are left after the imposition of controls required by the permits. Both landfill gas technologies emit significant quantities of VOCs that are not emitted by any of the Conversion Technologies. Conversely, the Conversion Technologies, as typically implemented in the United States in the past, have had higher emissions of combustion products such as NOX and SO2. The advanced thermal recycling Conversion Technology, due to its advanced air pollution control system, is reported to emit low levels of these criteria pollutants. We believe the same type of equipment could be added to mass burn or RDF facilities to obtain similar results.
Human Welfare Issues In addition to human health, air pollutants pose a number of potential human welfare issues. These include nuisance impacts, typically dust and odor, as well as visibility degradation. Air quality permits are designed to protect human welfare in addition to human health, and since all five of the technologies considered in this section would be subject to air quality permit requirements, the human welfare impacts of these options would be limited. Presented below is a general discussion that allows the disposal options to be compared in terms of the potential to impact human welfare, without actually quantifying the level of impact.

Section 10
10-24 R. W. Beck 001640 | 11-01056-10004 | 6/8/2007
The term “dust” refers to particulate matter released from the movement or handling of personnel and materials using heavy equipment. The smaller dust particles pose some human health impacts and have been discussed above, but larger particles are incapable of penetrating the human lung and generally pose few human health issues. Dust consists of particles of all sizes, but since the human health impacts of the small particles contained in dust were addressed above, the current discussion concerns the larger particles. The impacts of dust are usually close to the source of emission because the larger particles do not travel well in the atmosphere. The usual impact from dust emission is soiling, where a layer of particle matter can settle on surrounding property.
The handling of solid waste always poses some dust issues, but at Conversion Facilities, it is easier to control dust by enclosure or capture. Landfills operate in the open air, exposed to wind, and dust can be a significant issue. Sources of dust emission at an operating landfill include the dumping of waste, the subsequent movement and placement of the waste in the active face, the compacting of the waste, the handling of cover materials as well as cell construction materials, and the travel of trucks and other heavy equipment on unpaved surfaces. Dust impacts on surrounding neighbors can be significant if the neighbors are in close proximity. In the case of the private regional landfills considered for this report, we assume there are no close neighbors and dust emissions are not typically an issue.
Odor is always an issue with any facility that handles solid waste. Similar to dust, the odor is easier to control at Conversion Facilities, since the places where solid waste is exposed can be enclosed and the air can be captured and routed to combustion or control systems. Also, solid waste at Conversion Facilities is not normally kept on-site for sufficient time to allow significant biological gas production to occur. Landfills, on the other hand, deal with solid waste in the open air and more importantly, promote anaerobic decomposition which produces hydrogen sulfide and other odorous gases. Landfill gas has an extremely strong and offensive odor. The two landfill gas technologies considered in this report employ active gas control systems that are intended to capture the majority of the landfill gas and route it to some form of combustion system. However, a certain percentage of the gas escapes to the atmosphere and poses the potential for odor impacts. In the case of the private regional landfills considered here, there are no close neighbors and odor is not currently a significant matter.
Visibility degradation is an increasingly important issue for combustion facilities. National parks and wilderness areas, as well as some other special lands, have been designated as Class I areas under the Clean Air Act and afforded special protection from visibility degradation. Evaluation of visibility degradation is required, even for facilities located hundreds of miles from a Class I area. Special long-range transport air quality models are used to evaluate these impacts. Of particular concern are emissions of sulfur and nitrogen oxides, since these pollutants can form sulfate and nitrate particles in the atmosphere. These small aerosols, as they are called, are major contributors to visibility degradation. The landfill gas technologies have fewer issues with visibility degradation for several reasons. The trend for the siting of new large landfills in both Washington and Oregon has been east of and far from the Class I

ESTIMATE OF NET EMISSIONS
001640 | 11-01056-10004 | 6/8/2007 R. W. Beck 10-25
areas in the Cascade Mountains, thus landfills that might be considered by King County for future disposal are less likely to impact these Class I areas. Also, the relatively lower emissions of SO2 and NOX associated with the landfill gas technologies, when compared with the Conversion Technologies (except advanced thermal recycling), lead to lower potential visibility impacts. For the Conversion Technologies, visibility degradation, unless addressed in the design of the air pollution control equipment, could become a major issue since National Parks Service and USDA Forest Service criteria for visibility degradation are very stringent and any significant source of SO2 and NOX in Western Washington would be rigorously evaluated.
In summary, as with human health issues, the human welfare issues are also limited by the air permit process and all of the technologies in this review here should be capable of being operated in such a way that there will be little to no impact to human welfare. The residual impacts after all of the permit controls are implemented will likely show that landfills have greater potential dust and odor impacts, while the Conversion Technologies may have greater potential to impact visibility unless properly addressed.
Ecological Damage Emissions of air pollutants from solid waste facilities can impact the natural environment in several ways. The most important of these is the potential for acidification of water systems as a result of sulfur and/or nitrogen oxide emissions. The process, referred to as “acid deposition” can impact streams, wetlands, and sensitive plant habitats. As with the above impacts, the air quality permits will impose requirements on the acid-forming pollutant emissions from all the technologies reviewed in this section. In general, technologies with higher SO2, NOX, or HCl emissions will have the greater potential for acid deposition and its associated impacts. Thus, the Conversion Technologies, with the exception of advanced thermal recycling, have greater potential for acidification impacts than the landfill gas technologies, unless the mass burn and RDF technologies address this matter by adding scrubbing capability.
Specific toxicity is another form of ecological damage, where a particular pollutant may cause impacts to a plant or animal species. The level of detail of this study precludes the evaluation of specific toxicity issues for any of the disposal options. Typically, specific ecological toxicity is not a significant issue for solid waste facilities.
Eutrophication refers to a shift in the nutrient balance for plants and microorganisms in the ecosystem. There is no evidence to suggest that any of the technologies reviewed here have the potential for this type of impact through airborne release and deposition.
In summary, none of the solid waste disposal technologies poses a specific threat for ecological damage. The potential exists for some of the Conversion Technologies, unless designed to reduce acid-forming pollutant emissions, to cause some acidification if sensitive environments are located close to the facility. But it is

Section 10
10-26 R. W. Beck 001640 | 11-01056-10004 | 6/8/2007
unlikely these impacts would be significant enough to make a distinction between the disposal options.
Global Warming The subject of global warming refers to the potential for climate modification caused by emissions of carbon and nitrogen species from man-made sources. After some years of scientific uncertainty and controversy, it is becoming increasing clear that man-made emissions of these chemical species have resulted in increased airborne concentrations worldwide and are almost certainly modifying the earth’s climate. The major contributors are CO2, CH4, and to a lesser extent, N2O. Collectively, these chemical species are referred to as “greenhouse gases.” These chemical species have previously not been addressed in air pollution regulations and in fact, until recently, have not been considered pollutants in the atmosphere. However, recent concern about the climate modification effects of greenhouse gases requires that global warming potential be evaluated for the solid waste disposal options considered here.
It is important to understand that the subject of global warming and the effects of greenhouse gas emissions have only recently emerged as an air quality issue. For example, as recently as April 2, 2007, the EPA was instructed by the U.S. Supreme Court that it did have the regulatory authority to regulate greenhouse gas from mobile sources, after the EPA had argued before the Court that it had no such authority. As part of the preparation of this report, we contacted the Puget Sound Clean Air Agency and asked for guidance. The response from the Puget Sound Clean Air Agency was that they had no guidance in these areas, although they anticipate developing such guidance at some time in the future. Although there is a great deal of literature on the topic, there is little formal guidance on how to evaluate the global warming potential of projects such as the solid waste disposal options being considered by the County.
There are, however, a number of conclusions that can be drawn. The topic is complicated by the fact that the different greenhouse gases have different global warming potentials. A compounding complexity is that the greenhouse gases have different residence times in the atmosphere. For example, the two most important greenhouse gases, CO2 and CH4, illustrate this point. On an instantaneous basis the global warming potential for CH4 is more than 50 times greater than CO2, but because CO2 has a much longer residence time in the atmosphere (100 years or more) compared with CH4 (typically 13 years) the actual relative impacts on global warming of these two greenhouse gases differ, depending on how far out in the future one calculates the impacts. Although nothing has been standardized in this rapidly evolving science, it has become somewhat standard practice, for example in the Kyoto Protocol, to use 100 years as the time period and a factor of 21 to relate the global warming potential of these two greenhouse gases. Accordingly, in the current analysis we have computed an artificial pollutant, called CO2 equivalents, which adds CO2 emissions to 21 times methane emissions. Similarly, for a 100-year horizon, N2O emissions are 310 times more potent as a greenhouse gas than CO2, so CO2 equivalents are also computed by adding 310 times the N2O emissions. These are then further reduced to “carbon equivalents” by multiplying the CO2 equivalents by the
ESTIMATE OF NET EMISSIONS
001640 | 11-01056-10004 | 6/8/2007 R. W. Beck 10-27
ratio of molecular weights, 12/44. Carbon equivalents are customarily reported as metric tons carbon equivalent, or MTCE.
When the greenhouse gas emissions of the five technologies are considered, we estimate that the three Conversion Technologies have larger greenhouse gas emissions than the two landfill gas technologies. In making these estimates, we have made several assumptions, including:
1. 20 percent of the landfill gas escapes combustion and is emitted to the atmosphere as a mixture of approximately 55 percent methane and 45 percent CO2.
2. Landfill gas emissions occur over time while Conversion Technology emissions occur as the waste is combusted, so in making these comparisons, the landfill gas emissions resulting from 20 years of disposal were computed for many years in the future after disposal is assumed to have ceased.
One important assumption we made in the calculation of greenhouse gas emission rates for these solid waste disposal options concerns the issue of avoided emissions. By combusting solid waste and generating electricity, Conversion Technologies avoid other means of electrical generation and the greenhouse gas emissions associated with those generation methods. The current analysis was performed using two methods. Values shown in Table 10-9 are based on an assumption that the avoided electricity would be from natural gas combustion in a modern combined-cycle plant, capable of recovering 40 percent of the energy in the gas as electricity. An alternative analysis was also performed using Department of Energy guidance, which reflected the methods actually used in the Washington State to generate electricity. So while some credit is given for the avoided emissions, it is not as much as might be given if all the avoided emissions were assumed to result from the national average electrical generation methods, where a large fraction is assumed to result from coal combustion, a method having much greater greenhouse gas emissions per unit of electricity than either of the two methods considered here. This single factor contributes to the differing conclusions that other researchers have published that indicate Conversion Facilities are on par or better than landfills in terms of greenhouse gas emissions. If national average energy displacement factors are substituted in our calculation spreadsheet, the Conversion Technologies have lower greenhouse gas emissions than flaring, but energy recovery from landfill gas is still lower in greenhouse gas emissions than the Conversion Technologies. If, however, the gas collection percentage is lowered to 70 percent for the landfill gas technologies and the further assumption is made that national average energy displacement factors (including coal burning) are appropriate, then the Conversion Technologies have lower greenhouse gas emissions than either of the two landfill gas technologies.
However, we believe that the current analysis should reflect realistic energy generation methods in Washington State and we think it is unrealistic to assume that large quantities of coal combustion would be offset by the combustion of solid waste or landfill gas. Accordingly, the current analysis has focused on avoided emissions using the two methods described above.
Section 10
10-28 R. W. Beck 001640 | 11-01056-10004 | 6/8/2007
In addition, the future may hold opportunities for new technologies such as carbon sequestration and other means to avoid greenhouse gas emissions. The current analysis gave no consideration to the possible implementation of any of these new technologies.
In summary, both disposal options have emissions of greenhouse gas, but it should be recognized that solid waste is a product of society and, if left unaddressed, it will decompose and generate massive quantities of CH4 with large global warming implications. Thus, all solid waste disposal technologies considered here reduce global warming impacts when compared with having no plan to deal with the disposal of solid waste. The landfill gas technologies have somewhat lower greenhouse gas emissions than the Conversion Technologies.
Summary The major conclusions of this air quality analysis are:
1. Criteria pollutant emissions from all disposal technologies would be expected to be well controlled and not produce any significant human health or welfare impacts. Conversion Technologies would generally be expected to have higher emissions than landfill gas technologies, with the exception that VOC emissions from landfills are much higher than Conversion Facilities.
2. Toxic pollutant emissions from all disposal technologies would be expected to be well controlled and not pose any significant human health impacts. Landfill gas technologies would be expected to have significantly higher toxic emissions than Conversion Technologies because of the large volumes of fugitive landfill gas that are unavoidable with even the best operated landfills. Conversion Technologies would be expected to have higher emissions from a few specific toxic pollutants of concern, such as dioxins, that are not produced in significant quantities from landfills. In all cases these toxic emissions would be expected to be very low.
3. Greenhouse gas emissions are an unavoidable consequence of the disposal of solid waste generated by human civilization. All of the disposal technologies reviewed here can be expected to result in reduction of greenhouse gas emissions over any alternative that does not convert or properly dispose of solid waste. Conversion Technologies were seen to have somewhat higher greenhouse gas emissions than the landfill gas technologies, but the actual relative difference is a strong function of the assumptions used in the analysis.

Section 11 ESTIMATED CAPITAL COSTS AND OPERATING EXPENSES

001640 | 11-01056-10004 | 6/8/2007
Section 11 ESTIMATED CAPITAL COSTS AND
OPERATING EXPENSES
This section of the report presents the results of R. W. Beck’s review of the estimated range of capital costs and annual operating expenses for the three Conversion Facilities and the Waste Export Option. These estimates are also used in Section 15 as a part of a comparative cost analysis.
All of the options will require continued use of the County’s existing solid waste transfer stations. As discussed in the County’s Waste Export Plan, if the County chooses the Waste Export Disposal Option, it will likely also need to plan for the construction of a new intermodal facility. If the County elects to utilize a Conversion Technology, it will still need to transport bypassed waste and residue ash via rail-haul. Therefore, an intermodal facility may still be required, although the County would want to carefully consider whether it would be better for the County or a private company to own and operate the intermodal facility under this option.
Estimated Capital Costs Conversion Technologies It is important to note that the last new waste-to-energy facility utilizing mass burn technology was constructed in the United States between 1993 and 1995 in Montgomery County, Maryland. The last new waste-to-energy facility utilizing RDF technology was constructed between 1987 and 1990 in the City and County of Honolulu, Hawaii. During the last 20 years, many waste-to-energy full service (design-build-operate) contractors have exited the business. These companies include but are not limited to Westinghouse, Foster Wheeler, Raytheon, and General Electric. With Covanta Energy’s recent acquisition of American Ref-Fuel, only four major companies in the United States have experience in the construction and operation of waste-to-energy facilities: Covanta Energy, Energy Answers, Montenay Power, and Wheelabrator Technologies. In the early 2000s, a number of older waste-to-energy facilities began to implement retrofits to continue operating beyond 20 years. For example, Lee and Hillsborough Counties, Florida are adding 600-TPD units to expand their waste-to-energy facilities. In 2006, a complete retrofit was undertaken to an 800-TPD waste-to-energy facility in the City of Harrisburg, Pennsylvania. In Maryland, the Northeast Maryland Waste Disposal Authority is procuring a new waste-to-energy facility to serve Carroll and Fredrick Counties, and an expansion or upgrade to a 360-TPD waste-to-energy facility in Harford County.

Section 11
11-2 R. W. Beck 001640 | 11-01056-10004 | 6/8/2007
Due to the lack of development activity in the last 10 to 15 years, the major companies in the waste-to-energy industry reduced their engineering staffs, thus depleting institutional knowledge. For this reason, capital construction cost information in the United States is over 15 years old.
A Conversion Facility utilizing advanced thermal recycling technology has not been constructed in the United States. Worldwide, the last new facility to commence commercial operation was the MVR facility in Hamburg, Germany, which started operating in 1999.
The development of detailed construction cost estimates for three Conversion Facilities and the Waste Export Option was well beyond the scope of services to be provided as part of the preparation of this report. Such estimates would require three to six months to develop and would cost well in excess of $100,000 to prepare.
Therefore, for the purpose of preparing this report, we contacted vendors in the Conversion Technology industry to obtain updated estimates of capital costs for Conversion Facilities. We also obtained and analyzed cost and performance information related to numerous existing waste-to-energy facilities in the United States from their in-house information and from industry data.1 It is important to note that the cost data that we reviewed for this assignment varied widely, which should serve as a warning that the cost of constructing and operating a Conversion Facility is quite project-specific. Based on all of this, as well as our engineering judgment, we prepared the planning-level estimates contained in this report. This data is intended only to be used for comparison purposes with the other alternatives. If the County decides to move forward with the development of a Conversion Facility, a more detailed analysis of the construction costs would need to be completed. The following sections provide background information and our key assumptions.
Capital Cost The capital costs for the three Conversion Facilities include provision to construct the facility, excluding electrical interconnection. Capital cost estimates are expressed in 2007 dollars. Actual future costs are likely to vary from the estimates presented herein. The planning-level estimate for each Conversion Facility included the following components:
No direct costs to purchase land for the facility site – given the varying and speculative nature of land prices in the County, and the comparatively small expense, direct land costs were not included;
Waste Receiving and Storage – three days enclosed waste storage;
Waste Processing (RDF only) – two-stage shredding for size reduction, screening to remove glass and inert fines, two-stage magnetic separation to remove ferrous metal, and an eddy current separator to remove aluminum;
1 Eileen Berenyi, The Municipal Waste Combustion Industry in the United States: 1997-98 Resource Recovery Yearbook and Directory, 7th ed. (Westport, CT: Governmental Advisory Associates, Inc., 1997).
ESTIMATED CAPITAL COSTS AND OPERATING EXPENSES
001640 | 11-01056-10004 | 6/8/2007 R. W. Beck 11-3
Building – enclosures for the tipping and waste storage areas, a furnace-boiler room, a residue handling and ash storage building, a turbine-generator hall, an administration area, and a maintenance shop (note that air emissions control equipment, cooling towers, and electrical switchyard are typically located outdoors or partially enclosed by a screen wall);
Waterwall Furnace-Boilers – grate systems, superheater sections, steam generating convection banks, feedwater economizers, combustion air systems, steam coil air heaters for underfire air, auxiliary fuel burners, and selective non-catalytic reduction (SNCR) systems for nitrogen oxides (NOx) removal;
Air Emissions Control Equipment (mass burn and RDF) – spray dryers with lime handling system for acid gas removal, fabric filter baghouses for particulate removal, carbon injection system for mercury removal, continuous emissions monitoring system, and stack;
Air Emissions Control Equipment (advanced thermal recycling) – two-stage fabric filter baghouses for particulate removal, hydrochloric acid (HCl) removal scrubber with HCl recovery/polishing system, sulfur dioxide (SO2) removal scrubber with gypsum recovery/polishing system and lime handling system, carbon injection system for mercury removal, continuous emissions monitoring system, and stack;
Balance of Plant – scale facility, operations control center, ferrous metals recovery from residue ash, turbine-generator, shell and tube condenser, air-cooled condenser, and water treatment system;
Full Service Contractor’s Project Development “Soft” Costs – engineering, permitting, start-up, performance testing, spare parts, and contingency.
Table 11-1 presents the estimated range of capital costs for the three Conversion Technologies expressed in 2007 dollars. The costs are expressed in terms of: 1) the dollars per ton of daily disposal capacity (for example, a mass burn facility is estimated to cost between $145,000 and $160,000 per ton of daily disposal capacity), and 2) the cost of the entire facility.
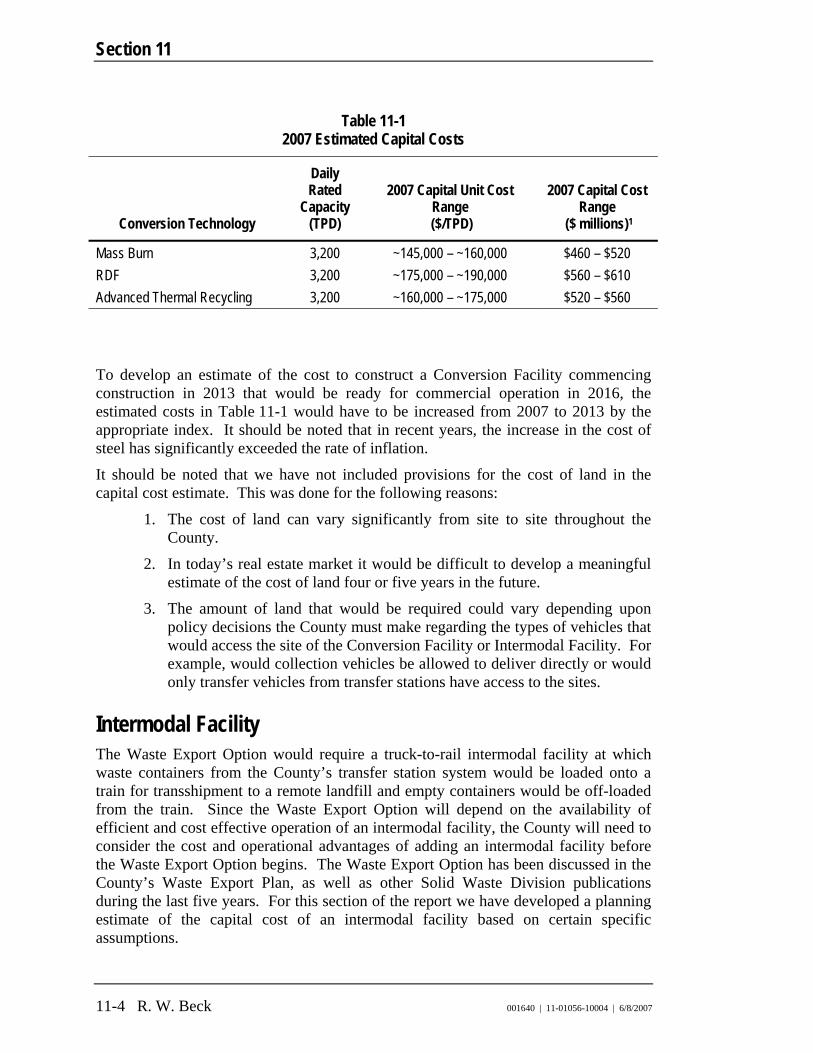
Section 11
11-4 R. W. Beck 001640 | 11-01056-10004 | 6/8/2007
Table 11-1 2007 Estimated Capital Costs
Conversion Technology
Daily Rated
Capacity (TPD)
2007 Capital Unit Cost Range
($/TPD)
2007 Capital Cost Range
($ millions)1
Mass Burn 3,200 ~145,000 – ~160,000 $460 – $520 RDF 3,200 ~175,000 – ~190,000 $560 – $610 Advanced Thermal Recycling 3,200 ~160,000 – ~175,000 $520 – $560
To develop an estimate of the cost to construct a Conversion Facility commencing construction in 2013 that would be ready for commercial operation in 2016, the estimated costs in Table 11-1 would have to be increased from 2007 to 2013 by the appropriate index. It should be noted that in recent years, the increase in the cost of steel has significantly exceeded the rate of inflation.
It should be noted that we have not included provisions for the cost of land in the capital cost estimate. This was done for the following reasons:
1. The cost of land can vary significantly from site to site throughout the County.
2. In today’s real estate market it would be difficult to develop a meaningful estimate of the cost of land four or five years in the future.
3. The amount of land that would be required could vary depending upon policy decisions the County must make regarding the types of vehicles that would access the site of the Conversion Facility or Intermodal Facility. For example, would collection vehicles be allowed to deliver directly or would only transfer vehicles from transfer stations have access to the sites.
Intermodal Facility The Waste Export Option would require a truck-to-rail intermodal facility at which waste containers from the County’s transfer station system would be loaded onto a train for transshipment to a remote landfill and empty containers would be off-loaded from the train. Since the Waste Export Option will depend on the availability of efficient and cost effective operation of an intermodal facility, the County will need to consider the cost and operational advantages of adding an intermodal facility before the Waste Export Option begins. The Waste Export Option has been discussed in the County’s Waste Export Plan, as well as other Solid Waste Division publications during the last five years. For this section of the report we have developed a planning estimate of the capital cost of an intermodal facility based on certain specific assumptions.

ESTIMATED CAPITAL COSTS AND OPERATING EXPENSES
001640 | 11-01056-10004 | 6/8/2007 R. W. Beck 11-5
An intermodal facility located in King County is assumed to be designed to move sealed waste containers from trucks to rail cars since the regional landfills available to King County are most easily and cost effectively accessible by rail. In a 2005 report for the Solid Waste Division,2 R. W. Beck developed an estimate of the capital costs of a truck-to-rail intermodal facility assumed to be constructed at the King County Road Division’s Covington Pit Site and owned by the County. Based on this analysis, we estimated that in 2005 a suitably sized intermodal facility would cost the Solid Waste Division approximately $14,600,000 for the facility and an additional $1,200,000 for the cost of equipment. Escalating these numbers to 2007 dollars at 2.4% per year results in an estimated capital cost of approximately $16,500,000. As with the Conversion Technology costs listed previously, this estimate does not include the cost of the land on which the facility would be built.
Estimated Annual Operating Expenses Conversion Technologies Similar to the methodology used to develop estimated capital costs, for the purpose of developing estimates of operating and maintenance expenses, we contacted full-service contractors in the Conversion Technology industry to obtain information on estimated operating expenses. The operating expenses include provision for operating labor, routine maintenance labor, parts and supplies, outside service and maintenance contracts, major maintenance fund for renewals and replacements, general and administration, contractor’s profit, electricity, fuel, and “normal” pass-throughs such as chemicals, insurance, and utilities. The estimate does not include property taxes or host fees, which are site-specific. Table 11-2 presents estimated operating expenses for the three Conversion Technology alternatives as unit rates ($/ton) expressed in 2007 dollars. These estimates are for planning purposes and are meant primarily to show the relationship between the three Conversion Technology alternatives. Actual future costs are likely to vary from our estimates.
2 R. W. Beck, “Work Order No. 2 - King County Roads Division Covington Pit Site Feasibility Evaluation (Draft),” October 28, 2005, technical memorandum.
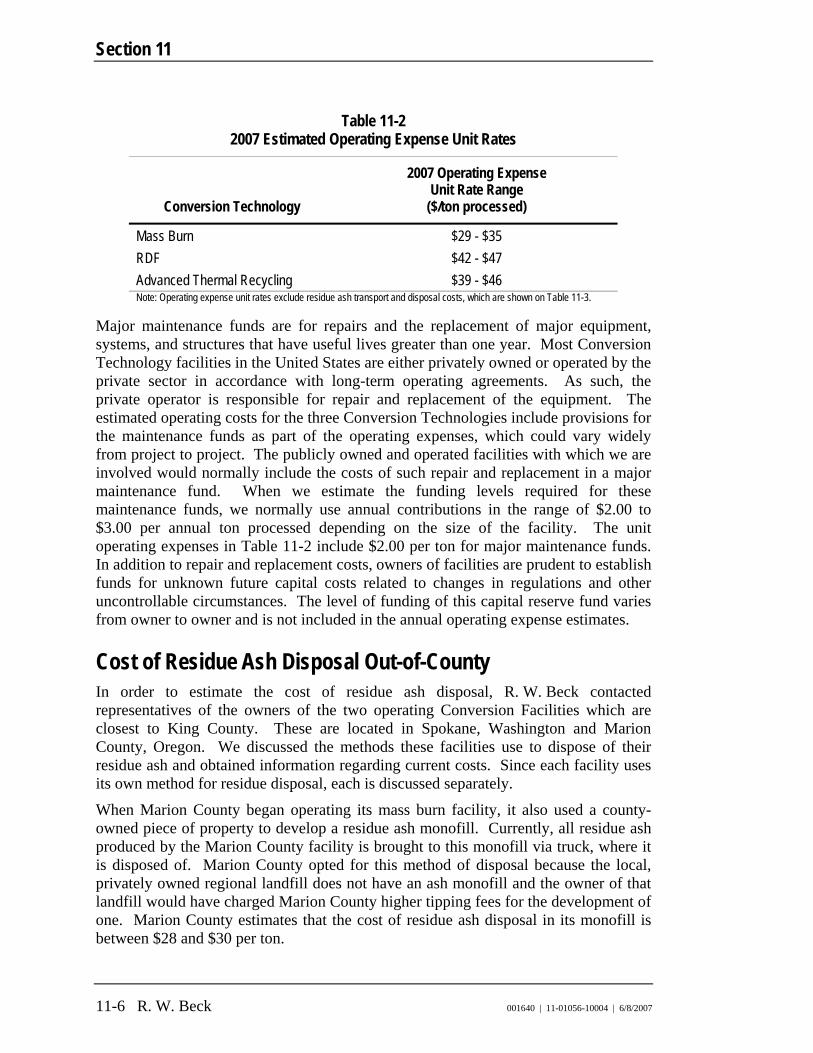
Section 11
11-6 R. W. Beck 001640 | 11-01056-10004 | 6/8/2007
Table 11-2 2007 Estimated Operating Expense Unit Rates
Conversion Technology
2007 Operating Expense Unit Rate Range
($/ton processed)
Mass Burn $29 - $35 RDF $42 - $47 Advanced Thermal Recycling $39 - $46 Note: Operating expense unit rates exclude residue ash transport and disposal costs, which are shown on Table 11-3.
Major maintenance funds are for repairs and the replacement of major equipment, systems, and structures that have useful lives greater than one year. Most Conversion Technology facilities in the United States are either privately owned or operated by the private sector in accordance with long-term operating agreements. As such, the private operator is responsible for repair and replacement of the equipment. The estimated operating costs for the three Conversion Technologies include provisions for the maintenance funds as part of the operating expenses, which could vary widely from project to project. The publicly owned and operated facilities with which we are involved would normally include the costs of such repair and replacement in a major maintenance fund. When we estimate the funding levels required for these maintenance funds, we normally use annual contributions in the range of $2.00 to $3.00 per annual ton processed depending on the size of the facility. The unit operating expenses in Table 11-2 include $2.00 per ton for major maintenance funds. In addition to repair and replacement costs, owners of facilities are prudent to establish funds for unknown future capital costs related to changes in regulations and other uncontrollable circumstances. The level of funding of this capital reserve fund varies from owner to owner and is not included in the annual operating expense estimates.
Cost of Residue Ash Disposal Out-of-County In order to estimate the cost of residue ash disposal, R. W. Beck contacted representatives of the owners of the two operating Conversion Facilities which are closest to King County. These are located in Spokane, Washington and Marion County, Oregon. We discussed the methods these facilities use to dispose of their residue ash and obtained information regarding current costs. Since each facility uses its own method for residue disposal, each is discussed separately.
When Marion County began operating its mass burn facility, it also used a county-owned piece of property to develop a residue ash monofill. Currently, all residue ash produced by the Marion County facility is brought to this monofill via truck, where it is disposed of. Marion County opted for this method of disposal because the local, privately owned regional landfill does not have an ash monofill and the owner of that landfill would have charged Marion County higher tipping fees for the development of one. Marion County estimates that the cost of residue ash disposal in its monofill is between $28 and $30 per ton.

ESTIMATED CAPITAL COSTS AND OPERATING EXPENSES
001640 | 11-01056-10004 | 6/8/2007 R. W. Beck 11-7
As discussed in Section 9 and Appendix B, the Spokane System3 facility uses rail-haul to transport its residue ash to the Roosevelt Regional Landfill in Klickitat County, where it is disposed of in a monofill. Recently, the Spokane System submitted a request to change its residue classification from “Special Incinerator Ash” to “Solid Waste.” This modification will result in a change in the requirement that its residue ash be disposed of in the monofill. The residue ash can now be disposed of with other MSW at the landfill, or potentially be used as an alternate daily cover material. Disposal of residue ash at the monofill currently costs the Spokane System $22.26 per ton to transport and a $23.23 per ton tipping fee at the landfill ($45.49 per ton total). With the new classification, the cost of transport and disposal of the residue ash will be similar to the Spokane System’s cost of $45.44 per ton for disposal of bypassed waste. However, preliminary indications are that if the residue ash is deemed by DOE to be usable as alternate daily cover, the price would be reduced by around $5 per ton to around $40 per ton.
Since the transport and disposal of residue ash is usually contracted through a competitive bidding process, the cost of managing residue ash from a King County facility will be significantly impacted by the business decisions made in 2016 by private landfill and rail owners and operators. Table 11-3 outlines our current estimate of the potential cost of residue ash disposal based on the information we received from other municipalities.
Table 11-3 2007 Estimated Residue Ash Disposal Rates
($/ton disposal) Transport Disposal Total $18 – $25 $22 – $30 $40 – $55
Cost of Waste Export In order to estimate the cost of exporting waste, we contacted representatives of Snohomish County, Kitsap County, and Seattle Public Utilities, which currently export their waste to large regional landfills. Waste from the City of Seattle and Kitsap County is hauled via rail to the Columbia Ridge Landfill located in northern Oregon. Snohomish County also uses the rail system but exports its waste to Roosevelt Regional Landfill in eastern Washington. Table 11-4 sets forth the reported costs for each municipality, separated into “transport” and “disposal” pieces where the information was available. The information for the Spokane System in Table 11-4 represents the cost of transport and disposal of bypassed waste from the Spokane Facility to the Roosevelt Regional Landfill.
3 The Spokane Regional Solid Waste System (“Spokane System”) includes Spokane County, the City of Spokane, 12 other cities and towns, and Fairchild Air Force Base.
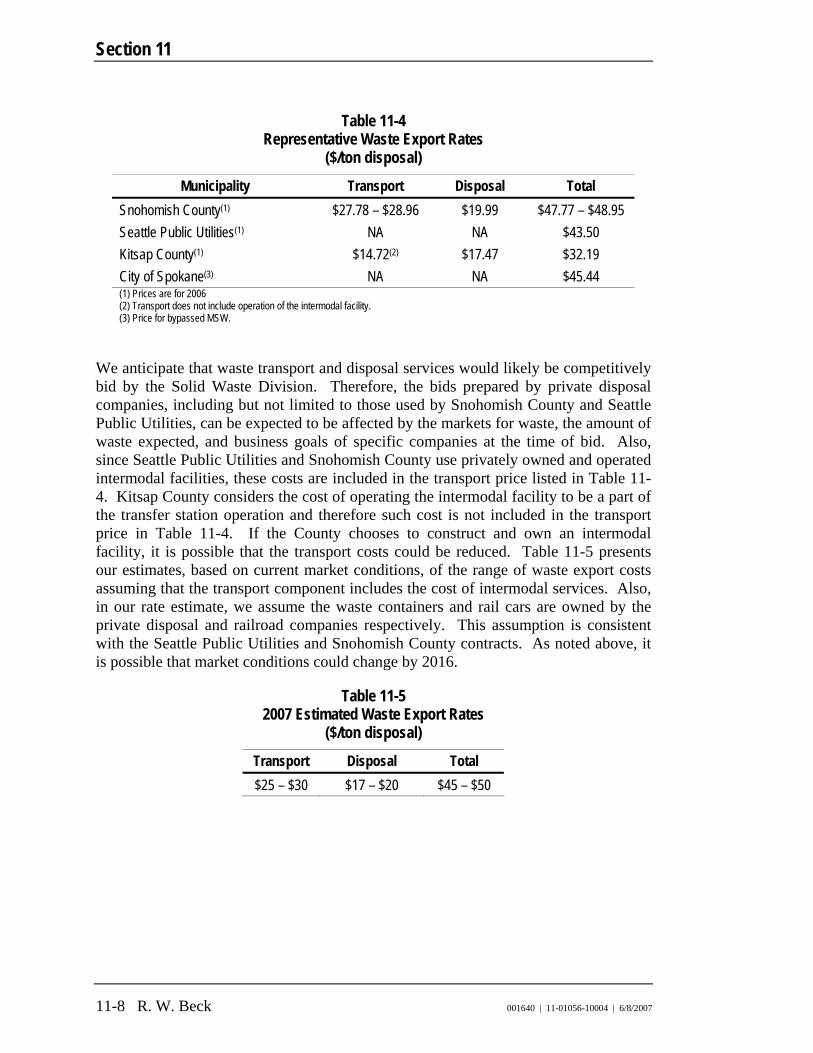
Section 11
11-8 R. W. Beck 001640 | 11-01056-10004 | 6/8/2007
Table 11-4 Representative Waste Export Rates
($/ton disposal) Municipality Transport Disposal Total
Snohomish County(1) $27.78 – $28.96 $19.99 $47.77 – $48.95 Seattle Public Utilities(1) NA NA $43.50 Kitsap County(1) $14.72(2) $17.47 $32.19 City of Spokane(3) NA NA $45.44 (1) Prices are for 2006 (2) Transport does not include operation of the intermodal facility. (3) Price for bypassed MSW.
We anticipate that waste transport and disposal services would likely be competitively bid by the Solid Waste Division. Therefore, the bids prepared by private disposal companies, including but not limited to those used by Snohomish County and Seattle Public Utilities, can be expected to be affected by the markets for waste, the amount of waste expected, and business goals of specific companies at the time of bid. Also, since Seattle Public Utilities and Snohomish County use privately owned and operated intermodal facilities, these costs are included in the transport price listed in Table 11-4. Kitsap County considers the cost of operating the intermodal facility to be a part of the transfer station operation and therefore such cost is not included in the transport price in Table 11-4. If the County chooses to construct and own an intermodal facility, it is possible that the transport costs could be reduced. Table 11-5 presents our estimates, based on current market conditions, of the range of waste export costs assuming that the transport component includes the cost of intermodal services. Also, in our rate estimate, we assume the waste containers and rail cars are owned by the private disposal and railroad companies respectively. This assumption is consistent with the Seattle Public Utilities and Snohomish County contracts. As noted above, it is possible that market conditions could change by 2016.
Table 11-5 2007 Estimated Waste Export Rates
($/ton disposal) Transport Disposal Total $25 – $30 $17 – $20 $45 – $50

Section 12 PROJECTED ENERGY REVENUES
001640 | 11-01056-10004 | 6/8/2007
Section 12 PROJECTED ENERGY REVENUES
Assuming that at some future time the County decides to utilize a Conversion Technology for waste disposal, and that it selects one of the three current commercially proven Conversion Technologies discussed at length in this report, that Conversion Technology would be capable of generating energy in the form of either steam or electricity. Similarly, under the Waste Export Disposal Option the decomposition of the County’s solid waste in a landfill would result in the creation of methane gas, which can be captured and used to generate electricity. The purpose of this section is: 1) to provide an estimate of the potential amount of energy that could be generated during the 20-year study period by both the Conversion Facilities and the landfilled waste; 2) to provide a forecast of wholesale power market prices and the implied value of the landfill gas during the study period; and 3) to estimate the potential annual revenues that could be realized through the sale of electricity and/or landfill gas. These annual revenues are used in Section 15 as a part of the comparative cost analysis.
Potential Energy Generation Conversion Technology Disposal Option Electricity Generation For the purpose of this report, we have developed a planning estimate of the amount of electricity that could be generated by a Conversion Facility. We have found that for planning purposes, and based on our experience with currently operating Conversion Facilities, it is reasonable to assume that a Conversion Facility could generate approximately a net of 500 kWh to 550 kWh per ton of waste. Such a generation rate is net of the Conversion Facility’s in-plant power requirements. This estimate assumes an annual average heating value of the solid waste of approximately 5,000 Btu per pound. It should be anticipated that the heating value of solid waste will fluctuate throughout the course of the year depending upon the amount of precipitation, variations in the composition of the incoming waste, and future changes in packaging. For the two Conversion Facilities sized at 3,200 TPD with a 90 percent annual availability, we calculate that the following annual quantities of electricity could be generated:
1. 500 kWh/ton: 525,600,000 kWh/year 2. 550 kWh/ton: 578,200,000 kWh/year
Section 12
12-2 R. W. Beck 001640 | 11-01056-10004 | 6/8/2007
An RDF Conversion Facility is assumed to have an annual plant availability of 87 percent, compared to 90 percent for mass burn and advanced thermal recycling, but net energy generation values for RDF facilities are generally slightly higher than mass burn or advanced thermal recycling facilities. Therefore, for the purpose of this section of the report, we have treated the three Conversion Technologies equivalent from an energy generation perspective.
Steam Generation It is possible for a Conversion Facility to generate steam for sale to a steam user. However, we have focused the discussion on the sale of electricity, rather than the sale of steam, for the following reasons:
1. Finding a suitably sized facility site adjacent to a steam customer could significantly complicate the entire siting process for a Conversion Facility, as it will limit potential sites to only those very near or adjacent to large steam users.
2. A single Conversion Facility sized at 3,200 TPD would be capable of generating approximately 600,000 pounds of steam per hour. This quantity of steam is likely to exceed the steam requirements of most potential steam customers.
3. Conversion Facilities are intended to operate 24 hours per day, seven days a week in order to dispose of the solid waste. They would not stop operations because the steam customer is unable to take steam for some reason due to an upset condition in the processing facility.
For informational purposes, we estimate that a Conversion Facility of 3,200 TPD could reasonably be expected to be able to generate approximately 5,250,000,000 pounds of steam per year. What a potential steam customer would be willing to pay for such steam will depend upon the type of fuel the steam customer is currently using, whether the steam customer can avoid major capital expenditures associated with the steam customer’s existing steam plant, and the potential savings in operating and maintenance expenses of no longer having to operate a steam plant.
Waste Export Disposal Option Landfill Gas Production and Electricity Generation For the purpose of being able to compare energy generation options, we have assumed for the Waste Export Disposal Option that all of the County’s solid waste will be disposed of in its own operating cell at a privately owned landfill. We have made this assumption in order to develop an estimate of the amount of landfill gas that could be generated and collected from just the County’s waste. It should be noted that under actual operation, County waste will likely be mixed with other sources of solid waste. We have further assumed that the collected landfill gas will be used on-site by a private party to generate electricity that will be transmitted to the grid. The analysis assumes that the County does not own the generation equipment itself.

PROJECTED ENERGY REVENUES
001640 | 11-01056-10004 | 6/8/2007 R. W. Beck 12-3
In developing an estimate of the amount of landfill gas that could be collected and burned to generate electricity for the planning period 2016 through 2036, we have utilized the estimated quantities of County waste discussed in Section 2. It is important to note that unlike the Conversion Facilities, where the energy revenues will accrue to the benefit of the County, the revenues from the sale of landfill gas will not be under the control of the County. This is because under the Waste Export Disposal Option it is assumed that the County will not own: 1) the land where the waste is disposed of, 2) the landfill gas collection and cleanup equipment, or 3) the electricity generation equipment. We are not able to determine whether the County will realize any financial benefit in the form of decreased tipping fees associated with the sale of the landfill gas or electricity therefrom. It has been our experience that the tipping fees charged by private waste disposal companies are more a function of what the market will allow rather than the net cost of operation.
It should also be noted that, as discussed in Section 10, landfill gas will continue to be generated in measurable quantities for more than 40 years after it has been disposed of in a landfill. Therefore, landfill gas will continue to be generated well after 2036, the end of this study period. We have calculated the energy revenues from landfill gas sales for only the period 2016 through 2036 in order to provide a comparison of revenues generated by landfill gas with the revenues estimated to be generated by the Conversion Facilities during the same time period. It is also worth noting that properly operated Conversion Facilities can be expected to have useful operating lives of up to 50 years, which is 30 years more than the planning period.
We have also utilized an existing computer model (called the “Landfill Gas Program”) which we previously developed. The Landfill Gas Program considers the annual quantity of waste disposed of, the moisture content, the organics content, a landfill gas generation rate coefficient factor, assumed number of Btus per cubic foot of gas generated, the biochemical methane potential expressed in cubic feet per pound, the percentage of landfill gas that is able to be collected, the generation period, and the amount of landfill gas required to generate a kWh of electricity. The Landfill Gas Program considers the fact that the amount of landfill gas generated from a specific delivery of solid waste generally peaks after the first five years in the landfill and decreases thereafter. It also considers the fact that additional quantities of solid waste are being disposed of during the study period. Therefore, while the amount of landfill gas generated by a specific delivery of solid waste decreases with time, the total amount of landfill gas generated will increase each year of the study period with additional deliveries of solid waste.
The results of our estimate of the annual quantities of landfill gas that could be generated and collected each year from just County waste are presented in Table 12-1.

Section 12
12-4 R. W. Beck 001640 | 11-01056-10004 | 6/8/2007
Table 12-1 Estimated Landfill Gas Generation
Year Tons of Waste
Landfilled
Amount of Landfill Gas Generated (cubic feet/
minute)
Amount of Landfill Gas
Collected (cubic feet/
minute)
MMBtu/hour Collected and Sold
2016 1,164,301 538 431 12 2017 1,186,079 1,414 1,131 31 2018 1,208,538 2,407 2,287 63 2019 1,225,386 3,463 3,290 91 2020 1,249,642 4,487 4,263 117 2021 1,255,030 5,407 5,137 149 2022 1,277,946 6,238 5,926 163 2023 1,275,651 6,990 6,641 183 2024 1,299,948 7,674 7,290 201 2025 1,324,825 8,319 7,903 218 2026 1,324,286 8,902 8,457 233 2027 1,349,746 9,438 8,966 247 2028 1,362,825 9,933 9,437 260 2029 1,389,346 10,406 9,886 272 2030 1,416,287 10,868 10,325 284 2031 1,438,772 11,321 10,755 296 2032 1,461,558 11,759 11,171 308 2033 1,484,647 12,194 11,584 319 2034 1,507,747 12,611 11,981 330 2035 1,531,144 13,019 12,368 341 2036 1,554,841 13,409 12,739 351
Projected Energy Prices R. W. Beck developed long-range energy price forecasts for: 1) the electricity that could be generated by the Conversion Facilities; and 2) the landfill gas produced by County waste at a landfill.
Presented below is a discussion of the methodology and principal assumptions we used to conduct the Pacific Northwest market price forecast. In preparing the price forecast, we have made certain assumptions with respect to conditions that may exist or events that may occur in the future. While we believe the use of these assumptions to be reasonable for the purposes of this report, we offer no other assurances with

PROJECTED ENERGY REVENUES
001640 | 11-01056-10004 | 6/8/2007 R. W. Beck 12-5
respect to these forecasts, and it should be anticipated that some future conditions may vary significantly from those assumed due to unanticipated events and circumstances. To the extent that future conditions differ from those assumed in the analysis, actual results and outcomes may vary from those projected.
Projected Electricity Prices We have assumed the Conversion Facilities will generate electricity which the County will be able to sell to reduce the cost of waste disposal. Presented below is the methodology that was used to project the price of electricity in the Pacific Northwest.
Methodology Energy Price Forecast The prices that utilities pay for electricity generated by plants such as the Conversion Facilities are generally comprised of both energy and capacity components. In some U.S. markets, energy and capacity can be traded separately, while in other markets energy and capacity prices are combined and traded as a single commodity. To forecast market-clearing prices, we used a customized PowerBase™ database and the MarketPower™ and PROMOD™ simulation models. The PowerBase database is updated by R. W. Beck to make the database consistent with our general knowledge of the North American power markets and to agree with the principal study assumptions outlined in this report.
The MarketPower model performs a chronological economic dispatch of the multiple, interconnected market areas, simulating all loads and resources, transmission interconnections, and unit outages on an hourly basis for all years of the projections. As part of the preparation of this report, the entire Western Electricity Coordinating Council Region (WECC) was modeled simultaneously. This includes the Northwest Power Pool subregion, the California-Mexico Power Area, the Arizona-New Mexico-Southern Nevada subregion, and the Rocky Mountain Power Area. From this simulation, the model produces hourly, monthly, and annual average energy prices for individual market areas. The model also simulates the mothballing of uneconomic plants, forecasts additions of new capacity, and calculates initial capacity prices.
We use the PROMOD production costing model to test and evaluate the market prices and the capacity forecast developed by MarketPower. PROMOD also allows for the creation of hourly prices that reflect a more sophisticated unit commitment and dispatch algorithm; this is because PROMOD uses more detailed operating characteristics of generation units than those used in MarketPower. We have found that using these particular models in combination produces better, more robust price forecasts and asset valuations.
In this report, the calculation of the market prices for energy assumes that energy prices are based on the variable operating cost of the highest cost unit serving load during each hour. The variable cost includes all fuel costs, variable operating and
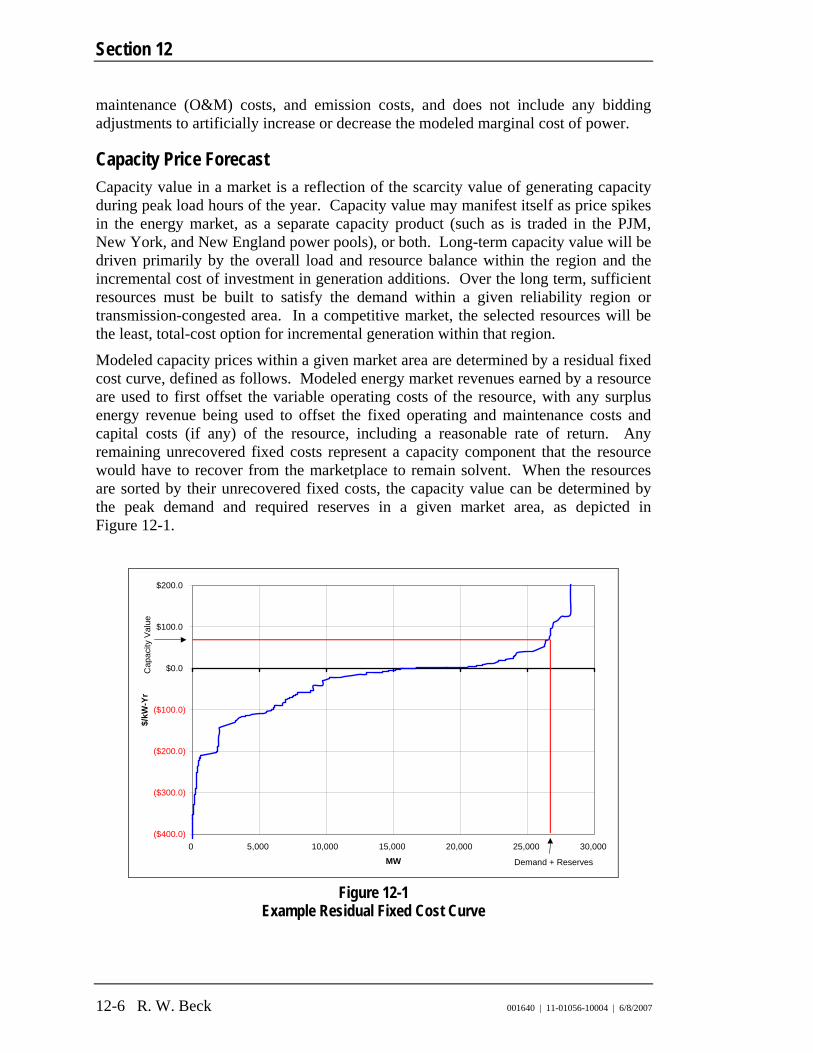
Section 12
12-6 R. W. Beck 001640 | 11-01056-10004 | 6/8/2007
maintenance (O&M) costs, and emission costs, and does not include any bidding adjustments to artificially increase or decrease the modeled marginal cost of power.
Capacity Price Forecast Capacity value in a market is a reflection of the scarcity value of generating capacity during peak load hours of the year. Capacity value may manifest itself as price spikes in the energy market, as a separate capacity product (such as is traded in the PJM, New York, and New England power pools), or both. Long-term capacity value will be driven primarily by the overall load and resource balance within the region and the incremental cost of investment in generation additions. Over the long term, sufficient resources must be built to satisfy the demand within a given reliability region or transmission-congested area. In a competitive market, the selected resources will be the least, total-cost option for incremental generation within that region.
Modeled capacity prices within a given market area are determined by a residual fixed cost curve, defined as follows. Modeled energy market revenues earned by a resource are used to first offset the variable operating costs of the resource, with any surplus energy revenue being used to offset the fixed operating and maintenance costs and capital costs (if any) of the resource, including a reasonable rate of return. Any remaining unrecovered fixed costs represent a capacity component that the resource would have to recover from the marketplace to remain solvent. When the resources are sorted by their unrecovered fixed costs, the capacity value can be determined by the peak demand and required reserves in a given market area, as depicted in Figure 12-1.
($400.0)
($300.0)
($200.0)
($100.0)
$0.0
$100.0
$200.0
0 5,000 10,000 15,000 20,000 25,000 30,000
MW
$/kW
-Yr
Cap
acity
Val
ue
Demand + Reserves
Figure 12-1 Example Residual Fixed Cost Curve

PROJECTED ENERGY REVENUES
001640 | 11-01056-10004 | 6/8/2007 R. W. Beck 12-7
Within a competitive market, and based on an assumption of equilibrium over the long term, sellers should be able to recover the full fixed costs of the most cost-effective capacity resource in the market. In markets where surplus supply exists, owners of existing generating assets should reasonably expect to recover all variable and fixed operating costs. If operating costs cannot be fully recovered from the market, then the resource is a candidate for mothballing or retirement. In markets where supply and demand are in equilibrium, owners of newly installed generating assets should reasonably expect to obtain all operating and capital costs, including a reasonable rate of return. Otherwise, no new resources would be built and the market would enter a period a supply deficiency under which demand for power could drive market prices to values exceeding long-run marginal costs. We assume that over the long term, total market prices will not exceed those required by the least-cost new entrant.
We have developed the wholesale power price forecast and all asset-specific projections for electricity that would be generated by the Conversion Facilities. The prices in the power price forecast are based on assumptions about future market conditions, such as load growth and fuel prices, which we have assumed to represent a reasonable expectation of future conditions.
Prices were developed for the Western Washington market area, which is a market area defined by transmission constraints which separate it from the British Columbia market to the north, Eastern Washington to the east, and Eastern and Western Oregon to the south. Appendix A explains the principal assumptions that we used in the development of the power price forecast.
The results of the power price forecast are presented in Table 12-2.

Section 12
12-8 R. W. Beck 001640 | 11-01056-10004 | 6/8/2007
Table 12-2 Base Case Power Price Forecast
($2007 per MWh)
Year All-Hours Price
2007 49.87 2008 49.09 2009 44.86 2010 45.03 2011 46.82 2012 46.29 2013 46.62 2014 52.90 2015 52.31 2016 55.23 2017 56.73 2018 54.47 2019 54.09 2020 54.41 2021 54.59 2022 55.43 2023 56.45 2024 57.46 2025 56.66 2026 56.91 2027 57.24 2028 57.58 2029 57.91 2030 58.24 2031 58.58 2032 58.92 2033 59.26 2034 59.61 2035 59.95 2036 60.30
Note: Inflation assumed to be 2.4% per year

PROJECTED ENERGY REVENUES
001640 | 11-01056-10004 | 6/8/2007 R. W. Beck 12-9
Implied Value of Landfill Gas We have developed an estimate of the implied value of landfill gas based on: 1) the estimated power price forecast presented in Table 12-2, 2) the estimated operation and maintenance expenses incurred by a new landfill gas-fired generator, and 3) the required return on the capital investment to construct a new landfill gas-fired generator. We started with the assumption that the landfill gas-fired generator will be owned by a private third party and the calculation of energy revenues for the Waste Export Disposal Option is based on the sale of the landfill gas to the third party electricity generator.
Based on these assumptions, the implied valuation of landfill gas is presented in Table 12-3.
Table 12-3 Implied Value of Landfill Gas
($2007 per MMBtu)
Year Price
2016 2.80 2017 3.15 2018 2.97 2019 3.06 2020 3.26 2021 3.44 2022 3.73 2023 4.06 2024 4.40 2025 4.44 2026 4.67 2027 4.92 2028 5.17 2029 5.43 2030 5.70 2031 5.98 2032 6.26 2033 6.56 2034 6.86 2035 7.18 2036 7.50
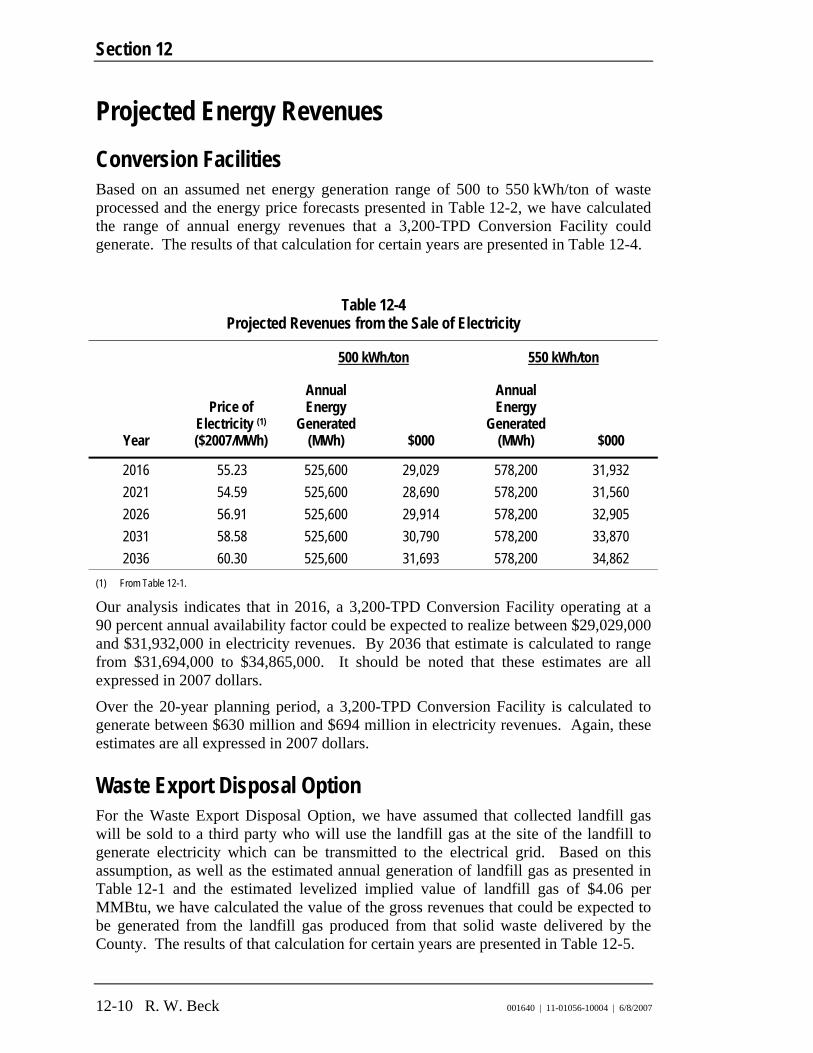
Section 12
12-10 R. W. Beck 001640 | 11-01056-10004 | 6/8/2007
Projected Energy Revenues Conversion Facilities Based on an assumed net energy generation range of 500 to 550 kWh/ton of waste processed and the energy price forecasts presented in Table 12-2, we have calculated the range of annual energy revenues that a 3,200-TPD Conversion Facility could generate. The results of that calculation for certain years are presented in Table 12-4.
Table 12-4 Projected Revenues from the Sale of Electricity
500 kWh/ton 550 kWh/ton
Year
Price of Electricity (1) ($2007/MWh)
Annual Energy
Generated (MWh) $000
Annual Energy
Generated (MWh) $000
2016 55.23 525,600 29,029 578,200 31,932 2021 54.59 525,600 28,690 578,200 31,560 2026 56.91 525,600 29,914 578,200 32,905 2031 58.58 525,600 30,790 578,200 33,870 2036 60.30 525,600 31,693 578,200 34,862
(1) From Table 12-1.
Our analysis indicates that in 2016, a 3,200-TPD Conversion Facility operating at a 90 percent annual availability factor could be expected to realize between $29,029,000 and $31,932,000 in electricity revenues. By 2036 that estimate is calculated to range from $31,694,000 to $34,865,000. It should be noted that these estimates are all expressed in 2007 dollars.
Over the 20-year planning period, a 3,200-TPD Conversion Facility is calculated to generate between $630 million and $694 million in electricity revenues. Again, these estimates are all expressed in 2007 dollars.
Waste Export Disposal Option For the Waste Export Disposal Option, we have assumed that collected landfill gas will be sold to a third party who will use the landfill gas at the site of the landfill to generate electricity which can be transmitted to the electrical grid. Based on this assumption, as well as the estimated annual generation of landfill gas as presented in Table 12-1 and the estimated levelized implied value of landfill gas of $4.06 per MMBtu, we have calculated the value of the gross revenues that could be expected to be generated from the landfill gas produced from that solid waste delivered by the County. The results of that calculation for certain years are presented in Table 12-5.
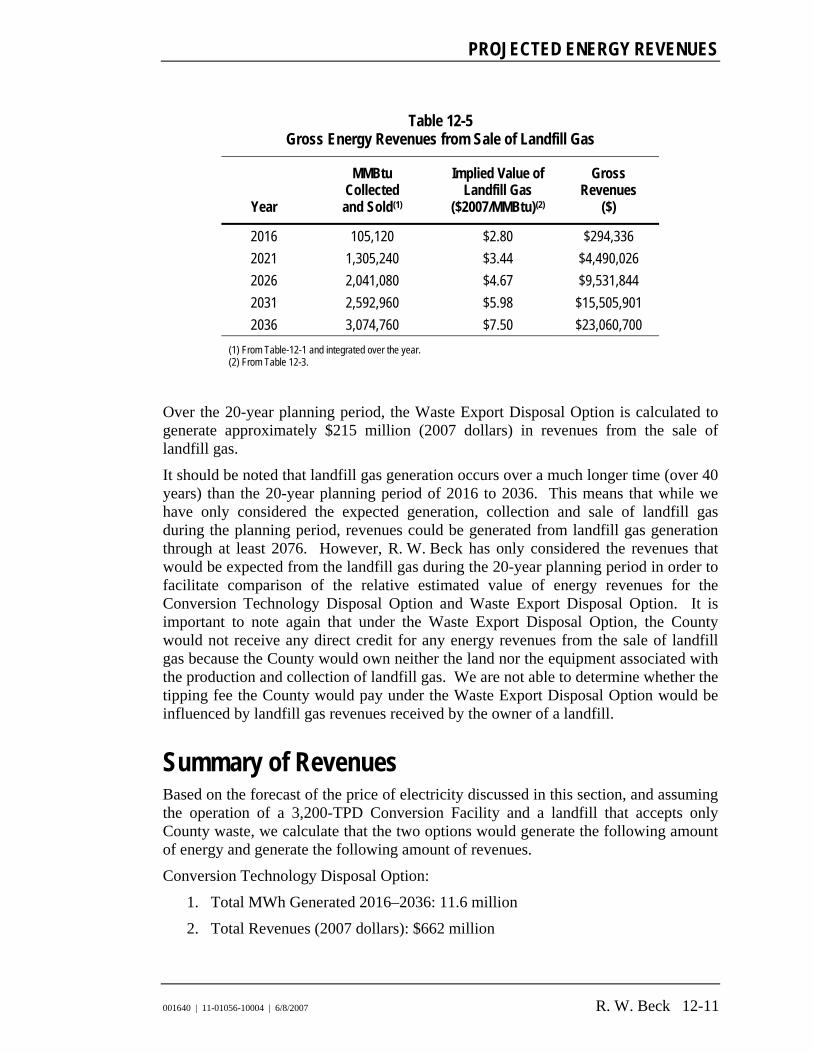
PROJECTED ENERGY REVENUES
001640 | 11-01056-10004 | 6/8/2007 R. W. Beck 12-11
Table 12-5 Gross Energy Revenues from Sale of Landfill Gas
Year
MMBtu Collected and Sold(1)
Implied Value of Landfill Gas
($2007/MMBtu)(2)
Gross Revenues
($)
2016 105,120 $2.80 $294,336 2021 1,305,240 $3.44 $4,490,026 2026 2,041,080 $4.67 $9,531,844 2031 2,592,960 $5.98 $15,505,901 2036 3,074,760 $7.50 $23,060,700
(1) From Table-12-1 and integrated over the year. (2) From Table 12-3.
Over the 20-year planning period, the Waste Export Disposal Option is calculated to generate approximately $215 million (2007 dollars) in revenues from the sale of landfill gas.
It should be noted that landfill gas generation occurs over a much longer time (over 40 years) than the 20-year planning period of 2016 to 2036. This means that while we have only considered the expected generation, collection and sale of landfill gas during the planning period, revenues could be generated from landfill gas generation through at least 2076. However, R. W. Beck has only considered the revenues that would be expected from the landfill gas during the 20-year planning period in order to facilitate comparison of the relative estimated value of energy revenues for the Conversion Technology Disposal Option and Waste Export Disposal Option. It is important to note again that under the Waste Export Disposal Option, the County would not receive any direct credit for any energy revenues from the sale of landfill gas because the County would own neither the land nor the equipment associated with the production and collection of landfill gas. We are not able to determine whether the tipping fee the County would pay under the Waste Export Disposal Option would be influenced by landfill gas revenues received by the owner of a landfill.
Summary of Revenues Based on the forecast of the price of electricity discussed in this section, and assuming the operation of a 3,200-TPD Conversion Facility and a landfill that accepts only County waste, we calculate that the two options would generate the following amount of energy and generate the following amount of revenues.
Conversion Technology Disposal Option:
1. Total MWh Generated 2016–2036: 11.6 million
2. Total Revenues (2007 dollars): $662 million

Section 12
12-12 R. W. Beck 001640 | 11-01056-10004 | 6/8/2007
Waste Export Disposal Option:
1. Total MMBtu generated 2016–2036: 39 million
2. Total Revenues (2007 dollars): $215 million
In reviewing the calculation of energy revenues, it is important to note the following:
1. For the purpose of this comparative analysis under the Waste Export Disposal Option, we have assumed the County will stop delivering solid waste to the out-of-county landfill in 2036.
2. The landfill can be expected to continue to generate landfill gas for at least 40 years after 2036, but we have not included years beyond the study period of 2016 to 2036.
3. The Conversion Facilities can be expected to have a useful operating life of 50 years if properly operated and maintained. This would extend the period of electricity generation for 30 years after 2036, but we have not included years beyond the study period of 2016 to 2036.
4. The County can expect to realize the financial benefits of generating electricity, as we have assumed it will own the Conversion Facility.
5. The County will not own the land or equipment associated with the generation of landfill gas. We cannot determine how likely it is that the County would realize any financial benefit from the generation and collection of landfill gas produced from County waste at a privately owned landfill.

Section 13 TRANSFER STATION COLLECTION/
TRANSPORTATION INFRASTRUCTURE

001640 | 11-01056-10004 | 6/8/2007
Section 13 TRANSFER STATION COLLECTION/
TRANSPORTATION INFRASTRUCTURE
This section of the report presents a review of the compatibility of the County’s planned transfer station and transportation infrastructure with the implementation of a Conversion Facility in the County if a decision was made at some future time to implement this disposal option.
Conversion Technology Implementation As described in Section 6, we have assumed that if a Conversion Facility were implemented, the County would construct a single Conversion Facility regardless of the technology employed. We have also assumed that the Conversion Facility would be located in an industrially zoned area away from residential neighborhoods, and that this site would not be any more remote from County transfer stations than the current location of the Cedar Hills Regional Landfill. In such a case, we believe the recommendations outlined in the County’s Waste Export Plan, that the County should have seven transfer stations in the County (new stations at Bow Lake, Northeast Lake Washington, South County, First Northeast and Factoria/Eastgate and existing stations at Enumclaw and Vashon Island), would correlate well with the implementation of any of the three Conversion Technologies. This scenario will meet the waste transfer priorities of the County as laid out in the Waste Export Plan, and would result in efficient consolidation and transport of waste to a Conversion Facility.
One potential deviation from the Waste Export Plan that could make sense would be to replace one of the planned new stations with the Conversion Facility. Replacement is a potentially viable way to reduce the County’s overall capital expenditures and allow for the siting of only one larger facility instead of two separate facilities. In this instance, the Conversion Facility would need a separate on-site public drop-off area for self-haul and commercial customers and would also need to accommodate transfer trailers from the other County transfer stations. This approach would require a larger site than would be necessary for either of the facilities on their own, but it could provide advantages in economies of scale and decreased overall siting efforts. Also the capital cost of such a facility would likely be significantly less that the combined cost of the facilities individually.
According to the Waste Export Plan, “limited intermodal truck-to-rail capacity in the region” and “prospects for greater competition for this limited resource in the years ahead” are important considerations in determining whether to procure a County-owned intermodal facility. If the County were to determine this facility was necessary for the Waste Export Disposal Option, an intermodal facility designed to load a full

Section 13
13-2 R. W. Beck 001640 | 11-01056-10004 | 6/8/2007
train would be required. However, if a Conversion Technology was employed in the County for waste disposal, a County-owned intermodal facility would not likely be needed even if rail long-haul is determined to be the best method for transport of the resulting residue ash and bypass waste for disposal. Implementing a Conversion Technology would result in a far smaller quantity of residue ash and any bypass waste than the amount of export waste envisioned in the Waste Export Plan. It is difficult to economically downsize an intermodal facility, since this type of facility is typically sized in order to load a full-length train. With the reduced rail-haul needs of the Conversion Facility, economics would not favor a dedicated intermodal facility for the County. In this situation the County should consider contracting for private intermodal services utilizing the existing intermodal capabilities in the region.
Conclusions If the County at some future time chooses to implement a Conversion Facility as the primary disposal method in the County, the planned transfer station and transportation infrastructure described in the Waste Export Plan would correspond well with such a disposal method. The County may be able to reduce capital costs and increase operating efficiency by replacing one of its planned transfer stations with a Conversion Facility, as long as a separate self-haul drop-off facility was included on the site. Considering the projected quantities of Conversion Facility residue and bypass waste, it would make sense for the County to consider contracting for intermodal facility services to export this material to an out-of-county disposal site, rather than siting and building a County-owned intermodal facility for this purpose.

Section 14 ESTIMATED FACILITY SITING
AND PERMITTING COSTS

001640 | 11-01056-10004 | 6/8/2007
Section 14 ESTIMATED FACILITY SITING AND
PERMITTING COSTS
This section of the report presents planning estimates of the costs the County may incur as part of the siting and permitting efforts for the implementation of both the Conversion Technology and Waste Export Disposal Options.
Conversion Technology Implementation If the County decides to implement a Conversion Technology, the siting of a Conversion Facility could be a controversial issue for a variety of reasons. The siting of a Conversion Facility will require that the County consider major policy issues involving land use, traffic impact, noise, odor, host community benefits, and air emissions. In order to properly address these matters, in addition to County staff, the County will likely require the use of a team of professionals with experience in community involvement, traffic engineering, environmental engineering, air quality analysis, civil/structural engineering, and environmental law. Our previous experience has indicated that selecting a site and obtaining the necessary permits to begin construction can take three to four years, or more.
Some specific activities that will be of particular importance to the County related to the siting of a Conversion Facility include, but are not limited to:
Industrial zoning
Access to road and rail infrastructure
Topography
Utility availability including access to electrical transmission lines, water and sewer
Sensitive areas
Adjacent property uses
Current site uses
Site area (size)
Traffic analysis
Environmental impact studies
Environmental site assessments
Hydrologic studies of the selected site

Section 14
14-2 R. W. Beck 001640 | 11-01056-10004 | 6/8/2007
Site layout
Preliminary conceptual design
Permit applications
Proximity to schools, hospitals, nursing homes, and residential housing
Permitting a Conversion Facility would also likely require a significant amount of effort on the part of the County. Prior to application for the standard building and operational permits, a State Environmental Policy Act (SEPA) environmental review would be necessary as a first step in obtaining environmental and land use permits. Because of the height of Conversion Facilities (as much as 200 feet considering the flue gas stack), it is very likely that a variance would be needed from the height restrictions under the zoning ordinance. The SEPA environmental review would without doubt involve a project-level Environmental Impact Statement (EIS). While not incorporated into our cost estimate, if the project-level EIS was appealed it would add significantly to the legal fees and extend the timeline for approval. Also, since the implementation of a Conversion Technology would be a deviation from the County’s current Comprehensive Solid Waste Management Plan, a programmatic EIS would also be necessary for a revision to that plan.
For these reasons it will be important for the County to establish a realistic siting, land use, and environmental permitting timeline and to have reasonable expectations of the level of effort and expense to site and permit a Conversion Facility. We expect that the duration for such efforts would be at least 36 to 60 months. A preliminary planning estimate of the range of costs to obtain permits is outlined in Table 14-1. These costs could vary significantly depending on the location of the facility, the type of technology employed, and a variety of other factors that require further review and consideration by the County. Also, these cost estimates assume a modest amount of air permitting and significant meteorological data already available for the site.
Table 14-1 Estimated Siting and Permitting Costs for Conversion Technologies
Cost Range ($2007) Assumptions
County Staff Cost $800,000 to $1,400,000 1 FTE for 4-7 Years, $200,000/year Legal Fees $300,000 Outside Legal Expertise, $300/hour, 1000 hours Programmatic EIS $300,000 to $400,000 Project-Level EIS $600,000 to $1,000,000 Includes traffic and other supporting studies Siting/Conceptual Design $500,000 to $600,000 Includes supporting geologic studies Permitting $500,000 Includes $100,000 for NOC Air Quality permit Total Cost $3,000,000 to $4,200,000

ESTIMATED FACILITY SITING AND PERMITTING COSTS
001640 | 11-01056-10004 | 6/8/2007 R. W. Beck 14-3
Waste Export Implementation If the County chooses to design and construct an intermodal facility, siting and permitting will likely be somewhat less complex than that associated with the siting of a Conversion Facility. Nevertheless, it should be anticipated that this option will also have challenges. Since, an intermodal facility would not require the extensive air and environmental permits required by a Conversion Facility, certain permitting aspects will not be required. However, the County should expect citizens near the selected site to express concerns with traffic, noise, odors, litter, and vectors. While an intermodal facility will not have the tall stacks and visual impact of a Conversion Facility, the same number of collection vehicles will be accessing the site.
One of the biggest issues with siting an intermodal facility is its need for immediate access to one or both railroads. This will significantly limit the number of viable sites and constrain the County’s siting flexibility. The County will also need to negotiate connection agreements with railroads that must be in place prior to financing and commencement of construction. We expect that the duration for successfully siting and permitting an intermodal facility would be 18 to 48 months. A planning estimate of the range of costs to obtain the required permits is outlined in Table 14-2.
Table 14-2 Estimated Siting and Permitting Costs for an Intermodal Facility
Cost Range ($2007) Assumptions
County Staff Cost $300,000 to $800,000 1 FTE for 1.5 to 4 Years, $200,000/year Legal Fees $100,000 County Legal, .33 years, $300,000/year SEPA Compliance $150,000 to $500,000 Checklist/DNS or EIS (higher end of range).
Includes traffic and other supporting studies Siting/Conceptual Design $100,000 to $200,000 Includes supporting geologic studies Permitting $100,000 Negotiations with Railroad $100,000 Total Cost $800,000 to $1,800,000
Conclusions It is likely that the siting and permitting efforts for implementation of a Conversion Technology would be extensive and would require several years of effort. While these efforts would be somewhat less extensive for an intermodal facility in the County as a part of the Waste Export Disposal Option, they would still last for more than a year and a half and could cost nearly $2 million.

Section 15 COMPARATIVE COST ANALYSIS

001640 | 11-01056-10004 | 6/8/2007
Section 15 COMPARATIVE COST ANALYSIS
This section of the report presents a summary of the comparative cost analysis done to allow comparison of the costs of the various options. The analysis considers cost and revenue assumptions, as presented in previous sections of this report, and calculates both a Net Present Value and a Net Present Value per ton for each Conversion Technology and for the Waste Export Disposal Option. While these Net Present Values do not represent the actual costs of the options, they are used to place each option on a time equivalent basis that considers the time value of money in the comparison.
Financial Model A financial model was prepared to determine the range of costs and revenues of each option and technology for the duration of the study period. The model considers most of the aspects discussed in previous sections of this report including tonnage requiring disposal, tonnage processed, bypassed waste, residue ash, and energy generation. Based on the assumptions previously outlined, ranges of costs and revenues were calculated and combined for each year of the study period. Finally, the Net Present Values were calculated to facilitate comparison between options. The financial models for each option (both the low end and high end of the cost range) are presented in Exhibit 15-1 at the end of this section.
Comparative Cost Assumptions Operating Revenues The basis of the estimate of annual energy revenues for all disposal options is discussed in Section 12. Note that for the purpose of this report, we have included only the forecasted electricity revenues. In reality, the Conversion Technologies should also be able to realize additional operating revenues, as follows:
1. The RDF facility may be able to realize revenues from:
a. The recovery of aluminum cans, if the design of the facility includes eddy current separators as part of the front-end processing equipment, and
b. Pre-combustion ferrous metal, if the design of the facility includes magnets as part of the front-end processing equipment.
2. All of the Conversion Technologies should be able to realize revenues from the sale of ferrous and non-ferrous metals recovered from the residue ash. The

Section 15
15-2 R. W. Beck 001640 | 11-01056-10004 | 6/8/2007
value of these metals will vary significantly during the planning period, depending on the price of scrap metal. Some currently operating Conversion Facilities receive approximately $1 million per year for recovered ferrous and non-ferrous metals.
3. The advanced thermal recycling facility should be able to realize revenues from the sale of gypsum and hydrochloric acid recovered from the flue gas scrubbing systems.
For the purpose of our analysis, we have assumed the Conversion Facilities will realize energy revenues based on energy efficiencies of 500 kWh/ton on the low end and 550 kWh/ton on the high end. Since the energy produces revenue, the high end of the range is considered in determining the low cost and the low end is considered in determining the high cost.
Note that energy revenues for the Waste Export Disposal Option are not carried forward in this analysis. Since the County will have no control over the landfill gas revenues, we are unable to determine the likelihood that such revenues will accrue to the benefit of the County. In our experience, tipping fees are based more on market conditions than the actual net cost of disposal.
Annual Operating and Maintenance Expenses The estimated operating and maintenance expenses of the waste disposal options are discussed in Section 11. Included in our analysis are the general operation and maintenance costs, the cost of residue ash disposal assuming approximately 25 percent of the incoming waste by weight leaves as residue ash, and the cost of bypassed waste disposal is the same as the assumed cost for the Waste Export Option of $45 to $50 per ton.
For the purpose of developing the comparative analysis for each disposal option, we also escalated the costs by 2.4 percent per year to account for inflation.
Annual Debt Service Payment In order to convert the estimated capital costs of the Conversion Technologies into a cost per ton of solid waste processed, we have developed an estimate of the total annual debt service payment associated with each of the Conversion Technologies. The annual debt service payment is incorporated in the financial model for each option and considered as a part of the comparative cost analysis.
To develop an estimate of the annual debt service payment, we first escalated the capital cost estimates of the options from 2007 dollars to 2013 dollars since the debt is assumed to be issued in 2013 at the start of construction, assuming a three-year construction period. The next step is to determine the Total Financing Requirement (TFR), which represents the total amount of revenue bonds that will have to be issued to pay for the cost of a Conversion Facility. The TFR is calculated in accordance with the following formula:

COMPARATIVE COST ANALYSIS
001640 | 11-01056-10004 | 6/8/2007 R. W. Beck 15-3
TFR = TCC + CI + DSRF + COI – IERF
where:
TFR = Total Financing Requirement
TCC = Total capital cost of the Conversion Facility
CI = Capitalized interest for the three-year construction period
DSRF = Debt Service Reserve Fund
COI = Cost of insurance of the revenue bonds, assumed to include underwriter’s discount, legal fees, printing expenses, Independent Engineer’s Report, etc.
IERF = Interest earnings on reserve funds
For the purpose of this report, we have assumed the County will issue revenue bonds with the following provisions:
1. Interest rate: 5 percent
2. Total term of the bonds: 23 years
3. Period of capitalized interest: 3 years
4. Levelized debt service payments for 20 years, commencing at the end of the construction period
5. Debt Service Reserve Fund: one year’s debt service payment
6. Cost of Issuance: 3 percent of the TFR
7. Interest Earnings on Reserve Funds: accrue at 4.75 percent
8. Capital Recovery Factor (based on 20-year levelized payments and 5 percent interest): .0802426
Based on these inputs and assumptions, the actual formulas utilized for the calculation of TFR are shown below.
CI = 3(.05 × TFR)
DSRF = .0802426 × TFR
COI = .03 × TFR
IERF1 = (3 × .0475) × (DSRF + CI / 2 + TCC / 2)
Therefore:
TFR = TCC × 3(.05 × TFR) + .0802426 × TFR + .03 × TFR – (3 × .0475) × [(.0802426 × TFR) + 3(.05 × TFR) / 2 + TCC / 2]
TFR = 1.219024 × TCC
1 Interest earnings on the decreasing balances of CI and TCC are approximated by assuming that interest is earned on half of the original balance for the duration of the construction period.

Section 15
15-4 R. W. Beck 001640 | 11-01056-10004 | 6/8/2007
Following the determination of the TFR, that amount is multiplied by the Capital Recovery Factor of .0802426 to determine the Annual Debt Service Payment. From this Annual Debt Service Payment we subtract interest earnings from reserve funds to determine the Net Annual Debt Service Payment.
The results of the calculations are summarized in Table 15-1. As can be seen in the table, the same basic formula and approach was also used to develop an estimate of the annual debt service payment associated with the capital cost of constructing and equipping an intermodal facility as part of the Waste Export Disposal Option.
Table 15-1 Estimated Capital Costs
Estimated Capital Costs Total Financing
Requirement Net Annual Debt Service Payment
Conversion Technology ($2007 millions) ($2013 millions)1 ($2013 millions) ($2013 millions)
Mass Burn $460 – $520 $530 – $600 $647 – $731 $49 – $56 RDF $560 – $610 $646 – $703 $787 – $857 $60 – $66 Advanced Thermal Recycling $520 – $560 $600 – $646 $731 – $787 $56 – $60 Waste Export $16.5 $19.0 $23.1 $1.8 1. Values are escalated from 2007 estimates to 2013 estimates using an inflation of 2.4% per year.
Note that once the County has made a capital investment in 2013 (the assumed start of the construction period), the annual recovery of the capital cost of that investment is assumed to be fixed during the first 20-year operating period of the Conversion Facility. Therefore, while the operating and maintenance expenses of the Conversion Facilities and the Waste Export Disposal Option, and the operating revenues of the Conversion Facilities, will all be increasing over the 20-year period, the annual capital cost component will remain fixed once the revenue bonds have been issued.
Total Net Annual Costs We have developed estimates of the Total Net Annual Costs for each disposal option, the results of which are presented in Exhibit 15-1. The estimate of the Total Net Annual Cost is equal to the Operating and Maintenance Expenses plus Annual Net Debt Service Payment less the Annual Energy Revenues. The Total Net Annual Cost was divided by the total annual quantity of waste requiring disposal in any given year to calculate the Total Net Annual Cost per ton.
Net Present Value To assist the County in its evaluation of the comparative costs presented here, we have developed a net present value (NPV) calculation of the net annual revenue requirement for each option. The NPV calculation discounts the future net annual revenue requirement for each option during the 20-year study period based on a

COMPARATIVE COST ANALYSIS
001640 | 11-01056-10004 | 6/8/2007 R. W. Beck 15-5
discount factor. We used a discount factor of 5 percent in this analysis as that represents the County’s assumed cost of borrowing. We also used 2016 as the base year for the analysis because it is the first year that the County would incur expenses or realize revenues from either option.
Net present value is a tool used to compare different alternatives where expenditures vary substantially over time. By using net present values, we can compare the significant but decreasing (over time) capital cost of the Conversion Technology Disposal Options against the more consistent, contract-based Waste Export Disposal Option. It is important to recognize that the NPV is not an estimate of the actual cost to the County of either disposal option; it is an estimate of the value of the option considering the time value of money. The results of the NPV calculation are shown on Exhibit 15-1 and are summarized in Table 15-2.
Table 15-2 Summary of Net Present Value Calculation
Disposal Option Total Net Present Value Cost ($2016 millions)
Net Present Value Cost per Ton
($2016)
Mass Burn $1,116 – $1,550 $42 – $58 RDF $1,570 – $1,967 $59 – $74 Advanced Thermal Recycling $1,443 – $1,875 $54 – $70 Waste Export $1,136 – $1,263 $43 – $47
Conclusions Based on the very preliminary planning estimates presented in this report, the estimated net present value (in 2016 dollars) of disposal for the four options is close enough that it would be difficult to eliminate any of the disposal options at this time based solely on cost.

Exhibit 15-1 Page 1MASS BURN COSTS - Low End2007 MetricsStarting Facility Capacity 1,051,200 tons per yearPercent Residue Ash 25.0%Energy Generation 550 kWh/tonUnit O&M Cost $29.00 per ton ProcessedResidue Ash Management $40.00 per ton ResidueByPassed Waste Management $45.00 per ton Bypassed
YEAR 2016 2017 2018 2019 2020 2021 2022 2023 2024 2025 2026 2027 2028 2029 2030 2031 2032 2033 2034 2035Unit CostsUnit Operation & Maintenance $35.90 $36.76 $37.64 $38.55 $39.47 $40.42 $41.39 $42.38 $43.40 $44.44 $45.51 $46.60 $47.72 $48.86 $50.04 $51.24 $52.47 $53.73 $55.02 $56.34Unit Residue Ash Management $49.52 $50.71 $51.92 $53.17 $54.45 $55.75 $57.09 $58.46 $59.86 $61.30 $62.77 $64.28 $65.82 $67.40 $69.02 $70.67 $72.37 $74.11 $75.89 $77.71Unit ByPassed Waste Management $49.52 $50.71 $51.92 $53.17 $54.45 $55.75 $57.09 $58.46 $59.86 $61.30 $62.77 $64.28 $65.82 $67.40 $69.02 $70.67 $72.37 $74.11 $75.89 $77.71Energy Price ($/MWh) $68.37 $71.91 $70.70 $71.89 $74.06 $76.08 $79.11 $82.50 $85.99 $86.84 $89.31 $91.99 $94.74 $97.58 $100.50 $103.50 $106.60 $109.79 $113.08 $116.46TonnagesTonnage Requiring Disposal 1,164,301 1,186,079 1,208,538 1,225,386 1,249,642 1,255,030 1,277,946 1,275,651 1,299,948 1,324,825 1,324,286 1,349,746 1,362,825 1,389,346 1,416,287 1,438,772 1,461,558 1,484,647 1,507,747 1,531,144Tonnage Processed 1,051,200 1,051,200 1,051,200 1,051,200 1,051,200 1,051,200 1,051,200 1,051,200 1,051,200 1,051,200 1,051,200 1,051,200 1,051,200 1,051,200 1,051,200 1,051,200 1,051,200 1,051,200 1,051,200 1,051,200Tonnage Bypassed 113,101 134,879 157,338 174,186 198,442 203,830 226,746 224,451 248,748 273,625 273,086 298,546 311,625 338,146 365,087 387,572 410,358 433,447 456,547 479,944Residue Ash Tonnage 262,800 262,800 262,800 262,800 262,800 262,800 262,800 262,800 262,800 262,800 262,800 262,800 262,800 262,800 262,800 262,800 262,800 262,800 262,800 262,800Energy Generated (MWh) 578,160 578,160 578,160 578,160 578,160 578,160 578,160 578,160 578,160 578,160 578,160 578,160 578,160 578,160 578,160 578,160 578,160 578,160 578,160 578,160Total CostsTotal Operation & Maintenance 37,738,355 43,602,479 45,494,388 47,235,704 49,326,812 50,728,439 52,894,419 54,066,615 56,418,722 58,878,364 60,266,915 62,899,788 65,033,508 67,890,258 70,867,689 73,720,612 76,685,450 79,766,415 82,951,702 86,260,669Total Residue Ash Management 13,013,226 13,325,543 13,645,356 13,972,845 14,308,193 14,651,590 15,003,228 15,363,305 15,732,025 16,109,593 16,496,223 16,892,133 17,297,544 17,712,685 18,137,789 18,573,096 19,018,851 19,475,303 19,942,710 20,421,335ByPassed Waste Disposal 5,600,490 6,839,178 8,169,456 9,261,316 10,804,210 11,363,902 12,944,908 13,121,420 14,890,828 16,773,164 17,141,886 19,189,797 20,511,214 22,790,995 25,197,379 27,391,218 29,697,631 32,121,430 34,645,299 37,294,891Debt Service 49,412,864 49,412,864 49,412,864 49,412,864 49,412,864 49,412,864 49,412,864 49,412,864 49,412,864 49,412,864 49,412,864 49,412,864 49,412,864 49,412,864 49,412,864 49,412,864 49,412,864 49,412,864 49,412,864 49,412,864Total Cost 105,764,935 113,180,064 116,722,065 119,882,729 123,852,079 126,156,795 130,255,419 131,964,204 136,454,438 141,173,985 143,317,889 148,394,582 152,255,130 157,806,802 163,615,721 169,097,791 174,814,796 180,776,012 186,952,575 193,389,759less Energy Revenue 39,529,441 41,577,147 40,878,600 41,566,029 42,819,998 43,987,535 45,737,451 47,698,704 49,718,401 50,206,110 51,637,450 53,183,068 54,774,949 56,414,479 58,103,084 59,842,233 61,633,439 63,478,260 65,378,301 67,335,214
Total Net Annual Cost $66,235,494 $71,602,917 $75,843,464 $78,316,700 $81,032,081 $82,169,260 $84,517,968 $84,265,501 $86,736,038 $90,967,874 $91,680,438 $95,211,514 $97,480,181 $101,392,323 $105,512,637 $109,255,558 $113,181,357 $117,297,752 $121,574,275 $126,054,545Total Net Annual Cost per ton $56.89 $60.37 $62.76 $63.91 $64.84 $65.47 $66.14 $66.06 $66.72 $68.66 $69.23 $70.54 $71.53 $72.98 $74.50 $75.94 $77.44 $79.01 $80.63 $82.33
Total CostTotal Cost per tonEnergy RevenueEnergy Revenue per tonTotal Net Present ValueNet Present Value per ton
$23.05$1,115,710,063
$41.73
Key Net Present Values$1,731,840,267
$64.78$616,130,204
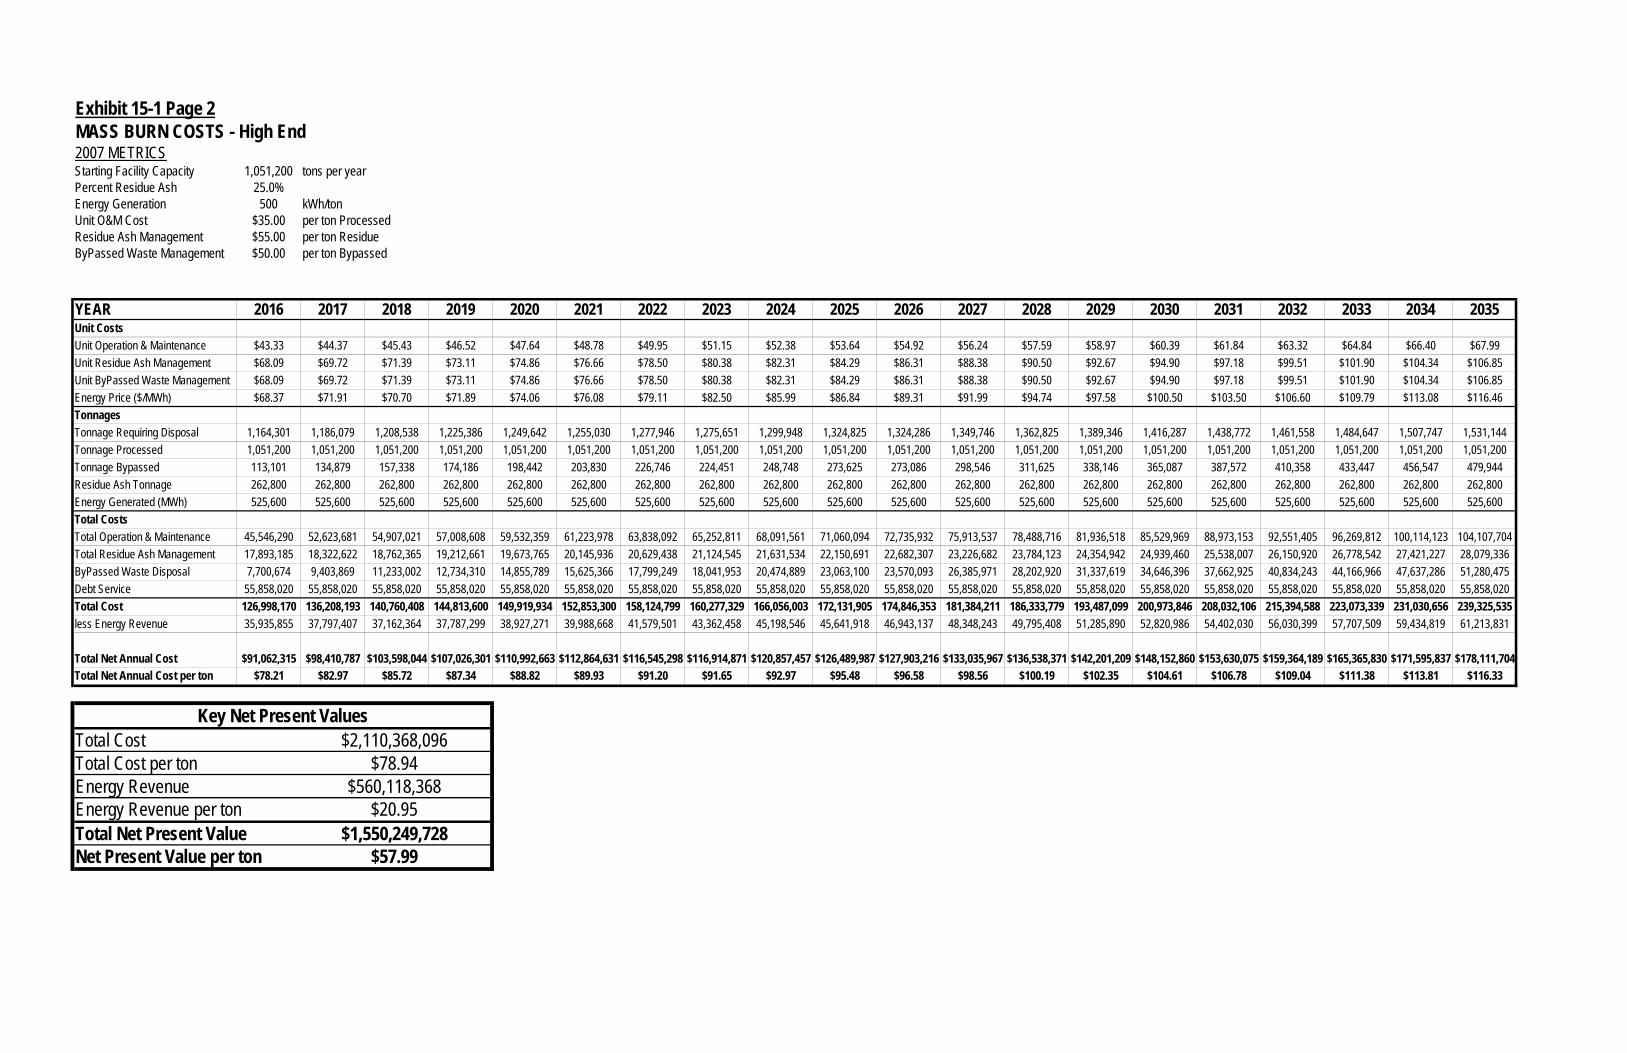
Exhibit 15-1 Page 2MASS BURN COSTS - High End2007 METRICSStarting Facility Capacity 1,051,200 tons per yearPercent Residue Ash 25.0%Energy Generation 500 kWh/tonUnit O&M Cost $35.00 per ton ProcessedResidue Ash Management $55.00 per ton ResidueByPassed Waste Management $50.00 per ton Bypassed
YEAR 2016 2017 2018 2019 2020 2021 2022 2023 2024 2025 2026 2027 2028 2029 2030 2031 2032 2033 2034 2035Unit CostsUnit Operation & Maintenance $43.33 $44.37 $45.43 $46.52 $47.64 $48.78 $49.95 $51.15 $52.38 $53.64 $54.92 $56.24 $57.59 $58.97 $60.39 $61.84 $63.32 $64.84 $66.40 $67.99Unit Residue Ash Management $68.09 $69.72 $71.39 $73.11 $74.86 $76.66 $78.50 $80.38 $82.31 $84.29 $86.31 $88.38 $90.50 $92.67 $94.90 $97.18 $99.51 $101.90 $104.34 $106.85Unit ByPassed Waste Management $68.09 $69.72 $71.39 $73.11 $74.86 $76.66 $78.50 $80.38 $82.31 $84.29 $86.31 $88.38 $90.50 $92.67 $94.90 $97.18 $99.51 $101.90 $104.34 $106.85Energy Price ($/MWh) $68.37 $71.91 $70.70 $71.89 $74.06 $76.08 $79.11 $82.50 $85.99 $86.84 $89.31 $91.99 $94.74 $97.58 $100.50 $103.50 $106.60 $109.79 $113.08 $116.46TonnagesTonnage Requiring Disposal 1,164,301 1,186,079 1,208,538 1,225,386 1,249,642 1,255,030 1,277,946 1,275,651 1,299,948 1,324,825 1,324,286 1,349,746 1,362,825 1,389,346 1,416,287 1,438,772 1,461,558 1,484,647 1,507,747 1,531,144Tonnage Processed 1,051,200 1,051,200 1,051,200 1,051,200 1,051,200 1,051,200 1,051,200 1,051,200 1,051,200 1,051,200 1,051,200 1,051,200 1,051,200 1,051,200 1,051,200 1,051,200 1,051,200 1,051,200 1,051,200 1,051,200Tonnage Bypassed 113,101 134,879 157,338 174,186 198,442 203,830 226,746 224,451 248,748 273,625 273,086 298,546 311,625 338,146 365,087 387,572 410,358 433,447 456,547 479,944Residue Ash Tonnage 262,800 262,800 262,800 262,800 262,800 262,800 262,800 262,800 262,800 262,800 262,800 262,800 262,800 262,800 262,800 262,800 262,800 262,800 262,800 262,800Energy Generated (MWh) 525,600 525,600 525,600 525,600 525,600 525,600 525,600 525,600 525,600 525,600 525,600 525,600 525,600 525,600 525,600 525,600 525,600 525,600 525,600 525,600Total CostsTotal Operation & Maintenance 45,546,290 52,623,681 54,907,021 57,008,608 59,532,359 61,223,978 63,838,092 65,252,811 68,091,561 71,060,094 72,735,932 75,913,537 78,488,716 81,936,518 85,529,969 88,973,153 92,551,405 96,269,812 100,114,123 104,107,704Total Residue Ash Management 17,893,185 18,322,622 18,762,365 19,212,661 19,673,765 20,145,936 20,629,438 21,124,545 21,631,534 22,150,691 22,682,307 23,226,682 23,784,123 24,354,942 24,939,460 25,538,007 26,150,920 26,778,542 27,421,227 28,079,336ByPassed Waste Disposal 7,700,674 9,403,869 11,233,002 12,734,310 14,855,789 15,625,366 17,799,249 18,041,953 20,474,889 23,063,100 23,570,093 26,385,971 28,202,920 31,337,619 34,646,396 37,662,925 40,834,243 44,166,966 47,637,286 51,280,475Debt Service 55,858,020 55,858,020 55,858,020 55,858,020 55,858,020 55,858,020 55,858,020 55,858,020 55,858,020 55,858,020 55,858,020 55,858,020 55,858,020 55,858,020 55,858,020 55,858,020 55,858,020 55,858,020 55,858,020 55,858,020Total Cost 126,998,170 136,208,193 140,760,408 144,813,600 149,919,934 152,853,300 158,124,799 160,277,329 166,056,003 172,131,905 174,846,353 181,384,211 186,333,779 193,487,099 200,973,846 208,032,106 215,394,588 223,073,339 231,030,656 239,325,535less Energy Revenue 35,935,855 37,797,407 37,162,364 37,787,299 38,927,271 39,988,668 41,579,501 43,362,458 45,198,546 45,641,918 46,943,137 48,348,243 49,795,408 51,285,890 52,820,986 54,402,030 56,030,399 57,707,509 59,434,819 61,213,831
Total Net Annual Cost $91,062,315 $98,410,787 $103,598,044 $107,026,301 $110,992,663 $112,864,631 $116,545,298 $116,914,871 $120,857,457 $126,489,987 $127,903,216 $133,035,967 $136,538,371 $142,201,209 $148,152,860 $153,630,075 $159,364,189 $165,365,830 $171,595,837 $178,111,704Total Net Annual Cost per ton $78.21 $82.97 $85.72 $87.34 $88.82 $89.93 $91.20 $91.65 $92.97 $95.48 $96.58 $98.56 $100.19 $102.35 $104.61 $106.78 $109.04 $111.38 $113.81 $116.33
Total CostTotal Cost per tonEnergy RevenueEnergy Revenue per tonTotal Net Present ValueNet Present Value per ton
$20.95$1,550,249,728
$57.99
Key Net Present Values$2,110,368,096
$78.94$560,118,368

Exhibit 15-1 Page 3RDF COSTS - Low End2007 METRICSStarting Facility Capacity 1,051,200 tons per yearPercent Residue Ash 25.0%Energy Generation 550 kWh/tonUnit O&M Cost $42.00 per ton ProcessedResidue Ash Management $40.00 per ton ResidueByPassed Waste Management $45.00 per ton Bypassed
YEAR 2016 2017 2018 2019 2020 2021 2022 2023 2024 2025 2026 2027 2028 2029 2030 2031 2032 2033 2034 2035Unit CostsUnit Operation & Maintenance $51.99 $53.24 $54.52 $55.83 $57.17 $58.54 $59.94 $61.38 $62.86 $64.36 $65.91 $67.49 $69.11 $70.77 $72.47 $74.21 $75.99 $77.81 $79.68 $81.59Unit Residue Ash Management $49.52 $50.71 $51.92 $53.17 $54.45 $55.75 $57.09 $58.46 $59.86 $61.30 $62.77 $64.28 $65.82 $67.40 $69.02 $70.67 $72.37 $74.11 $75.89 $77.71Unit ByPassed Waste Management $49.52 $50.71 $51.92 $53.17 $54.45 $55.75 $57.09 $58.46 $59.86 $61.30 $62.77 $64.28 $65.82 $67.40 $69.02 $70.67 $72.37 $74.11 $75.89 $77.71Energy Price ($/MWh) $68.37 $71.91 $70.70 $71.89 $74.06 $76.08 $79.11 $82.50 $85.99 $86.84 $89.31 $91.99 $94.74 $97.58 $100.50 $103.50 $106.60 $109.79 $113.08 $116.46TonnagesTonnage Requiring Disposal 1,164,301 1,186,079 1,208,538 1,225,386 1,249,642 1,255,030 1,277,946 1,275,651 1,299,948 1,324,825 1,324,286 1,349,746 1,362,825 1,389,346 1,416,287 1,438,772 1,461,558 1,484,647 1,507,747 1,531,144Tonnage Processed 1,051,200 1,051,200 1,051,200 1,051,200 1,051,200 1,051,200 1,051,200 1,051,200 1,051,200 1,051,200 1,051,200 1,051,200 1,051,200 1,051,200 1,051,200 1,051,200 1,051,200 1,051,200 1,051,200 1,051,200Tonnage Bypassed 113,101 134,879 157,338 174,186 198,442 203,830 226,746 224,451 248,748 273,625 273,086 298,546 311,625 338,146 365,087 387,572 410,358 433,447 456,547 479,944Residue Ash Tonnage 262,800 262,800 262,800 262,800 262,800 262,800 262,800 262,800 262,800 262,800 262,800 262,800 262,800 262,800 262,800 262,800 262,800 262,800 262,800 262,800Energy Generated (MWh) 578,160 578,160 578,160 578,160 578,160 578,160 578,160 578,160 578,160 578,160 578,160 578,160 578,160 578,160 578,160 578,160 578,160 578,160 578,160 578,160Total CostsTotal Operation & Maintenance 54,655,548 63,148,418 65,888,425 68,410,330 71,438,831 73,468,774 76,605,710 78,303,373 81,709,873 85,272,113 87,283,118 91,096,244 94,186,459 98,323,822 102,635,963 106,767,784 111,061,686 115,523,774 120,136,947 124,929,244Total Residue Ash Management 13,013,226 13,325,543 13,645,356 13,972,845 14,308,193 14,651,590 15,003,228 15,363,305 15,732,025 16,109,593 16,496,223 16,892,133 17,297,544 17,712,685 18,137,789 18,573,096 19,018,851 19,475,303 19,942,710 20,421,335ByPassed Waste Disposal 5,600,490 6,839,178 8,169,456 9,261,316 10,804,210 11,363,902 12,944,908 13,121,420 14,890,828 16,773,164 17,141,886 19,189,797 20,511,214 22,790,995 25,197,379 27,391,218 29,697,631 32,121,430 34,645,299 37,294,891Debt Service 60,154,791 60,154,791 60,154,791 60,154,791 60,154,791 60,154,791 60,154,791 60,154,791 60,154,791 60,154,791 60,154,791 60,154,791 60,154,791 60,154,791 60,154,791 60,154,791 60,154,791 60,154,791 60,154,791 60,154,791Total Cost 133,424,055 143,467,930 147,858,028 151,799,282 156,706,025 159,639,057 164,708,637 166,942,890 172,487,516 178,309,661 181,076,019 187,332,965 192,150,009 198,982,293 206,125,922 212,886,889 219,932,959 227,275,298 234,879,748 242,800,262less Energy Revenue 39,529,441 41,577,147 40,878,600 41,566,029 42,819,998 43,987,535 45,737,451 47,698,704 49,718,401 50,206,110 51,637,450 53,183,068 54,774,949 56,414,479 58,103,084 59,842,233 61,633,439 63,478,260 65,378,301 67,335,214
Total Net Annual Cost $93,894,614 $101,890,783 $106,979,428 $110,233,253 $113,886,027 $115,651,521 $118,971,187 $119,244,186 $122,769,116 $128,103,551 $129,438,569 $134,149,897 $137,375,060 $142,567,814 $148,022,838 $153,044,656 $158,299,520 $163,797,038 $169,501,447 $175,465,048Total Net Annual Cost per ton $80.64 $85.91 $88.52 $89.96 $91.13 $92.15 $93.10 $93.48 $94.44 $96.69 $97.74 $99.39 $100.80 $102.62 $104.51 $106.37 $108.31 $110.33 $112.42 $114.60
Total CostTotal Cost per tonEnergy RevenueEnergy Revenue per tonTotal Net Present ValueNet Present Value per ton
$23.05$1,570,406,479
$58.74
Key Net Present Values$2,186,536,683
$81.79$616,130,204

Exhibit 15-1 Page 4RDF COSTS - High End2007 METRICSStarting Facility Capacity 1,051,200 tons per yearPercent Residue Ash 25.0%Energy Generation 500 kWh/tonUnit O&M Cost $47.00 per ton ProcessedResidue Ash Management $55.00 per ton ResidueByPassed Waste Management $50.00 per ton Bypassed
YEAR 2016 2017 2018 2019 2020 2021 2022 2023 2024 2025 2026 2027 2028 2029 2030 2031 2032 2033 2034 2035Unit CostsUnit Operation & Maintenance $58.18 $59.58 $61.01 $62.47 $63.97 $65.51 $67.08 $68.69 $70.34 $72.03 $73.76 $75.53 $77.34 $79.19 $81.10 $83.04 $85.03 $87.08 $89.17 $91.31Unit Residue Ash Management $68.09 $69.72 $71.39 $73.11 $74.86 $76.66 $78.50 $80.38 $82.31 $84.29 $86.31 $88.38 $90.50 $92.67 $94.90 $97.18 $99.51 $101.90 $104.34 $106.85Unit ByPassed Waste Management $68.09 $69.72 $71.39 $73.11 $74.86 $76.66 $78.50 $80.38 $82.31 $84.29 $86.31 $88.38 $90.50 $92.67 $94.90 $97.18 $99.51 $101.90 $104.34 $106.85Energy Price ($/MWh) $68.37 $71.91 $70.70 $71.89 $74.06 $76.08 $79.11 $82.50 $85.99 $86.84 $89.31 $91.99 $94.74 $97.58 $100.50 $103.50 $106.60 $109.79 $113.08 $116.46TonnagesTonnage Requiring Disposal 1,164,301 1,186,079 1,208,538 1,225,386 1,249,642 1,255,030 1,277,946 1,275,651 1,299,948 1,324,825 1,324,286 1,349,746 1,362,825 1,389,346 1,416,287 1,438,772 1,461,558 1,484,647 1,507,747 1,531,144Tonnage Processed 1,051,200 1,051,200 1,051,200 1,051,200 1,051,200 1,051,200 1,051,200 1,051,200 1,051,200 1,051,200 1,051,200 1,051,200 1,051,200 1,051,200 1,051,200 1,051,200 1,051,200 1,051,200 1,051,200 1,051,200Tonnage Bypassed 113,101 134,879 157,338 174,186 198,442 203,830 226,746 224,451 248,748 273,625 273,086 298,546 311,625 338,146 365,087 387,572 410,358 433,447 456,547 479,944Residue Ash Tonnage 262,800 262,800 262,800 262,800 262,800 262,800 262,800 262,800 262,800 262,800 262,800 262,800 262,800 262,800 262,800 262,800 262,800 262,800 262,800 262,800Energy Generated (MWh) 525,600 525,600 525,600 525,600 525,600 525,600 525,600 525,600 525,600 525,600 525,600 525,600 525,600 525,600 525,600 525,600 525,600 525,600 525,600 525,600Total CostsTotal Operation & Maintenance 61,162,161 70,666,087 73,732,285 76,554,417 79,943,454 82,215,056 85,725,438 87,625,203 91,437,238 95,423,555 97,673,966 101,941,035 105,399,133 110,029,039 114,854,530 119,478,234 124,283,315 129,276,604 134,438,965 139,801,773Total Residue Ash Management 17,893,185 18,322,622 18,762,365 19,212,661 19,673,765 20,145,936 20,629,438 21,124,545 21,631,534 22,150,691 22,682,307 23,226,682 23,784,123 24,354,942 24,939,460 25,538,007 26,150,920 26,778,542 27,421,227 28,079,336ByPassed Waste Disposal 7,700,674 9,403,869 11,233,002 12,734,310 14,855,789 15,625,366 17,799,249 18,041,953 20,474,889 23,063,100 23,570,093 26,385,971 28,202,920 31,337,619 34,646,396 37,662,925 40,834,243 44,166,966 47,637,286 51,280,475Debt Service 65,525,755 65,525,755 65,525,755 65,525,755 65,525,755 65,525,755 65,525,755 65,525,755 65,525,755 65,525,755 65,525,755 65,525,755 65,525,755 65,525,755 65,525,755 65,525,755 65,525,755 65,525,755 65,525,755 65,525,755Total Cost 152,281,775 163,918,332 169,253,406 174,027,143 179,998,763 183,512,112 189,679,879 192,317,455 199,069,415 206,163,100 209,452,121 217,079,443 222,911,930 231,247,354 239,966,141 248,204,921 256,794,232 265,747,866 275,023,232 284,687,340less Energy Revenue 35,935,855 37,797,407 37,162,364 37,787,299 38,927,271 39,988,668 41,579,501 43,362,458 45,198,546 45,641,918 46,943,137 48,348,243 49,795,408 51,285,890 52,820,986 54,402,030 56,030,399 57,707,509 59,434,819 61,213,831
Total Net Annual Cost $116,345,920 $126,120,926 $132,091,042 $136,239,844 $141,071,492 $143,523,444 $148,100,379 $148,954,997 $153,870,870 $160,521,182 $162,508,984 $168,731,200 $173,116,522 $179,961,464 $187,145,155 $193,802,891 $200,763,833 $208,040,357 $215,588,414 $223,473,508Total Net Annual Cost per ton $99.93 $106.33 $109.30 $111.18 $112.89 $114.36 $115.89 $116.77 $118.37 $121.16 $122.71 $125.01 $127.03 $129.53 $132.14 $134.70 $137.36 $140.13 $142.99 $145.95
Total CostTotal Cost per tonEnergy RevenueEnergy Revenue per tonTotal Net Present ValueNet Present Value per ton
$20.95$1,966,880,232
$73.57
Key Net Present Values$2,526,998,600
$94.52$560,118,368

Exhibit 15-1 Page 5ADVANCED THERMAL RECYCLING COSTS - Low End2007 METRICSStarting Facility Capacity 1,051,200 tons per yearPercent Residue Ash 25.0%Energy Generation 550 kWh/tonUnit O&M Cost $39.00 per ton ProcessedResidue Ash Management $40.00 per ton ResidueByPassed Waste Management $45.00 per ton Bypassed
YEAR 2016 2017 2018 2019 2020 2021 2022 2023 2024 2025 2026 2027 2028 2029 2030 2031 2032 2033 2034 2035Unit CostsUnit Operation & Maintenance $48.28 $49.44 $50.62 $51.84 $53.08 $54.36 $55.66 $57.00 $58.37 $59.77 $61.20 $62.67 $64.17 $65.71 $67.29 $68.91 $70.56 $72.25 $73.99 $75.76Unit Residue Ash Management $49.52 $50.71 $51.92 $53.17 $54.45 $55.75 $57.09 $58.46 $59.86 $61.30 $62.77 $64.28 $65.82 $67.40 $69.02 $70.67 $72.37 $74.11 $75.89 $77.71Unit ByPassed Waste Management $49.52 $50.71 $51.92 $53.17 $54.45 $55.75 $57.09 $58.46 $59.86 $61.30 $62.77 $64.28 $65.82 $67.40 $69.02 $70.67 $72.37 $74.11 $75.89 $77.71Energy Price ($/MWh) $68.37 $71.91 $70.70 $71.89 $74.06 $76.08 $79.11 $82.50 $85.99 $86.84 $89.31 $91.99 $94.74 $97.58 $100.50 $103.50 $106.60 $109.79 $113.08 $116.46TonnagesTonnage Requiring Disposal 1,164,301 1,186,079 1,208,538 1,225,386 1,249,642 1,255,030 1,277,946 1,275,651 1,299,948 1,324,825 1,324,286 1,349,746 1,362,825 1,389,346 1,416,287 1,438,772 1,461,558 1,484,647 1,507,747 1,531,144Tonnage Processed 1,051,200 1,051,200 1,051,200 1,051,200 1,051,200 1,051,200 1,051,200 1,051,200 1,051,200 1,051,200 1,051,200 1,051,200 1,051,200 1,051,200 1,051,200 1,051,200 1,051,200 1,051,200 1,051,200 1,051,200Tonnage Bypassed 113,101 134,879 157,338 174,186 198,442 203,830 226,746 224,451 248,748 273,625 273,086 298,546 311,625 338,146 365,087 387,572 410,358 433,447 456,547 479,944Residue Ash Tonnage 262,800 262,800 262,800 262,800 262,800 262,800 262,800 262,800 262,800 262,800 262,800 262,800 262,800 262,800 262,800 262,800 262,800 262,800 262,800 262,800Energy Generated (MWh) 578,160 578,160 578,160 578,160 578,160 578,160 578,160 578,160 578,160 578,160 578,160 578,160 578,160 578,160 578,160 578,160 578,160 578,160 578,160 578,160Total CostsTotal Operation & Maintenance 50,751,580 58,637,816 61,182,109 63,523,878 66,336,057 68,221,004 71,133,874 72,710,275 75,873,453 79,181,248 81,048,610 84,589,370 87,458,855 91,300,692 95,304,823 99,141,513 103,128,708 107,272,076 111,555,737 116,005,727Total Residue Ash Management 13,013,226 13,325,543 13,645,356 13,972,845 14,308,193 14,651,590 15,003,228 15,363,305 15,732,025 16,109,593 16,496,223 16,892,133 17,297,544 17,712,685 18,137,789 18,573,096 19,018,851 19,475,303 19,942,710 20,421,335ByPassed Waste Disposal 5,600,490 6,839,178 8,169,456 9,261,316 10,804,210 11,363,902 12,944,908 13,121,420 14,890,828 16,773,164 17,141,886 19,189,797 20,511,214 22,790,995 25,197,379 27,391,218 29,697,631 32,121,430 34,645,299 37,294,891Debt Service 55,858,020 55,858,020 55,858,020 55,858,020 55,858,020 55,858,020 55,858,020 55,858,020 55,858,020 55,858,020 55,858,020 55,858,020 55,858,020 55,858,020 55,858,020 55,858,020 55,858,020 55,858,020 55,858,020 55,858,020Total Cost 125,223,316 134,660,558 138,854,941 142,616,059 147,306,481 150,094,516 154,940,030 157,053,021 162,354,326 167,922,025 170,544,740 176,529,320 181,125,634 187,662,392 194,498,011 200,963,848 207,703,210 214,726,829 222,001,767 229,579,974less Energy Revenue 39,529,441 41,577,147 40,878,600 41,566,029 42,819,998 43,987,535 45,737,451 47,698,704 49,718,401 50,206,110 51,637,450 53,183,068 54,774,949 56,414,479 58,103,084 59,842,233 61,633,439 63,478,260 65,378,301 67,335,214
Total Net Annual Cost $85,693,876 $93,083,411 $97,976,341 $101,050,030 $104,486,483 $106,106,981 $109,202,579 $109,354,317 $112,635,926 $117,715,915 $118,907,289 $123,346,252 $126,350,685 $131,247,913 $136,394,927 $141,121,615 $146,069,771 $151,248,569 $156,623,466 $162,244,760Total Net Annual Cost per ton $73.60 $78.48 $81.07 $82.46 $83.61 $84.55 $85.45 $85.72 $86.65 $88.85 $89.79 $91.38 $92.71 $94.47 $96.30 $98.08 $99.94 $101.88 $103.88 $105.96
Total CostTotal Cost per tonEnergy RevenueEnergy Revenue per tonTotal Net Present ValueNet Present Value per ton
$23.05$1,442,821,926
$53.97
Key Net Present Values$2,058,952,130
$77.02$616,130,204
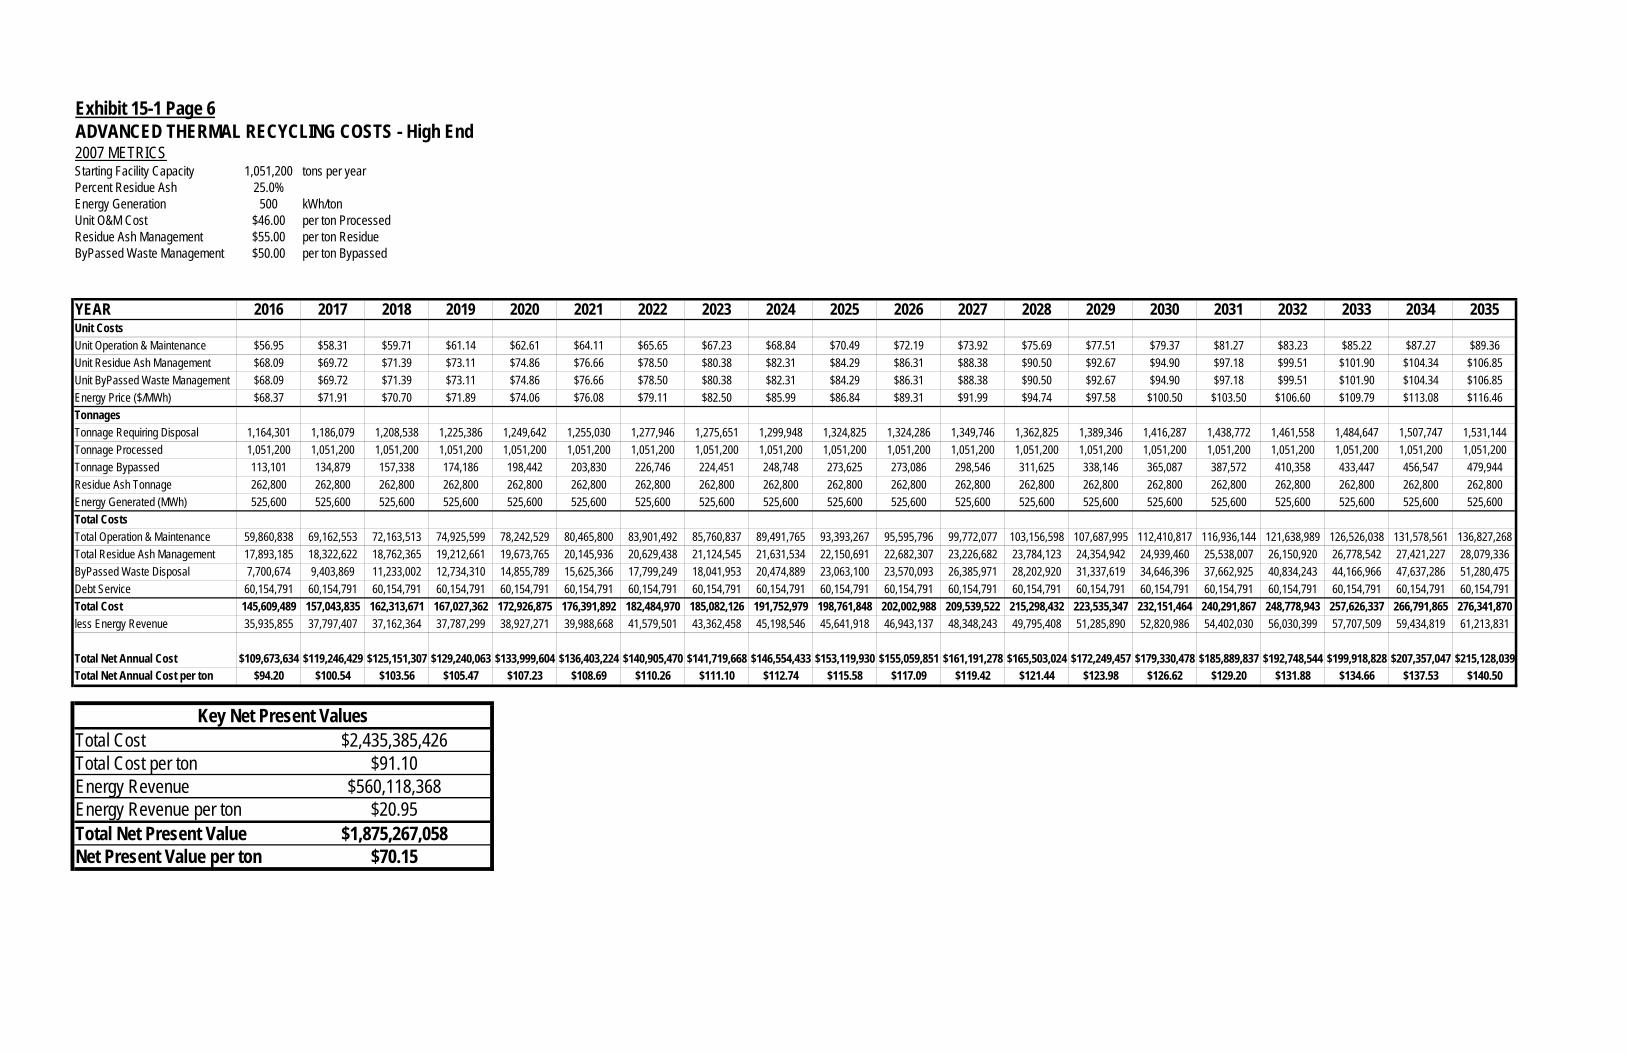
Exhibit 15-1 Page 6ADVANCED THERMAL RECYCLING COSTS - High End2007 METRICSStarting Facility Capacity 1,051,200 tons per yearPercent Residue Ash 25.0%Energy Generation 500 kWh/tonUnit O&M Cost $46.00 per ton ProcessedResidue Ash Management $55.00 per ton ResidueByPassed Waste Management $50.00 per ton Bypassed
YEAR 2016 2017 2018 2019 2020 2021 2022 2023 2024 2025 2026 2027 2028 2029 2030 2031 2032 2033 2034 2035Unit CostsUnit Operation & Maintenance $56.95 $58.31 $59.71 $61.14 $62.61 $64.11 $65.65 $67.23 $68.84 $70.49 $72.19 $73.92 $75.69 $77.51 $79.37 $81.27 $83.23 $85.22 $87.27 $89.36Unit Residue Ash Management $68.09 $69.72 $71.39 $73.11 $74.86 $76.66 $78.50 $80.38 $82.31 $84.29 $86.31 $88.38 $90.50 $92.67 $94.90 $97.18 $99.51 $101.90 $104.34 $106.85Unit ByPassed Waste Management $68.09 $69.72 $71.39 $73.11 $74.86 $76.66 $78.50 $80.38 $82.31 $84.29 $86.31 $88.38 $90.50 $92.67 $94.90 $97.18 $99.51 $101.90 $104.34 $106.85Energy Price ($/MWh) $68.37 $71.91 $70.70 $71.89 $74.06 $76.08 $79.11 $82.50 $85.99 $86.84 $89.31 $91.99 $94.74 $97.58 $100.50 $103.50 $106.60 $109.79 $113.08 $116.46TonnagesTonnage Requiring Disposal 1,164,301 1,186,079 1,208,538 1,225,386 1,249,642 1,255,030 1,277,946 1,275,651 1,299,948 1,324,825 1,324,286 1,349,746 1,362,825 1,389,346 1,416,287 1,438,772 1,461,558 1,484,647 1,507,747 1,531,144Tonnage Processed 1,051,200 1,051,200 1,051,200 1,051,200 1,051,200 1,051,200 1,051,200 1,051,200 1,051,200 1,051,200 1,051,200 1,051,200 1,051,200 1,051,200 1,051,200 1,051,200 1,051,200 1,051,200 1,051,200 1,051,200Tonnage Bypassed 113,101 134,879 157,338 174,186 198,442 203,830 226,746 224,451 248,748 273,625 273,086 298,546 311,625 338,146 365,087 387,572 410,358 433,447 456,547 479,944Residue Ash Tonnage 262,800 262,800 262,800 262,800 262,800 262,800 262,800 262,800 262,800 262,800 262,800 262,800 262,800 262,800 262,800 262,800 262,800 262,800 262,800 262,800Energy Generated (MWh) 525,600 525,600 525,600 525,600 525,600 525,600 525,600 525,600 525,600 525,600 525,600 525,600 525,600 525,600 525,600 525,600 525,600 525,600 525,600 525,600Total CostsTotal Operation & Maintenance 59,860,838 69,162,553 72,163,513 74,925,599 78,242,529 80,465,800 83,901,492 85,760,837 89,491,765 93,393,267 95,595,796 99,772,077 103,156,598 107,687,995 112,410,817 116,936,144 121,638,989 126,526,038 131,578,561 136,827,268Total Residue Ash Management 17,893,185 18,322,622 18,762,365 19,212,661 19,673,765 20,145,936 20,629,438 21,124,545 21,631,534 22,150,691 22,682,307 23,226,682 23,784,123 24,354,942 24,939,460 25,538,007 26,150,920 26,778,542 27,421,227 28,079,336ByPassed Waste Disposal 7,700,674 9,403,869 11,233,002 12,734,310 14,855,789 15,625,366 17,799,249 18,041,953 20,474,889 23,063,100 23,570,093 26,385,971 28,202,920 31,337,619 34,646,396 37,662,925 40,834,243 44,166,966 47,637,286 51,280,475Debt Service 60,154,791 60,154,791 60,154,791 60,154,791 60,154,791 60,154,791 60,154,791 60,154,791 60,154,791 60,154,791 60,154,791 60,154,791 60,154,791 60,154,791 60,154,791 60,154,791 60,154,791 60,154,791 60,154,791 60,154,791Total Cost 145,609,489 157,043,835 162,313,671 167,027,362 172,926,875 176,391,892 182,484,970 185,082,126 191,752,979 198,761,848 202,002,988 209,539,522 215,298,432 223,535,347 232,151,464 240,291,867 248,778,943 257,626,337 266,791,865 276,341,870less Energy Revenue 35,935,855 37,797,407 37,162,364 37,787,299 38,927,271 39,988,668 41,579,501 43,362,458 45,198,546 45,641,918 46,943,137 48,348,243 49,795,408 51,285,890 52,820,986 54,402,030 56,030,399 57,707,509 59,434,819 61,213,831
Total Net Annual Cost $109,673,634 $119,246,429 $125,151,307 $129,240,063 $133,999,604 $136,403,224 $140,905,470 $141,719,668 $146,554,433 $153,119,930 $155,059,851 $161,191,278 $165,503,024 $172,249,457 $179,330,478 $185,889,837 $192,748,544 $199,918,828 $207,357,047 $215,128,039Total Net Annual Cost per ton $94.20 $100.54 $103.56 $105.47 $107.23 $108.69 $110.26 $111.10 $112.74 $115.58 $117.09 $119.42 $121.44 $123.98 $126.62 $129.20 $131.88 $134.66 $137.53 $140.50
Total CostTotal Cost per tonEnergy RevenueEnergy Revenue per tonTotal Net Present ValueNet Present Value per ton
$20.95$1,875,267,058
$70.15
Key Net Present Values$2,435,385,426
$91.10$560,118,368

Exhibit 15-1 Page 7WASTE EXPORT COSTS - Low End2007 METRICSStarting Facility Capacity 1,051,200 tons per yearUnit O&M Cost $45.00 per ton Processed
YEAR 2016 2017 2018 2019 2020 2021 2022 2023 2024 2025 2026 2027 2028 2029 2030 2031 2032 2033 2034 2035Unit CostsUnit Operation & Maintenance $55.71 $57.04 $58.41 $59.82 $61.25 $62.72 $64.23 $65.77 $67.35 $68.96 $70.62 $72.31 $74.05 $75.82 $77.64 $79.51 $81.42 $83.37 $85.37 $87.42LFG Price ($/MMBTU) $2.73 $3.09 $2.91 $3.00 $3.20 $3.37 $3.67 $4.00 $4.34 $4.38 $4.61 $4.85 $5.11 $5.37 $5.64 $5.91 $6.20 $6.50 $6.80 $7.11TonnagesTonnage Requiring Disposal 1,164,301 1,186,079 1,208,538 1,225,386 1,249,642 1,255,030 1,277,946 1,275,651 1,299,948 1,324,825 1,324,286 1,349,746 1,362,825 1,389,346 1,416,287 1,438,772 1,461,558 1,484,647 1,507,747 1,531,144LFG Generation (MMBTU/hr) 12 31 63 91 117 149 163 183 201 218 233 247 260 272 284 296 308 319 330 341Total LFG Collected and Sold (MMBTU) 105,120 271,560 551,880 797,160 1,024,920 1,305,240 1,427,880 1,603,080 1,760,760 1,909,680 2,041,080 2,163,720 2,277,600 2,382,720 2,487,840 2,592,960 2,698,080 2,794,440 2,890,800 2,987,160Total LFG Revenues 286,978 839,120 1,605,971 2,391,480 3,279,744 4,398,659 5,240,320 6,412,320 7,641,698 8,364,398 9,409,379 10,494,042 11,638,536 12,795,206 14,031,418 15,324,394 16,728,096 18,163,860 19,657,440 21,238,708Total CostsTotal Operation & Maintenance 64,860,067 67,659,019 70,594,741 73,296,782 76,541,605 78,716,543 82,077,547 83,896,471 87,546,292 91,362,978 93,517,627 97,603,119 100,914,064 105,346,952 109,967,103 114,394,054 118,994,663 123,775,472 128,718,158 133,852,762Debt Service 1,768,405 1,768,405 1,768,405 1,768,405 1,768,405 1,768,405 1,768,405 1,768,405 1,768,405 1,768,405 1,768,405 1,768,405 1,768,405 1,768,405 1,768,405 1,768,405 1,768,405 1,768,405 1,768,405 1,768,405
Total Net Annual Cost $66,628,472 $69,427,424 $72,363,146 $75,065,187 $78,310,010 $80,484,948 $83,845,952 $85,664,876 $89,314,697 $93,131,383 $95,286,032 $99,371,524 $102,682,469 $107,115,357 $111,735,508 $116,162,459 $120,763,068 $125,543,877 $130,486,563 $135,621,167Total Net Annual Cost per ton $57.23 $58.54 $59.88 $61.26 $62.67 $64.13 $65.61 $67.15 $68.71 $70.30 $71.95 $73.62 $75.35 $77.10 $78.89 $80.74 $82.63 $84.56 $86.54 $88.58
Total Net Present ValueTotal Net Present Value per ton
Key Net Present Values$1,138,598,131
$42.59

Exhibit 15-1 Page 8WASTE EXPORT COSTS - High End2007 METRICSStarting Facility Capacity 1,051,200 tons per yearUnit O&M Cost $50.00 per ton Processed
YEAR 2016 2017 2018 2019 2020 2021 2022 2023 2024 2025 2026 2027 2028 2029 2030 2031 2032 2033 2034 2035Unit CostsUnit Operation & Maintenance $61.90 $63.38 $64.90 $66.46 $68.06 $69.69 $71.36 $73.08 $74.83 $76.62 $78.46 $80.35 $82.28 $84.25 $86.27 $88.34 $90.46 $92.63 $94.86 $97.13LFG Price ($/MMBTU) $2.73 $3.09 $2.91 $3.00 $3.20 $3.37 $3.67 $4.00 $4.34 $4.38 $4.61 $4.85 $5.11 $5.37 $5.64 $5.91 $6.20 $6.50 $6.80 $7.11TonnagesTonnage Requiring Disposal 1,164,301 1,186,079 1,208,538 1,225,386 1,249,642 1,255,030 1,277,946 1,275,651 1,299,948 1,324,825 1,324,286 1,349,746 1,362,825 1,389,346 1,416,287 1,438,772 1,461,558 1,484,647 1,507,747 1,531,144LFG Generation (MMBTU/hr) 12 31 63 91 117 149 163 183 201 218 233 247 260 272 284 296 308 319 330 341Total LFG Collected and Sold (MMBTU) 105,120 271,560 551,880 797,160 1,024,920 1,305,240 1,427,880 1,603,080 1,760,760 1,909,680 2,041,080 2,163,720 2,277,600 2,382,720 2,487,840 2,592,960 2,698,080 2,794,440 2,890,800 2,987,160Total LFG Revenues 286,978 839,120 1,605,971 2,391,480 3,279,744 4,398,659 5,240,320 6,412,320 7,641,698 8,364,398 9,409,379 10,494,042 11,638,536 12,795,206 14,031,418 15,324,394 16,728,096 18,163,860 19,657,440 21,238,708Total CostsTotal Operation & Maintenance 72,066,741 75,176,688 78,438,601 81,440,869 85,046,228 87,462,826 91,197,274 93,218,301 97,273,658 101,514,420 103,908,474 108,447,910 112,126,737 117,052,169 122,185,670 127,104,504 132,216,292 137,528,302 143,020,176 148,725,291Debt Service 1,768,405 1,768,405 1,768,405 1,768,405 1,768,405 1,768,405 1,768,405 1,768,405 1,768,405 1,768,405 1,768,405 1,768,405 1,768,405 1,768,405 1,768,405 1,768,405 1,768,405 1,768,405 1,768,405 1,768,405
Total Net Annual Cost $73,835,146 $76,945,093 $80,207,006 $83,209,274 $86,814,633 $89,231,231 $92,965,679 $94,986,706 $99,042,063 $103,282,825 $105,676,879 $110,216,315 $113,895,143 $118,820,574 $123,954,075 $128,872,909 $133,984,698 $139,296,707 $144,788,581 $150,493,696Total Net Annual Cost per ton $63.42 $64.87 $66.37 $67.90 $69.47 $71.10 $72.75 $74.46 $76.19 $77.96 $79.80 $81.66 $83.57 $85.52 $87.52 $89.57 $91.67 $93.82 $96.03 $98.29
Total Net Present ValueTotal Net Present Value per ton
Key Net Present Values$1,262,660,342
$47.23

Section 16 SUMMARY OF PRINCIPAL FINDINGS

001640 | 11-01056-10004 | 6/8/2007
Section 16 SUMMARY OF PRINCIPAL FINDINGS
This section presents R. W. Beck’s principal findings and opinions regarding the comparative evaluation of Waste Export and Conversion Technologies disposal options. The bases of these findings are discussed in the various sections of this report. For a complete understanding of the findings, their bases and underlying assumptions, the report should be read in its entirety.
1. The quantity of solid waste the County will be required to dispose of is projected to increase from approximately 1,164,000 TPY in 2016 to 1,555,000 TPY in 2036 under the base case assumption that the recycling rate in the County increases at an average annual rate of 0.3%. This represents an increase of approximately 34 percent in waste disposal requirements during the study period.
2. Fourteen different solid waste Conversion Technologies were identified that are currently being discussed in the marketplace. We have categorized these as either Thermal Technologies or Biological and Chemical Technologies, as follows:
Thermal Technologies:
Pyrolysis
Gasification
Plasma Arc
Mass Burn Waste-to-Energy: – Modular Starved Air – Rotary Combustors – Field Erected
Refuse-Derived Fuel Waste-to-Energy
Advanced Thermal Recycling
Biological and Chemical Technologies:
Anaerobic Digestion
Waste-to-Ethanol
Aerobic Digestion/Municipal Solid Waste Composting
Thermal Deploymerization/Plastics to Oil
Steam Classification/Autoclave
Catalytic Cracking

Section 16
16-2 R. W. Beck 001640 | 11-01056-10004 | 6/8/2007
3. Only three of the 14 Conversion Technologies meet the County’s criteria of previously demonstrated capability of the technology over a minimum three-year period to process the quantities and composition of the solid waste the County is currently disposing of at the Cedar Hills Regional Landfill. These three proven Conversion Technologies are:
Mass Burn Waste-to-Energy – Field Erected
Refuse-Derived Fuel Waste-to-Energy (RDF)
Advanced Thermal Recycling
4. Of the remaining 11 Conversion Technologies, the County should continue to monitor the progress of the following technologies:
Gasification
Plasma Arc
Anaerobic Digestion
Waste-to-Ethanol
Steam Classification/Auto Clave
5. A properly designed, constructed, operated and maintained Conversion Technology could reasonably be expected to achieve the following annual availability rates:
Mass Burn Waste-to-Energy – 90%
RDF Waste-to-Energy – 87% to 90%
Advanced Thermal Recycling – 90%
Findings 6 through 18 are applicable should the County at some future time decide to proceed with implementation of a Conversion Facility: 6. Based on (a) the projected quantity of County waste, (b) the County’s assumed
increase in the level of recycling of 0.3 percent per year, (c) the assumed annual availability of a Conversion Facility, and (d) seasonal fluctuations in the generation of solid waste, a Conversion Facility sized at approximately 3,200 TPD would meet most of the County’s waste disposal requirements in 2016.
7. Designing a 3,200 TPD Conversion Facility with four processing units of 800 TPD per unit would provide required redundancy and operational flexibility.
8. Due to economies of scale, a single Conversion Facility of 3,200 TPD would be the most economic option in terms of lower unit capital costs and operation and maintenance expenses.
9. Due to the potential challenges associated with finding multiple sites for Conversion Facilities, a single facility would be less complicated to site and permit.

SUMMARY OF PRINCIPAL FINDINGS
001640 | 11-01056-10004 | 6/8/2007 R. W. Beck 16-3
10. It is possible that one planned transfer station could be replaced by a Conversion Facility. This could offset approximately 10 percent of the capital cost of the Conversion Facility.
11. The County will need access to backup landfill disposal capacity for the disposal of bypass waste and residue ash.
12. We estimate that the County should expect that anywhere from 5 to 9 percent of the solid waste will not be able to be processed at a Conversion Facility and will have to be landfilled.
13. A Conversion Facility can be expected to reduce the volume of incoming solid waste by 90 percent. The weight of the remaining residue ash can be expected to be equal to 20 to 25 percent of the weight of the incoming solid waste.
14. Residue ash from Conversion Facilities in the United States has consistently met the permit requirements for disposal in sanitary landfills.
15. The residue ash from the Conversion Facility in Spokane, Washington has always met the permit requirements established by the Washington State Department of Ecology (DOE). The Spokane System recently received permission from DOE to modify the designation of its residue ash from “Special Incinerator Ash” to “Solid Waste.” This re-designation increases the potential to find either some possible beneficial use for the residue ash or an alternative means of disposal.
16. The County would need to add additional disposal capacity after the initial installation in 2016 of a 3,200 TPD Conversion Facility to keep up with projected growth in the amount of waste under the base case assumption for increased recycling. The timing of the addition of disposal capacity would depend to a significant degree on the growth in the County’s recycling program.
17. Depending upon the specific items targeted by the County, the County could increase the recycling program to 60 percent without having an adverse impact on the solid waste processing and energy generation capability of a Conversion Facility sized at 3,200 TPD.
18. If the County increased the level of recycling to 70 percent, our analysis indicates that the complete processing capacity of a 3,200 TPD facility would not be fully utilized and the energy production capability could be impacted depending upon the components of the waste stream that are targeted by the County for recycling. The County would have the option to accept waste from other jurisdictions to make full use of the processing capacity of the Conversion Facility or decide to construct a smaller facility that would be compatible with the increased level of recycling.
19. For all the disposal options, it is possible to design, construct, and operate facilities that are capable of meeting permit requirements for all criteria and air toxic pollutant emissions.
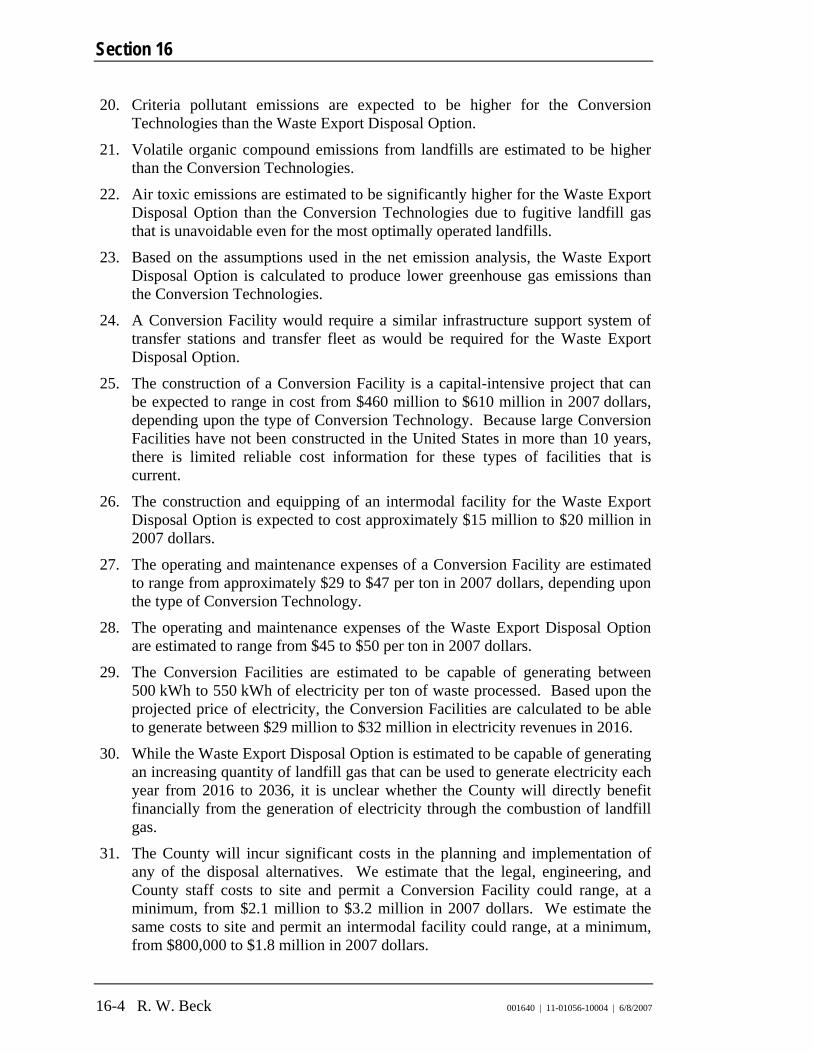
Section 16
16-4 R. W. Beck 001640 | 11-01056-10004 | 6/8/2007
20. Criteria pollutant emissions are expected to be higher for the Conversion Technologies than the Waste Export Disposal Option.
21. Volatile organic compound emissions from landfills are estimated to be higher than the Conversion Technologies.
22. Air toxic emissions are estimated to be significantly higher for the Waste Export Disposal Option than the Conversion Technologies due to fugitive landfill gas that is unavoidable even for the most optimally operated landfills.
23. Based on the assumptions used in the net emission analysis, the Waste Export Disposal Option is calculated to produce lower greenhouse gas emissions than the Conversion Technologies.
24. A Conversion Facility would require a similar infrastructure support system of transfer stations and transfer fleet as would be required for the Waste Export Disposal Option.
25. The construction of a Conversion Facility is a capital-intensive project that can be expected to range in cost from $460 million to $610 million in 2007 dollars, depending upon the type of Conversion Technology. Because large Conversion Facilities have not been constructed in the United States in more than 10 years, there is limited reliable cost information for these types of facilities that is current.
26. The construction and equipping of an intermodal facility for the Waste Export Disposal Option is expected to cost approximately $15 million to $20 million in 2007 dollars.
27. The operating and maintenance expenses of a Conversion Facility are estimated to range from approximately $29 to $47 per ton in 2007 dollars, depending upon the type of Conversion Technology.
28. The operating and maintenance expenses of the Waste Export Disposal Option are estimated to range from $45 to $50 per ton in 2007 dollars.
29. The Conversion Facilities are estimated to be capable of generating between 500 kWh to 550 kWh of electricity per ton of waste processed. Based upon the projected price of electricity, the Conversion Facilities are calculated to be able to generate between $29 million to $32 million in electricity revenues in 2016.
30. While the Waste Export Disposal Option is estimated to be capable of generating an increasing quantity of landfill gas that can be used to generate electricity each year from 2016 to 2036, it is unclear whether the County will directly benefit financially from the generation of electricity through the combustion of landfill gas.
31. The County will incur significant costs in the planning and implementation of any of the disposal alternatives. We estimate that the legal, engineering, and County staff costs to site and permit a Conversion Facility could range, at a minimum, from $2.1 million to $3.2 million in 2007 dollars. We estimate the same costs to site and permit an intermodal facility could range, at a minimum, from $800,000 to $1.8 million in 2007 dollars.
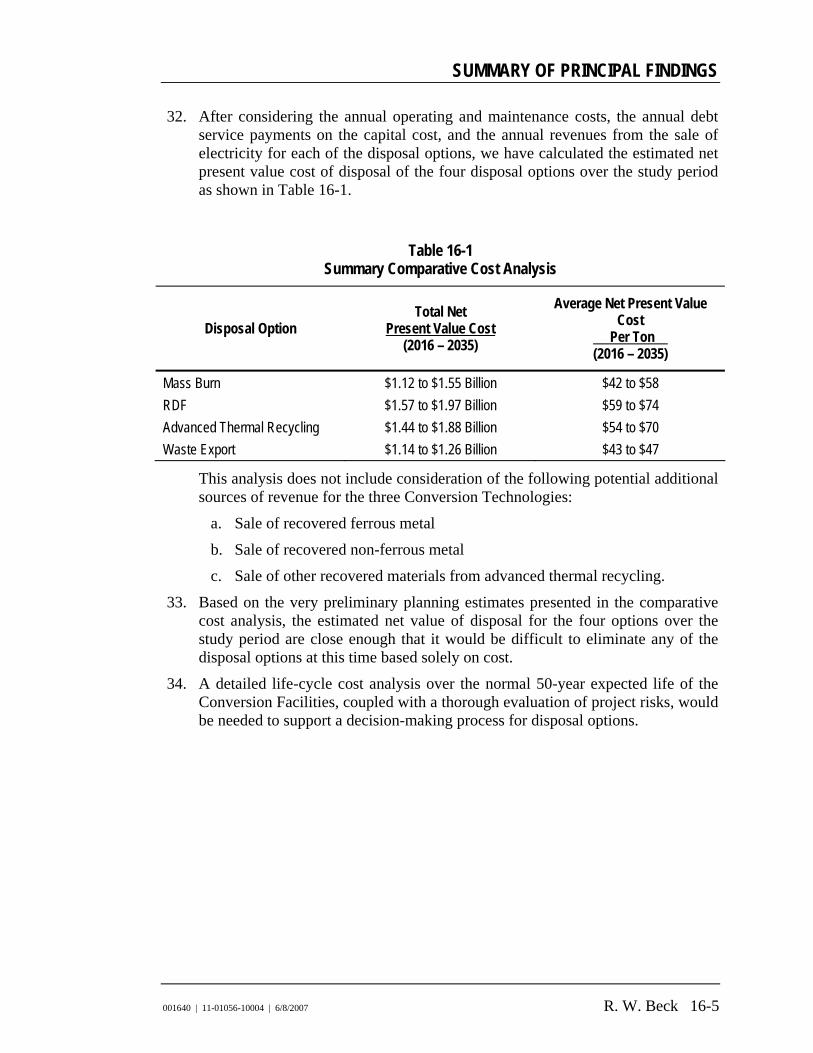
SUMMARY OF PRINCIPAL FINDINGS
001640 | 11-01056-10004 | 6/8/2007 R. W. Beck 16-5
32. After considering the annual operating and maintenance costs, the annual debt service payments on the capital cost, and the annual revenues from the sale of electricity for each of the disposal options, we have calculated the estimated net present value cost of disposal of the four disposal options over the study period as shown in Table 16-1.
Table 16-1 Summary Comparative Cost Analysis
Disposal Option Total Net
Present Value Cost (2016 – 2035)
Average Net Present Value Cost
Per Ton (2016 – 2035)
Mass Burn $1.12 to $1.55 Billion $42 to $58 RDF $1.57 to $1.97 Billion $59 to $74 Advanced Thermal Recycling $1.44 to $1.88 Billion $54 to $70 Waste Export $1.14 to $1.26 Billion $43 to $47
This analysis does not include consideration of the following potential additional sources of revenue for the three Conversion Technologies:
a. Sale of recovered ferrous metal
b. Sale of recovered non-ferrous metal
c. Sale of other recovered materials from advanced thermal recycling.
33. Based on the very preliminary planning estimates presented in the comparative cost analysis, the estimated net value of disposal for the four options over the study period are close enough that it would be difficult to eliminate any of the disposal options at this time based solely on cost.
34. A detailed life-cycle cost analysis over the normal 50-year expected life of the Conversion Facilities, coupled with a thorough evaluation of project risks, would be needed to support a decision-making process for disposal options.

Appendix A OVERVIEW OF COUNTY’S
CURRENT RECYCLING PROGRAM

001640 | 11-01056-10004 | 6/8/2007
Appendix A OVERVIEW OF COUNTY’S CURRENT
RECYCLING PROGRAM
Programs in Place King County has numerous programs in place to divert and recycle specific materials from the waste stream. County programs serve the residents of the unincorporated areas of the County as well as 37 of the 39 cities, excluding Seattle and Milton. These programs include:
Residential Curbside Recycling. Curbside recycling service typically is provided at no additional charge by private collection companies along with their fee-based municipal solid waste (MSW) collection services. Many municipalities within the County contract for recycling collection as part of their MSW collection contracts, while others are served by the provider specified by the state-regulated MSW hauling certification system. Unincorporated areas are each served by the provider specified by the state-regulated MSW hauling certification system. The basic recyclable materials accepted in curbside programs include: newspaper, mixed paper, cardboard, glass bottles and jars, aluminum and tin cans, and PETE and HDPE bottles. The County publishes a curbside recycling guide as part of its public education efforts. The guide is available on the County’s website at: www.metrokc.gov/dnrp/swd/garbage-recycling/documents/Curbside_recycling_guide.pdf
Multifamily Recycling. Multifamily recycling service is typically provided at no additional charge by private collection companies along with their fee-based MSW collection service. According to a 2005 telephone survey,1 90 percent of multifamily residents indicated that they have recycling services available at their complex. The basic recyclable materials accepted in curbside programs include: newspaper, mixed paper, cardboard, glass bottles and jars, aluminum and tin cans, and PETE and HDPE bottles. Residents are encouraged to inquire with their property manager if their complex lacks recycling services, since residents cannot “sign up” for recycling services on their own.
Commercial Recycling. Businesses in the County that choose to recycle may subscribe for recycling services from private haulers. There are no regulations that require businesses to recycle. A few cities provide city-contracted recycling services, bundled with their MSW collection services, to businesses within their
1 Source: “Residential Waste Reduction and Recycling Survey 2005: Survey of King County Households,” prepared by Informa Research Services, April 2005.

Appendix A
A-2 R. W. Beck 001640 | 11-01056-10004 | 6/8/2007
communities. Businesses may choose to use the city service at no additional charge or use a private recycler or hauler. Businesses sometimes choose to recycle only those materials that they generate in quantities large enough (i.e., cardboard or office paper) to reduce their garbage volume and, consequently, lower their garbage collection bill. Several cities provide technical assistance and other services to encourage businesses to recycle. The County’s website provides extensive information and assistance to businesses regarding recycling.
Drop-Box Recycling at the Transfer Stations. The County has recycling drop-boxes located at seven transfer stations:
Bow Lake Renton Cedar Falls Skyhomish Enumclaw Vashon Island Houghton 1st NE (currently closed for
renovation)
The drop-boxes are for residential and business use. The items accepted for free include: aluminum cans, cardboard, glass bottles and jars, mixed waste paper, newspaper, plastic bottles (#1 and #2), and tin cans. Some sites also accept textiles (clothing, linens, shoes, etc.) for recycling.
A few transfer stations also accept appliances, clean wood, and yard waste for a fee.
Recycling Collection Events. The County, along with the suburban cities, holds recycling collection events for items that may not be collected through regular collection services. Materials typically collected at these events include: tires, wood, scrap metal, appliances, televisions, computers and other electronic goods, and reusable household goods. The events serve residents throughout King County, outside the City of Seattle. Residential collection events are usually held during the spring and fall on Saturdays from 9 a.m. to 3 p.m. Business recycling collection events are usually held in summer and fall from 11 a.m. to 4 p.m. Both residential and business recycling collection events are usually held at a school parking lot or a transit system park-and-ride lot. Locations, materials and hours of operation may changes from year to year.
Construction Recycling. The County promotes recycling at construction/ deconstruction job sites and encourages contractors to consider keeping construction, demolition and land-clearing (CDL) debris separate from garbage. There are many options within the County for recycling clean wood, metals, concrete, asphalt, and natural vegetation. The County’s website provides a great deal of information for CDL generators, including a Construction Recycling Directory.
Hazardous Waste Management. The Local Hazardous Waste Management Program in King County offers two options for residents to properly dispose of household hazardous waste (HHW):

OVERVIEW OF COUNTY’S CURRENT RECYCLING PROGRAM
001640 | 11-01056-10004 | 6/8/2007 R. W. Beck A-3
The Wastemobile - a mobile collection service that travels throughout the County from approximately March through October and provides a convenient disposal option for residents.
Fixed Site Drop-Off Service - three permanent collection facilities, open year-round: one at the Factoria Transfer Station in Bellevue, one located at Seattle’s South Transfer Station, and another facility location in North Seattle (which operates by appointment only).
The County encourages residents and businesses to divert as much waste from disposal as possible. Its website provides recycling information and alternative disposal options for nearly 30 different types of materials, including certain more difficult-to-recycle materials such as appliances, pallets, propane tanks, and ink jet cartridges. Specific programs also are in place to target specific “problem” materials such as:
Electronics. Since October 1, 2005, the County no longer accepts computers (including laptops) or televisions in the garbage or at its solid waste disposal facilities. The County’s website offers proper disposal/recycling options for these materials for both residents and businesses. The website also promotes the Take it Back Network, a “partnership between government agencies, retailers, repair shops, charitable organizations and recyclers that provides consumers with options for recycling certain wastes – and their hazardous components – in a safe and cost effective manner.”
Fluorescent lamps. Also banned from disposal at County solid waste disposal facilities in October 1, 2005 were fluorescent bulbs and tubes. Residents may bring these lights to an HHW facility at no charge or to a “Take It Back Network” member that accepts fluorescent tubes and bulbs. Businesses must meet state and local requirements for the proper disposal of these lights, which are designated as universal waste. The County provides a great deal of information on its website, including a list of fluorescent lamp recyclers.
Residential and commercial food waste. Currently, about 60 percent of all single-family garbage customers in King County, outside of Seattle, are able to divert food waste and soiled paper with their yard waste set out for curbside collection. Commercial generators are encouraged to find a hauler that provides composting service for food waste as well as proper disposal service for commercially generated fats, oil, and grease.
Types and Quantities of Material Recycled Table A-1 lists the quantities of recyclable material reported by the County to have been collected in King County (excluding the cities of Seattle and Milton) from 2000 through 2004. The quantities include residential (curbside and drop-off) tons as well as commercial tons.

Appendix A
A-4 R. W. Beck 001640 | 11-01056-10004 | 6/8/2007
Table A-1 Historical Quantities (in Tons) of Recyclable Materials
Collected and Processed in King County
2000 2001 2002 2003 2004
Percent of Total (2004)
Aluminum Cans 6,257 3,029 1,896 4,463 3,534 0.52% Tin Cans 12,534 1,574 1,504 2,296 2,857 0.42% OCC 105,164 102,431 100,293 140,460 130,760 19.18% High Grade Paper 14,521 17,934 13,072 16,234 18,043 2.65% Mixed Paper 89,372 54,442 62,751 79,036 82,842 12.15% Newspaper 71,917 26,910 49,914 91,676 81,268 11.92% HDPE 1,079 666 1,446 2,076 1,292 0.19% PETE 994 512 1,217 1,643 1,999 0.29% LDPE 3,052 4,324 5,701 7,224 3,881 0.57% Other Plastic 2,026 1,520 764 1,845 2,988 0.44% Container Glass 17,757 19,590 19,039 29,476 24,503 3.59% Food Waste 20,753 13,221 25,330 20,144 32,900 4.83% Yard Waste 229,267 114,102 163,529 183,054 222,701 32.67% Ferrous Metals 42,828 45,606 51,219 53,545 53,979 7.92% Nonferrous Metals 8,876 10,944 14,225 11,044 16,733 2.45% Mixed Tin, Alum., Plastic, Glass (from King County transfer stations drop-off sites)
1,425 1,521 1,468 983 1,325 0.19%
Totals: 627,822 418,326 513,368 645,199 681,605
OCC = old corrugated cardboard; HDPE = high density polyethylene; PETE = polyethylene terephthalate; LDPE = low density polyethylene Source: King County Solid Waste Division. Quantities exclude the Cities of Seattle and Milton.
Data from 2005 were not available at the time of the preparation of this report. However, the County estimates the overall recycling rate in King County for 2005 was approximately 43.8 percent.2 The overall quantity of materials recycled per capita is estimated to be 3.07 pounds per person per day, based on the 2004 estimate of 681,605 tons of material recycled and a population estimate of 1,214,900.3
When the quantity of material that was recycled in the 2000 to 2004 time period is combined with the total quantity of waste that was disposed of at the Cedar Hills 2 Source: “Solid Waste Transfer and Waste Export System Plan,” September 2006. This recycling rate is a combined residential and non-residential rate. 3 Source: “2004 Solid Waste Division Annual Report,” King County Department of Natural Resources and Parks.

OVERVIEW OF COUNTY’S CURRENT RECYCLING PROGRAM
001640 | 11-01056-10004 | 6/8/2007 R. W. Beck A-5
Regional Landfill, it is possible to develop an estimate of the total amount of waste that was generated and what percentage of that waste was recycled each year, as presented in Table A-2.
Table A-2 Estimated Total Waste Generation and Recycling Rates
(Thousands of Tons)
2000 2001 2002 2003 2004
Tons of Waste Disposed of at Cedar Hills Landfill (1) 974 936 939 965 991 Tons of Recycled Material (2) 628 418 513 645 682 Total Waste Generated 1,602 1,354 1,452 1,610 1,673 Estimated Recycling Rate (%) (3) 39.2 31.0 35.3 40.1 40.7 (1) Source: County staff. (2) Source: Table 6-1. (3) Equal to “Tons of Recycled Material” divided by “Total Waste Generated.”
The County’s recycling rate continues to increase each year and remains above the national average of 32 percent.4
4 Source: “Municipal Solid Waste in the United States: 2005 Facts and Figures,” U.S. Environmental Protection Agency, 2006. http://www.epa.gov/msw/pubs/ex-sum05.pdf

Appendix B BACKGROUND INFORMATION
ON SPOKANE WTE FACILITY

001640 | 11-01056-10004 | 6/8/2007
Appendix B BACKGROUND INFORMATION ON
SPOKANE WTE FACILITY
The Spokane Regional Waste-to-Energy Facility is the only such facility operating today in Washington State and under the same general regulations that would apply to a potential King County waste-to-energy (WTE) facility. We believe it is valuable for the County to consider many of the lessons learned and developments realized at the Spokane facility.
The Spokane Regional Solid Waste System (the “Spokane System”) was established between Spokane County and the City of Spokane, Washington in 1988. Since then, 12 regional cities and towns as well as Fairchild Air Force Base have joined the Spokane System. The Spokane System’s mass burn WTE facility began operations in September 1991. Wheelabrator Spokane, Inc. operates the facility, under contract to the Spokane System.
The following discussion focuses specifically on the recycling and residue ash management practices employed by the Spokane System.
Recycling Practices In 2005, the Spokane WTE facility processed 277,196 tons of waste and recycled approximately 3.69 percent of the material delivered to the Spokane System.
Table B-1 shows the quantities of materials recovered from the Spokane WTE facility, in tons and as a percentage of the total tons of waste processed.
Table B-1
Quantities of Materials Recovered from the Spokane WTE Facility (in Tons) 2001–2005
Year
Ferrous Metals
Recovered from the Ash
White Goods Recovered from
the Receiving Floor
Total Tons Recovered
MSW Tons Processed
at WTE Facility
Percent Recovered
2005 8,491 1,751 10,242 277,196 3.69% 2004 8,955 1,066 10,021 279,310 3.59% 2003 10,416 1,098 11,514 266,004 4.33% 2002 12,394 1,034 13,428 274,506 4.89% 2001 10,337 971 11,308 268,390 4.21%
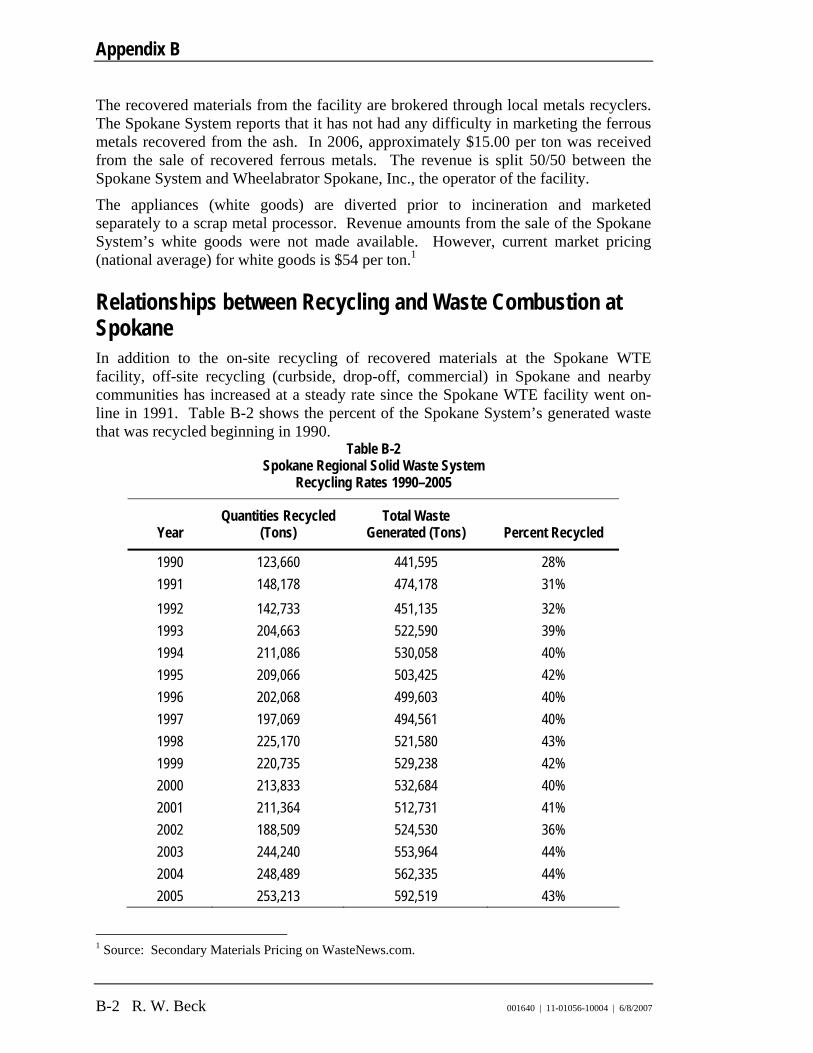
Appendix B
B-2 R. W. Beck 001640 | 11-01056-10004 | 6/8/2007
The recovered materials from the facility are brokered through local metals recyclers. The Spokane System reports that it has not had any difficulty in marketing the ferrous metals recovered from the ash. In 2006, approximately $15.00 per ton was received from the sale of recovered ferrous metals. The revenue is split 50/50 between the Spokane System and Wheelabrator Spokane, Inc., the operator of the facility.
The appliances (white goods) are diverted prior to incineration and marketed separately to a scrap metal processor. Revenue amounts from the sale of the Spokane System’s white goods were not made available. However, current market pricing (national average) for white goods is $54 per ton.1
Relationships between Recycling and Waste Combustion at Spokane In addition to the on-site recycling of recovered materials at the Spokane WTE facility, off-site recycling (curbside, drop-off, commercial) in Spokane and nearby communities has increased at a steady rate since the Spokane WTE facility went on-line in 1991. Table B-2 shows the percent of the Spokane System’s generated waste that was recycled beginning in 1990.
Table B-2 Spokane Regional Solid Waste System
Recycling Rates 1990–2005
Year Quantities Recycled
(Tons) Total Waste
Generated (Tons) Percent Recycled
1990 123,660 441,595 28% 1991 148,178 474,178 31% 1992 142,733 451,135 32% 1993 204,663 522,590 39% 1994 211,086 530,058 40% 1995 209,066 503,425 42% 1996 202,068 499,603 40% 1997 197,069 494,561 40% 1998 225,170 521,580 43% 1999 220,735 529,238 42% 2000 213,833 532,684 40% 2001 211,364 512,731 41% 2002 188,509 524,530 36% 2003 244,240 553,964 44% 2004 248,489 562,335 44% 2005 253,213 592,519 43%
1 Source: Secondary Materials Pricing on WasteNews.com.
BACKGROUND INFORMATION ON SPOKANE WTE FACILITY
001640 | 11-01056-10004 | 6/8/2007 R. W. Beck B-3
Spokane is an example of compatibility between recycling and WTE. The Spokane System’s website reports that recycling generally increases the efficiency of the WTE plant.
For example, the removal of metals and glass:
increases the Btu value per ton of remaining garbage by approximately 10 percent;
reduces abrasion in the furnace; and
reduces the weight of the ash.
In addition, removing yard waste from disposal increases the efficiency of the plant. Because fresh leaves and grass have a high moisture content, which reduces Btu values, the Spokane System promotes composting as a higher and better use for yard waste.
The Spokane System also promotes the recycling of paper even though removing paper from the garbage does lower the Btu value. The loss is only 1 to 2 percent of the Btu value and is offset by the benefits gained from recycling.
Spokane hopes to increase its recycling rate in the future with plans to expand the recycling of construction, demolition and land-clearing (CDL) debris.
Residue Ash Management Since the facility began commercial operation in November 1991, the residue produced by the facility from the combustion of municipal solid waste (MSW) has been managed as Special Incinerator Ash pursuant to Chapter 70.138 RCW and WAC 173-306.
Current Residue Management The Spokane WTE facility has two Babcock & Wilcox furnace-boiler units with Von Roll grates, each rated at 400 TPD, a Bailey distributed control system, a single 26-MW Turbodyne turbine-generator unit, and six 250-hp element air-cooled condensers. The air emissions control system for each unit consists of the following: Thermal DeNOx System converted to a Urea to Ammonia (U2A) gas injection system, spray dryer/absorber, powdered activated carbon injection, pulse jet baghouse with Gore-Tex bags at a 4:1 air-to-cloth ratio.
The residue system consists of the following elements. Bottom ash is discharged from each furnace-boiler unit’s ram expeller onto a single flat pan vibrating conveyor. The flat pan conveyor spreads out the slugs of material to a single-layer stream. At the end of the flat pan conveyor, but prior to discharging onto the belt conveyor, a bar can be placed diagonally to divert the bottom ash into a container. Typically, a large belt conveyor transports the bottom ash and treated fly ash to a vibrating grizzly separator designed to separate 10-inch plus items to the metal processing area. The underflow material is dropped onto another vibrating pan conveyor. Prior to dropping into the
Appendix B
B-4 R. W. Beck 001640 | 11-01056-10004 | 6/8/2007
chute, the bottom ash is passed under a rotating magnet to extract smaller ferrous metal.
Fly ash residue from the economizers, two spray dryer/absorbers, and 12 baghouse modules is conveyed via enclosed drag chain conveyors into one of two redundant transfer conveyors. The transfer conveyors move the fly ash into one of two surge bins. Each surge bin conveys the fly ash into a pug mill via a screw conveyor. Depending on the level in the surge bin, the screw conveyor and pug mill with stainless steel paddles have single- and double-speed controls. Appropriate quantities of water and phosphoric acid are added to control dust and treat the fly ash via the WES-PHix process. The pug mill discharges the treated fly ash onto the belt conveyor transporting the bottom ash. Both the bottom ash vibrating pan conveyor and the fly ash drag conveyors were extended to accommodate a third unit, thereby allowing continuous operation during construction of a third unit. The vibrating pan conveyor transports the combined residue to a chute that discharges into a waiting intermodal container. Generally, the intermodal containers each hold 25 to 30 tons and 8 to 10 containers are filled in a 24-hour period. All containers are loaded within a building and the access doors are closed during the loading to minimize fugitive dust emissions. The containers are custom designed for the application: 40-cubic-yard capacity, Teflon-lined, top-hinged, double-sealed end door, high-sided, and watertight fully loaded.
Bottom ash, fly ash/absorber residue, and combined residue are sampled each quarter by collecting two eight-hour composite samples of each waste stream on seven consecutive days. Each of these composite samples (42 each quarter) is analyzed for arsenic, barium, cadmium, lead, mercury, selenium, chromium, copper, nickel, zinc, and silver by an independent testing laboratory. Once per year, a quarterly composite sample is analyzed for dioxins and dibenzofurans. The results of the quarterly testing are submitted to the Washington State Department of Ecology (DOE). The Spokane System has tested 42 residue samples from the facility each quarter for the past 15 years.
The Spokane System is required to provide a landfill site and has a contract with Regional Disposal Company (RDC) until 2016 to provide for the transportation and disposal of facility residue, certain bypass, and non-processible waste at the Roosevelt Regional Landfill. This contract is in effect until 2011 with the option to extend it for five additional years. RDC owns and operates the Roosevelt Regional Landfill, which is located approximately 250 miles southwest of Spokane County in Klickitat County, Washington.
The Roosevelt Regional Landfill has been permitted for the acceptance and disposal of the facility’s residue in compliance with state regulations. Excess MSW and residue from the facility is currently being disposed at the Roosevelt Regional Landfill. A special permit was issued in compliance with the provisions of the state’s Special Incinerator Ash Residue Act (RCW 70.138). Permit conditions included construction of a residue monofill, maximum daily receipt of 280 tons, and maximum yearly quantities of 102,200 tons.
BACKGROUND INFORMATION ON SPOKANE WTE FACILITY
001640 | 11-01056-10004 | 6/8/2007 R. W. Beck B-5
The containers are trucked to the Burlington Northern Yardley Intermodal Facility, loaded onto trains, and sent by rail to the Roosevelt Regional Landfill. RDC has provided uninterrupted service to the Spokane WTE facility. The facility has not had to curtail the receipt of solid waste due to a lack of residue service. When RDC experiences problems with rail service due to an uncontrollable derailment and/or increased freight demands, separate truck transport is implemented to maintain quality service.
Residue Testing Results Review of the test data from the facility on combined residue samples collected over the past eight calendar quarters indicated that only two metals, cadmium and lead, are commonly detected by the Toxicity Characteristic Leaching Procedure (TCLP) test at levels requiring additional statistical evaluation. Other metals, including barium, mercury, and selenium, were occasionally detected at or near the method detection limits; however, these levels were typically one to two orders of magnitude below the maximum allowable limits, so a statistical analysis of these levels was not required.
The testing found detectable levels of four of the PAHs (polycyclic aromatic hydrocarbons) of concern for designation, at concentrations ranging from 25 to 43 ug/kg. Summing the known concentrations of these four compounds, in accordance with WAC 173-303-100 (6)(c), the total concentration was 126 ug/kg, or approximately 1/100,000th of the Persistent Dangerous Waste Table designation threshold of 1 percent. Therefore, pursuant to WAC 173-303-100 (6)(a), the residue was not designated as a persistent dangerous waste.
Future Plans for Residue Management In accordance with WAC 173-306-500(4), and in consultation with DOE, the Spokane System has performed various tests and analyses over the past year to determine whether the residue is in fact Special Incinerator Ash, or if it can be managed as a Solid Waste. Based on these analyses the Spokane System determined that the residue from the facility is a Solid Waste. In December 2006, the Spokane System submitted extensive residue testing data to DOE for review, and on March 20, 2007, DOE concurred that the facility residue is a Solid Waste.
Because the residue produced by the facility is not Special Incinerator Ash, the Spokane System intends to manage it as a Solid Waste. Specific proposed activities include the following:
1. Co-dispose of the residue with other solid waste at the Roosevelt Regional Landfill, rather than in the separate monofill;
2. Discontinue separate lab testing of fly ash and bottom ash and reduce the testing frequency of the combined residue;
3. Pursue recycling opportunities for the bottom ash, fly ash, and combined residue; and
Appendix B
B-6 R. W. Beck 001640 | 11-01056-10004 | 6/8/2007
4. Discontinue other management activities which were only required because the combined residue was unclassified and managed as Special Incinerator Ash.
The future enhancements of the facility’s residue processing system may be able to extract nonferrous metals and further process material for reuse. The Spokane System is exploring the use of the combined residue as an alternative daily cover for a MSW landfill and as a component in a remanufactured and marketable material. The Spokane Regional Health District would also monitor reuse of the residue from the facility.
The City of Spokane initially acquired the Malloy Prairie Landfill site in west Spokane County for a future residue monofill. Long-haul disposal options were developed as alternatives to developing the Malloy Prairie site. An environmental siting analysis was completed before site acquisition, but applications for permits have not been filed. The Spokane System could re-evaluate the development of the Malloy Prairie site for use as a residue landfill. This would eliminate the need for shipping the residue around 250 miles to Klickitat County, and would reduce the problems associated with the availability of rail cars.

Appendix C PRINCIPAL ASSUMPTIONS
FOR POWER PRICE FORECAST

001640 | 11-01056-10004 | 6/8/2007
Appendix C PRINCIPAL ASSUMPTIONS FOR
POWER PRICE FORECAST
This appendix describes the principal study assumptions that were used for the Power Price Forecast.
Study Period Price forecasts were developed using the structural simulation model MarketPower™, from January 2007 through December 2026. Prices from 2026 to 2036 were extrapolated using the results through 2026.
Time Periods On-peak hours are defined as the period from 6:00 am to 10:00 pm, Monday through Saturday. All other hours are designated as off-peak.
Inflation Inflation is assumed to be 2.4 percent per year, based on the October 2006 Blue Chip Economic Indicators report.
Load and Resource Balance The load/resource balance is derived from the most current information from utility filings, proprietary databases, and R. W. Beck’s own market research and market intelligence. Planned utility retirements and additions are included in the model, where deemed by R. W. Beck as appropriate. Planned resources that are under construction, have been approved by regional commissions, or have been awarded transmission interconnection are included in the database as named units.
Table C-1 presents the Peak Load and associated growth rates each year thereafter.

Appendix C
C-2 R. W. Beck 001640 | 11-01056-10004 | 6/8/2007
Table C-1 2007 Peak Load (MW) and Annual Growth Rates
Generic Resource Additions New generic generation units are added to each of the market areas to maintain the given region’s specified reserve margin. The study uses standardized assumptions for the cost of fossil-fueled resources that likely will be constructed to serve baseload, cycling and peaking power needs. Table C-2 summarizes the assumptions used in the assessment for generic gas-fired combined-cycle generators, generic gas-fired simple-cycle generators and generic supercritical pulverized coal-fired generators, respectively. Table C-2 depicts projections of regional average values without regard to site-specific and unit-specific issues that may cause significant deviations from the projected values. The values presented in Table C-2 should not be used to evaluate specific projects.

PRINCIPAL ASSUMPTIONS FOR POWER PRICE FORECAST
001640 | 11-01056-10004 | 6/8/2007 R. W. Beck C-3
Table C-2 Generic Generator Assumptions
Combustion Turbine - F Class
Western Washington Year 2009
Combined Cycle
Western Washington
Year 2010 Combined Cycle
Western Washington
Year 2011 Combined Cycle
Western Washington
Year 2012 Combined Cycle
Western Washington Year 2013
Combined CycleCapacity (MW) 168 550 560 570 580 590Installed Capital Cost (2006 $ per kW) 660 1,030 1,023 1,015 1,008 1,000Debt/Equity Ratio 70/30 70/30 70/30 70/30 70/30 70/30Interest Rate 7.5% 7.5% 7.5% 7.5% 7.5% 7.5%After Tax Return on Equity 13.0% 13.0% 13.0% 13.0% 13.0% 13.0%Financing Period (years) 20 20 20 20 20 20First Year of Operation 2008 2009 2010 2011 2012 2013Fixed O&M (2006 $ per kW-year) 7.50 19.50 19.50 19.50 19.50 19.50Forced Outage Rate 1.0% 2.0% 2.0% 2.0% 2.0% 2.0%Heat Rate (Btu per kWh) 10,300 7,040 7,003 6,965 6,928 6,890Maintenance Rate 3.0% 5.0% 5.0% 5.0% 5.0% 5.0%NOX Emissions Rate (lb per Mmbtu) 0.01 0.01 0.01 0.01 0.01 0.01SO2 Emissions Rate (lb per Mmbtu) 0.0006 0.0006 0.0006 0.0006 0.0006 0.0006Variable O&M (2006 $ per MWh) 13.24 3.50 3.38 3.25 3.13 3.00
Western Washington Year 2014
Combined Cycle
Western Washington Year 2015
Combined Cycle
Western Washington
Year 2016 Combined Cycle
Western Washington
Year 2017 Combined Cycle
Western Washington
Year 2018 Onward
Combined Cycle
Eastern Washington
Super-Critical Pulverized Coal -
PRBCapacity (MW) 650 710 771 831 891 800Installed Capital Cost (2006 $ per kW) 966 932 898 864 830 2,230Debt/Equity Ratio 70/30 70/30 70/30 70/30 70/30 70/30Interest Rate 7.5% 7.5% 7.5% 7.5% 7.5% 7.5%After Tax Return on Equity 13.0% 13.0% 13.0% 13.0% 13.0% 13.0%Financing Period (years) 20 20 20 20 20 30First Year of Operation 2014 2015 2016 2017 2018 2012Fixed O&M (2006 $ per kW-year) 19.50 19.50 19.50 19.50 19.50 42.00Forced Outage Rate 2.0% 2.0% 2.0% 2.0% 2.0% 4.0%Heat Rate (Btu per kWh) 6,808 6,726 6,644 6,562 6,480 9,240Maintenance Rate 5.0% 5.0% 5.0% 5.0% 5.0% 9.0%NOX Emissions Rate (lb per Mmbtu) 0.01 0.01 0.01 0.01 0.01 0.07SO2 Emissions Rate (lb per Mmbtu) 0.0006 0.0006 0.0006 0.0006 0.0006 0.1Variable O&M (2006 $ per MWh) 3.00 3.00 3.00 3.00 3.00 1.80
Other Resource Assumptions Fixed and variable operation and maintenance (O&M) costs and unit heat rates for existing generating units are based on historical data. Forced and scheduled resource outages are based primarily on National Energy Regulatory Commission (NERC) historical averages reported in its Generating Availability Data System (GADS) publications. The majority of units were modeled to be dispatched economically, meaning such units were dispatched only when they were the next least expensive unit needed to meet the next increment of load. However, for reasons such as reliability and operating restrictions, some units are considered “must-run.” The model dispatches these units regardless of economic conditions and, as such, they may produce energy even when regional prices indicate it is uneconomic for the units to
Appendix C
C-4 R. W. Beck 001640 | 11-01056-10004 | 6/8/2007
run. Wind and hydroelectric dispatch is based on individual unit historical monthly energy and load patterns, where available. For units without publicly available information, generalized assumptions by resource type are used.
Fuel Price Forecasts We used the Energy Information Administration’s Annual Energy Outlook 2007 (AEO 2007) for the natural gas price forecast at Henry Hub (Louisiana). Henry Hub is the focus of financial market trading on the NYMEX owing to its proximity to pipelines that carry as much as 50 percent of U.S. natural gas supply, thus creating robust liquidity.
Regional delivered gas prices that are used to model power prices and dispatch of gas-fired generating units are developed from our proprietary Pipeline Demand Balance model. This model estimates basis differentials between Henry Hub and various supply basins and market hubs by allocating supply over specific pipeline paths to meet demand in specific markets and evaluating the resulting capacity utilization and/or excess supply available. Because the model allows both supply and demand to change over time, the model estimates dynamic basis differentials (changes in basis over time, between market locations). These basis differentials, when added to the Henry Hub price, represent a generally available market price of natural gas facing consumers within the region that changes over time according to the projected change in supply and demand in that region relative to other regions in the United States.
The end result is a set of natural gas prices that represent the price of gas delivered into a particular geographic market or zone. Use of zonal prices recognizes that all generators within a given regional market experience similar market conditions and can pay a similar price for natural gas. R. W. Beck’s projections for natural gas pricing do not take into account specific circumstances that vary from project to project, such as specially negotiated contracts or transportation arrangements that allow them to reduce their gas costs relative to other generators in that same market; such information is largely non-public and therefore inaccessible.
Table C-3 provides the Base Case natural gas price forecast used in this study.
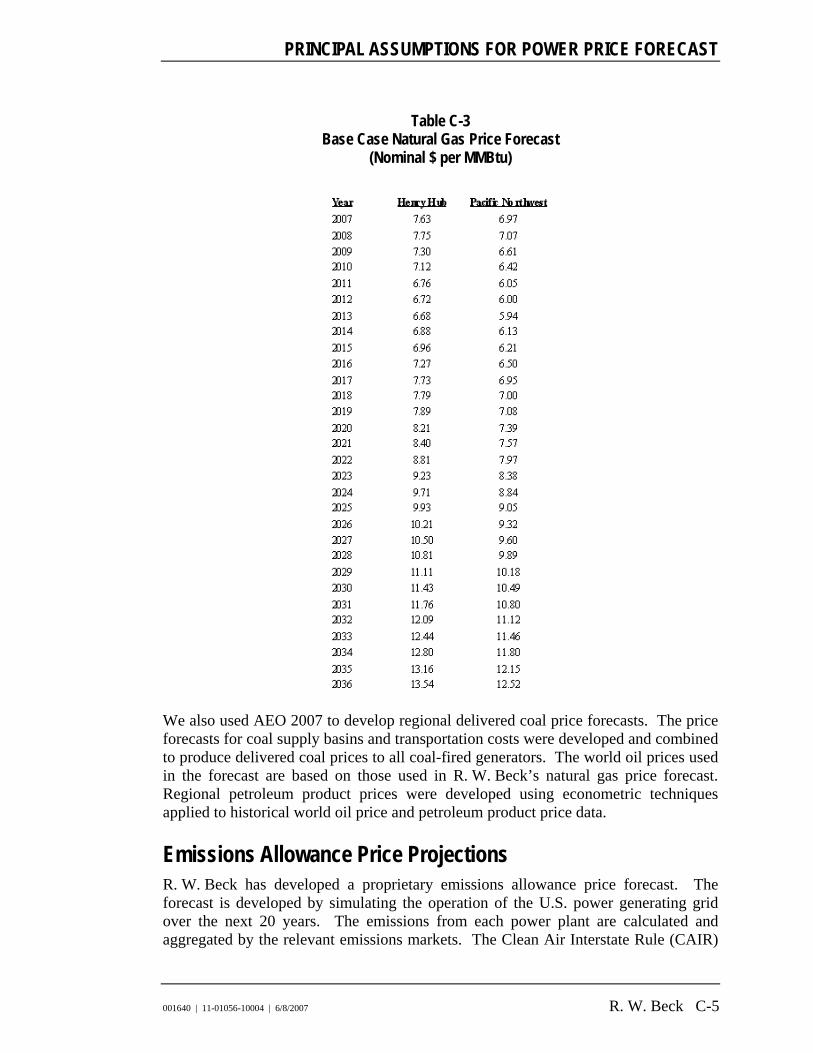
PRINCIPAL ASSUMPTIONS FOR POWER PRICE FORECAST
001640 | 11-01056-10004 | 6/8/2007 R. W. Beck C-5
Table C-3 Base Case Natural Gas Price Forecast
(Nominal $ per MMBtu)
We also used AEO 2007 to develop regional delivered coal price forecasts. The price forecasts for coal supply basins and transportation costs were developed and combined to produce delivered coal prices to all coal-fired generators. The world oil prices used in the forecast are based on those used in R. W. Beck’s natural gas price forecast. Regional petroleum product prices were developed using econometric techniques applied to historical world oil price and petroleum product price data.
Emissions Allowance Price Projections R. W. Beck has developed a proprietary emissions allowance price forecast. The forecast is developed by simulating the operation of the U.S. power generating grid over the next 20 years. The emissions from each power plant are calculated and aggregated by the relevant emissions markets. The Clean Air Interstate Rule (CAIR)

Appendix C
C-6 R. W. Beck 001640 | 11-01056-10004 | 6/8/2007
and other emissions regulations are modeled and the emissions prices are determined by the implementation of specific emission control technologies on individual plants. The process is iterated until stable emissions clearing prices are reached.
The emissions clearing prices incorporate the effects of future generation expansion, generation technology, emission control technologies and their incremental cost, and emissions regulations. Cost functions for capital, fixed and variable costs are developed for each emission control technology. We developed the emission control cost estimates.
Market Areas and Transmission The transmission system is a critical factor in electric energy price volatility and electric market access. Limitations of the transmission system can have dramatic impacts on the electric energy marketplace and the profitability of individual generation units. The vast majority of the transmission system developed in the United States was put in place prior to 1992 and deregulation of the wholesale power business. The original design intent for most transmission investment was centered on the concept of constructing lines for reliability and to move power from a local utility’s own generation to its own load centers. The existing transmission system is generally limited in its capability to handle substantial power transfer from control area to control area. Correspondingly, as new generation is built a key issue that must be examined is whether the output of the new plant can be transmitted to its intended market.
The zonal simulation used for this assessment computes energy and capacity prices through the modeling of market areas interconnected through a simplified representation of the electric transmission system. Loads and resources are segregated into market areas, which are then interconnected though defined transmission links and interfaces (which may apply to multiple links) to depict a maximum power flow that can occur between market areas. When properly applied, this simplified representation of the market topology is an industry-accepted technique for modeling market prices. However, the technique is only an approximation of the actual operation of the electric transmission network.
For this assessment, R. W. Beck’s transmission experts have established transfer limits between modeled market areas based on system design constraints, published data and reports, and analyses of flows within and between market regions. Estimates for any applicable transmission wheeling costs and transmission losses are based on historical information. Figure C-1 depicts the Western Electricity Coordinating Council (WECC) modeled market areas and transmission links between them.

PRINCIPAL ASSUMPTIONS FOR POWER PRICE FORECAST
001640 | 11-01056-10004 | 6/8/2007 R. W. Beck C-7
Figure C-1
WECC Market Areas


![PAUL'S CONVERSION/CALL: A COMPARATIVE ANALYSIS … · jbl 10013 (]981) 415-432 paul's conversion/call: a comparative analysis of the three reports in acts charles w. hedrick southwest](https://static.fdocuments.net/doc/165x107/5b8423fc7f8b9a4a488bab59/pauls-conversioncall-a-comparative-analysis-jbl-10013-981-415-432-pauls.jpg)