Comparative Assessment of Technologies: Crystalline PV vs ...
14
Standardized report format W I S E Report 35 r Comparative Assessment of Technologies: Crystalline PV vs. Thin Film Solar Overview Overview Overview Overview This comparative assessment of the two technologies: crystalline PV and thin film solar is neutral with respect to technologies, companies, lenders, institutions and societal interests. Presently, all stakeholders in this sector are on a learning curve. While carrying out this comparative assessment exercise, many organizations, individuals, scientists, government officers, promoters, manufacturers and financiers have been contacted. Their views along with supporting documents provided by them, while subject to confidentiality, have been very helpful in enriching the study. Therefore, the names of individuals have not been included. Only references already available in the public domain have been incorporated for the sake of transparency and independent evaluation. The objective of this study is to help all the stakeholders, so as to result in the healthy growth of the solar power sector in India. This comparative assessment looks at the two technologies from four different perspectives: the perspectives of equity investors, the perspectives of debt investors (lenders), the perspectives of various institutional entities including central and state govt bodies, and also the societal perspective towards environmental externalities. Hence the two technologies are judged from these differing perspectives in arriving at a balanced conclusion with respect to the technologies. Comparison of Comparison of Comparison of Comparison of Investment Costs: The Equity Investors Investment Costs: The Equity Investors Investment Costs: The Equity Investors Investment Costs: The Equity Investors perspective perspective perspective perspective This section of the study has been carried out for comparing the investment costs of crystalline and thin film PV technologies. This comparison is important from the equity investors’ perspective. It also has relevance in the debt investors’ perspective. A sample case of 1 MW each power project has been considered. A cost break-up has been prepared considering the present module cost as of 11 th April 2012 (www.pvinsights.com ) and latest forex conversion rate of RBI. The project cost break-up accordingly for both the technologies is given below: Table 4.1 Comparative Project cost of crystalline & thin film SPV power project (1 MW) Crystalline Thin film Cost Component Rs in lakhs Land (3.2 Lakh/ acre) (1) 14.4 28.8 PV module (2) 447 383 Civil and General Work (3) 90 135
Transcript of Comparative Assessment of Technologies: Crystalline PV vs ...

Standardized report format
WISE Report
35
r Comparative Assessment of Technologies:
Crystalline PV vs. Thin Film Solar OverviewOverviewOverviewOverview
This comparative assessment of the two technologies: crystalline PV and thin film solar is
neutral with respect to technologies, companies, lenders, institutions and societal interests.
Presently, all stakeholders in this sector are on a learning curve. While carrying out this
comparative assessment exercise, many organizations, individuals, scientists, government
officers, promoters, manufacturers and financiers have been contacted. Their views along
with supporting documents provided by them, while subject to confidentiality, have been
very helpful in enriching the study. Therefore, the names of individuals have not been
included. Only references already available in the public domain have been incorporated for
the sake of transparency and independent evaluation. The objective of this study is to help
all the stakeholders, so as to result in the healthy growth of the solar power sector in India.
This comparative assessment looks at the two technologies from four different perspectives:
the perspectives of equity investors, the perspectives of debt investors (lenders), the
perspectives of various institutional entities including central and state govt bodies, and also
the societal perspective towards environmental externalities. Hence the two technologies
are judged from these differing perspectives in arriving at a balanced conclusion with
respect to the technologies.
Comparison of Comparison of Comparison of Comparison of Investment Costs: The Equity InvestorsInvestment Costs: The Equity InvestorsInvestment Costs: The Equity InvestorsInvestment Costs: The Equity Investors perspectiveperspectiveperspectiveperspective
This section of the study has been carried out for comparing the investment costs of
crystalline and thin film PV technologies. This comparison is important from the equity
investors’ perspective. It also has relevance in the debt investors’ perspective. A sample case
of 1 MW each power project has been considered.
A cost break-up has been prepared considering the present module cost as of 11th April 2012
(www.pvinsights.com) and latest forex conversion rate of RBI. The project cost break-up
accordingly for both the technologies is given below:
Table 4.1 Comparative Project cost of crystalline & thin film SPV power project (1 MW)
Crystalline Thin film
Cost Component Rs in lakhs
Land (3.2 Lakh/ acre)(1) 14.4 28.8
PV module (2) 447 383
Civil and General Work(3) 90 135
Comparative Assessment of Technologies: Crystalline PV vs Thin Film Solar
WISE Report
36
Mounting Structures(4) 100 150
Power conditioning unit(5) 98 98 Preliminary and pre-operative expenses including IDC and contingency(6) 80 80 Additional cost towards degradation & auxiliary (ref CERC guidelines)(7,8,9,10) 66 66 Evacuation Cost up to Inter-connection Point (Cables and Transformers)(11) 100 120
Total capital cost 995.8 1060.9
Please refer the following subsections (1-11) for the basis of cost estimation
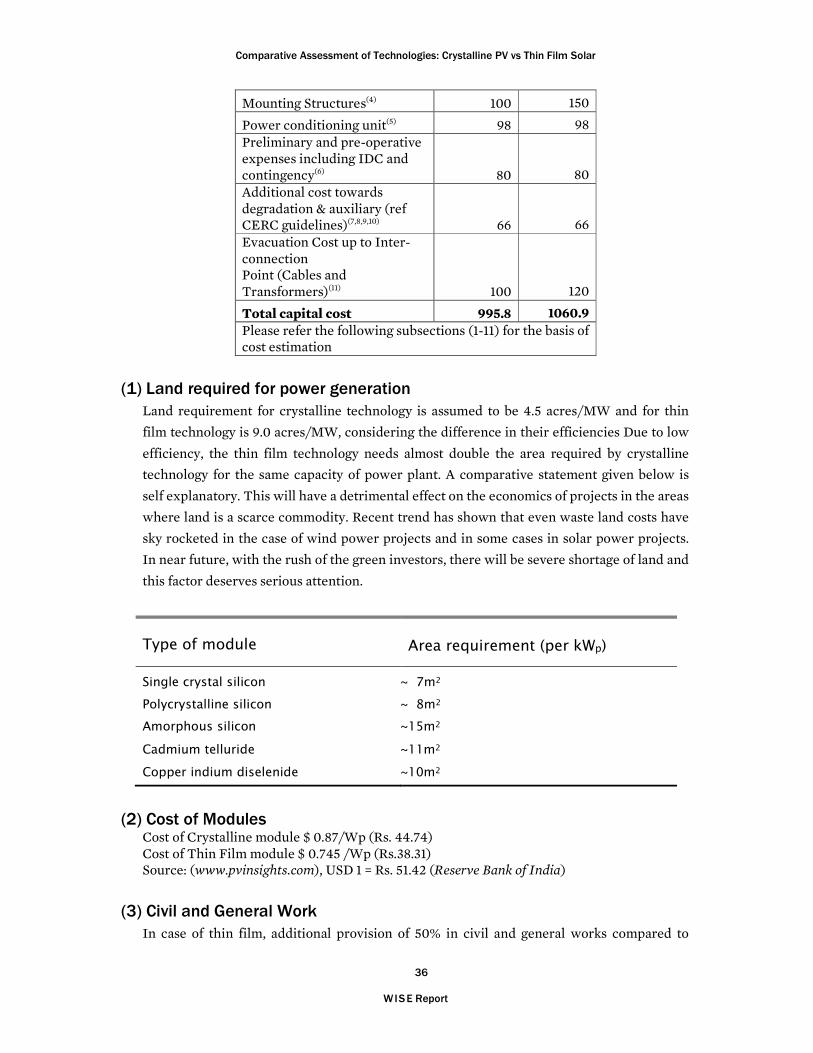
(1) Land required for power generation
Land requirement for crystalline technology is assumed to be 4.5 acres/MW and for thin
film technology is 9.0 acres/MW, considering the difference in their efficiencies Due to low
efficiency, the thin film technology needs almost double the area required by crystalline
technology for the same capacity of power plant. A comparative statement given below is
self explanatory. This will have a detrimental effect on the economics of projects in the areas
where land is a scarce commodity. Recent trend has shown that even waste land costs have
sky rocketed in the case of wind power projects and in some cases in solar power projects.
In near future, with the rush of the green investors, there will be severe shortage of land and
this factor deserves serious attention.
(2) Cost of Modules Cost of Crystalline module $ 0.87/Wp (Rs. 44.74) Cost of Thin Film module $ 0.745 /Wp (Rs.38.31) Source: (www.pvinsights.com), USD 1 = Rs. 51.42 (Reserve Bank of India)
(3) Civil and General Work
In case of thin film, additional provision of 50% in civil and general works compared to
Type of module Area requirement (per kWp)
Single crystal silicon � 7m2
Polycrystalline silicon � 8m2
Amorphous silicon �15m2
Cadmium telluride �11m2
Copper indium diselenide �10m2
Comparative Assessment of Technologies: Crystalline PV vs Thin Film Solar
WISE Report
37
crystalline has been considered, due to the larger area of works.
(4) Mounting Structures
For mounting structure and cabling an additional cost of 50% and 20% respectively
compared to crystalline has been considered, due to larger area.
(5) Power Conditioning Unit
This cost is assumed equal for both technologies
(6) Pre-Operative Expenses
This cost is assumed equal for both technologies
(7) Module degradation
As stated in the technical chapters, module degradation on exposure to sunlight is the
inherent property of solar modules of all types whether crystalline or thin film. Thin films
are by nature such that there is initial drop in power output due to light soaking up to 1000
hours of exposure to radiation and thereafter it stabilizes for long term. No such effect is
observed in crystalline solar cells. Therefore in the case of thin film one must ask about the
“stabilised output” rather than “initial output”. Although, different manufacturers claim
their own performance indicators, actual measurements at the sites after 10-20 years of
installation is the only way to get the true picture. Some of the observations of WISE
research team in this regard are as follows:
• NREL study of various kinds of 10 years old SPV modules installed at Solar Energy
Centre, New Delhi has shown that the degradation in thin film modules is 2% or
more per year. Moisture seepage through edges has been observed. Many of the thin
film modules had “bar graph corrosion”.
• Mono-crystalline solar modules used for off-grid applications at the Solar Energy
Centre have shown amazing results. These modules are referred to as champion
modules wherein only 10% degradation has been observed in more than 20 years old
mono-crystalline solar modules. (A Sinha et al. “Performance of champion’s module
of PV lighting systems in India”, Oral presentation).
• A close study of percentage-degradation of various kinds of modules has shown
maximum degradation in thin film modules and the losses in power were observed
primarily due to material degradation. While, mono and multi crystalline modules
have shown power reduction from the rated output of 1-10%, amorphous silicon
recorded 16-30%. The same value for CdTe module was 19% and that for CIS module
36%. None of the modules had any visual defects (as seen with naked eyes) and
appeared normal. However, electroluminescence and thermal imaging have shown
the degradation spots very clearly. Amorphous silicon modules have shown
electrochemical degradation of SnO2 layers. (O S Sastry et al. “Degradation in
performance ratio and yield of exposed modules under arid

Comparative Assessment of Technologies: Crystalline PV vs Thin Film Solar
WISE Report
38
conditions”, 26th European photovoltaic solar energy conference and exhibition).
Figure 4.1 CIS modules under field condition
• A performance ratio comparison has shown that thin film modules have better
performance ratio in general. Further, amorphous silicon performance was 16%
higher in the months of April and May and 12% less during December as compared
to multi-crystalline modules.
• Even IEC certified mono-crystalline modules have degradation in certain cases.
However, these were mainly due to degradation of encapsulant materials rather than
the basic cell degradation. Therefore, certification of only sample modules is not
sufficient and occasional testing of sample field modules is also recommended for
larger power projects.
• Out of a series of different modules studied at the ambient temperature of 40 oC, a
failure of 70% of thin film modules and 25% of crystalline silicon modules were
observed. The extent of degradation has not been reported. Govindasamy Tamizh
Mani, TÜV Rheinland PTL & Arizona State University, Tempe, Arizona, USA, which
appeared in the eighth print edition of Photovoltaics International journal, on
“Testing the reliability and safety of photovoltaic modules: failure rates and
temperature effects”,
• A study by European Commission, DG JRC, Institute for Energy, Ispra, Italy has
shown that mono-crystalline silicon modules are still working perfectly with very
low degradation rate of maximum 0.8% per year. This is one of the best
performances for mono-crystalline modules till date. According to them they have
found no statistically significant difference in poly and single crystalline modules.
• In 1990, the Schatz Energy Research Center (SERC) installed a nominal 9.2 kWp
photovoltaic (PV) array at Humboldt State UniversityÕs in Trinidad. A degradation
study has shown that mono-crystalline SPV modules have shown only 4%
Comparative Assessment of Technologies: Crystalline PV vs Thin Film Solar
WISE Report
39
degradation in 11 years even under the corrosive environment of seashore.
All the above studies indicate that thin film module degradation is much faster than
crystalline modules. Mono-crystalline and probably poly-crystalline silicon modules have
shown very good stability with time.
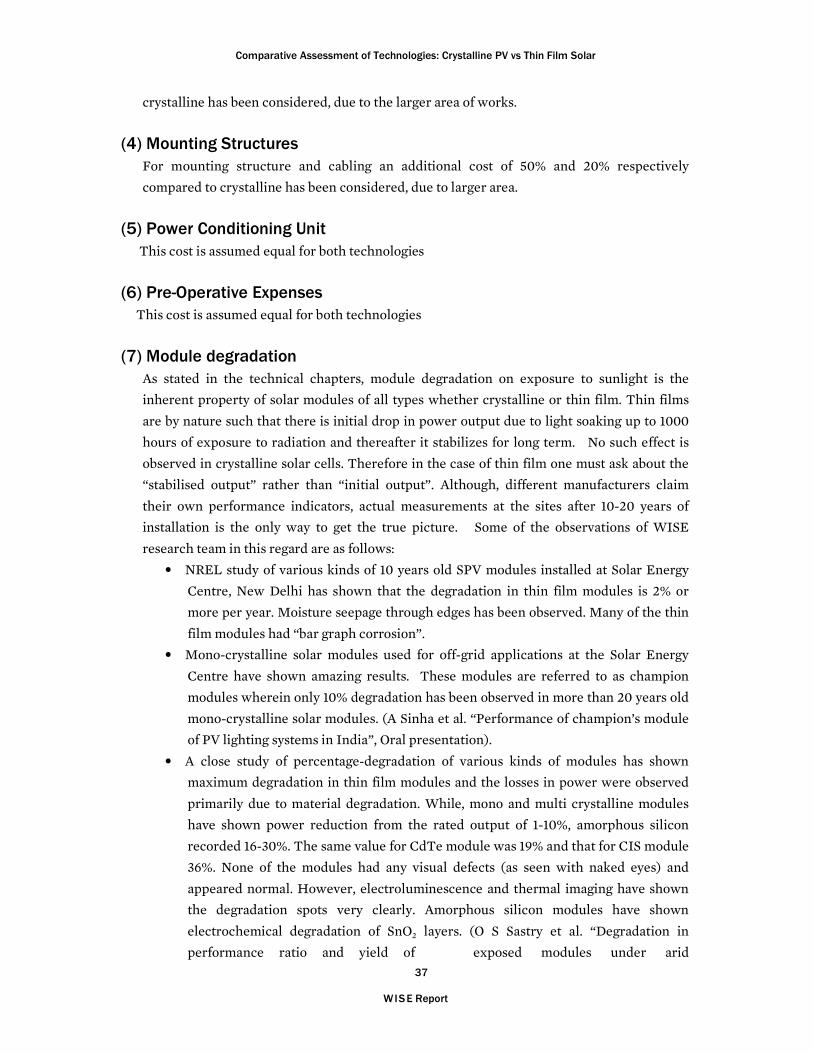
A sensitivity analysis regarding generation of energy using a sample case of 1 MW for crys-
talline and thin film each has been carried out CUF 19% for 1st year as per CERC norm and
degradation factors of 0.5% and 3.0% for crystalline and thin film technologies respectively.
A comparative picture is shown in figure 4.2, which indicates that if 1 MW crystalline PV
project is replaced by same capacity thin film project, there will be loss of 9,634,282 units
over a period of 25 years.
Fig 4.2 Comparative energy generation by 1 MW crystalline vs. thin film SPV
power project during 25 years of lifetime
(8) Life of the modules
While all the modules manufacturers claim 25 years of life whether it is crystalline or thin
film, the main question is what would be the balance capacity after 25 years considering the
degradation rate. A good quality and state-of-art hermetically sealed crystalline module has
been reported to be working with little degradation even after 25 years which is a bonus for
the power plant owner. The experience at the Solar Energy Centre, New Delhi shows upto
40% degradation in 10 years in the case of thin films. Under such situation, the life of thin
film modules is questionable and poses technology risk to the project.

Comparative Assessment of Technologies: Crystalline PV vs Thin Film Solar
WISE Report
40
(9) Breakage and replacement
The thin film modules have a double glass structure. Thin film of absorber materials are
deposited either on “substrate” or on “superstrate” depending upon the side exposed to sun.
Under both the situations, the thin film is sandwiched between two glass sheets.
Figure 4.3 Typical Thin Film Solar Cell structures for single-
junction: (a) substrate Cu(InGa)Se2; (b) superstrate CdTe;
It is well known that the due to inherent losses, the actual cell temperature is higher than
the ambient temperature and many times it goes upto 25-30 deg C above the ambient
temperature. This causes thermal stress not only to solar cells but to encapsulant also e.g.
EVA material and glass.
In the case of thin film solar cells, the thin layer of absorber material is fixed between two
glass layers of around 3mm thickness each. In the event of rise in temperature, the two rigid
layers of glass face severe stress due to temperature difference between top and bottom
layers. This causes micro-cracks in the top glass layer. Such a case is more prominent when
the thin film modules are washed with a spray of water at around 6:00 p.m. while the whole
system is yet to be stabilized to normal temperature. It has been observed that modules are
generally cleaned in the evenings due to availability of labour. Eventually, the micro-cracks
keep increasing resulting into complete deterioration of the solar module due to ingress of
moisture.
Therefore, the thin film power plants have to compulsorily replace 1% of modules per year
that leads to additional cost. However, this factor is not incorporated while calculating the

Comparative Assessment of Technologies: Crystalline PV vs Thin Film Solar
WISE Report
41
financials of thin film power projects.
Figure 4.4 Micro-cracks resulting into major cracks in thin film modules
However, in case of crystalline PV modules, no such replacement of modules are reported
anywhere. The crystalline PV cells are fixed between encapsulant (usually ethylene vinyl
acetate; EVA) and back sheet (polyvinyl fluoride films). The top layer is toughened glass
above the EVA layer. In the case of heating of cells, the top layer has higher temperature
compared to bottom layer due to natural cooling on the lower side and cell heating at top
layer. The thermal stress faced between the layers, as radiation increases, is managed due to
flexible back sheet that avoids any crack on the top glass layer.
(10) Warranty Periods
For, crystalline modules, confidence among manufacturers has increased over time as
shown by the following table.
Table 4.2 Increase in warranty of SPV modules
over a period of years
Period Warranty
Before 1987 5 years
1987 to 1993 10 years
1993 to 1999 20 years
Since 1999 25 years
The crystalline module manufacturers are now offering warranty for 10% degradation in
output in 12 years and 20% in 25 years which indicates higher confidence level.
Interestingly, thin film module manufacturers are also now providing warrantee for 10%
degradation in output in 10 years and 20% in 25 years. The reason that the warranties have
been increased is that the manufactures had to compete with crystalline silicon modules.
However, they provide the basis of IEC 61646 certification which carries out accelerated

Comparative Assessment of Technologies: Crystalline PV vs Thin Film Solar
WISE Report
42
degradation test under simulated situation. There are doubts whether thin film will actually
show this trend in actual field conditions.
Many technical experts and financial experts have suggested that additional bank guarantee
needs to be taken from the manufacturer of thin film modules to cover the field condition
risks. This becomes more important when manufacturers use the term “limited warranty”.
Further, the asterisk of “conditions apply” indicates that “manufacturer reserves the right to
modify the specification and warranties without notice”. Moreover, the limited warranty
certificates made public by the company especially for thin film solar modules are both
vague and ambiguous. While limited warranty may be a comfortable position for the
crystalline modules reported with minimum degradation, the same for thin film puts it into
an uncomfortable position due to reported faster degradation of thin films.
As stated earlier, the thin film modules suffer from initial decay. Some manufacturers do not
mention whether the rated values are post initial decay or the initial one and what is the
initial decay percentage. (Recently, a news report in the 5 March 2012 issue of “The Hindu”
has reported that First Solar has admitted that one of the reasons for its 4th quarter operating
loss of $485.3 million was higher warranty payments.) Therefore, one needs to be careful
while reading the warranty clauses and module rating under stabilised condition.
Despite the technological differences outlined in (7), (8), (9) and (10), we have assumed
the same cost component for both technologies, based on current CERC guidelines
which do not differentiate between the two technologies. However, these
technological differences result in lower net generation from thin film technologies as
compared to crystalline PV technologies. This difference shows up in the financial
performance comparison of the two technologies, which is shown in section on
“Comparison of financial returns” below.
(11) Evacuation Cost up to Interconnection Point
Due to the larger spread area of thin film arrays, the cabling cost consisting of both material
costs of cable and labour cost of installation will be higher for thin film PV as compared to
crystalline PV as shown in table 4.1.
CoCoCoComparison of financial returns: Equity Imparison of financial returns: Equity Imparison of financial returns: Equity Imparison of financial returns: Equity Investors perspectivenvestors perspectivenvestors perspectivenvestors perspective
Table 4.3 Financial viability analysis output
Parameter Crystalline Thin film
Project IRR (Pre Tax) 17.30% 13.43%
Project IRR (Post Tax) 15.59% 12.18%
Average Debt Service
Coverage Ratio (DSCR)
1.67 1.37
Equity IRR 19.58% 12.80%

Comparative Assessment of Technologies: Crystalline PV vs Thin Film Solar
WISE Report
43
As regards financial viability analysis, major parameters have been considered as per latest
CERC RE tariff order dated 27th March 2012. By keeping the above project cost, the analysis
has been carried out with only variation of de-rating factor. In the case of thin film, the de-
rating factor of 2% as reported in the field is considered initially. In addition, 1% de-rating in
power generation has been considered to compensate the 1% modules replacement in thin
film power projects. Thus, total 3% of de-rating in the case of thin film is considered for the
practical purpose. The de-rating of 0.5% is considered for crystalline SPV modules based on
practically observed degradation as explained in the preceding chapters. Incorporation of
these parameters results in the above output in calculation of financial viability.
Temperature coefficients of the two technologies
Power output from any kind of solar cell decreases with increase in temperature. It is
reported that temperature coefficient of thin film modules is lower (-0.3%/oC) as compared
to crystalline (-0.4%/oC). Hence, it is claimed that they are more suitable for hot climate and
hence will give more generation for the equivalent capacities of power projects. However,
the most potential areas of Gujarat and Rajasthan also have winter which is favourable for
creating less NOCT. Therefore, low output in summer will be compensated by higher output
in winter which can be seen in the figure 4.5 below.
Fig. 4.5 Energy generation against ambient temperature for 1 MW
crystalline and thin film PV power project
Naturally, there will be a minor effect of this difference of temperature coefficient. The
higher output in hot climate by thin film based power project is yet to be ascertained in
actual field conditions. (Recently, a news item in “The Hindu” dated 5 March 2012 reports
“First Solar admits to unsuitability of its products to hot climate”. According to them, “the
company’s warranty rates for hot climate are slightly higher than for temperate climates”.
The company is reported to keep a provision of 1% additional amount against warranty in
hotter climates). Therefore, the claimed advantage of lower temperature coefficient is not
valid.
Comparative Assessment of Technologies: Crystalline PV vs Thin Film Solar
WISE Report
44
Acceptance by Financial Acceptance by Financial Acceptance by Financial Acceptance by Financial Institutions: Lenders perspectiveInstitutions: Lenders perspectiveInstitutions: Lenders perspectiveInstitutions: Lenders perspective
The Financial Institutions in India are yet to show confidence in thin film technology.
Majority of proposed thin film power projects in India are backed by huge soft international
loans for long term (16.5 years) provided by US Exim Bank, which is the main reason for
promotion of thin film in the country. This constitutes a form of technology risk coverage or
hidden international subsidy to the thin film technology. Thin film technology is presently
less preferred by Indian Financial Institutions. As regards power projects based on
crystalline modules, many of the projects are already installed in India and have been
financed by banks. As Table 4.2 indicates, both Internal Rate of Return (IRR) and Debt
Service Coverage Ratio (DSCR) are higher for crystalline PV. This performance, coupled
with lower technology risk and longer life, makes it more acceptable from Lenders
perspective. While Lenders have a preference for higher returns, it is coupled with a
preference for lower risks in the projects that they finance.
Policy and regulatory aspects: The Institutional perspectivePolicy and regulatory aspects: The Institutional perspectivePolicy and regulatory aspects: The Institutional perspectivePolicy and regulatory aspects: The Institutional perspective
Government of India and different state governments have been very proactive in promoting
solar sector in line with the enabling instruments provided by the Electricity Act 2003,
NAPCC and JNNSM. Similarly, regulatory bodies i.e. CERC and SERCs have also supported
the solar sector through FiTs and other regulatory provisions. The pragmatic approach on
policy front by the respective governments and regulatory front by the respective regulatory
bodies has resulted in installation of around 800 MW of solar power projects in the country
today, which is higher than envisaged 5 years ago.
The PV sector got a push initially in crystalline PV technology. Recently, thin films have also
attracted attention under JNNSM scheme due to allowance of import for thin film while
crystalline technology has domestic component and are not allowed to import under the
scheme. As a result, large quantities of thin film modules with poor efficiency at the pretext
of so called low cost are being dumped in India from all over the world. More than 60% of
the approved power projects will be using thin film technology. Ultimately the nation will be
the loser.
As stated above, crystalline and thin film technologies are primarily different from each
other considering the technical parameters and application methodologies. They need dif-
ferent treatments. However, the policy and regulation in the country does not differentiate
between the two technologies. It is again emphasized based on the analysis in preceding sec-
tions that the nation will be loser by 9,634,282 units/MW in 25 years life of the project if
only thin film PV power project are installed in the country. That translates into 4,817 MUs
loss in 25 years for the present scenario in the country with 1000 MW installed capacity hav-
ing 50% share of thin film. Things will further worsen with yearly capacity addition of solar
power projects dominated by thin film tech- nology. This will pose a setback to the en-

Comparative Assessment of Technologies: Crystalline PV vs Thin Film Solar
WISE Report
45
ergy policy makers who have projected energy security by achieving solar power of 20,000
MW by 2022 assuming 19% CUF.
Both the technologies need entirely different treatment on policy and regulatory front
mainly because the government and regulatory bodies are responsible to the society for;
• Efficient utilization of land resource
• Assuring long-term power availability
• Quality assurance and reliability of power
• Avoiding large scale dumping of lower efficiency technologies
• Dissemination of correct information to investors
• Health hazard of the technologies
• Declaration of PV as e-waste and efficient management of waste from power projects
after useful life
Use of thin film technology is exempted from domestic content guidelines applicable to
crystalline technology. As a result, majority of the projects under JNNSM are expected to
prefer thin film technology considering their lower cost and without taking care of other
implications. The decisions are purely based on financial considerations and no care is taken
for efficient land utilization, environmental concerns and long-term profitability. In fact,
many of the promoters are not aware of the technicalities and their implication on their
future revenues resulting in large-scale dumping of low quality thin film modules in India
which will have a wider ramification in the coming years. The short-term view of investing
and exiting as soon as the investment is recovered, is detrimental to the national interest.
It is the government’s responsibility to maintain a level playing field in the competing PV
technologies. At the same time, it is the responsibility of regulators to vet the technical and
financial parameters for thin film and crystalline technologies and to accord differential
regulatory treatment, if necessary. Presently, the policies and regulations are both
completely silent about the type of PV cells and their future impact on state and national
power scenario.
Environmental Environmental Environmental Environmental externalities: The societal perspectiveexternalities: The societal perspectiveexternalities: The societal perspectiveexternalities: The societal perspective
CdTe raises environmental concerns because Cadium is highly toxic. The maximum
permissible value for workers (according to German law) is 15 micro gram per litre. No such
law exists in India. Once absorbed, Cd is efficiently retained in the human body, in which it
accumulates throughout life. Cd is primarily toxic to the kidney, especially to the proximal
tubular cells, the main site of accumulation. Cd can also cause bone demineralization, either
through direct bone damage or indirectly as a result of renal dysfunction. (A. Bernard,
“Cadmium & its adverse effects on human health”, Indian J Med Res 128, October 2008, pp
557-564).

Comparative Assessment of Technologies: Crystalline PV vs Thin Film Solar
WISE Report
46
Under Indian conditions, it is observed that minimum 1% of modules need to be replaced
every year due to breakage of modules caused by thermal stress and micro cracks. These
rejected modules can pose severe environmental hazards.
The main manufacturer of CdTe “First Solar” has a policy of EPR (Extended Producer
Responsibility) wherein anyone in possession of First Solar module can request collection
and recycling at any time at no additional cost. However, responsibility of dismantling and
packaging of the modules lies with the owner. This is a dicey situation. First, it is not known
whether there is a guarantee that these modules will be taken back by the company. Second,
the rejected modules coming out every year from the power plant and their environmental
impact if kept in the open as prevalent in India with consequent leakage of Cadmium to the
environment through rain water has not been duly considered. Third, the additional cost of
dismantling and packing after their useful life is not currently factored in, nor its effect on
the economics of the project.
Further, solar modules are officially regarded as e-waste and are going to be considered by
the European Union to be regulated under WEEE. This will impose further restrictions.
Scrap generation
Solar power projects based on crystalline modules will generate scrap of 100 tonnes per
MW, after their useful life. Since the mounting structures for thin film are almost double
that of crystalline PV, the scrap generation will also be double in the case of thin film.
Moreover, thin films are expected to have shorter life and hence earlier scrap generation.
None of these life-cycle related costs are internalized into the current cost calculus.
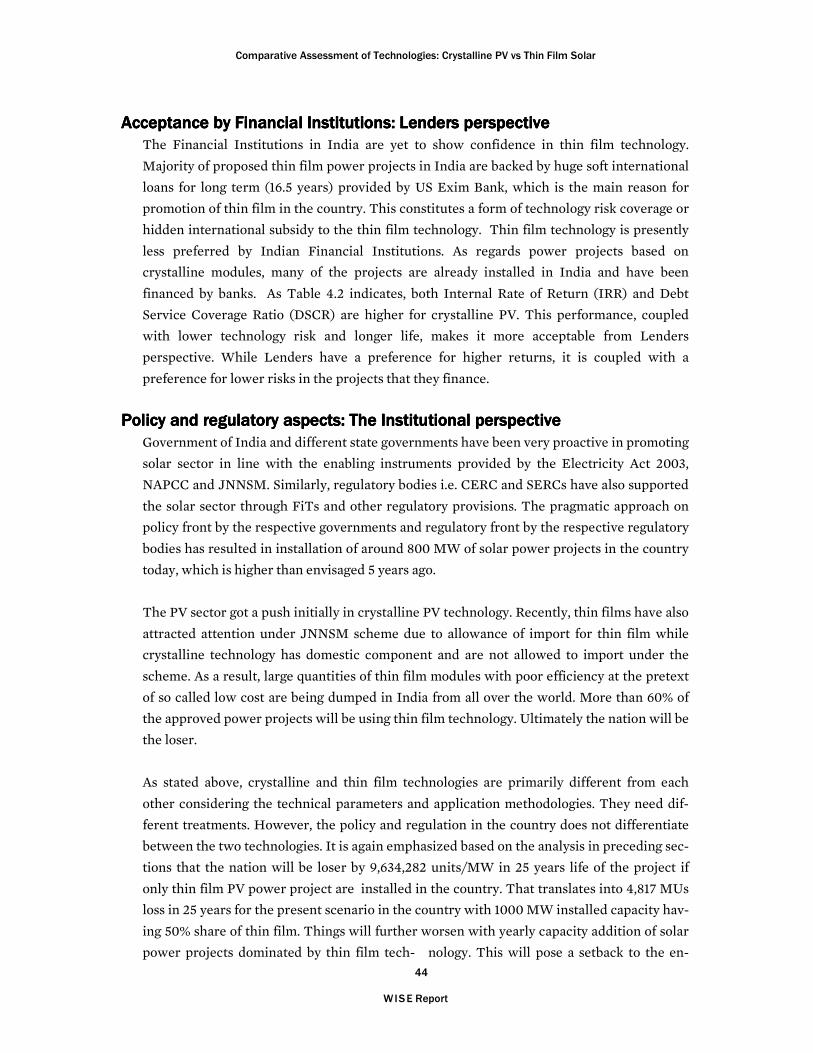
Considering the projected target as given in section on “National Status” in chapter-2, the
comparative projected scrap generation by the two technologies after expiry of the project
i.e. 25 years are presented in figure 4.6 below.
Comparative Assessment of Technologies: Crystalline PV vs Thin Film Solar
WISE Report
47
Fig. 4.6 Comparative projected scrap generation by the two technologies after expiry of the project i.e. 25 years
Thin film business risk: Sample case
An interesting sample case of the business leader in thin film solar cells is of First Solar,
USA. The annual report 2011 of the company has declared following risk factors relevant to
the present study (Reproduce as it is) which are self explanatory.
• Environmental obligations and liabilities could have a substantial negative impact on
our financial condition, cash flows, and profitability.
• Thin-film technology has a short history, and our thin-film technology and solar
modules and systems may perform below expectations; problems with product
quality or performance may cause us to incur significant and/or unexpected
warranty and related expenses, damage our market reputation, and prevent us from
maintaining or increasing our market share.
• If our estimates regarding the future cost of collecting and recycling our solar
modules are incorrect, we could be required to accrue additional expenses at and
from the time we realize our estimates are incorrect and face a significant unplanned
cash burden.
ConclusionsConclusionsConclusionsConclusions
•Thin films do not have the cost advantage in terms of initial investment costs over
the crystalline solar cells – important from both equity and debt perspectives.
•The return on equity is higher for crystalline PV as compared to thin film technology
- important from both equity and debt perspectives.
•The Debt Service Coverage Ratio (DSCR) is higher for crystalline PV as compared to
thin film technology. Projects based on crystalline technology will have lower
technology risk as compared to thin film technology. Both these are important from

Comparative Assessment of Technologies: Crystalline PV vs Thin Film Solar
WISE Report
48
debt perspectives.
•Evaluated over the entire project lifetime of 25 years, i.e. in longer term, crystalline
technology scores significantly higher than thin film technology. Moreover, projects
based on crystalline technologies can probably continue generating beyond 25 years,
making them more attractive.
•Apart from other factors, crystalline technologies require less land per MW
compared to thin film technologies. This is important from policy perspective of
both central and state governments.
•At the project / technology level, thin film technology has higher environmental
externalities due to presence of heavy metals as compared to crystalline PV
technologies. This is important from the societal perspective.
Based on the above considerations, it is concluded that crystalline PV technologies perform
significantly better than thin film technologies in our assessment. This conclusion derives
from the due diligence approach adopted in this study.
****