
Comparative and Quantitative Global Proteomics Approaches ... · Comparative and Quantitative...
39
Proteomes 2013, 1, 180-218; doi:10.3390/proteomes1030180 proteomes ISSN 2227-7382 www.mdpi.com/journal/proteomes Review Comparative and Quantitative Global Proteomics Approaches: An Overview Barbara Deracinois 1,2,3 , Christophe Flahaut 1,2,3 , Sophie Duban-Deweer 1,2,3 and Yannis Karamanos 1,2,3, * 1 Université Lille Nord de France, Lille F-59000, France; [email protected] (B.D.); [email protected] (C.F.); [email protected] (S.D.-D.) 2 Université d‘Artois, LBHE, Lens F-62307, France 3 IMPRT-IFR114, Lille F-59000, France * Author to whom correspondence should be addressed; E-Mail: [email protected]; Tel.: +33-3-21-791-714; Fax: +33-3-21-791-736. Received: 16 September 2013; in revised form: 8 October 2013 / Accepted: 8 October 2013 / Published: 11 October 2013 Abstract: Proteomics became a key tool for the study of biological systems. The comparison between two different physiological states allows unravelling the cellular and molecular mechanisms involved in a biological process. Proteomics can confirm the presence of proteins suggested by their mRNA content and provides a direct measure of the quantity present in a cell. Global and targeted proteomics strategies can be applied. Targeted proteomics strategies limit the number of features that will be monitored and then optimise the methods to obtain the highest sensitivity and throughput for a huge amount of samples. The advantage of global proteomics strategies is that no hypothesis is required, other than a measurable difference in one or more protein species between the samples. Global proteomics methods attempt to separate quantify and identify all the proteins from a given sample. This review highlights only the different techniques of separation and quantification of proteins and peptides, in view of a comparative and quantitative global proteomics analysis. The in-gel and off-gel quantification of proteins will be discussed as well as the corresponding mass spectrometry technology. The overview is focused on the widespread techniques while keeping in mind that each approach is modular and often recovers the other. OPEN ACCESS
Transcript of Comparative and Quantitative Global Proteomics Approaches ... · Comparative and Quantitative...
Proteomes 2013, 1, 180-218; doi:10.3390/proteomes1030180
proteomes ISSN 2227-7382
www.mdpi.com/journal/proteomes
Review
Comparative and Quantitative Global Proteomics Approaches:
An Overview
Barbara Deracinois 1,2,3
, Christophe Flahaut 1,2,3
, Sophie Duban-Deweer 1,2,3
and
Yannis Karamanos 1,2,3,
*
1 Université Lille Nord de France, Lille F-59000, France; [email protected] (B.D.);
[email protected] (C.F.); [email protected] (S.D.-D.) 2 Université d‘Artois, LBHE, Lens F-62307, France
3 IMPRT-IFR114, Lille F-59000, France
* Author to whom correspondence should be addressed; E-Mail: [email protected];
Tel.: +33-3-21-791-714; Fax: +33-3-21-791-736.
Received: 16 September 2013; in revised form: 8 October 2013 / Accepted: 8 October 2013 /
Published: 11 October 2013
Abstract: Proteomics became a key tool for the study of biological systems. The
comparison between two different physiological states allows unravelling the cellular and
molecular mechanisms involved in a biological process. Proteomics can confirm the
presence of proteins suggested by their mRNA content and provides a direct measure of
the quantity present in a cell. Global and targeted proteomics strategies can be applied.
Targeted proteomics strategies limit the number of features that will be monitored and then
optimise the methods to obtain the highest sensitivity and throughput for a huge amount of
samples. The advantage of global proteomics strategies is that no hypothesis is required,
other than a measurable difference in one or more protein species between the samples.
Global proteomics methods attempt to separate quantify and identify all the proteins from a
given sample. This review highlights only the different techniques of separation and
quantification of proteins and peptides, in view of a comparative and quantitative global
proteomics analysis. The in-gel and off-gel quantification of proteins will be discussed as
well as the corresponding mass spectrometry technology. The overview is focused on the
widespread techniques while keeping in mind that each approach is modular and often
recovers the other.
OPEN ACCESS

Proteomes 2013, 1 181
Keywords: proteomics; proteomics: methods; electrophoresis; proteins and peptides;
isotope labelling; fluorescent dies
1. Introduction
The ability of detecting significant differences between two cellular states is a universal approach to
unravelling the cellular and molecular mechanisms involved in a process with an ultimate goal of
discovering new markers, diagnostics and indirectly to track new therapeutic routes. Cellular states are
of physiological or pathological nature that may or may not be stimulated by an exogenous molecule
exist in a changing environment, etc.
By carrying out the major portion of the cell functions, proteins play a major role in living
organisms and are closely related to the phenotype of the cells. The word proteome, first used by
Wilkins in 1994 [1], refers to the entire set of proteins including the modifications made on them,
produced by a tissue or an organism, varying with time and under given physiological (or pathological)
conditions. The analysis of a proteome, proteomics [2,3] can be applied to the study of proteins present
in various types of biological materials, in particular to identify their functions and structures, for
example the identification of interaction sites or PTMs. While the analyses are essentially performed
with cells and/or tissues, the body fluid profiling was anticipated a few years ago [4] and seems to
have a great future. The proteins display a large dynamic range between low and high abundance
(1–105 or 10
6) and even larger in plasma (up to 10
9–10
10) [5].
The correlation between mRNA and protein levels is far from perfect [6] and certainly insufficient
to predict protein expression levels from quantitative mRNA data [7]. No method, equivalent to PCR
used for nucleic acids, is currently available for the amplification of proteins. Add to that, in
proteomics, no method is able, in one step, to identify and quantify a complete set of proteins in a
complex sample. A proteomics approach is a four key-step analytical process. The first step is
dedicated to the cell or sample conditioning (cell growth conditions, cell collection, cell storage, cell
disruption). The second step corresponds to the sample preparation (extraction, concentration,
purification to remove contaminants such as lipids or nucleic acids, and storage of proteins) while the
third is related to methods of separation, and the fourth to quantification and identification of
proteins [8] (Figure 1).
Sample preparation is the most important step in order to obtain the right, reliable and reproducible
result. Ideally the preparation should allow solubilisation of all the proteins in a sample, without any
chemical modification, while eliminating all the interfering compounds (nucleic acids, polysaccharides,
polyphenols, lipids, etc.) and remaining compatible with further analytical methods. Unfortunately, no
universal protocol exists for the sample preparation although several protocols were adapted according
to the biological sample and the objectives of the study [9].
The separation step can be carried out directly on proteins or on the set of peptides derived from the
enzymatic digestion of the corresponding proteins. The separation of proteins or peptides can be
considered in two ways: a first approach, ―in-gel‖, based on electrophoresis and, a second, ―off-gel‖,
based essentially on chromatography. The most used methods for a global differential proteomics
Proteomes 2013, 1 182
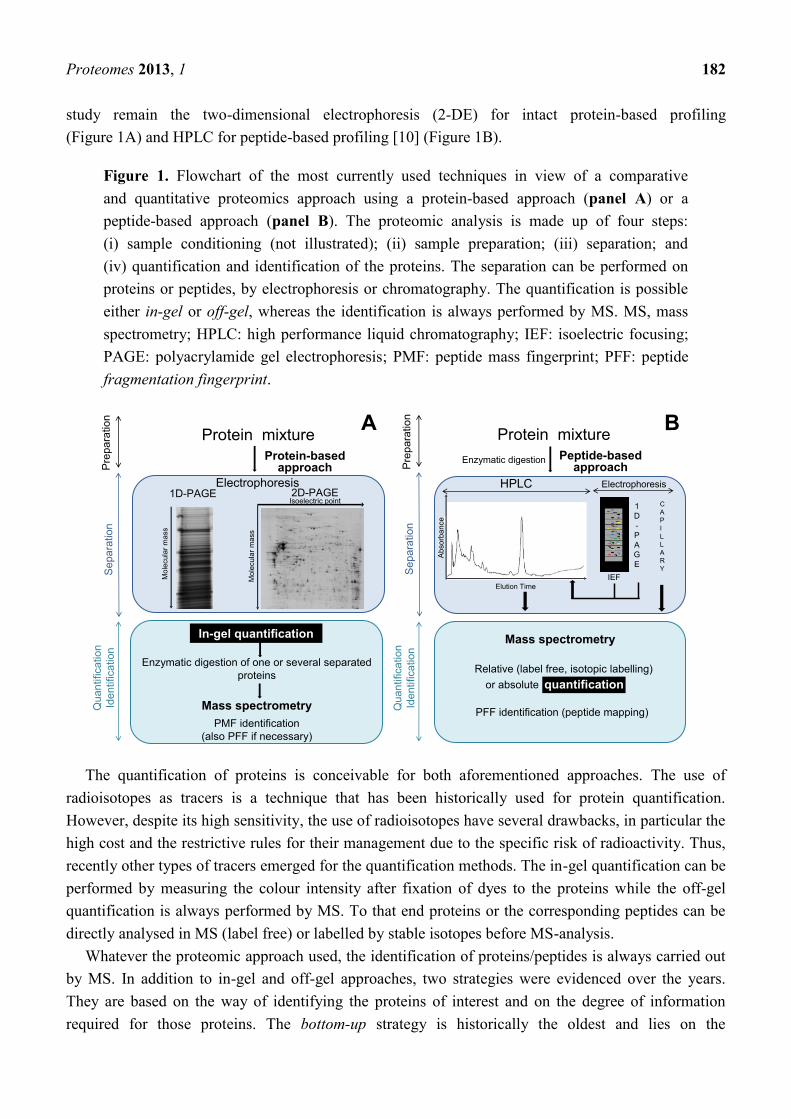
study remain the two-dimensional electrophoresis (2-DE) for intact protein-based profiling
(Figure 1A) and HPLC for peptide-based profiling [10] (Figure 1B).
Figure 1. Flowchart of the most currently used techniques in view of a comparative
and quantitative proteomics approach using a protein-based approach (panel A) or a
peptide-based approach (panel B). The proteomic analysis is made up of four steps:
(i) sample conditioning (not illustrated); (ii) sample preparation; (iii) separation; and
(iv) quantification and identification of the proteins. The separation can be performed on
proteins or peptides, by electrophoresis or chromatography. The quantification is possible
either in-gel or off-gel, whereas the identification is always performed by MS. MS, mass
spectrometry; HPLC: high performance liquid chromatography; IEF: isoelectric focusing;
PAGE: polyacrylamide gel electrophoresis; PMF: peptide mass fingerprint; PFF: peptide
fragmentation fingerprint.
The quantification of proteins is conceivable for both aforementioned approaches. The use of
radioisotopes as tracers is a technique that has been historically used for protein quantification.
However, despite its high sensitivity, the use of radioisotopes have several drawbacks, in particular the
high cost and the restrictive rules for their management due to the specific risk of radioactivity. Thus,
recently other types of tracers emerged for the quantification methods. The in-gel quantification can be
performed by measuring the colour intensity after fixation of dyes to the proteins while the off-gel
quantification is always performed by MS. To that end proteins or the corresponding peptides can be
directly analysed in MS (label free) or labelled by stable isotopes before MS-analysis.
Whatever the proteomic approach used, the identification of proteins/peptides is always carried out
by MS. In addition to in-gel and off-gel approaches, two strategies were evidenced over the years.
They are based on the way of identifying the proteins of interest and on the degree of information
required for those proteins. The bottom-up strategy is historically the oldest and lies on the
A B
Elution Time
Absorb
ance
Enzymatic digestion
ElectrophoresisHPLC
Relative (label free, isotopic labelling)
or absolute
PFF identification (peptide mapping)
Protein mixture
IEF
quantification
1
D
-
P
A
G
E
C
A
P
I
L
L
A
R
Y
Mass spectrometry
Pre
para
tion
Sepa
ration
Quan
tification
Identification
Peptide-basedapproach
Enzymatic digestion of one or several separated
proteins
Electrophoresis
Protein-basedapproach
Protein mixture
In-gel quantification
1D-PAGE
Mass spectrometry
PMF identification
(also PFF if necessary)
Isoelectric point
Mo
lecu
lar
mass
2D-PAGE
Mo
lecu
lar
mass
Pre
para
tion
Sepa
ration
Quan
tification
Identification
Proteomes 2013, 1 183
MS-analysis of peptides resulting from the enzymatic digestion of proteins. This strategy allows
mainly the identification of proteins. More recent, the top-down strategy is based on the MS analysis of
entire proteins [11]. The latter is a targeted approach allowing the identification of proteins but
especially more comfortably characterisation of isoforms, post translational modifications (PTMs) or
conducting of structural studies. Nevertheless, it needs significant amounts of biological samples as
well as the separation and isolation of intact proteins. Consequently, the strategy of choice for a global
differential study of proteins is clearly the bottom-up strategy.
This review will highlight the different techniques of separation and quantification of proteins and
peptides in view of a comparative and quantitative global proteomics analysis. Only the most currently
used techniques, precluding the radioisotopes, will be addressed. The reader can refer to a recent book
which gives a detailed survey of the quantitative methods in proteomics [12].
2. In-Gel Quantification of Proteins
2.1. Gel Electrophoresis Techniques for Proteomics
Electrophoresis, conceived at the end of the 19th century [13], has continuously evolved over time,
especially for biomolecules [14,15], and is now widely used to separate biological macromolecules
and especially proteins that differ in size, charge and conformation. Three principles of electrophoresis
have been described: (i) the zone electrophoresis, where the pH of the buffer conducting the current
(and therefore the electrical field) remains constant throughout the electrophoresis time; (ii) the IEF
that needs a pH-gradient to separate molecules and (iii) the isotachoelectrophoresis which consists,
thanks to a current gradient, of an ordering of molecules according to their electrophoretic mobility
rather than a real molecular separation.
Gel electrophoresis for proteomics uses a porous polyacrylamide supporting medium in which the
proteins migrate according to their physicochemical properties in an electrolytic medium conducting
the current and under the influence of an electric field. The protein electrophoretic mobility depends
not only on the charge-to-mass ratio, but also on the physical shape and size of proteins. The proteins
in a sample can thus be, more or less, separated from each other. Thanks to its adequate resolution and
its low cost, the sodium dodecyl sulphate polyacrylamide gel electrophoresis (SDS-PAGE) is the
technique of choice when only the identification of proteins is required. This most widely used
electrophoresis method separates the proteins according to their molecular mass (MM) [16,17]. Indeed,
due to its physicochemical properties, SDS binds non-covalently to proteins and brings them a
constant electrical charge (1.4 g of SDS per g of protein) at pH > pKa of the SDS sulfonic group [18].
Therefore, all proteins display an identical charge density, and their electrophoretic mobility only
depends on their MM. This technique is suitable for pre-purified samples or for samples with reduced
complexity but in this case it can only provide a control of the sample composition. It can also serve as
a pre-fractionation step for very complex samples.
The two-dimensional polyacrylamide gel electrophoresis (2D-PAGE) separates proteins in two
steps, namely, an in-gel IEF of proteins to separate them according to their isoelectric point (pI), and a
SDS-PAGE to separate proteins according to their MM [19,20]. This technique giving two dimensions
of separation has a better resolving power and is therefore suitable to the analysis of complex samples.

Proteomes 2013, 1 184
More than 2,000 spots can be resolved with gels of the highest resolution. The proteins are almost
isolated from each other as spots thus allowing an easier and accurate identification.
The tris-glycine discontinuous buffer system, termed ―Laemmli‘s system‖ [21], is the most widely
used. This system uses two different buffers, differing in ion composition and pH—one for the gel and
the electrode reservoirs—serving for the concentration of proteins in a stacking gel, and a second in a
separating gel (thanks to the presence of leading and trailing ions). Several versions of this
electrophoresis system have been developed and are adjustable to improve protein separation of
particular samples when the ―classic‖ electrophoresis has been proven to be insufficient [9].
Polyacrylamide gradients (low (up)-to-high (down) reticulation) can be used in PAGE in order to
enhance the gel resolving power over a wider protein MM range. Concomitantly or separately, it is
also possible to modulate the nature of the buffer ions and the pH of the buffer. Several buffer systems
coexist depending of their leading and trailing ions. In the case of the tris-glycine buffer system,
chloride plays the role of leading ion, whereas glycinate of trailing ion. However, other ions like
acetate or MES, MOPS and Tricine can be used as leading or trailing ions, respectively (Bis-Tris;
Tris-acetate or Tris-Tricine buffer systems). These different ion compositions offer different gel
patterns and stability. The separation is suitable for larger or smaller proteins. The pH-lowering of the
separation gel buffer will influence the charge of the buffer ions conducting the current, and therefore,
the speed of the mobile fraction. The resolution of proteins of high MM will increase, but at the cost of
a decreasing of the resolution of low MM proteins and vice-versa. It was shown that the yield of
proteins recovered after 2D-PAGE, ranges between 25% and 50% [22]. In fact, some proteins tend to
be insoluble, especially hydrophobic proteins, in the IEF experimental conditions and thus are
entrapped in the IEF gel. Proteins are also lost into the buffers during equilibration prior to running in
the second dimension run. Non-covalent and covalent labelling are currently used for the detection of
proteins [23]. Those stains differ by their sensitivity, their linearity, their homogeneity and their
MS-compatibility.
2.2. Post-Electrophoresis Staining of Proteins for their In-Gel Quantification
The protein spots can be detected after electrophoresis by direct in-gel staining (for review
see [24,25]). Two of the most commonly used general protein stains are Coomassie brilliant blue and
silver nitrate. Other techniques based on fluorescence are also available. In acidic solution, Coomassie
brilliant blue (textile dye G250 and R250 mainly) binds to the basic and aromatic amino acids of
proteins through electrostatic and hydrophobic interactions [26]. The Coomassie brilliant blue staining
has a moderate sensitivity, at the ng level, with a good linearity and accuracy. The dye is not
covalently bound and a conventional de-staining based on the use of organic solvents allows
recovering intact proteins and compatible with their MS-analyses. The silver staining, at the pg level,
is much more sensitive than Coomassie brilliant blue [27,28] but displays less good linearity and
accuracy and is poorly adapted for MS analyses, since proteins can be covalently cross-linked when
formaldehyde is used as reductant. This staining involves binding to the proteins of silver salts which
precipitate after reduction as metallic silver [29]. A compromise should be found between the time of
reaction of silver nitrate with proteins (on the gel surface) and the colouring intensity that will allow
the analysis by MS from the protein amount remained intact in the central part of the gel. In addition,
Proteomes 2013, 1 185
the amount of formaldehyde for the reduction of silver salts should be decreased to a minimum in the
staining solutions and glutaraldehyde should be definitively avoided because of the irreversible protein
nitrogen (and also other atoms) reticulation caused by these reagents. Silver nitrate staining is also
sensitive to a number of external factors such as the temperature and the development time making the
Coomassie brilliant blue staining the preferred staining for proteomics. It is also possible to stain the
proteins by using organic fluorescent dyes (such as Deep PurpleTM
, a fluorescent dye based upon the
natural compound epicocconone, originally isolated from the fungus Epicoccum nigrum [30],
FlamingoTM
(Bio-Rad) and KryptonTM
(Pierce) and metal complex or metal chelates dyes (such as
SYPRO Red and Orange [31], the well-known being SYPRO Ruby [32], RuBPS [33], ASCQ_Ru [34])
and IrBPS [35]). This fluorescent staining is sensitive (ng to pg level), non-covalent (or reversible
for epicocconone) and, consequently, compatible to MS. Furthermore the quantification of PTMs
(phosphorylation and glycosylation) is possible thanks to fluorescent labelling of the proteins at their
phosphorylation (ProQdiamond) or glycosylation (ProQemerald) sites (Multiplexed Proteomics) [36,37].
Very recently it was shown that more sensitive, quantitative in-gel protein staining can be
achieved [38] using an optimised protocol of the Neuhoff‘s formulation of colloidal Coomassie
brilliant blue [39]. In another method for the UV detection of proteins, trihalo compounds are included
in the gel composition and react with tryptophan residues to produce fluorescence [40]. Whatever the
staining method used, digitalised images of the gels, obtained by laser-based detectors, CCD camera
systems and flatbed scanners, should be analysed with dedicated software [24]. The choice of imaging
system largely depends on the type of protein dyes used. One of the constraints of the in-gel
approaches is the variability found between gels. The low reproducibility is due to the more or less
different electrophoretic migrations known as gel-dependent. Therefore, a differential in-gel approach
needs an increased number of images to ensure an accurate and statistically reliable comparison.
2.3. Pre-Electrophoresis Staining of Proteins for their In-Gel Quantification
The Difference gel electrophoresis (DIGE) is a modification of 2D-PAGE that needs only a single
gel to detect differences between two protein samples. This is done by fluorescent tagging of protein
samples by different cyanine-based dyes before the electrophoresis step. The amine reactive dyes used
should not modify the relative mobility of proteins common to the samples under investigation [41]. In
the «minimal» labelling method, the fluorescent labelling reagent (N-hydroxysuccinimidyl ester
cyanine dyes 2, 3 or 5; Cy2, Cy3 or Cy5) will react with free amino groups (amino-terminus and
-amino groups of lysine residues). Labelling reaction is optimized so that only 2%–5% of the total
lysine residues are labelled. In fine, using a relatively high protein/fluorophore ratio, a single lysine
residue per protein molecule will be labelled (and most of the proteins remain unlabelled). In the
«saturation» labelling method, the fluorescent labelling reagent (thiol-reactive maleimide derivatives
of Cy3 and Cy5) reacts with free thiol groups of cysteine residues (obviously the thiol-free proteins
will not be labelled). All the cysteine residues are thus labelled and saturation labelling is therefore
much more sensitive than the minimal one, as more dyes are covalently bound to proteins. The
«saturation» labelling is particularly adapted to low abundance proteins (see [42] for details).

Proteomes 2013, 1 186
Table 1. Different methods used for the staining or labelling of proteins in view of in-gel quantification (Protein-based quantification) a.
Advantages Drawbacks Robustness for
large scale analysis
Pre-electrophoresis
staining (Proteins
labelled before
electrophoresis)
Chromophore-
based staining none
Fluorophore-
based staining DIGE (cyanine)
Great linearity, sensitivity and
reproducibility; MS-compatible Expensive Yes
PTM-specific
staining none
Post-electrophoresis
staining (Proteins
revealed after
electrophoresis)
Chromophore-
based staining
Silver staining, Zinc,
Copper (metal-based) Great sensitivity
Low reproducibility,
linearity, and accuracy;
Low MS compatibility,
influenced by
external factors
No
CBB, ‗blue-silver‘ (organic
dyes)
Reproducibility, good linearity,
good accuracy, MS-compatible Moderate sensitivity Yes
Fluorophore-
based staining
Sypro®, RuBPs, ASCQ_Ru,
IrBPS (metal chelates) Very good reproducibility, good
linearity, great sensitivity,
non-covalent labelling
Expensive Yes Deep Purple
TM, Flamingo
TM,
KryptonTM
(Organic dyes)
PTM-specific
staining ProQdiamond, ProQemerald
Very good linearity,
good sensitivity Expensive Yes
a DIGE, Difference gel electrophoresis; PTM, post translational modifications; CBB, Coomassie brilliant blue; RuBPs, Ruthenium (II) tris (4,7-diphenyl-1,10-phenatrolin
disulfonate); ASCQ_Ru, ruthenium complex ((bis(2,2'-bipyridine)-4'-methyl-4-carboxybipyridine-ruthenium-N-succidimyl ester-bis(hexafluorophosphate); IrBPS,
biscyclometalated iridium(III) complexes with an ancillary bathophenanthroline disulfonate ligand.

Proteomes 2013, 1 187
Samples from two (or three) different cellular states (physiological or pathological) are labelled
with one of the fluorescent labelling reagents then combined prior to their electrophoretic separation in
a single gel. Thus, the problem of variability between gels is suppressed and the number of processed
gels decreased. In addition, the precision of the method can be improved by the use of a third
fluorescent labelling reagent, often Cy2, used for the labelling of an internal standard composed of
equimolar amounts of two samples to be compared. After the electrophoretic separation, the
fluorescence intensities, originating from the three different samples, are quantified by digitalisation
using fluorescence scanner. The obtained digital images are stored as tagged image file format (TIFF)
or equivalent and compared using dedicated software. The DIGE technique displays a very good
detection sensitivity (ng to pg level), a high linear dynamic range and is perfectly compatible with MS
but is the most expensive [43]. The different methods used for the staining or labelling of proteins or
peptides in view of in-gel quantification were summarised in Table 1.
2.4. Advantages and Limits of the In-Gel Quantification of Proteins
The 2D-PAGE and 2D-DIGE analyses offer several advantages. They allow obtaining a final
analytical image which is quantitative, reproducible and ―frozen‖ and representative of the protein
heterogeneity in the sample of interest. In addition, the protein diversity resulted from PTMs is
conserved and can be studied by various techniques including MS.
The 2-DE has also some limits due to the particular physicochemical properties of a number of
proteins, such as proteins of extreme MM (>200 kDa and <10 kDa), highly hydrophobic proteins, low
abundance proteins (dynamic range of detection 103 to 10
4) or proteins of extreme pI (<3 or >11) [5,44]. In
addition, despite the numerous technical optimisations during the electrophoresis steps, all the proteins
of a given sample will not be revealed, thus leading to loss of information. Only the proteins revealed
by staining are cut out and further analysed. Because the gel resolution is not always sufficient, the
quantification of proteins is sometimes ambiguous, since one spot can contain more than one protein.
Also, spot trains of proteins of equal molecular weight but different isoelectric points are commonly
observed on the gels and mostly correspond to PTMs of proteins, such as phosphorylation and
glycosylation. The immanent problem of 2D-PAGE, namely low resolution, multiple proteins for one
spot and/or multiple spots for one protein (PTMs) is illustrated in Figure 2 showing a result obtained
during the comparison of the proteins extracted with Triton X-100 from bovine brain capillary
endothelial cells with limited (Lim. BBB) or re-induced (Re-ind. BBB) BBB functionalities.
A representative sample among the proteins identified during this study [45] is displayed in Table 2.
Internet-based prediction tools can be used for comparing the theoretical models to the actual gel
pattern [46]. Finally, the analysis by electrophoresis is limited to the study of the more abundant
proteins, which constitutes sometimes an advantage [47], and unsuitable to a high throughput
screening. Nevertheless, 2-DE is not abandoned and the still existing importance of the two
dimensional electrophoresis in the biology field was recently illustrated [48].

Proteomes 2013, 1 188
Figure 2. Comparison of the proteins extracted with Triton X-100 from bovine brain
capillary endothelial cells showing limited (Lim. BBB) (A) or re-induced (Re-ind. BBB)
BBB functionalities (B). Digital image obtained after 2D-PAGE of the proteins separated
according to their pI and MW. The gel was silver nitrate stained. The numbering
corresponds to the enriched protein in each condition. Each spot was identified by peptide
mass fingerprinting (PMF) and/or peptide fragmentation fingerprinting (PFF) on a
Proteineer ™ workstation (adapted with permission from [45]).
3. Off-Gel Quantification of Proteins (Peptide-Based Quantification)
In addition to the aforementioned approaches for the quantification of intact proteins after gel
electrophoresis, the peptide-based quantification of proteins by MS (shotgun approach) is continuously
evolving. The proteins in a sample are directly submitted to enzymatic digestion and the mixture of the
resulted peptides, whose molecular mass ranges from 500–4,000 Da, are separated and subsequently
analysed by MS. However, this approach is considerably limited for biological samples of high
degrees of complexity, because of the increase in the complexity/heterogeneity of the sample due to the
multiplication of molecular species generated by the enzymatic digestion. Pre-fractionation of the
proteins prior to the proteolysis step or analysis of sub-proteomes can be proven in this case
advantageous [49,50]. In this way, the sensitivity and the ratio of identifications are improved.
A BLim. BBB Re-ind. BBB

Proteomes 2013, 1 189
Table 2. A representative sample among the proteins identified during 2D-PAGE. The proteins were extracted with Triton X-100 from bovine
brain capillary endothelial cells with limited (Lim. BBB) or re-induced (Re-ind. BBB) BBB functionalities. The Table illustrates the presence
of one spot for one protein, multiple proteins for one spot and/or multiple spots for one protein. The identifications were done by PMF and
PFF after MALDI-TOF/TOF mass spectrometry. Proteins over-abundant in Lim. BBB are highlighted in grey. The data were reproduced with
permission from [45].
Spot
number Protein Name
Swiss-Prot
Accession
Theoretical Experimental PMF
Mascot
Score c
Sequence
Coverage
(%)
Matched/
Unmatched
peptides
Identification
by MS or
MS/MS
Number of
fragmented
peptides
MW
(kDa) a pI b
MW
(kDa) a pI b
One
spot for
one
protein
45 Serine-threonine kinase receptor-associated protein STRAP_BOVIN 38.4 4.99 40.5 4.90 242 67 21/25 MS
47 Inorganic pyrophosphatase IPYR_BOVIN 32.8 5.27 39.7 5.09 168 42 12/14 MS
58 Phosphatidylinositol transfer protein alpha isoform PIPNA_BOVIN 31.8 6.12 34.8 5.54 73 28 8/15 MS
72 6-phosphogluconolactonase 6PGL_BOVIN 27.6 5.57 29.9 5.44 129 40 10/19 MS &
MS/MS 1
78 Apolipoprotein A-I precursor (Apo-AI) APOA1_BOVIN 30.2 5.71 26.2 5.52 366 68 25/16 MS
79 Sorcin SORCN_HUMAN 21.7 5.32 24.1 4.98 153 48 15/28 MS
One
spot for
several
proteins
36
Actin, cytoplasmic 1 (Beta-actin) ACTB_BOVIN 41.7 5.29 44.2 5.52 94 44 13/50 MS &
MS/MS 1
Succinyl-CoA ligase [GDP-forming] beta-chain,
mitochondrial [Precursor] SUCB2_BOVIN 46.7 7.51 44.2 5.52 112 28 14/49 MS/MS 1
37
Actin, cytoplasmic 1 (Beta-actin) ACTB_BOVIN 41.7 5.29 44.2 5.66 80 44 14/91 MS
Leukocyte elastase inhibitor ILEU_BOVIN 42.2 5.70 44.2 5.66 134 49 22/83 MS
Succinyl-CoA ligase [ADP-forming] beta-chain,
mitochondrial [Precursor] SUCB1_BOVIN 50.0 6.73 44.2 5.66 100 44 20/85 MS
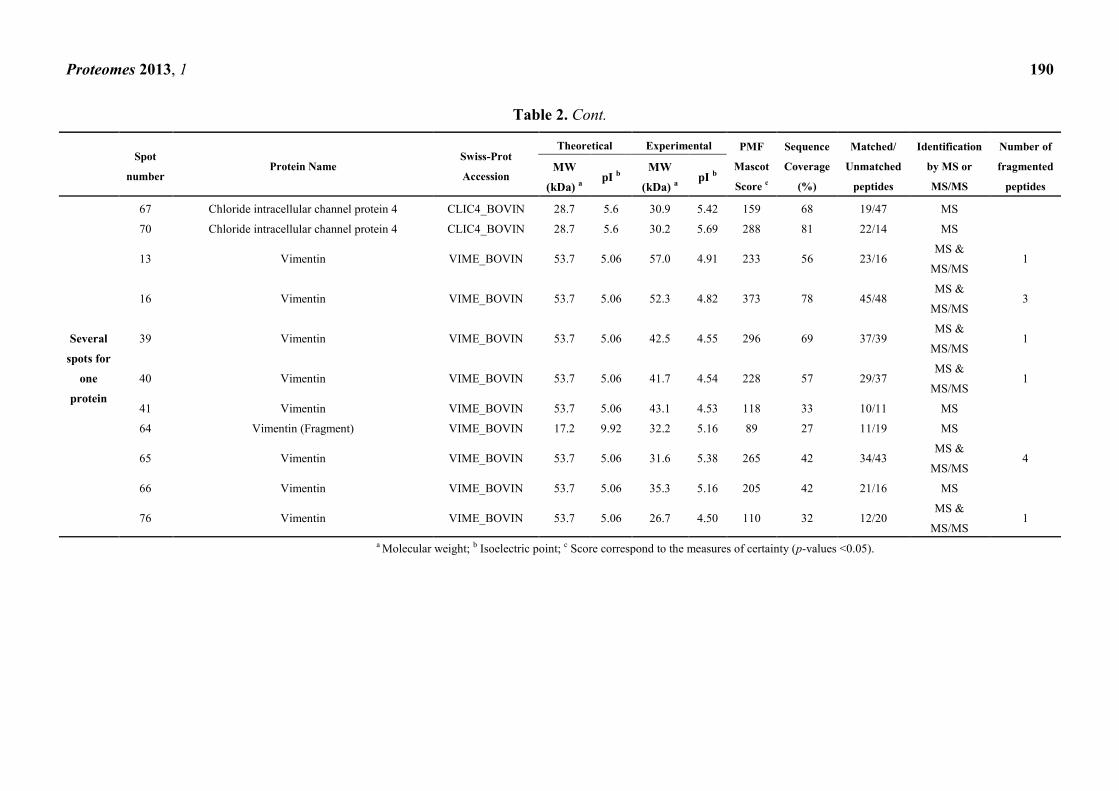
Proteomes 2013, 1 190
Table 2. Cont.
Spot
number Protein Name
Swiss-Prot
Accession
Theoretical Experimental PMF
Mascot
Score c
Sequence
Coverage
(%)
Matched/
Unmatched
peptides
Identification
by MS or
MS/MS
Number of
fragmented
peptides
MW
(kDa) a pI b
MW
(kDa) a pI b
Several
spots for
one
protein
67 Chloride intracellular channel protein 4 CLIC4_BOVIN 28.7 5.6 30.9 5.42 159 68 19/47 MS
70 Chloride intracellular channel protein 4 CLIC4_BOVIN 28.7 5.6 30.2 5.69 288 81 22/14 MS
13 Vimentin VIME_BOVIN 53.7 5.06 57.0 4.91 233 56 23/16 MS &
MS/MS 1
16 Vimentin VIME_BOVIN 53.7 5.06 52.3 4.82 373 78 45/48 MS &
MS/MS 3
39 Vimentin VIME_BOVIN 53.7 5.06 42.5 4.55 296 69 37/39 MS &
MS/MS 1
40 Vimentin VIME_BOVIN 53.7 5.06 41.7 4.54 228 57 29/37 MS &
MS/MS 1
41 Vimentin VIME_BOVIN 53.7 5.06 43.1 4.53 118 33 10/11 MS
64 Vimentin (Fragment) VIME_BOVIN 17.2 9.92 32.2 5.16 89 27 11/19 MS
65 Vimentin VIME_BOVIN 53.7 5.06 31.6 5.38 265 42 34/43 MS &
MS/MS 4
66 Vimentin VIME_BOVIN 53.7 5.06 35.3 5.16 205 42 21/16 MS
76 Vimentin VIME_BOVIN 53.7 5.06 26.7 4.50 110 32 12/20 MS &
MS/MS 1
a Molecular weight; b Isoelectric point; c Score correspond to the measures of certainty (p-values <0.05).

Proteomes 2013, 1 191
3.1. Reducing the Complexity of the Sample by Pre-Fractionation of Proteins
In order to reduce the complexity of the samples, the proteins can be separated by electrophoresis,
chromatography, proteome fractionation based on differential solubility, and by aqueous two-phase
system (ATPS). Electrophoresis can be performed by 1D-PAGE (see Section 2.1), or using a free-flow
protein purification (off-gel) technique based on IEF [51]. The proteins of interest, in gel strips
(1D-PAGE) or in solution (off-gel) are then further analysed. A pre-fractionation by protein thermal
denaturation can increase the resolving power of 2D-PAGE [52]. The complexity of a proteome
can be decreased by differential solubilisation (for review [53]) with increasing concentrations of
acetonitrile [49,50], and by methods based on ATPS extractions [54]. Liquid chromatography methods,
such as size-exclusion [55], ion-exchange [56], affinity [57], and reverse-phase chromatography [58]
can also be used to fractionate the proteins (for review [59]). They are essentially useful for low
complexity samples and are detergent sensitive. Thus, they should be mainly used as a means of
enrichment of certain proteins of interest that display specific biochemical properties.
3.2. Separation of Peptides
The use of electrophoresis for the separation of peptides according to their charge is mainly carried
out by liquid phase migration in off-Gel IEF [60] and capillary electrophoresis (CE). IEF of peptides
released from a mixture of proteins is generally performed in view of pre-fractionating the sample (like
LC for proteins) to reduce its heterogeneity. The use of CE, which was used occasionally a few years
ago for the separation of peptides and even proteins (top-down analysis) before their analysis by MS,
is expanding and the CE-MS coupling is now functional and efficient with several types of mass
spectrometers [61,62]. However, this coupling is recent and in spite of the higher sensitivity and higher
resolution power of CE, it is still less used than HPLC, which is nevertheless a powerful tool in
analytical chemistry, the reverse-phase (RP)-HPLC being the most used in proteomics. This trend is
expected to reverse in the coming years.
In RP-HPLC, the peptides are separated according to their partition coefficient between a
hydrophobic stationary phase, often C18 bonded silica, and an aqueous mobile phase whose polarity
decreases by the application of a gradient of raising concentration of an organic water-miscible
solvent, such as acetonitrile. Other separation modes of various selectivities can be used, such as ion
exchange chromatography, exclusion chromatography, and chromatography based on hydrophilic or
hydrophobic properties [63].
Several factors influence the chromatographic separation of peptides, namely the characteristics of
the column itself (length, granulometry, chemical nature and type—monolithic or not—of the
stationary phase and internal diameter), the elution gradient (solvent‘s concentration, flow and time)
and the temperature. The peptides eluted during a chromatographic run can be either directly, on-line,
analysed by MS using an electrospray source or indirectly, off-line, in the case of a MALDI source.
HPLC is considered as a pre-fractionation step of peptides prior to MS and, ―coupling‖ to MS, has
proven to be an extremely efficient tool for the nearly-complete identification of proteins of a complex
mixture. In a way, HPLC overcomes the limits of in-gel techniques but no visual illustrates the
heterogeneity of the proteins of a given sample and no information on pI or MM is assessed by this

Proteomes 2013, 1 192
way, thus making interpretation more difficult. In fact, 2D-PAGE electrophoresis affords the only
visual illustration of the heterogeneity of proteins of a given sample (Figure 2). Nevertheless, data
processing allows generating 2-D representations (retention time vs. m/z ratio) of the peptide
separations to illustrate the distribution of all the injected and detected peptides (Figure 3).
Figure 3. 2D-like view illustrating the distribution of the peptides according to their
retention time vs. their m/z ratio. (A) print-screen image obtained from Warp-LC Survey
Viewer (Bruker Daltonics) after RP-HPLC-MALDI-TOF-MS analysis of tryptic peptides
issued from the enzymatic digestion of a sample of proteins extracted from brain capillary
endothelial cells; (B) detail of a particular region; (C) selection of an ion; (D) fragmentation
and identification of the peptide (unpublished data from the authors‘ laboratory).
3.3. Peptide-Based Quantification of Proteins
For more complex samples, by analogy with 2D-PAGE, two (or more) chromatographic systems
based on different selectivity can be coupled together before the MS analysis of separated peptides
(2D-LC). This chromatography coupling offers two dimensions of separation and allows a high
number of identifications, since the resolution power (corresponding to the number of compounds that
have been separated) reflects the scaling of the resolution powers of the two chromatographic
systems [64]. Usually, the last separation step, before MS is a RP-HPLC. However, during the first
separation step, the vast majority of chromatographic methods can be used [65,66].
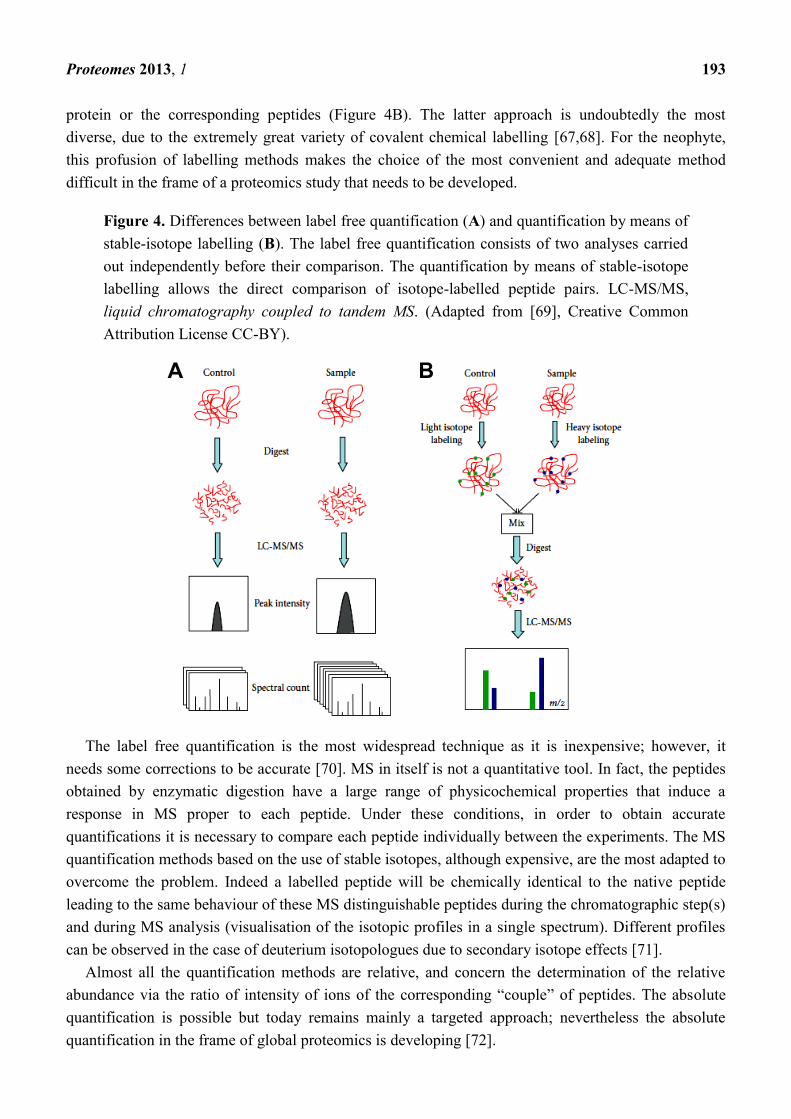
Quantification of proteins can be achieved by MS. Two approaches are currently used, namely, the
label free quantification (Figure 4A) and quantification based on the preliminary labelling of the
Sp
ectr
um
2000 2500m/z
Rete
ntion
tim
e
Mass to charge ratio (m/z)
A
B
D C
Fragmentation
2000m/z
2500
BTF3_HUMAN
(Transcription factor BTF3 )
Protein identification
(Swiss-Prot Accession)
22 (Start 142,
Stop 163)
Lenght
(amino acids)
2400.36201.24QLTEMLPSILNQ
LGADSLTSLR
Precursor
(m/z)
Mascot
Score
Sequence
BTF3_HUMAN
(Transcription factor BTF3 )
Protein identification
(Swiss-Prot Accession)
22 (Start 142,
Stop 163)
Lenght
(amino acids)
2400.36201.24QLTEMLPSILNQ
LGADSLTSLR
Precursor
(m/z)
Mascot
Score
Sequence
Proteomes 2013, 1 193
protein or the corresponding peptides (Figure 4B). The latter approach is undoubtedly the most
diverse, due to the extremely great variety of covalent chemical labelling [67,68]. For the neophyte,
this profusion of labelling methods makes the choice of the most convenient and adequate method
difficult in the frame of a proteomics study that needs to be developed.
Figure 4. Differences between label free quantification (A) and quantification by means of
stable-isotope labelling (B). The label free quantification consists of two analyses carried
out independently before their comparison. The quantification by means of stable-isotope
labelling allows the direct comparison of isotope-labelled peptide pairs. LC-MS/MS,
liquid chromatography coupled to tandem MS. (Adapted from [69], Creative Common
Attribution License CC-BY).
The label free quantification is the most widespread technique as it is inexpensive; however, it
needs some corrections to be accurate [70]. MS in itself is not a quantitative tool. In fact, the peptides
obtained by enzymatic digestion have a large range of physicochemical properties that induce a
response in MS proper to each peptide. Under these conditions, in order to obtain accurate
quantifications it is necessary to compare each peptide individually between the experiments. The MS
quantification methods based on the use of stable isotopes, although expensive, are the most adapted to
overcome the problem. Indeed a labelled peptide will be chemically identical to the native peptide
leading to the same behaviour of these MS distinguishable peptides during the chromatographic step(s)
and during MS analysis (visualisation of the isotopic profiles in a single spectrum). Different profiles
can be observed in the case of deuterium isotopologues due to secondary isotope effects [71].
Almost all the quantification methods are relative, and concern the determination of the relative
abundance via the ratio of intensity of ions of the corresponding ―couple‖ of peptides. The absolute
quantification is possible but today remains mainly a targeted approach; nevertheless the absolute
quantification in the frame of global proteomics is developing [72].
A B

Proteomes 2013, 1 194
3.3.1. Relative Quantification
3.3.1.1. Label Free Quantification
A quantitative differential proteomics approach has three important aspects, namely, rapidity,
efficiency and reproducibility of analyses. The label free quantification is largely employed for its
rapidity, its low cost and its simplicity of use. Two methods for the label free quantification are
reported and widely reviewed [73,74]. In the first, based on the comparison of mass spectra, the
change in the signal intensity of a peptide (area or peak intensity) is correlated to the protein
quantity [75]. In the second, based on spectral counting, the number of peptides sequenced for a given
protein is correlated to its quantity [76]. The label free quantification implies that the samples to be
compared are prepared separately and individually analysed by MS/MS. The changes in terms of
protein abundance are calculated after the comparison to other analyses.
The MS-signal intensity of a peptide detected in MS can be correlated to its quantity following its
ionisation in electrospray ionisation mode [77]. The ion chromatograms for every peptide are extracted
from a LC-MS/MS run and their peak areas integrated over the time scale. Extracted ion
chromatograms (XIC) for mass to charge ratios are determined for each peptide. In this way, the
MS-signal intensity of peptides in an experiment can be compared to the corresponding peptides in one
or several other experiments thus giving information on their relative quantification [75]. The main
drawback of this approach is the experimental variations of MS-signal intensities of peptides. An
excellent reproducibility and a normalisation using internal standards and/or a normalisation
coefficient are in this case mandatory to more accurately identify common peptides between different
experiments. Dedicated software for the alignment of LC-runs take advantage of the retention times
and the m/z of the signals to identify similar peptides [78]. The various types of software offer
automation of the data analyses, which are manually unrealisable, considering the huge amount of data
generated by such an approach. The intensity of peaks is computed and compared between the
different chromatographic separations. Although minimised with high resolution mass spectrometers,
sometimes very close mass signal interferences can occur, leading to quantification errors. Therefore,
technical replicates are mandatory in order to proceed to a correct interpretation of data. A compromise
should be found between the solidity of the quantification and the number of identified proteins. A first
phase is dedicated to identifying a maximum number of proteins through fragmentation (MS/MS
mode) and a second is focused on the improvement of MS-settings in order to optimise the MS-signals
(resolved peaks) of peptides for their accurate quantification.
After enzymatic digestion a high abundance protein will generate a large number of peptides. In the
spectral counting label-free quantification method [76], the relative quantification of proteins is based
on the comparison of the number of MS/MS spectra performed for a given protein between several
experiments. The abundance of a protein is correlated to the number of MS/MS spectra leading to its
identification. In this approach, the tandem MS mode gives the identification together with the
quantification of a protein. This method is controversial since it does not take into account the physical
properties of the peptides and assumes that the mass response is linear and identical for each protein,
and yet the response in terms of spectral counting will be different for each peptide because the
retention time and the chromatographic peaks‘ width are different. Therefore, MS-signal normalisation

Proteomes 2013, 1 195
as it pertains to the protein size and the statistical analysis of the obtained data is unavoidable in order
to obtain accurate quantification.
The relative abundance of a protein can also be reported as the protein abundance index (PAI) [79]
corresponding to the number of observed peptides (within the dynamic range of the mass spectrometer
used) divided by the number of the observable peptides per protein. The exponential modified protein
abundance index (emPAI), derived from PAI (it equals 10PAI
-1), is proportional to protein content in a
protein mixture [80]. The absolute protein expression (APEX) quantitative proteomics tool improves
on basic spectral counting methods by including a correction factor (peptide detection probabilities
depending on their physical properties and according to the mass spectrometer used) for each protein
that accounts for variable peptide detection by MS techniques [81,82].
3.3.1.2. Quantification Using Stable Isotope Labelling
The techniques of stable isotope labelling were introduced in 1999 [83–85]. The differentiation
strategy is based on distinctive labelling of proteins or peptides, in each particular condition. Two
peptides tagged with different stable isotopes (―couple of peptides‖ or isotopologues) that have the
same physical properties will undergo the same ionisation and will be detected in the same spectrum
with a mass shift depending on the isotope used. Quantification can be performed either by MS or
tandem MS (MS/MS) depending on the objectives. It lies on the search and the quantitative
comparison (area under curve or peak intensity), within the same chromatographic fraction, of signals
corresponding to the isotopic pair of labelled and unlabelled peptides. A ratio is calculated to establish
the relative quantity of each peptide. A ratio of 1 corresponds to an equal amount of each peptide while
a ratio imbalance corresponds to the overabundance of one of the peptides. Included in the same mass
spectrum, the signals need no retention time correction, unlike in the label free techniques.
The tag mass shifts, easily detected by MS, are integrated in the sophisticated algorithms of search
engines and can be divided into three types: (i) labelling in vitro/(or in vivo) during cell culture (or
growth) by the addition of the constitutive atoms or labelled amino acids in the growth medium (or
foods); (ii) labelling of the proteins after their extraction from the cells; and (iii) labelling of the
peptides over or after the enzymatic digestion of the proteins before their analysis. The tag can be
introduced metabolically (for the 1st case), chemically (2nd and 3rd case) or enzymatically (3rd case).
Several stable isotopes can be used: carbon-13 (13
C), hydrogen-2 (2H or D, deuterium), oxygen-18
(18
O) or nitrogen-15 (15
N). The terms of light (12
C, 1H,
16O,
14N) and heavy (
13C,
2H,
18O,
15N) isotopes
are used.
3.3.1.2.1. Metabolic Labelling
The metabolic labelling is carried out during protein synthesis. Although now developed for in vivo
animal experimentation, this method has been historically utilized for in vitro quantitative proteomics.
The cells should be cultivated in a normal, non-isotopic medium or in a medium exclusively enriched
with the heavy isotope. After adequate cellular multiplication, the cell division, cell growth and all the
cellular processes lead to the total incorporation of the isotope in the proteins of the cultivated cells.
The cells of both conditions are combined and further treated as a single sample. The labelling is
performed early in the protocol, thus reducing the experimental bias introduced when the incorporation

Proteomes 2013, 1 196
of the tag is performed late in the experimental process. Total incorporation of the label is a decisive
point for the quantification and should be accurately checked by MS. It is considered as total when no
unlabelled peptide is observed for the ―heavy medium‖ condition. Therein, several cell divisions are
necessary depending on the nature of the cells used. The relative amount of proteins is determined by
the ratio of MS-signal intensities of peptide pairs. The identification is performed by MS fragmentation of
the peptides. This technique is ideally used for cell lines; especially the immortalised cell lines
admitting several passages, however, it is lengthy and expensive. Two types of metabolic labelling are
available, namely, labelling with 15
N or 13
C and labelling by amino acid isotopes in the culture
medium. However, classical methods for PTMs remain in use.
The cells can be grown in isotopically enriched media, for example in 15
N-labelled growth media,
or in the unlabelled (14
N) counterpart [84]. After several cycles of incorporation, the cells contain
proteins with labelled amino acids thanks to the de novo synthesis. Alternative stable isotopes, such as 13
C and 18
O, could be used in the present context. The negative aspect of this technique is that the mass
difference between the labelled and the corresponding unlabelled peptides will depend on the amino
acid sequence (number of N, C or O) thus complicating the data analysis. Moreover, this strategy is
clearly inadequate for organisms that do not directly incorporate N, C or O.
Introduced in 2002, the stable isotope labelling by amino acids in cell culture (SILAC) technique
overcomes this last point by the substitution of one or two amino acids of the growth medium by their
isotope-labelled counterparts [86]. Essential amino acids, or those present in high concentration in the
medium, should be used in preference, to avoid their de novo synthesis by the cells and should be
detected in as many peptides as possible Moreover, the selected amino acids should not be
metabolised in the cells to other amino acids, because this could encounter additional labelling making
the data analysis difficult. For example arginine is converted to proline in some cell lines. This pitfall
can be avoided by adding excess proline [87]. Leucine and lysine, and also tyrosine and arginine
are the most used amino acids for SILAC [88]. A double labelling, for example Arg/Lys
(12
C6/13
C6-arginine/12
C6/13
C6-lysine) is also conceivable to ensure an almost ideal labelling of all the
peptides (except the C-terminus tryptic peptide of the protein) when trypsin is used for the digestion.
In that way, uncleaved peptides will be double labelled. Up to five different cellular states were
compared using such a multiplex SILAC-based strategy [89].
In the culture-derived isotope tags (CDITs) technique which is derived from SILAC [90], a labelled
internal standard is generated for quantifying the proteome of a given tissue. This standard corresponds
to cells originated from the tissue under consideration, grown in a stable isotope-enriched medium
according to the SILAC technique. For example, cells of mouse neuroblastoma are mixed with each
mouse brain sample. For each brain sample, the ratio between the isotopic distribution of peptides of
same sequence (from the tissue to analyse and from the cultured cells) is determined (one ratio per
sample). The change in the protein abundance between the two brain samples is then determined by
the ratio of the two ratios previously calculated. Interestingly, a protein found in a brain sample but not
in the cultured cells can also be quantified. The ratio of the target peptide, which does not have a
corresponding labelled peptide in the standard cells, can be obtained by using the peak ratio against an
isotope-labelled peptide of different sequence found in the standard cells and having the same retention
time in LC/MS.
Proteomes 2013, 1 197
The super-SILAC technique, recently introduced [91,92] consists of adding a mixture of lysates of
several cell lines labelled by SILAC as internal standard to proteomic samples to be analysed. This
improvement is used for the characterisation and the comparison of cell lines, especially tumour cells.
The SILAC technology was also implemented for in vivo animal experiments [93,94] and is known
as stable isotope labelling of mammal (SILAM). The animals are metabolically labelled with stable
isotopes; their diet is exclusively composed of stable isotope-enriched proteins. Compared to in vitro
labelling methods, metabolic labelling ensures that each protein is enriched with the heavy isotope,
thus ―all‖ the cells of those animals consist of labelled proteins. The animals receiving this labelling
were shown to be healthy and phenotypically identical to the unlabelled ones [93], but their production
is lengthy, as it requires several generations and is expensive.
Using these strategies of metabolic labelling, it is possible to identify and quantify PTMs like
methylation (method named heavy methyl SILAC) [95]. In this case, the cells are grown in media
containing [13
CD3]-methionine allowing, after cell divisions, the labelling of all the in vivo
methylation sites.
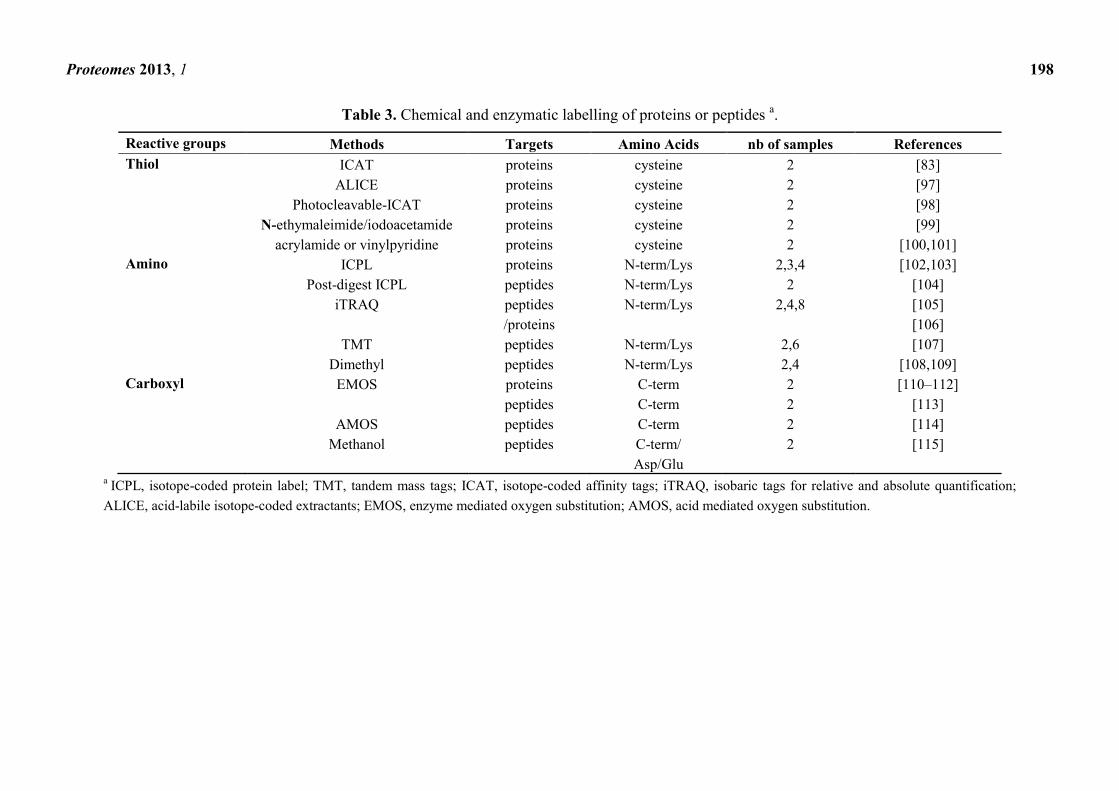
3.3.1.2.2. Chemical and Enzymatic Labelling
Chemical or enzymatic labelling is applied later in the proteomic experimental process than the
metabolic labelling. This type of labelling is therefore not limited to cell cultures and is applicable to
all types of biological samples. It can concern a reactive group of a specific amino acid in the proteins
or peptides (often the thiol group of cysteine or the -amino group of lysine residues) or the α-amino-
or α-carboxyl terminal groups of peptides (Table 3). However, variations of labelling ratios could be
due to protein isoforms. For example, histones bear PTMs (methylation, acetylation, botinylation,
ubiquitinylation, etc.) on lysine residues and on the N-terminus that can hinder the labelling [96].
In this case the MS-signal ratio cannot indicate a difference of protein concentration, only the presence
of PTMs. Furthermore, chemical labelling can cause secondary reactions giving unexpected products
and, thus, influences the quantification results.
Proteomes 2013, 1 198
Table 3. Chemical and enzymatic labelling of proteins or peptides a.
Reactive groups Methods Targets Amino Acids nb of samples References
Thiol ICAT proteins cysteine 2 [83]
ALICE proteins cysteine 2 [97]
Photocleavable-ICAT proteins cysteine 2 [98]
N-ethymaleimide/iodoacetamide proteins cysteine 2 [99]
acrylamide or vinylpyridine proteins cysteine 2 [100,101]
Amino ICPL proteins N-term/Lys 2,3,4 [102,103]
Post-digest ICPL peptides N-term/Lys 2 [104]
iTRAQ peptides N-term/Lys 2,4,8 [105]
/proteins [106]
TMT peptides N-term/Lys 2,6 [107]
Dimethyl peptides N-term/Lys 2,4 [108,109]
Carboxyl EMOS proteins C-term 2 [110–112]
peptides C-term 2 [113]
AMOS peptides C-term 2 [114]
Methanol peptides C-term/ 2 [115]
Asp/Glu a
ICPL, isotope-coded protein label; TMT, tandem mass tags; ICAT, isotope-coded affinity tags; iTRAQ, isobaric tags for relative and absolute quantification;
ALICE, acid-labile isotope-coded extractants; EMOS, enzyme mediated oxygen substitution; AMOS, acid mediated oxygen substitution.

Proteomes 2013, 1 199
3.3.1.2.2.1. Labelling of Thiol Groups
Developed in 1999 [83], the isotope-coded affinity tags (ICAT) labelling is obtained by alkylation
of cysteine thiol groups with either a light or a heavy tag using iodo-acetamide groups conjugated to
biotine by a spacer arm. The difference in mass is introduced on the spacer arm, which can contain
proton or deuterium (H or D) (ΔDa = 8 Da) or alternatively 12
C or 13
C. This labelling is performed on
entire proteins but can also be done on peptides. After enzymatic digestion, the cysteine-containing
peptides are then purified by affinity chromatography (biotine-avidin/streptavidin systems) and analysed
by LC-MS/MS, whereby they are detected as doublets in the same mass spectra, and their relative
intensity reflects the relative abundance of the original protein in both samples. The overall heterogeneity
of the samples is reduced, since only the cysteine-containing peptides are analysed, but the counterpart
is that lower sequence coverage is obtained for a given protein. In addition, the study of PTMs is
limited. An excess of the tag or the occurrence of endogenous biotine decreases the labelling efficiency
and thus limits the use of the affinity chromatography step [83]. The biotine, which causes the decrease
of the MS collision energy and then decreases the MS/MS fragmentation efficiency, can be removed
before the MS step by the use of photocleavable linker or acid-cleavable linkers. Historically, the first
acid-cleavable technique, derived from ICAT and termed acid-labile isotope-coded extractants
(ALICE), contains (i) a thiol-reactive group (used to capture all cysteine-containing peptides from
peptide mixtures and then eliminates the affinity chromatography step), (ii) an acid-labile linker, and
(iii) a non-biological polymer [97]. Later, a generation of ICAT reagents with photocleavable linker
was also developed [98], where the UV-light is used to liberate the biotine used during the purification
step. Finally, ICAT reagents were worked out carrying an acid-cleavable bond to discard the biotine,
after the affinity chromatography step [116]. Today, this last technique remains the most used. The use
of stable-isotope labelling at thiol groups by small organic molecules like N-ethymaleimide
(1H5-NEM/
2H5-NEM, Δ = 5 Da) or iodoacetamide (
12C6-IAA/
13C6-IAA, Δ = 6 Da) was described in a
first study combining one- or two-dimensional electrophoresis and MALDI-TOF-MS [99].
This method eliminates fundamental problems of the other existing isotope-tagging methods
requiring liquid chromatography and MS/MS, such as isotope effects, fragmentation, and solubility.
It is also being considered to be more practical and accessible than those LC-dependent methods.
Another method is based on the differential labelling of mixtures by use of a commercially available,
unlabelled and labelled with deuterium, acrylamide or vinyl pyridine (1H3/
2H3-acrylamide or
1H4/
2H4-vinylpyridine) [100,101] to alkylate proteins (cysteine residues). With the latter method,
small, hydrophilic molecules have the advantage of improving the solubility of the proteins and easily
accessing the labelling sites. After mixing the samples from the two conditions, the proteins are
separated by two-dimensional (2-D) gel electrophoresis and analysed by mild MS-ionisation to prevent
the fragmentation of the tag (often occurring in the ICAT technique) [101]. However, although this
method has some of the 2D-DIGE advantages (e.g., several samples on a single gel) it also has the
classical drawbacks of the in-gel analysis. The quantification is performed by MS instead of measuring
the staining intensity of spots. The 2D-PAGE is used for the identification of the proteins by PMF.
This simplifies the overall analysis and again prevents the fragmentation of the ICAT tags.

Proteomes 2013, 1 200
3.3.1.2.2.2. Labelling of Amino Groups
Proteins can be covalently labelled on their free amino-terminal groups and especially on the
ε-amino groups of lysine residues that are more abundant than cysteine residues in proteins. The
disadvantage of this type of labelling, but to a lesser extent than the labelling on cysteine residues, is
that it does not cover the entire protein and, thus, can induce loss of information. Nevertheless, it is
possible to simultaneously tag the peptides at their carboxyl-terminal and amino-terminal extremities
in order to obtain a uniform labelling of all the peptides regardless of their amino acid composition and
their PTMs. Introduced in 2005, the Isotope-coded protein label (ICPL) approach [102] involves the
labelling of amino groups. The tags are N-nicotinoyloxy-succinimide (12
C6/13
C6), whose the mass
difference (ΔDa = 6.02 Da) is easily observable by MS. Quantification is performed in the MS mode,
by the comparison of the peak intensity while the identification of proteins is classically done in the
MS/MS mode. Recently, triplex and quadruplex versions of ICPL were developed using a combination
of carbon and hydrogen isotopes (12
C6/1H4,
12C6/
2H4,
13C6/
1H4,
13C6/
2H4) for the simultaneous comparison
of three or four samples [103]. This multiplex approach allows to reduce the proteome complexity
(even after labelling), and to detect isoforms, PTMs and also splicing variants (through 2D-PAGE).
After labelling, thanks to the low MM and the hydrophilic properties of ICPL-tags, the original
physicochemical properties of proteins, especially their ability to precipitate in aqueous solutions, are
preserved. In addition, the nicotinic derivative enhances the in-source ionisation of peptides (increase
of MS-signal intensities) and promotes the MS fragmentation mechanisms (the MS-fragmentation is
improved). The labelling of lysine residues prevents the digestion by trypsin which will only be
effective at the arginine residues. The generated peptides are longer, thus their fragmentation is more
difficult. This can be easily overcome by a double enzymatic digestion, for example a combination of
trypsin/Glu-C endoproteinases in order to obtain shorter peptides. Initially designed for protein
labelling, the ICPL can be performed directly on peptide mixtures. Using this post-digest ICPL, the
amount of identified but non quantified proteins can decrease from 30% down to 2% [104].
The isobaric tags for relative and absolute quantification (iTRAQ) labelling are also based on the
covalent labelling of amino groups of peptides [105]. Designed for peptides, this labelling method is
less commonly used for proteins [106]. The label is composed of a reporter chemical group, a balance
chemical group and a chemical group reactive on primary amines. Today, the iTRAQ technology
allows comparing 2, 4 or 8 samples at once. The reporter groups are distinguished by their particular
mass (113, 114, 115, 116, 117, 118, 119, 121 Da), according to the combinations 12
C/13
C, 16
O/18
O and 14
N/15
N. The balance groups have a mass ranging from 28–31 Da (for the comparison of four samples
and from 184–192 Da for eight samples) to compensate the mass difference of reporter groups and
identical chemical reactivity and conserve a constant tag mass of 145 Da and 305 Da, respectively.
In fine, the tags present identical physicochemical properties during the chromatographic step and the
MS measure but are distinguished in MS/MS mode. The identification and quantification of the
peptides require the fragmentation step in the MS/MS mode. The fragment ions of the reporter groups
are detected by their distinctive mass from 114–117 Da (four samples) or 113–121 (eight samples) and
their intensities are used for quantification.
The tandem mass tags (TMT) labelling is based on the same concept as iTRAQ labelling but differs
by the reporter and balance groups. Briefly, the mass of the reporter groups ranges from 126–131 Da,

Proteomes 2013, 1 201
that of the balance group from 99–104 Da while the total mass remains constant (230 Da). The
TMT-based reagents allow the simultaneous analysis of two or six samples. The labelling on cysteine
residues is also possible [107].
A dimethyl labelling strategy, by reductive methylation using water-soluble formaldehyde,
deuterated (CD2O) or not (CH2O), was developed in 2005 for the binary labelling on the peptide
N-terminus and the ε-amino groups of Lys of two sample sets [108,109]. The enzymatic digestion is
carried out before the labelling with Lys-C endoproteinase in order to obtain a double labelling per
peptide, one at the carboxyl-terminal lysine and one at the amino-terminal group, and a sufficient mass
shift (ΔDa = 4 Da) to be detected in MS. The drawback of this technique is that the peptides with a
blocked N-terminus (proline, pyroglutamate and so on) are monomethylated and thus poorly detected
in MS. This labelling is rapid, inexpensive and specific and leads to almost full reaction. A quadruplex
version of this labelling strategy, combining the binary isotopic reagents of formaldehyde (CH2O/CD2O)
and the binary isotopic reducing reagents, sodium cyanoborohydride (sodium cyanoborohydride,
NaBCNH3 and sodium cyanoborodeuteride, NABCND3), was reported one year later [117]. The
reagents are combined two by two as follows: CH2O/NaBCNH3, CH2O/NaBCND3, CD2O/NaBCNH3
and CD2O/NaBCND3 (ΔDa = 4, 8 or 12 Da). However, this dimethyl multiplexed labelling increases
the complexity of the analyses.
The labelling techniques by peptide acylation of free amino groups using stable isotopes, termed
global internal standard technology (GIST), leads to the uniform labelling of all the peptides.
Numerous reagents can be used, such as acetic anhydride, succinic anhydride, N-acetoxy-succinimide,
1-nicotinoyloxy-succinimide, propionate, propionic anhydride, 4-trimethylammonium butyrate, isocyanate
and isothiocyanate [118,119]. Again, the labelling is performed with reagents containing stable
isotopes of hydrogen or carbon. The acylation can however affect the charge of the peptides and, thus,
their ionisation. In order to simplify the MS-signal treatment, only the amino-terminal group of
the peptides can be tagged (implicates the protection of the ε-amino groups of lysine residues
by guanidinylation).
3.3.1.2.2.3. Labelling of Carboxyl Groups
The enzyme-catalysed 18
O-labelling is known as enzyme mediated oxygen substitution
(EMOS) [110–112]. This labelling, performed late in the sample preparation process, takes place
during the enzymatic digestion and acts on the generated α-carboxyl terminus. In the presence of 16
O-enriched water (H216
O) or 18
O-enriched water (H218
O) or combination of both, the carboxyl
terminus will be found as C16
O16
OH, C16
O18
OH or C18
O18
OH depending on the enzyme used
(ΔDa = 4 Da or only one ΔDa = 2 Da). The labelling being rarely total, the peptides incorporate the
label at various rates, which complicates the analysis. The labelling takes place during the enzymatic
digestion with H218
O or just after the digestion with an additional step of incubation in H218
O [113].
The challenge of this type of labelling lies in the optimisation of the experimental protocols to avoid
residual proteolytic activity creating back 18
O/16
O exchanges. The inhibition of the residual, harmful
enzymatic activity can be performed by buffer acidification, temperature increase and using trypsin
immobilised on beads that can be removed by centrifugation [120].

Proteomes 2013, 1 202
A method of acid-catalysed 18
O-labelling of proteins/peptides was recently suggested as an
alternative to enzyme-catalysed 18
O-labelling [114]. This acid mediated oxygen substitution (AMOS)
labelling was applied to a set of peptides after the enzymatic digestion step via chlorhydric acid (HCl)
catalysis in the presence of H218
O to label the carboxyl groups from glutamic acid, aspartic acid, and
the C-terminal residues [121]. The optimisation of this labelling allows a 95%–97% incorporation of
the tag. Thanks to this method, the majority of peptides display a difference of at least 4 Da limiting
the overlapping of isotope patterns of the pair-wise compounds. The possible residual enzymatic
activity from the previous step is inhibited by the HCl. The method is not applicable to peptides
bearing an acidic pH sensitive PTM.
Methanol (CH3OH) and deuterated methanol (CD3OH), in the presence of HCl are used for the
esterification of carboxyl groups of aspartate, glutamate and carboxyl terminus [115]. This labelling
perfectly fits to the quantification of phosphopeptides, since esterification reduces the undesirable
affinity for immobilised metal affinity chromatography (IMAC) of acidic peptides, thus improving the
yield of fixation of phosphorylated peptides. However, the experimental conditions promote the
oxidative deamidation of asparagine and glutamine, which becomes aspartic and glutamic acids,
ΔDa = 1 Da) and complicate the data analysis.
3.3.1.2.2.4. Labelling of PTMs
The diversity of PTMs and of their mechanisms of regulation considerably increases the complexity
of the proteome. The study and the quantification of proteins with PTMs can be done with isotope
labelling using two strategies depending on the target of the labelling: the peptide or the PTM. The
first strategy involves the isotopic labelling of all the peptides (amino or carboxyl groups during
proteolysis) then the purification of peptides bearing a PTM of interest. For example, the
phosphopeptides (phosphoryl groups mainly on tyrosine, serine and threonine residues) are isolated by
immobilised metal or metal oxide affinity chromatography (IMAC or MOAC) or using antibodies (for
review see [122]). Likewise, the Lys-acetylated peptides are also enriched by immunoprecipitation
with antibodies directed against acetyl epitopes. A recent report provides an overview of the recent
advances in MS based glycoproteomic methods and technology, in the context of biomarker discovery
and clinical application [123]. The glycopeptides can be isolated by lectin-affinity chromatography, by
hydrophilic interaction chromatography that can equally carried out by the use of functionalised
magnetic beads [124]. However, it is important that the label does not hinder the process of PTM
enrichment neither the acquisition of characteristic MS-signals [118]. If that happens, the proteins or
peptides with PTMs should first be selected before performing the labelling. The second strategy
involves direct targeting of the PTM (phosphoserine or phosphothreonine residues, or glycosylation
sites) and their replacement by a reporter group. Briefly the modifications (phosphoryl groups or
glycans) are chemically or enzymatically cleaved (-elimination under mild alkaline conditions,
hydrazinolysis, PNGase F, etc.) and concomitantly replaced by a reporter group, e.g., 1,2-ethandithiol
or its deuterated derivative [125]. The reagent used for the phosphoprotein isotope-coded affinity tag
(PhIAT) technique includes a biotine residue to easily purify the labelled, initially phosphorylated,
peptides from the unlabelled, initially non-phosphorylated ones using an immobilised-avidin inert
support [126].

Proteomes 2013, 1 203
3.3.2. Absolute Quantification
For a long time, the reference method for the absolute quantification of proteins was the
immunoenzymatic assays, such as the enzyme-linked immunosorbent assay (ELISA). However, this is
a targeted method, as it addresses the quantification of a unique protein, and has major limitation with
regards to the availability and cost of antibodies but also the cross-reactivity of antibodies and the
inability to automate. Consequently, new methods, based on mass spectrometry, emerged.
The addition of a protein in known quantities to a sample can lead to an estimation of the absolute
abundance of almost all the proteins present in a sample when a label-free approach is used. In
practice, the final concentration of the supplemented protein is correlated to the MS-signal intensity of
peptides issued of its enzymatic digestion and also compared to the MS-signals of all the peptides in
the sample. However, this technique leads to significant errors in quantitative ratios and, thus, the
interpretation of the results should cautiously be done.
A second method of absolute MS quantification of proteins is based on the use of an internal
standard labelled with stable isotopes. It only concerns the quantification of one or a few proteins of
interest and therefore it is not adapted to global analyses of a proteome. In fact it is used for studies
based on one or a few known proteins for validation of biomarkers in clinical proteomics.
In this context, we can quote the absolute quantification of proteins (AQUA) strategy [127], based
on the use of a peptide of interest as an internal standard. The selected peptide issued from the protein
to be quantified and which is frequently observed in MS is de novo synthesised with one amino acid
bearing one or more isotopes. Bioinformatics tools help to predict the ―ideal‖ peptides that can serve as
internal standards. The physical properties (size, charge, hydrophobicity, and ionisation) of the AQUA
peptide remain identical to the native peptide. Their mass difference is observable by MS. The
biological sample to analyse is supplemented with a known quantity of the AQUA peptide before
enzymatic digestion and LC-MS analysis. A ratio is calculated by the comparison of the mass signal of
the native peptide and the AQUA peptide. In the same manner the protein of interest can be directly
used as an internal standard and to be added before any treatment of the sample. This technique is
known as protein standard for absolute quantification (PSAQ) [128]. Both techniques, in theory,
enable the study of PTMs, the limit being the relative high cost of the synthesis of isotope-labelled
peptides (or proteins) to use as internal standards.
The quantification of a group of proteins of interest using the AQUA strategy is complex as each
standard peptide would need to be chemically synthesised. This can be overstepped with the
multiplexed absolute quantification using artificial proteins of concatenated signature peptides
(QconCAT). In this method, a unique signature peptide was selected for each protein of interest. The
sequences of all the selected peptides are then used to design de novo a chimeric gene that expresses
the concatenated protein in an expression system that allows its labelling with stable isotopes. The
expressed chimeric QconCAT protein is then purified and added to the sample. The enzymatic
digestion of the sample containing the QconCAT protein generates peptides including a set of
isotope-labelled standard peptides that are used as internal standard [129]. In contrast to AQUA, the
PSAQ and QconCAT approaches take into account the process of enzymatic digestion in their
quantification principle.

Proteomes 2013, 1 204
The selected reaction monitoring (SRM) and multiple reaction monitoring (MRM) overcome
certain bias of the standard AQUA method. The MS-analyser (triple-quadrupole) used in these
quantification methods controls simultaneously the molecular mass of the intact peptide and of a
selected fragment ion (SRM) or of several selected fragment ions (MRM), specific of the peptide. In
the first quadrupole, the m/z of the peptide of interest is filtered. In the second quadrupole, the selected
ion is fragmented using collision energy. Only the fragment ions of interest enter the third quadrupole
and thereafter their intensities measured [130]. The concentration of the targeted peptide is then
determined by comparison of its mass signals to the mass signals either of the isotope-labelled peptide
which was added in known quantities or using a calibration curve. Once the optimisation is completed,
the SRM and MRM techniques offer both high sensitivity and reproducibility [131]. SRM is performed in
triple quadrupole instruments, although pseudo SRM/MRM experiments are also possible in Q-TOF,
Q-orbitrap or also IT instruments [132,133].
3.4. Advantages and Limits of the Peptide-Based Quantification of Proteins
Whatever the type of spectrometer used, the label-free differential proteomics approach, based on
the comparison of the protein heterogeneity of distinct samples is without doubt (i) the less expensive
and the less sample-consuming, (ii) the only approach with no limit to the number of experiments to be
compared, (iii) well adapted to samples with low complexity, such as the cellular sub-proteomes,
(iv) the most accurate in terms of protein identification, however, (v) one of the least quantitative and
(vi) the most restrictive concerning the normalisation of the chromatographic separations and their
analysis by means of MS (Table 4) [73]. So, compared to stable isotope labelling, the label-free
approach is less adapted to the relative quantification of a protein‘s abundance between two samples.
However, unlike stable isotope labelling, the mass spectra display lower complexity due to the
non-simultaneous presence of labelled and unlabelled peptides that allows easier spectral analysis and
provides higher dynamic range of quantification.
Concerning the stable isotope labelling, the literature survey reveals several drawbacks. The
methods allowing the quantification by MS involve a minimal mass-shift introduced by the labelling.
It should be easily detectable by MS and thus distinguish the isotopic pattern of both labelled and
unlabelled peptides. It should be noted that the resolution of the isotope patterns decreases inversely
proportional to the peptide mass, which means that labelling resulting in low mass-shift will be
inadequate for analysis of large peptides when using the most common mass spectrometers. In
addition, the mass signals of low intensity (within the background noise) or of high intensity (detector
saturation) will not allow a correct quantification. Nevertheless, the development of MS apparatuses
and the contribution of the high resolution enable minimising the loss of information. Note that a
wrong quantification can always occur, even when high resolution mass spectrometers are used.
Indeed, whatever the labelling, the isotopic distribution of the most abundant peptide can completely
mask the isotopic distribution of associated peptide.

Proteomes 2013, 1 205
Table 4. Different methods used for the labelling of proteins or peptides in view of off-gel quantification (Peptide based quantification) a.
Advantages Drawbacks Robustness for
large scale analysis Exemples of use
Pre-analysis
labelling
(A single analysis
(sample combination
after labelling): mass
difference between
peptide pairs on the
same mass spectra)
In vitro/vivo
labelling (during
protein synthesis)
15N,
13C,
Accuracy Limited to cells in
culture,time-consuming
Yes
(regardless of the
cost and time needed)
Cells in culture SILAC, CIDTs,
superSILAC, SILAM
Pre-digestion
labelling
ICPL, iTRAQ, TMT, ICAT,
ALICE, dimethyl Sample complexity Low sequence recovery
All types of
biological sample
(regardless of the
protein quantity
needed)
In-digestion
labelling H2
18O
Simplified signal
analysis, low cost
Late labelling Post-digestion
labelling
ICAT, iTRAQ, ICPL,
ALICE, TMT High sequence recovery
dimethyl, GIST
Direct analysis (Two
(or more) analyses
carried out
independently before
their comparison)
Label-free
Quantification
(without internal
standard)
Comparison of mass spectra
Sample number,
low cost
Separations
normalisation,
signal alignment
Yes All types of
biological sample Spectral counting
Absolute
Quantification
(with internal
standard)
AQUA Easy to use Cost of internal
standard, analysis
of one or
few proteins
No(too expensive) Validation of
biomarkers
QconCAT Enzymatic digestion
take into account PSAQ
SRM / MRM High sensitivity and
reproducibility a SILAC, stable isotope labelling by amino acids in cell culture; CDIT, culture-derived isotope tags; SILAM, stable isotope labelling of mammal; ICPL, isotope-coded protein label; TMT,
tandem mass tags; ICAT, isotope-coded affinity tags; iTRAQ, isobaric tags for relative and absolute quantification; ALICE, acid-labile isotope-coded extractants; GIST, global internal
standard technology; Coomassie brilliant blue; XIC, extracted ion chromatogram; AQUA, absolute quantification of proteins; QconCAT, absolute quantification using artificial proteins of
concatenated signature peptides; PSAQ, protein standard for absolute quantification; IMAC, immobilised metal affinity chromatography.

Proteomes 2013, 1 206
Nevertheless, the major limit of the use of stable isotope labelling is associated with the possible
co-elution of peptides with other molecules having the same mass. Reducing the complexity of the
samples is a prerequisite for the optimisation of the quantitative analyses in this case.
The later the labelling step is performed in the analytical process, the more essential is an expert, as
is a rigorous sample preparation and an efficient bioinformatics and statistic treatment of the data. This
is particularly true for label-free quantification [73]. In order to avoid inter-sample variations due to
experimental bias and to control the reproducibility of the analyses, the number of steps for the sample
preparation should be minimised. Other technical bias can occur, especially those resulting from an
incomplete incorporation of the isotope or from its low purity.
However, despite the increasing performance of mass spectrometers, the number of identified
proteins is limited compared to the high number of proteins in a given sample along with the employed
methodology. The number of quantified proteins will inadvertently be different to the identified
proteins, since all the proteins are not always present in the sample under consideration. The
identification and quantification ratios are thus directly related to the sample complexity.
The last step of a proteomics analysis, not detailed in this review, but essential, relates to the
verification of the results. This step is as equally important as the generated data. The reliability of the
obtained results is indeed linked to the biological conclusions issued from the analysis. The results can
be subjected to statistical analysis, error rate assessment [134], to manual checking (data processing)
and be also validated by further biochemical analyses. A recent review [135] highlighted important
issues that directly impact the effectiveness of proteomic quantification and educates software
developers and end-users on available computational solutions to correct for the occurrence of these
factors; potential sources of errors specific for stable isotope-based methods or label-free approaches
are explicitly outlined.
4. MS Technology for Proteomics
The MS technology emerged at the beginning of the 20th century, essentially in response to the
need for detecting and quantifying atoms. Due to their high molecular mass, the technology was
adapted only from around 20 years ago to the analysis of biological macromolecules. The mass
spectrometers experienced prodigious improvements in recent years thus contributing to the
emergence of the MS-based proteomics even if the MS resolution and detector performance are
presently limiting [136]. The choice of the type of mass spectrometers will depend on the retained
proteomics strategy, the considered approach and the desired degree of information. Because mass
analysis uses electromagnetic fields in a vacuum, molecules must first be electrically charged and
transferred into the gas phase. Once in the gas phase, the m/z ratio of molecules is measured from their
trajectories in a static or dynamic electric field. For example, a quadrupole mass filter can be set to
only transmit ions of a given m/z and a mass spectrum is then obtained by scanning through a range of
m/z values. Two types of sources are used for the ―soft‖ ionisation of proteins and peptides: (i) the
electrospray ionisation source (ESI) [137,138] a continuous source for the ionisation of compounds in
solution directly after their separation in liquid phase (chromatography or electrophoresis) or in gas
phase (gas liquid chromatography); and (ii) the Matrix-assisted laser desorption/ionization (MALDI)
source [139–141], a non-continuous source (ionisation by energy pulse) in solid phase (the compounds

Proteomes 2013, 1 207
are previously co-crystallised in a matrix), which is based on the desorption of molecules triggered by
UV laser beam and their consecutive ionisation.
The mass analysers used for proteomics approaches can be more or less complex—quadripoles (Q),
time of flight (TOF), ion traps (IT), Fourier transform-IT (OrbitrapTM
) and Fourier transform ion
cyclotron resonance (FT-ICR)—all individually having their own advantages and/or drawbacks (for
review, [10,142]. They can be used in MS mode for the accurate measure of the m/z ratio or combined
each other (MS/MS mode or tandem MS) for sequencing of the peptides by physical fragmentation.
The sensitivity, the resolution, the mass range, the rate of scanning and the precision are the
parameters to be specified for the mass analyser.
In the analysis of peptides derived from the same protein, typically after 2-DE, the identification of
the protein will be done mainly by the establishment of PMF of the protein after the action of a
specific protease, using the MS mode, which measures the m/z ratios of generated peptides. Proteases
with restrained specificity always generate the same peptides for a given protein [143–147]. However,
it may be appropriate to combine PMF and PFF results in order to avoid false positive and to increase
identification scores. In the analysis of peptides derived from a mixture of proteins, typically after
HPLC, the identification will only be done by establishment of the PFF via the MS/MS mode, which
measures the m/z ratios of the different fragments of the peptide [148–150]. The information on the
masses obtained by PMF or PFF is then compared to their putative homolog predicted in silico from
the sequences of all the proteins referenced in the protein data banks [151] or from any DNA/RNA
databank. Those comparisons are performed using dedicated software such as Profound, MS-FIT,
Mascot, Sequest, X!Tandem or OMSSA [152]. The close match of the theoretical and the experimental
PMF (or PFF) allows tracing back the protein identity. Developed for the identification of proteins
whose sequences are already present in the data banks, the aforementioned methods do not allow the
identification of proteins derived from non-sequenced organisms, unless by their homology to existing
sequences, or, proteins containing complex PTMs. For those proteins (or peptides) the MS/MS mode
allows de novo sequencing and, thus, helps deducing their amino acid sequence from the mass
difference between consecutive ion fragments. In that case, it becomes possible to identify peptides
with PTMs and those originating from non-sequenced organisms (due to species homology).
5. Concluding Remarks
Given the continuous developments of quantitative strategies (especially the isotopic labelling
methods) and MS apparatus and the different challenges in proteomics, it is difficult to describe
exhaustively, even succinctly, all the techniques and the possible strategies for the quantification of
proteins. Thus, this review was focused on the well-established techniques, while keeping in mind that
techniques are modular and often overlap each other. Considering the unique characteristics and
limitations of each approach and the diversity of the physicochemical properties of proteins, all
approaches discussed here are considered complementary with each other.
The overview highlighted the advantage of global proteomics strategies, which is that no hypothesis
is required, other than a measurable difference in one or more protein species between the samples.
Since global proteomics methods attempt to separate, quantify and identify all the proteins from a
given sample, the bottom-up strategy is clearly of choice for a global differential study of proteins. In

Proteomes 2013, 1 208
the effort of deciphering molecular mechanisms for the establishment of the blood-brain barrier, we
have experimented with several approaches and, using the in vitro model developed in our laboratory,
we demonstrated that the in-gel [50,153] and the off-gel [45,49,50] approaches were complementary.
However, the in-gel approach seems to be the approach of choice to initiate a comparative and
quantitative global proteomic study of an ―unknown‖ sample, whereas the off-gel approach allows
going deeper in the analysis once the identity of a sample has been established. Thus, this is more than
ever noteworthy that the ―choice of an in-gel or an off-gel analysis as well as the choice of the
quantification strategy to use will only depend on the biological question we have to tackle‖ [5].
To conclude, the label free approach seems to be the approach of choice in the future because of
(i) a real progress in MS-instruments (higher mass accuracy and faster scanning), computational
methods and software for data treatment and (ii) its low cost compared to labelling approaches. For
comprehensive characterization of proteomes, an analytical platform capable of quantifying protein
abundance, identifying post-translation modifications and revealing members of protein complexes on
a system-wide level is necessary. MS, coupled with technologies for sample fractionation and
automated data analysis, provides such a versatile and powerful platform [154]. Understanding protein
interactions within the complexity of a living cell is challenging, but techniques that combine affinity
purification and MS have enabled important progress in recent years. The quantification of the
interaction dynamics is the next frontier. Several quantitative mass spectrometric approaches have
been developed to address these issues that vary in their strengths and weaknesses [155]. While
isotopic labelling approaches continue to contribute to the identification of regulated interactions, label
free techniques are becoming increasingly used in the field, as was recently done for the study of
N-glycan occupancy in N-glycoproteins [156].
Acknowledgments
This research was funded by the Ministère de la Recherche et de l‘Enseignement Supérieur. We
wish to thank Rigas Karamanos for linguistic advice and editing suggestions. We are also grateful to
Johan Hachani for his technical expertise and continuous help.
Conflicts of Interest
The authors declare no conflict of interest
References
1. Wilkins, M.R.; Gasteiger, E.; Sanchez, J.C.; Appel, R.D.; Hochstrasser, D.F. Protein
identification with sequence tags. Curr. Biol. 1996, 6, 1543–1544.
2. Anderson, N.L.; Anderson, N.G. Proteome and proteomics: New technologies, new concepts,
and new words. Electrophoresis 1998, 19, 1853–1861.
3. Tyers, M.; Mann, M. From genomics to proteomics. Nature 2003, 422, 193–197.
4. Apweiler, R.; Aslanidis, C.; Deufel, T.; Gerstner, A.; Hansen, J.; Hochstrasser, D.; Kellner, R.;
Kubicek, M.; Lottspeich, F.; Maser, E.; et al. Approaching clinical proteomics: Current state and
future fields of application in fluid proteomics. Clin. Chem. Lab. Med. 2009, 47, 724–744.

Proteomes 2013, 1 209
5. Rabilloud, T. Two-Dimensional gel electrophoresis in proteomics: Old, old fashioned, but it still
climbs up the mountains. Proteomics 2002, 2, 3–10.
6. Guo, Y.; Xiao, P.; Lei, S.; Deng, F.; Xiao, G.G.; Liu, Y.; Chen, X.; Li, L.; Wu, S.; Chen, Y.; et al.
How is mRNA expression predictive for protein expression? A correlation study on human
circulating monocytes. Acta Biochim. Bioph. Sin. 2008, 40, 426–436.
7. Gygi, S.P.; Rochon, Y.; Franza, B.R.; Aebersold, R. Correlation between protein and mRNA
abundance in yeast. Mol. Cell Biol. 1999, 19, 1720–1730.
8. Bodzon-Kulakowska, A.; Bierczynska-Krzysik, A.; Dylag, T.; Drabik, A.; Suder, P.; Noga, M.;
Jarzebinska, J.; Silberring, J. Methods for samples preparation in proteomic research.
J. Chromatogr. B Anal. Technol. Biomed. Life Sci. 2007, 849, 1–31.
9. Rabilloud, T.; Lelong, C. Two-Dimensional gel electrophoresis in proteomics: A tutorial.
J. Proteomics 2011, 74, 1829–1841.
10. Aebersold, R.; Mann, M. Mass spectrometry-based proteomics. Nature 2003, 422, 198–207.
11. Siuti, N.; Kelleher, N.L. Decoding protein modifications using top-down mass spectrometry.
Nat. Methods 2007, 4, 817–821.
12. Marcus, K., Ed. Quantitative Methods in Proteomics; Humana Press: Totowa, NJ, USA, 2012;
Volume 893.
13. Linder, S.E.; Picton, H., IX. Some metallic hydrosulphides. J. Chem. Soc. Trans. 1892, 61,
114–136.
14. Kyle, R.A.; Shampo, M.A. Arne Tiselius—Father of electrophoresis. Mayo Clin. Proc. 2005,
80, 302.
15. Smithies, O. How it all began: A personal history of gel electrophoresis. Methods Mol. Biol.
2012, 869, 1–21.
16. Shapiro, A.L.; Viñuela, E.; Maizel, J.V., Jr. Molecular weight estimation of polypeptide chains
by electrophoresis in SDS-polyacrylamide gels. Biochem. Biophys. Res. Commun. 1967, 28,
815–820.
17. Weber, K.; Osborn, M. The reliability of molecular weight determinations by dodecyl
sulfate-polyacrylamide gel electrophoresis. J. Biol. Chem. 1969, 244, 4406–4412.
18. Nielsen, T.B.; Reynolds, J.A. Measurements of molecular weights by gel electrophoresis.
Methods Enzymol. 1978, 48, 3–10.
19. O‘Farrell, P.H. High resolution two-dimentional electrophoresis of proteins. J. Biol. Chem. 1975,
250, 4007–4021.
20. Görg, A.; Weiss, W.; Dunn, M.J. Current two-dimensional electrophoresis technology for
proteomics. Proteomics 2004, 4, 3665–3685.
21. Laemmli, U.K. Cleavage of structural proteins during the assembly of the head of bacteriophage
T4. Nature 1970, 227, 680–685.
22. Zhou, S.; Bailey, M.J.; Dunn, M.J.; Preedy, V.R.; Emery, P.W. A quantitative investigation into
the losses of proteins at different stages of a two-dimensional gel electrophoresis procedure.
Proteomics 2005, 5, 2739–2747.
23. Riederer, B.M. Non-Covalent and covalent protein labeling in two-dimensional gel
electrophoresis. J. Proteomics 2008, 71, 231–244.
Proteomes 2013, 1 210
24. Miller, I.; Crawford, J.; Gianazza, E. Protein stains for proteomic applications: Which, when,
why? Proteomics 2006, 6, 5385–5408.
25. Gauci, V.J.; Wright, E.P.; Coorssen, J.R. Quantitative proteomics: Assessing the spectrum of
in-gel protein detection methods. J. Chem. Biol. 2011, 4, 3–29.
26. De St. Groth, S.F.; Webster, R.; Datyner, A. Two new staining procedures for quantitative
estimation of proteins on electrophoretic strips. Biochim. Biophys. Acta 1963, 71, 377–391.
27. Switzer, R.C.; Merril, C.R.; Shifrin, S. A highly sensitive silver stain for detecting proteins and
peptides in polyacrylamide gels. Anal. Biochem. 1979, 98, 231–237.
28. Merril, C.R.; Switzer, R.C.; van Keuren, M.L. Trace polypeptides in cellular extracts and human
body fluids detected by two-dimensional electrophoresis and a highly sensitive silver stain.
Proc. Natl. Acad. Sci. USA 1979, 76, 4335–4339.
29. Rabilloud, T. Mechanisms of protein silver staining in polyacrylamide gels: A 10-year synthesis.
Electrophoresis 1990, 11, 785–794.
30. Bell, P.J.L.; Karuso, P. Epicocconone, a novel fluorescent compound from the fungus
epicoccumnigrum. J. Am. Chem. Sci. 2003, 125, 9304–9305.
31. Steinberg, T.H.; Jones, L.J.; Haugland, R.P.; Singer, V.L. SYPRO orange and SYPRO red
protein gel stains: One-Step fluorescent staining of denaturing gels for detection of nanogram
levels of protein. Anal. Biochem. 1996, 239, 223–237.
32. Berggren, K.; Chernokalskaya, E.; Steinberg, T.H.; Kemper, C.; Lopez, M.F.; Diwu, Z.;
Haugland, R.P.; Patton, W.F. Background-Free, high sensitivity staining of proteins in one- and
two-dimensional sodium dodecyl sulfate-polyacrylamide gels using a luminescent ruthenium
complex. Electrophoresis 2000, 21, 2509–2521.
33. Rabilloud, T.; Strub, J.M.; Luche, S.; van Dorsselaer, A.; Lunardi, J. A comparison between
Sypro Ruby and ruthenium II tris (bathophenanthroline disulfonate) as fluorescent stains for
protein detection in gels. Proteomics 2001, 1, 699–704.
34. Tokarski, C.; Cren-Olivé, C.; Fillet, M.; Rolando, C. High-Sensitivity staining of proteins for
one- and two-dimensional gel electrophoresis using post migration covalent staining with a
ruthenium fluorophore. Electrophoresis 2006, 27, 1407–1416.
35. Jia, J.; Fei, H.; Zhou, M. Luminescent iridium(III) complexes as novel protein staining agents.
Electrophoresis 2012, 33, 1397–1401.
36. Steinberg, T.H.; Agnew, B.J.; Gee, K.R.; Leung, W.-Y.; Goodman, T.; Schulenberg, B.;
Hendrickson, J.; Beechem, J.M.; Haugland, R.P.; Patton, W.F. Global quantitative phosphoprotein
analysis using Multiplexed Proteomics technology. Proteomics 2003, 3, 1128–1144.
37. Steinberg, T.H.; Top, K.P.O.; Berggren, K.N.; Kemper, C.; Jones, L.; Diwu, Z.; Haugland, R.P.;
Patton, W.F. Rapid and simple single nanogram detection of glycoproteins in polyacrylamide
gels and on electroblots. Proteomics 2001, 1, 841–855.
38. Gauci, V.J.; Padula, M.P.; Coorssen, J.R. Coomassie blue staining for high sensitivity gel-based
proteomics. J. Proteomics 2013, 90, 96–106.
39. Neuhoff, V.; Stamm, R.; Eibl, H. Clear background and highly sensitive protein staining with
Coomassie Blue dyes in polyacrylamide gels: A systematic analysis. Electrophoresis 1985, 6,
427–448.

Proteomes 2013, 1 211
40. Kazmin, D.; Edwards, R.A.; Turner, R.J.; Larson, E.; Starkey, J. Visualization of proteins in
acrylamide gels using ultraviolet illumination. Anal. Biochem. 2002, 301, 91–96.
41. Unlü, M.; Morgan, M.E.; Minden, J.S. Difference gel electrophoresis: A single gel method for
detecting changes in protein extracts. Electrophoresis 1997, 18, 2071–2077.
42. Lilley, K.S.; Friedman, D.B. All about DIGE: Quantification technology for differential-display
2D-gel proteomics. Expert Rev. Proteomics 2004, 1, 401–409.
43. Minden, J.S.; Dowd, S.R.; Meyer, H.E.; Stühler, K. Difference gel electrophoresis.
Electrophoresis 2009, 30, S156–S161.
44. Braun, R.J.; Kinkl, N.; Beer, M.; Ueffing, M. Two-Dimensional electrophoresis of membrane
proteins. Anal. Bioanal. Chem. 2007, 389, 1033–1045.
45. Pottiez, G.; Duban-Deweer, S.; Deracinois, B.; Gosselet, F.; Camoin, L.; Hachani, J.;
Couraud, P.-O.; Cecchelli, R.; Dehouck, M.-P.; Fenart, L.; et al. A differential proteomic
approach identifies structural and functional components that contribute to the differentiation of
brain capillary endothelial cells. J. Proteomics 2011, 75, 628–641.
46. Maurer, M.H. Web-Based tools for the interpretation of chain-like protein spot patterns on
two-dimensional gels. Curr. Proteomics 2012, 9, 18–25.
47. Petrak, J.; Ivanek, R.; Toman, O.; Cmejla, R.; Cmejlova, J.; Vyoral, D.; Zivny, J.; Vulpe, C.D.
Déjà vu in proteomics. A hit parade of repeatedly identified differentially expressed proteins.
Proteomics 2008, 8, 1744–1749.
48. Rogowska-Wrzesinska, A.; le Bihan, M.-C.; Thaysen-Andersen, M.; Roepstorff, P. 2D gels still
have a niche in proteomics. J. Proteomics 2013, 88, 4–13.
49. Pottiez, G.; Deracinois, B.; Duban-Deweer, S.; Cecchelli, R.; Fenart, L.; Karamanos, Y.;
Flahaut, C. A large-scale electrophoresis- and chromatography-based determination of gene
expression profiles in bovine brain capillary endothelial cells after the re-induction of
blood-brain barrier properties. Proteome Sci. 2010, 8, e57.
50. Deracinois, B.; Duban-Deweer, S.; Pottiez, G.; Cecchelli, R.; Karamanos, Y.; Flahaut, C. TNAP
and EHD1 are over-expressed in bovine brain capillary endothelial cells after the re-induction of
blood-brain barrier properties. PLoS One 2012, 7, e48428.
51. Ros, A.; Faupel, M.; Mees, H.; van Oostrum, J.; Ferrigno, R.; Reymond, F.; Michel, P.;
Rossier, J.S.; Girault, H.H. Protein purification by Off-Gel electrophoresis. Proteomics 2002, 2,
151–156.
52. Wang, W.; Wu, X.; Xiong, E.; Tai, F. Improving gel-based proteome analysis of soluble protein
extracts by heat prefractionation. Proteomics 2012, 12, 938–943.
53. Ramos, Y.; García, Y.; Llopiz, A.; Castellanos-Serra, L. Selectivity of bacterial proteome
fractionation based on differential solubility: A mass spectrometry evaluation. Anal. Biochem.
2008, 377, 134–140.
54. Bai, H.; Yang, F.; Yang, X. Novel prefractionation method can be used in proteomic analysis.
J. Proteome Res. 2006, 5, 840–845.
55. Bardel, J.; Louwagie, M.; Jaquinod, M.; Jourdain, A.; Luche, S.; Rabilloud, T.; Macherel, D.;
Garin, J.; Bourguignon, J. A survey of the plant mitochondrial proteome in relation to
development. Proteomics 2002, 2, 880–898.

Proteomes 2013, 1 212
56. Fountoulakis, M.; Langen, H.; Gray, C.; Takács, B. Enrichment and purification of proteins of
Haemophilus influenzae by chromatofocusing. J. Chromatogr. A 1998, 806, 279–291.
57. Pernemalm, M.; Lewensohn, R.; Lehtiö, J. Affinity prefractionation for MS-based plasma
proteomics. Proteomics 2009, 9, 1420–1427.
58. Badock, V.; Steinhusen, U.; Bommert, K.; Otto, A. Prefractionation of protein samples for
proteome analysis using reversed-phase high-performance liquid chromatography. Electrophoresis
2001, 22, 2856–2864.
59. Lescuyer, P.; Hochstrasser, D.F.; Sanchez, J.-C. Comprehensive proteome analysis by
chromatographic protein prefractionation. Electrophoresis 2004, 25, 1125–1135.
60. Hörth, P.; Miller, C.A.; Preckel, T.; Wenz, C. Efficient fractionation and improved protein
identification by peptide OFFGEL electrophoresis. Mol. Cell. Proteomics 2006, 5, 1968–1974.
61. Staub, A.; Schappler, J.; Rudaz, S.; Veuthey, J.-L. CE-TOF/MS: Fundamental concepts,
instrumental considerations and applications. Electrophoresis 2009, 30, 1610–1623.
62. Desiderio, C.; Rossetti, D.V.; Iavarone, F.; Messana, I.; Castagnola, M. Capillary
electrophoresis-mass spectrometry: Recent trends in clinical proteomics. J. Pharmaceut. Biomed.
2010, 53, 1161–1169.
63. Lienqueo, M.E.; Mahn, A.; Salgado, J.C.; Asenjo, J.A. Current insights on protein behaviour in
hydrophobic interaction chromatography. J. Chromatogr. B Anal. Technol. Biomed. Life Sci.
2007, 849, 53–68.
64. Zhang, X.; Fang, A.; Riley, C.P.; Wang, M.; Regnier, F.E.; Buck, C. Multi-Dimensional liquid
chromatography in proteomics—A review. Anal. Chim. Acta 2010, 664, 101–113.
65. Di Palma, S.; Hennrich, M.L.; Heck, A.J.R.; Mohammed, S. Recent advances in peptide
separation by multidimensional liquid chromatography for proteome analysis. J. Proteomics
2012, 75, 3791–3813.
66. Motoyama, A.; Yates, J.R. Multidimensional LC separations in shotgun proteomics. Anal. Chem.
2008, 80, 7187–7193.
67. Leitner, A.; Lindner, W. Chemistry meets proteomics: The use of chemical tagging reactions for
MS-based proteomics. Proteomics 2006, 6, 5418–5434.
68. Julka, S.; Regnier, F. Quantification in proteomics through stable isotope coding: A review.
J. Proteome Res. 3, 350–363.
69. Zhu, W.; Smith, J.W.; Huang, C.-M. Mass spectrometry-based label-free quantitative
proteomics. J. Biomed. Biotechnol. 2010, 2010, e840518.
70. Panchaud, A.; Affolter, M.; Moreillon, P.; Kussmann, M. Experimental and computational
approaches to quantitative proteomics: Status quo and outlook. J. Proteomics 2008, 71, 19–33.
71. Valleix, A.; Carrat, S.; Caussignac, C.; Léonce, E.; Tchapla, A. Secondary isotope effects in
liquid chromatography behaviour of 2H and 3H labelled solutes and solvents. J. Chromatogr. A
2006, 1116, 109–126.
72. Mann, M.; Kulak, N.A.; Nagaraj, N.; Cox, J. The coming age of complete, accurate, and
ubiquitous proteomes. Mol. Cell 2013, 49, 583–590.
73. Bantscheff, M.; Schirle, M.; Sweetman, G.; Rick, J.; Kuster, B. Quantitative mass spectrometry
in proteomics: A critical review. Anal. Bioanal. Chem. 2007, 389, 1017–1031.

Proteomes 2013, 1 213
74. Wang, M.; You, J.; Bemis, K.G.; Tegeler, T.J.; Brown, D.P.G. Label-Free mass
spectrometry-based protein quantification technologies in proteomic analysis. Brief. Funct.
Genomic. Proteomic 2008, 7, 329–339.
75. Bondarenko, P.V.; Chelius, D.; Shaler, T.A. Identification and relative quantitation of
protein mixtures by enzymatic digestion followed by capillary reversed-phase liquid
chromatography-tandem mass spectrometry. Anal. Chem. 2002, 74, 4741–4749.
76. Liu, H.; Sadygov, R.G.; Yates, J.R. A model for random sampling and estimation of relative
protein abundance in shotgun proteomics. Anal. Chem. 2004, 76, 4193–4201.
77. Voyksner, R.D.; Lee, H. Investigating the use of an octupole ion guide for ion storage and
high-pass mass filtering to improve the quantitative performance of electrospray ion trap mass
spectrometry. Rapid Commun. Mass Spectrom. 1999, 13, 1427–1437.
78. Tsou, C.-C.; Tsai, C.-F.; Tsui, Y.-H.; Sudhir, P.-R.; Wang, Y.-T.; Chen, Y.-J.; Chen, J.-Y.;
Sung, T.-Y.; Hsu, W.-L. IDEAL-Q, an automated tool for label-free quantitation analysis using
an efficient peptide alignment approach and spectral data validation. Mol. Cell. Proteomics 2010,
9, 131–144.
79. Rappsilber, J.; Ryder, U.; Lamond, A.I.; Mann, M. Large-Scale proteomic analysis of the human
spliceosome. Genome Res. 2002, 12, 1231–1245.
80. Ishihama, Y.; Oda, Y.; Tabata, T.; Sato, T.; Nagasu, T.; Rappsilber, J.; Mann, M. Exponentially
modified protein abundance index (emPAI) for estimation of absolute protein amount in proteomics
by the number of sequenced peptides per protein. Mol. Cell. Proteomics 2005, 4, 1265–1272.
81. Lu, P.; Vogel, C.; Wang, R.; Yao, X.; Marcotte, E.M. Absolute protein expression profiling
estimates the relative contributions of transcriptional and translational regulation. Nat. Biotechnol.
2007, 25, 117–124.
82. Braisted, J.C.; Kuntumalla, S.; Vogel, C.; Marcotte, E.M.; Rodrigues, A.R.; Wang, R.;
Huang, S.-T.; Ferlanti, E.S.; Saeed, A.I.; Fleischmann, R.D.; et al. The APEX Quantitative
Proteomics Tool: Generating protein quantitation estimates from LC-MS/MS proteomics results.
BMC Bioinform. 2008, 9, e529.
83. Gygi, S.P.; Rist, B.; Gerber, S.A.; Turecek, F.; Gelb, M.H.; Aebersold, R. Quantitative analysis
of complex protein mixtures using isotope-coded affinity tags. Nat. Biotechnol. 1999, 17,
994–999.
84. Oda, Y.; Huang, K.; Cross, F.R.; Cowburn, D.; Chait, B.T. Accurate quantitation of protein
expression and site-specific phosphorylation. Proc. Natl. Acad. Sci. USA 1999, 96, 6591–6596.
85. Paša-Tolić, L.; Jensen, P.K.; Anderson, G.A.; Lipton, M.S.; Peden, K.K.; Martinović, S.;
Tolić, N.; Bruce, J.E.; Smith, R.D. High throughput proteome-wide precision measurements of
protein expression using mass spectrometry. J. Am. Chem. Sci. 1999, 121, 7949–7950.
86. Ong, S.-E. Stable isotope labeling by amino acids in cell culture, SILAC, as a simple and
accurate approach to expression proteomics. Mol. Cell. Proteomics 2002, 1, 376–386.
87. Bendall, S.C.; Hughes, C.; Stewart, M.H.; Doble, B.; Bhatia, M.; Lajoie, G.A. Prevention of
amino acid conversion in SILAC experiments with embryonic stem cells. Mol. Cell. Proteomics
2008, 7, 1587–1597.
88. Ong, S.-E.; Kratchmarova, I.; Mann, M. Properties of 13
C-substituted arginine in stable isotope
labeling by amino acids in cell culture (SILAC). J. Proteome Res. 2003, 2, 173–181.

Proteomes 2013, 1 214
89. Molina, H.; Yang, Y.; Ruch, T.; Kim, J.; Mortensen, P.; Otto, T.; Nalli, A.; Tang, Q.; Lane, M.D.;
Chaerkady, R.; et al. Temporal profiling of the adipocyte proteome during differentiation using a
five-plex SILAC based strategy. J. Proteome Res. 2009, 8, 48–58.
90. Ishihama, Y.; Sato, T.; Tabata, T.; Miyamoto, N.; Sagane, K.; Nagasu, T.; Oda, Y. Quantitative
mouse brain proteomics using culture-derived isotope tags as internal standards. Nat. Biotechnol.
2005, 23, 617–621.
91. Geiger, T.; Cox, J.; Ostasiewicz, P.; Wisniewski, J.R.; Mann, M. Super-SILAC mix for
quantitative proteomics of human tumor tissue. Nat. Methods 2010, 7, 383–385.
92. Deeb, S.J.; D‘Souza, R.C.J.; Cox, J.; Schmidt-Supprian, M.; Mann, M. Super-SILAC allows
Classification of diffuse large B-cell lymphoma subtypes by their protein expression profiles.
Mol. Cell. Proteomics 2012, 11, 77–89.
93. McClatchy, D.B.; Dong, M.; Wu, C.C.; Venable, J.D.; Yates, J.R. 15
N metabolic labeling of
mammalian tissue with slow protein turnover. J. Proteome Res. 2007, 6, 2005–2010.
94. Wu, C.C.; MacCoss, M.J.; Howell, K.E.; Matthews, D.E.; Yates, J.R. Metabolic labeling of
mammalian organisms with stable isotopes for quantitative proteomic analysis. Anal. Chem.
2004, 76, 4951–4959.
95. Ong, S.E.; Mittler, G.; Mann, M. Identifying and quantifying in vivo methylation sites by heavy
methyl SILAC. Nat. Methods 2004, 1, 119–126.
96. Sarioglu, H.; Brandner, S.; Jacobsen, C.; Meindl, T.; Schmidt, A.; Kellermann, J.; Lottspeich, F.;
Andrae, U. Quantitative analysis of 2,3,7,8-tetrachlorodibenzo-p-dioxin-induced proteome alterations
in 5L rat hepatoma cells using isotope-coded protein labels. Proteomics 2006, 6, 2407–2421.
97. Qiu, Y.; Sousa, E.A.; Hewick, R.M.; Wang, J.H. Acid-Labile isotope-coded extractants: A class
of reagents for quantitative mass spectrometric analysis of complex protein mixtures. Anal.
Chem. 2002, 74, 4969–4979.
98. Bottari, P.; Aebersold, R.; Turecek, F.; Gelb, M.H. Design and synthesis of visible isotope-coded
affinity tags for the absolute quantification of specific proteins in complex mixtures.
Bioconjugate Chem. 2004, 15, 380–388.
99. Kurono, S.; Kurono, T.; Komori, N.; Niwayama, S.; Matsumoto, H. Quantitative proteome
analysis using D-labeled N-ethylmaleimide and 13C-labeled iodoacetanilide by matrix-assisted
laser desorption/ionization time-of-flight mass spectrometry. Bioorgan. Med. Chem. 2006, 14,
8197–8209.
100. Gehanne, S.; Cecconi, D.; Carboni, L.; Righetti, P.G.; Domenici, E.; Hamdan, M. Quantitative
analysis of two-dimensional gel-separated proteins using isotopically marked alkylating agents
and matrix-assisted laser desorption/ionization mass spectrometry. Rapid Commun. Mass
Spectrom. 2002, 16, 1692–1698.
101. Sechi, S. A method to identify and simultaneously determine the relative quantities of proteins
isolated by gel electrophoresis. Rapid Commun. Mass Spectrom. 2002, 16, 1416–1424.
102. Schmidt, A.; Kellermann, J.; Lottspeich, F. A novel strategy for quantitative proteomics using
isotope-coded protein labels. Proteomics 2005, 5, 4–15.
103. Lottspeich, F.; Kellermann, J. ICPL labeling strategies for proteome research. Method. Mol. Biol.
2011, 753, 55–64.

Proteomes 2013, 1 215
104. Leroy, B.; Rosier, C.; Erculisse, V.; Leys, N.; Mergeay, M.; Wattiez, R. Differential proteomic
analysis using isotope-coded protein-labeling strategies: comparison, improvements and
application to simulated microgravity effect on Cupriavidus metallidurans CH34. Proteomics
2010, 10, 2281–2291.
105. Ross, P.L.; Huang, Y.N.; Marchese, J.N.; Williamson, B.; Parker, K.; Hattan, S.; Khainovski, N.;
Pillai, S.; Dey, S.; Daniels, S.; et al. Multiplexed protein quantitation in Saccharomyces cerevisiae
using amine-reactive isobaric tagging reagents. Mol. Cell. Proteomics 2004, 3, 1154–1169.
106. Wiese, S.; Reidegeld, K.A.; Meyer, H.E.; Warscheid, B. Protein labeling by iTRAQ: A new tool
for quantitative mass spectrometry in proteome research. Proteomics 2007, 7, 340–350.
107. Thompson, A.; Schäfer, J.; Kuhn, K.; Kienle, S.; Schwarz, J.; Schmidt, G.; Neumann, T.;
Johnstone, R.; Mohammed, A.K.A.; Hamon, C. Tandem mass tags: A novel quantification
strategy for comparative analysis of complex protein mixtures by MS/MS. Anal. Chem. 2003, 75,
1895–1904.
108. Hsu, J.-L.; Huang, S.-Y.; Chow, N.-H.; Chen, S.-H. Stable-Isotope dimethyl labeling for
quantitative proteomics. Anal. Chem. 2003, 75, 6843–6852.
109. Hsu, J.-L.; Huang, S.-Y.; Shiea, J.-T.; Huang, W.-Y.; Chen, S.-H. Beyond quantitative
proteomics: Signal enhancement of the a1 ion as a mass tag for peptide sequencing using
dimethyl labeling. J. Proteome Res. 2005, 4, 101–108.
110. Fenselau, C.; Yao, X. 18
O2-Labeling in quantitative proteomic strategies: A status report.
J. Proteome Res. 2009, 8, 2140–2143.
111. Stewart, I.I.; Thomson, T.; Figeys, D. 18
O labeling: A tool for proteomics. Rapid Commun. Mass
Spectrom. 2001, 15, 2456–2465.
112. Mirgorodskaya, O.A.; Kozmin, Y.P.; Titov, M.I.; Körner, R.; Sönksen, C.P.; Roepstorff, P.
Quantitation of peptides and proteins by matrix-assisted laser desorption/ionization mass
spectrometry using 18
O-labeled internal standards. Rapid Commun. Mass Spectrom. 2000, 14,
1226–1232.
113. Staes, A.; Demol, H.; van Damme, J.; Martens, L.; Vandekerckhove, J.; Gevaert, K. Global
differential non-gel proteomics by quantitative and stable labeling of tryptic peptides with
oxygen-18. J. Proteome Res. 2004, 3, 786–791.
114. Niles, R.; Witkowska, H.E.; Allen, S.; Hall, S.C.; Fisher, S.J.; Hardt, M. Acid-Catalyzed
oxygen-18 labeling of peptides. Anal. Chem. 2009, 81, 2804–2809.
115. Goodlett, D.R.; Keller, A.; Watts, J.D.; Newitt, R.; Yi, E.C.; Purvine, S.; Eng, J.K.;
von Haller, P.; Aebersold, R.; Kolker, E. Differential stable isotope labeling of peptides for
quantitation and de novo sequence derivation. Rapid Commun. Mass Spectrom. 2001, 15,
1214–1221.
116. Yi, E.C.; Li, X.-J.; Cooke, K.; Lee, H.; Raught, B.; Page, A.; Aneliunas, V.; Hieter, P.;
Goodlett, D.R.; Aebersold, R. Increased quantitative proteome coverage with (13)C/(12)C-based,
acid-cleavable isotope-coded affinity tag reagent and modified data acquisition scheme.
Proteomics 2005, 5, 380–387.
117. Hsu, J.-L.; Huang, S.-Y.; Chen, S.-H. Dimethyl multiplexed labeling combined with
microcolumn separation and MS analysis for time course study in proteomics. Electrophoresis
2006, 27, 3652–3660.

Proteomes 2013, 1 216
118. Riggs, L.; Seeley, E.H.; Regnier, F.E. Quantification of phosphoproteins with global internal
standard technology. J. Chromatogr. B Anal. Technol. Biomed. Life Sci. 2005, 817, 89–96.
119. Chakraborty, A.; Regnier, F.E. Global internal standard technology for comparative proteomics.
J. Chromatogr. A 2002, 949, 173–184.
120. Sevinsky, J.R.; Brown, K.J.; Cargile, B.J.; Bundy, J.L.; Stephenson, J.L. Minimizing back
exchange in 18
O/16
O quantitative proteomics experiments by incorporation of immobilized
trypsin into the initial digestion step. Anal. Chem. 2007, 79, 2158–2162.
121. Haaf, E.; Schlosser, A. Peptide and protein quantitation by acid-catalyzed 18
O-labeling of
carboxyl groups. Anal. Chem. 2012, 84, 304–311.
122. Fíla, J.; Honys, D. Enrichment techniques employed in phosphoproteomics. Amino Acids 2012,
43, 1025–1047.
123. Pan, S.; Chen, R.; Aebersold, R.; Brentnall, T.A. Mass spectrometry based glycoproteomics—
From a proteomics perspective. Mol. Cell. Proteomics 2011, 10, 1–14.
124. Sparbier, K.; Koch, S.; Kessler, I.; Wenzel, T.; Kostrzewa, M. Selective isolation of
glycoproteins and glycopeptides for MALDI-TOF MS detection supported by magnetic particles.
J. Biomol. Technol. 2005, 16, 407–413.
125. Weckwerth, W.; Willmitzer, L.; Fiehn, O. Comparative quantification and identification of
phosphoproteins using stable isotope labeling and liquid chromatography/mass spectrometry.
Rapid Commun. Mass Spectrom. 2000, 14, 1677–1681.
126. Goshe, M.B.; Conrads, T.P.; Panisko, E.A.; Angell, N.H.; Veenstra, T.D.; Smith, R.D.
Phosphoprotein isotope-coded affinity tag approach for isolating and quantitating
phosphopeptides in proteome-wide analyses. Anal. Chem. 2001, 73, 2578–2586.
127. Gerber, S.A.; Rush, J.; Stemman, O.; Kirschner, M.W.; Gygi, S.P. Absolute quantification of
proteins and phosphoproteins from cell lysates by tandem MS. Proc. Natl. Acad. Sci. USA 2003,
100, 6940–6945.
128. Brun, V.; Dupuis, A.; Adrait, A.; Marcellin, M.; Thomas, D.; Court, M.; Vandenesch, F.;
Garin, J. Isotope-Labeled protein standards: Toward absolute quantitative proteomics. Mol. Cell.
Proteomics 2007, 6, 2139–2149.
129. Beynon, R.J.; Doherty, M.K.; Pratt, J.M.; Gaskell, S.J. Multiplexed absolute quantification in
proteomics using artificial QCAT proteins of concatenated signature peptides. Nat. Methods
2005, 2, 587–589.
130. Wolf-Yadlin, A.; Hautaniemi, S.; Lauffenburger, D.A.; White, F.M. Multiple reaction
monitoring for robust quantitative proteomic analysis of cellular signaling networks. Proc. Natl.
Acad. Sci. USA 2007, 104, 5860–5865.
131. Addona, T.A.; Abbatiello, S.E.; Schilling, B.; Skates, S.J.; Mani, D.R.; Bunk, D.M.;
Spiegelman, C.H.; Zimmerman, L.J.; Ham, A.-J.L.; Keshishian, H.; et al. Multi-Site assessment
of the precision and reproducibility of multiple reaction monitoring-based measurements of
proteins in plasma. Nat. Biotechnol. 2009, 27, 633–641.
132. Lange, V.; Picotti, P.; Domon, B.; Aebersold, R. Selected reaction monitoring for quantitative
proteomics: A tutorial. Mol. Syst. Biol. 2008, 4, 222.

Proteomes 2013, 1 217
133. Sherrod, S.D.; Myers, M.V; Li, M.; Myers, J.S.; Carpenter, K.L.; Maclean, B.; Maccoss, M.J.;
Liebler, D.C.; Ham, A.-J.L. Label-Free quantitation of protein modifications by pseudo selected
reaction monitoring with internal reference peptides. J. Proteome Res. 2012, 11, 3467–3479.
134. Nesvizhskii, A.I. A survey of computational methods and error rate estimation procedures for
peptide and protein identification in shotgun proteomics. J. Proteomics 2010, 73, 2092–2123.
135. Cappadona, S.; Baker, P.R.; Cutillas, P.R.; Heck, A.J.R.; van Breukelen, B. Current challenges in
software solutions for mass spectrometry-based quantitative proteomics. Amino Acids 2012, 43,
1087–1108.
136. Angel, T.E.; Aryal, U.K.; Hengel, S.M.; Baker, E.S.; Kelly, R.T.; Robinson, E.W.; Smith, R.D.
Mass spectrometry-based proteomics: Existing capabilities and future directions. Chem. Soc.
Rev. 2012, 41, 3912–3928.
137. Fenn, J.B.; Mann, M.; Meng, C.K.; Wong, S.F.; Whitehouse, C.M. Electrospray ionization for
mass spectrometry of large biomolecules. Science 1989, 246, 64–71.
138. Yamashita, M.; Fenn, J.B. Electrospray ion source. Another variation on the free-jet theme.
J. Phys. Chem. 1984, 88, 4451–4459.
139. Karas, M.; Hillenkamp, F. Laser desorption ionization of proteins with molecular masses
exceeding 10,000 daltons. Anal. Chem. 1988, 60, 2299–2301.
140. Karas, M.; Bachmann, D.; Bahr, U.; Hillenkamp, F. Matrix-Assisted ultraviolet laser desorption
of non-volatile compounds. Int. J. Mass Spectrom. Ion. Proc. 1987, 78, 53–68.
141. Tanaka, K.; Waki, H.; Ido, Y.; Akita, S.; Yoshida, Y.; Yoshida, T.; Matsuo, T. Protein and
polymer analyses up to m/z 100,000 by laser ionization time-of-flight mass spectrometry.
Rapid Commun. Mass Spectrom. 1988, 2, 151–153.
142. Walther, T.C.; Mann, M. Mass spectrometry-based proteomics in cell biology. J. Cell. Biol.
2010, 190, 491–500.
143. Henzel, W.J.; Billeci, T.M.; Stults, J.T.; Wong, S.C.; Grimley, C.; Watanabe, C. Identifying
proteins from two-dimensional gels by molecular mass searching of peptide fragments in protein
sequence databases. Proc. Natl. Acad. Sci. USA 1993, 90, 5011–5015.
144. James, P.; Quadroni, M.; Carafoli, E.; Gonnet, G. Protein identification by mass profile
fingerprinting. Biochem. Biophys. Res. Commun. 1993, 195, 58–64.
145. Mann, M.; Højrup, P.; Roepstorff, P. Use of mass spectrometric molecular weight information to
identify proteins in sequence databases. Biol. Mass Spectrom. 1993, 22, 338–345.
146. Pappin, D.J.; Hojrup, P.; Bleasby, A.J. Rapid identification of proteins by peptide-mass
fingerprinting. Curr. Biol. 1993, 3, 327–332.
147. Yates, J.R.; Speicher, S.; Griffin, P.R.; Hunkapiller, T. Peptide mass maps: A highly informative
approach to protein identification. Anal. Biochem. 1993, 214, 397–408.
148. Blueggel, M.; Chamrad, D.; Meyer, H.E. Bioinformatics in proteomics. Curr. Pharmaceut.
Biotechnol. 2004, 5, 79–88.
149. Eng, J.K.; McCormack, A.L.; Yates, J.R. An approach to correlate tandem mass spectral data of
peptides with amino acid sequences in a protein database. J. Am. Soc. Mass Spectrom. 1994, 5,
976–989.
150. Mann, M.; Wilm, M. Error-Tolerant identification of peptides in sequence databases by peptide
sequence tags. Anal. Chem. 1994, 66, 4390–4399.

Proteomes 2013, 1 218
151. Apweiler, R.; Bairoch, A.; Wu, C.H. Protein sequence databases. Curr. Opin. Chem. Biol. 2004,
8, 76–80.
152. Nesvizhskii, A.I.; Vitek, O.; Aebersold, R. Analysis and validation of proteomic data generated
by tandem mass spectrometry. Nat. Methods 2007, 4, 787–797.
153. Pottiez, G.; Sevin, E.; Cecchelli, R.; Karamanos, Y.; Flahaut, C. Actin, gelsolin and filamin-A
are dynamic actors in the cytoskeleton remodelling contributing to the blood brain barrier
phenotype. Proteomics 2009, 9, 1207–1219.
154. Van Riper, S.K.; de Jong, E.P.; Carlis, J.V.; Griffin, T.J. Mass spectrometry-based proteomics:
Basic principles and emerging technologies and directions. Adv. Exp. Med. Biol. 2013, 990, 1–35.
155. Tate, S.; Larsen, B.; Bonner, R.; Gingras, A.-C. Label-Free quantitative proteomics trends for
protein-protein interactions. J. Proteomics 2013, 81, 91–101.
156. Song, W.; Mentink, R.A.; Henquet, M.G.L.; Cordewener, J.H.G.; van Dijk, A.D.J.; Bosch, D.;
America, A.H.P.; van der Krol, A.R. N-Glycan occupancy of Arabidopsis N-glycoproteins.
J. Proteomics 2013, doi:10.1016/j.jprot.2013.07.032.
© 2013 by the authors; licensee MDPI, Basel, Switzerland. This article is an open access article
distributed under the terms and conditions of the Creative Commons Attribution license
(http://creativecommons.org/licenses/by/3.0/).