Comparative analysis of the seasonality of … · Comparative analysis of the seasonality of...
18
Hydrological Sciences–Journal–des Sciences Hydrologiques, 54(3) June 2009 * On leave from: Experimental Hydrological Base, Institute of Hydrology, Slovak Academy of Sciences, Liptovsky Mikulas, Slovakia. http://www.ih.savba.sk 456 Comparative analysis of the seasonality of hydrological characteristics in Slovakia and Austria J. PARAJKA 1 * , S. KOHNOVÁ 2 , R. MERZ 1 , J. SZOLGAY 2 , K. HLAVČOVÁ 2 & G. BLÖSCHL 1 1 Institute for Hydraulic and Water Resources Engineering, Vienna University of Technology, Karlsplatz 13/223, A-1040 Vienna, Austria [email protected] 2 Department of Land and Water Resources Management, Faculty of Civil Engineering, Slovak University of Technology, Radlinskeho 11, SK 813 68 Bratislava, Slovakia [email protected] Abstract The main objective of this study is to compare the seasonality of selected precipitation and runoff characteristics in Austria and Slovakia. Monthly seasonality indices are analysed to interpret the long-term climatic behaviour, while the seasonality of extremes is analysed to understand flood occurrence. The analysis is based on mean monthly precipitation data at 555 (Austria) and 202 (Slovakia) stations, annual maximum daily precipitation at 520 (Austria) and 56 (Slovakia) stations, and mean monthly runoff and annual maximum floods at 258 (Austria) and 85 (Slovakia) gauging stations. The results suggest that the seasonality of the selected hydrological characteristics is an important indicator of flood processes, but varies considerably in space. The seasonality of extreme flood events and, hence flood processes, tends to change with the flood magnitude. This change is more pronounced in the lowland and hilly regions than it is in the mountains. Both in Austria and Slovakia, decades of flood seasonality exist. Key words seasonality; annual maximum flood; precipitation; runoff; Austria; Slovakia Analyse comparative de la saisonnalité de caractéristiques hydrologiques en Slovaquie et en Autriche Résumé L’objectif principal de cette étude est de comparer la saisonnalité de caractéristiques sélectionnées des précipitations et de l’écoulement en Autriche et en Slovaquie. Des indices de saisonnalité mensuelle sont analysés pour interpréter le comportement climatique à long terme, tandis que la saisonnalité des extrêmes est analysée pour comprendre l’occurrence des crues. L’analyse est basée sur des données de précipitation mensuelle moyenne de 555 (Autriche) et 202 (Slovaquie) stations, de précipitation journalière maximum annuelle de 520 (Autriche) et 56 (Slovaquie) stations, et d’écoulement mensuel moyen et de crue maximale annuelle de 258 (Autriche) et 85 (Slovaquie) stations de jaugeage. Les résultats suggèrent que la saisonnalité des caractéristiques hydrologiques sélectionnées est un indicateur important des processus de crue, mais qui varie considérablement dans l’espace. La saisonnalité des événements extrêmes de crue, et par conséquent des processus de crue, tend à changer avec l’intensité de la crue. Ce changement est plus prononcé dans les régions de plaine et de collines que de montagnes. Des décennies de saisonnalité de crue existent en Autriche et en Slovaquie. Mots clefs saisonnalité; crue maximale annuelle; précipitation; écoulement; Autriche; Slovaquie INTRODUCTION The seasonality of hydrological characteristics is one of the key factors controlling the develop- ment and stability of natural ecosystems. From a hydrological perspective, seasonality analysis of runoff and precipitation is an appealing method for inferring flood generation mechanisms, which, in turn, supports other hydrological applications, such as hydrological regionalisation. Recently, the assessment of hydrological seasonality and regime stability has attracted a renewed interest, especially in connection with water resources management, engineering design and land cover and climate change assessment studies (e.g. Krasovskaia & Gottschalk, 2002; Krasovskaia et al., 2003; Bower et al., 2004; García & Mechoso, 2005). In the past, the seasonality of hydrological characteristics was analysed mainly in the context of comparative hydrology (Falkenmark & Chapman, 1989). The main idea was to study the Open for discussion until 1 December 2009 Copyright © 2009 IAHS Press
Transcript of Comparative analysis of the seasonality of … · Comparative analysis of the seasonality of...
Hydrological Sciences–Journal–des Sciences Hydrologiques, 54(3) June 2009
* On leave from: Experimental Hydrological Base, Institute of Hydrology, Slovak Academy of Sciences,
Liptovsky Mikulas, Slovakia. http://www.ih.savba.sk
456
Comparative analysis of the seasonality of hydrological characteristics in Slovakia and Austria J. PARAJKA1*, S. KOHNOVÁ2, R. MERZ1
, J. SZOLGAY2, K. HLAVČOVÁ2 & G. BLÖSCHL1
1 Institute for Hydraulic and Water Resources Engineering, Vienna University of Technology, Karlsplatz 13/223, A-1040 Vienna, Austria [email protected]
2 Department of Land and Water Resources Management, Faculty of Civil Engineering, Slovak University of Technology, Radlinskeho 11, SK 813 68 Bratislava, Slovakia [email protected] Abstract The main objective of this study is to compare the seasonality of selected precipitation and runoff characteristics in Austria and Slovakia. Monthly seasonality indices are analysed to interpret the long-term climatic behaviour, while the seasonality of extremes is analysed to understand flood occurrence. The analysis is based on mean monthly precipitation data at 555 (Austria) and 202 (Slovakia) stations, annual maximum daily precipitation at 520 (Austria) and 56 (Slovakia) stations, and mean monthly runoff and annual maximum floods at 258 (Austria) and 85 (Slovakia) gauging stations. The results suggest that the seasonality of the selected hydrological characteristics is an important indicator of flood processes, but varies considerably in space. The seasonality of extreme flood events and, hence flood processes, tends to change with the flood magnitude. This change is more pronounced in the lowland and hilly regions than it is in the mountains. Both in Austria and Slovakia, decades of flood seasonality exist. Key words seasonality; annual maximum flood; precipitation; runoff; Austria; Slovakia
Analyse comparative de la saisonnalité de caractéristiques hydrologiques en Slovaquie et en Autriche Résumé L’objectif principal de cette étude est de comparer la saisonnalité de caractéristiques sélectionnées des précipitations et de l’écoulement en Autriche et en Slovaquie. Des indices de saisonnalité mensuelle sont analysés pour interpréter le comportement climatique à long terme, tandis que la saisonnalité des extrêmes est analysée pour comprendre l’occurrence des crues. L’analyse est basée sur des données de précipitation mensuelle moyenne de 555 (Autriche) et 202 (Slovaquie) stations, de précipitation journalière maximum annuelle de 520 (Autriche) et 56 (Slovaquie) stations, et d’écoulement mensuel moyen et de crue maximale annuelle de 258 (Autriche) et 85 (Slovaquie) stations de jaugeage. Les résultats suggèrent que la saisonnalité des caractéristiques hydrologiques sélectionnées est un indicateur important des processus de crue, mais qui varie considérablement dans l’espace. La saisonnalité des événements extrêmes de crue, et par conséquent des processus de crue, tend à changer avec l’intensité de la crue. Ce changement est plus prononcé dans les régions de plaine et de collines que de montagnes. Des décennies de saisonnalité de crue existent en Autriche et en Slovaquie. Mots clefs saisonnalité; crue maximale annuelle; précipitation; écoulement; Autriche; Slovaquie
INTRODUCTION
The seasonality of hydrological characteristics is one of the key factors controlling the develop-ment and stability of natural ecosystems. From a hydrological perspective, seasonality analysis of runoff and precipitation is an appealing method for inferring flood generation mechanisms, which, in turn, supports other hydrological applications, such as hydrological regionalisation. Recently, the assessment of hydrological seasonality and regime stability has attracted a renewed interest, especially in connection with water resources management, engineering design and land cover and climate change assessment studies (e.g. Krasovskaia & Gottschalk, 2002; Krasovskaia et al., 2003; Bower et al., 2004; García & Mechoso, 2005). In the past, the seasonality of hydrological characteristics was analysed mainly in the context of comparative hydrology (Falkenmark & Chapman, 1989). The main idea was to study the
Open for discussion until 1 December 2009 Copyright © 2009 IAHS Press
Comparative analysis of the seasonality of hydrological characteristics in Slovakia and Austria
Copyright © 2009 IAHS Press
457
character of hydrological processes and to identify regions with similar hydrological responses. There are numerous studies on the seasonality of the long-term mean monthly runoff regime (e.g. Lvovich, 1938; Pardé, 1947; Gottschalk, 1985; Haines et al., 1988; Arnell et al., 1993; Krasovskaia et al., 1994; Dettinger & Diaz, 2000; Bower et al., 2004; Johnston & Shmagin, 2008). In many studies the hydrological regime is analysed over a single region (e.g. Pfaundler, 2001; Archer, 2003; Birsan et al., 2005; Assani et al., 2006; Molnar & Burlando, 2008; Petrow et al., 2007; Sauquet et al., 2008; Solin, 2008), but only a few studies used large data sets to evaluate the seasonality across the boundaries of administrative units (e.g. Krasovskaia, 1995, 1996; Dettinger & Diaz, 2000; Krasovskaia & Gottschalk, 2002). In Central Europe, Lapin & Pišútová (1998) investigated the impact of atmospheric circula-tion patterns and changes in the cyclonicity and air pressure on the changes in precipitation totals in the context of climate change. Lapin et al. (2001) also analysed seasonal changes in monthly precipitation for future time horizons on the basis of downscaled outputs from GCM scenarios. An alternative strand of research has studied the seasonality of extremes. In Slovakia and Austria, the seasonality analysis was recently applied mainly in connection with the regionalisation of floods (Cunderlik, 1999; Merz et al., 1999; Piock-Ellena et al., 2000; Bača & Bačová, 2007). These studies analysed the seasonality of runoff and precipitation and related it to the main climate-driven flood-producing processes. Merz & Blöschl (2003) identified and analysed different types of causative mechanisms of floods. In their study, the seasonality of maximum annual flood peaks was chosen as one of the flood process indicators describing the timing of floods. They found that the seasonal pattern in the flood occurrence is related to both snow processes and the occurrence of flooding in the summer months. A similar analysis was performed by Kriegerová & Kohnová (2005), who analysed the seasonality of rainfall- and snowmelt-induced floods in 142 small and mid-sized catchments in Slovakia and found that convective storms are the main causal factor of the annual peak discharges. They concluded that the seasonality indices represent an important indicator of flood processes that can be used as a pooling characteristic in regional flood frequency analysis. Gaál (2005) analysed the maximum n-day precipitation totals in Slovakia and applied seasonality indices of mean monthly and extreme precipitation regionalization over Slovakia. Sivapalan et al. (2005) explored the connection between the seasonality of floods and the season-ality of climatic characteristics and catchment soil moisture state using a derived quasi-analytical flood frequency model. The seasonality of low flow discharges was used for regionalisation by Laaha & Blöschl (2006). They classified the regime of 325 catchments in Austria by evaluating seasonality indices and relating them to drought processes such as retention of precipitation as snow in catchments and soil moisture depletion by evapotranspiration. While the above studies provide valuable insight into either mean monthly values or extreme events, hardly any of them have exploited a combination of them. Also, the focus was usually on either maxima or minima and not on both. Most studies analysed a single region, while much is to be learned from a comparison of regions. Hence, the main objective of this study is to compare the seasonality of both precipitation and runoff in Austria and Slovakia within the context of flood process occurrence. The main idea is to understand the differences in the climatic conditions and long-term catchment regimes using mean monthly seasonality indices, and to explore the differences in the flood processes at the short-term event scale. It is anticipated that the combination of both concepts within the framework of comparative hydrology may give an insight into the main flood producing processes in Austria and Slovakia. The two neighbouring countries have many common features with respect to runoff forcing and generation. Similar precipitation regimes exist in both areas formed by western circulation, Mediterranean and continental influences, and these are further differentiated by altitudinal zonality due to the rugged topography (e.g. Lapin & Tomlain, 2001). The geology and morphology of Austria and Slovakia are significant for the extreme runoff heterogeneity. For example, the geomorphological classification of Slovakia by Mazúr et al. (1986) divides the territory of Slovakia into 84 geomorphologic units, with some of the units containing a more detailed subdivision. Despite this heterogeneity the main bedrock formations and soil types are

J. Parajka et al.
Copyright © 2009 IAHS Press
458
)
similar in Austria and Slovakia. These factors make an inter-comparison of the seasonality a meaningful and challenging exercise, with the final aim to shed more light on how its differences and similarities manifest their influence in the regime of mean and extreme runoff. This paper goes beyond the existing literature in that a combined approach is used for the seasonality assessment. This approach combines a number of aspects which have previously been investigated separately. First, the seasonality assessment is based on the evaluation of the maximum, secondary maximum and minimum of mean monthly characteristics with respect to extreme flood and precipitation events. The demonstration of links between monthly and extreme event seasonality indices has advantages over a separate assessment based on either mean monthly or extreme event characteristics. Second, the seasonality analysis is used to contrast the hydro-logical regimes of two neighbouring regions. This study aims to be the first assessment crossing the borders in the Central European region. Third, the seasonality is visualized by maps and along transects to obtain an appreciation of the spatial and temporal variability of precipitation and runoff. The transect plots are an alternative to the assessment of hydrological regime stability based on the entropy evaluation (e.g. Krasovskaia 1995, 1997) or the sensitivity assessment of flow regimes to climate (Bower et al., 2004). The paper is organized as follows. First we describe the methods applied in the seasonality assessment. Next we present hydrological data available for the analysis. The results section compares the seasonality of mean monthly precipitation, runoff, annual maxima of precipitation and runoff and examines their magnitude and spatial variability using different seasonality indices. Finally, we discuss the spatio-temporal variability in the hydrological regimes and present some concluding remarks. METHODS The seasonality of the hydrological characteristics is evaluated by the combination of traditional methods and their modifications. The assessment of the long-term mean monthly precipitation and runoff seasonality is based on the analyses of their maximum, secondary maximum and minimum. In comparison to commonly used maximum evaluation, such modification allows the effects of different circulation weather patterns on the spatial and seasonal characteristics of mean monthly precipitation and runoff to be investigated in more detail. The analysis of mean monthly precipita-tion and runoff maxima and their common evaluation helps to explore the dominant runoff formation factors. The evaluation of the secondary maxima enables one to detect possible bi-modalities in precipitation and runoff distributions and, hence, to shed more light on the influence of seasonal regime on the extreme precipitation and runoff events. The assessment of the mean monthly minimum complements the hydrological regime description and indicates the vulnera-bility of the region to drought and low flows. The mean monthly seasonality measure used in this study is based on how often the month of the maximum (either monthly precipitation or monthly runoff) in each year concurs with the month of the long-term maximum (either long-term mean monthly precipitation or runoff) of the period 1961–2000:
(∑=
==2000
1961max
iimMPS (1)
where M represents the month in which the long-term maximum occurs and mi represents the month in which the maximum occurs in a particular year i of the period 1961–2000. The value of P is unity if M = mi and zero otherwise. In a similar way, the frequencies of S2max and Smin are estimated for the mean monthly secondary maximum (S2max) and minimum (Smin) characteristics. The seasonality is expressed as a vector, where the direction represents the month M (January = east, April = north July = west and October = south) and the length shows the seasonality index of Smax, S2max and Smin, respectively. The seasonality of the extreme events, the maximum annual floods and annual maximum daily precipitation is based on the Burn index (1997), which shows the mean date and variability

Comparative analysis of the seasonality of hydrological characteristics in Slovakia and Austria
Copyright © 2009 IAHS Press
459
of occurrence of the extreme events. The mean date of occurrence (D) represents an average position of particular event occurrences, which are plotted in polar coordinates on a unit circle. The position of the event occurrence on a unit circle is defined by the angle:
Θi = D 2π/365 (2)
where D = 1 was chosen for 1 January and D = 365 for 31 December. The direction Θ of the average vector from the origin represents the mean date of occurrence of extreme events around the year. As defined by Burn (1997), the average position of x and y coordinates of the mean date are obtained from the sample of n extreme events by following relationships:
( ) nxn
ii∑
=
=1
cos Θ (3)
( ) nyn
ii∑
=
=1sin Θ (4)
( xy1tan −=Θ ) (5)
The variability of the date of occurrence about the mean date is characterized by the length parameter r. The parameter r is estimated as (Burn, 1997):
nyxr 22 += (6)
and ranges from r = 0 (uniform distribution around the year) to r = 1 (all extreme events of precipitation or floods occur on the same day) and is estimated by following relation. In order to investigate the change of the seasonality with the magnitude of extreme events, the seasonality index (r and Θ ) was separately estimated from a different number of the largest annual maximum values. In this study, the Burn seasonality index of the largest extreme event (r1, 1Θ , where by definition r1 = 1) was compared to the seasonality of the events calculated from the two (r2, 2Θ ), three (r3, 3Θ ), five (r5, 5Θ ), 10 (r10, 10Θ ), and 40 (r40, 40Θ ) largest precipitation and flood annual maxima records. The change of the seasonality with the magnitude of extreme events was then assessed by comparing the variability (r) and the difference in the mean dates of occurrence. The seasonality assessment includes the visualization of the spatial and temporal variability of investigated hydrological characteristics along a transect (Fig. 1). The transect plot displays the
Fig. 1 Topography of Austria and Slovakia, location of climate stations and catchment boundaries and situation of transect used for the seasonality assessment.

J. Parajka et al.
Copyright © 2009 IAHS Press
460
changes in the precipitation and runoff characteristics observed in different decades of the selected long-term period and shows its spatial variation along a selected profile. Such visualization also enables exploration and comparison of the links between the long-term and event-scale charac-teristics and their relationships to different altitudinal zones. DATA
The seasonality of hydrological characteristics is evaluated for Austria and Slovakia (Fig. 1). Both countries are similar in terms of large topographical variability, which has a strong influence on the seasonality of hydrological and climatic variables. The elevation in Austria ranges from 115 to 3798 m a.s.l., while in Slovakia it varies from 94 to 2655 m a.s.l. The lowland areas belong to the Pannonian Plain situated mainly along the Danube River in the northern part of Austria and south-western part of Slovakia, and in the south-eastern part of Slovakia. The high mountains are the Alps in western and central Austria and the highest range within the Carpathian Mountains, the Tatras, located in the central northern part of Slovakia. Slovakia and Austria are situated in the temperate climate zone at the border between the Atlantic and the continental part of Europe. The mean annual temperature varies from about 10°C in the lowlands to less than –8°C in the Alps and –3°C in the Tatras. The precipitation regime is influenced by different factors; the most dominant ones are the effect of: (a) the Mediterranean area, (b) the western circulation, and (c) the European continent (Lapin & Tomlain, 2001). The mean annual precipitation (MAP) exhibits strong variability. A general slight descent of the MAP from west to east is superimposed on altitudinal zonality due to the topography. The lowest values of MAP occur in the Danube lowland region (about 400 mm), while the largest precipitation totals occur on the highest windward slopes of the Alps (more than 3000 mm) and the Carpathian Mountains (more than 1500 mm). Hydrological data used in this study are from the period 1961–2000. The seasonality of mean monthly precipitation was analysed at 555 climate stations located in Austria and 202 climate stations in Slovakia (Fig. 1). The climate stations are situated at a wide range of elevation zones of the region, but in the mountain regions the stations tend to be located at lower elevations, typically in the valleys. The highest climate station is located at 2290 m a.s.l. (Austria) and 1354 m a.s.l. (Slovakia) which suggests that about 6% of Austria and 2% of Slovakia (regions above that elevation) are not represented by any climate station. Annual maximum daily precipitation was available at 520 and 56 climate stations, respectively. Mean monthly runoff values and maximum annual flood records were available at 258 and 85 gauging stations in Austria and Slovakia, respectively, with catchment area ranging from 10 to 100 000 km2 with a median of 170 km2. The input data were carefully screened for errors and data affected e.g. by anthropogenic activity were removed. The final data set contains at least 34 years of data in the period 1961–2000. RESULTS
Seasonality of mean monthly precipitation The seasonality of mean monthly precipitation is presented in Fig. 2. The maxima of mean monthly precipitation (Fig. 2(a)) generally occur in summer, with the exception of the very south of Austria (southern Carinthia, Region 2 in Fig. 1) where the maximum mean monthly precipitation is in November. In the western and central parts of Slovakia the maximum mean monthly precipitation occurs in June, a July maximum is observed in the eastern parts of Slovakia. In Austria, a July maximum occurs especially in the central Alpine regions, June maxima occur mainly in the eastern part (Burgenland province, Region 4 in Fig. 1) and northern pre-Alpine area. An August maximum is observed mostly in the high Alps of Tirol. The November maximum in southern Austria is observed only at a few climate stations and is caused by weather patterns from the south. The evaluation of Smax frequency indicates that, on average (over 757 climate stations), the mean monthly maxima coincide with the long-term mean in 10 years and in 25% of the climate

Comparative analysis of the seasonality of hydrological characteristics in Slovakia and Austria
Copyright © 2009 IAHS Press
461
0 40y
Jan
Feb
Mar
Apr
May
Jun
Jul
Aug
Sep
Oct
Nov
Dec
Undefined
(a)
(b)
(c)
Fig. 2 Seasonality of long-term mean monthly precipitation (LMP) in Austria and Slovakia, showing the season and frequency of: (a) the maximum (Smax); (b) the secondary maximum (S2max); and (c) the minimum (Smin) LMP in the period 1961–2000.
stations they coincide in more than 12 years of the long-term period 1961–2000. A maximum Smax of 19 years is observed at Krimml station (July maximum) located in the Ober Pinzgau region (Region 1, in Fig. 1). The secondary maximum (Fig. 2(b)) of the long-term mean monthly precipitation is also generally observed in summer, seasonally close to the long-term mean monthly precipitation maximum. An exception is southern Carinthia (Region 2 in Fig. 1) in Austria and the Danube lowland in Slovakia where the moist air coming from the South causes the occurrence of secondary maxima in October and November. The evaluation of the S2max frequency shows weaker seasonality than assessed for the precipitation maxima. On average, the S2max occurs in seven years; at 25% of stations it occurs in more than eight years of the long-term mean period. The maximum frequency of the secondary maximum S2max was observed at the station Innerfragant (a July secondary maximum) located in southern Carinthia, 16 years from the period 1961–2000. The seasonality of the minimum long-term mean monthly precipitation is presented in Fig. 2(c). The spatial patterns of the monthly minimum occurrence indicate that in the majority of climate stations the minimum is observed in a period between January and March. A January minimum dominates in the eastern and central part of Slovakia and in the northeastern and southeastern part of Austria. A February minimum is observed in the northern part of Slovakia and central part of Austria. An exception is a band shaped region at the northern fringe of the central

J. Parajka et al.
Copyright © 2009 IAHS Press
462
J F M A M J J A S O N DMonth
0
100
200
300
400
Num
ber o
f sta
tions
J F M A M J J A S O N DMonth
0
100
200
300
400
Num
ber o
f sta
tions
J F M A M J J A S O N DMonth
0
100
200
300
400
Num
ber o
f sta
tions
Maximum Secondary maximum Minimum
Fig. 3 The distribution of climate stations with similar long-term mean monthly maximum (a), secondary maximum (b) and minimum (c) precipitation seasonality. The frequencies are evaluated separately for climate stations located below or at 900 m a.s.l. (615 climate stations, grey) and above 900 m a.s.l. (142 climate stations, black).
(b) (a) (c)
and eastern Alps, where an autumn (October) minimum occurs. The analysis of the Smin frequency indicates that the precipitation minima are, on average, observed in nine years of the long-term period, 25% climate stations have the long-term minimum in more than 11 years. A maximum Smin frequency of 18 years is observed at the climate station Ebenthal (a January minimum) located in the southern part of Austria. The frequency of climate stations with similar monthly mean precipitation seasonality is presented in Fig. 3. The seasonality of the maximum, secondary maximum and minimum of the long-term mean monthly precipitation, is shown in Fig. 3(a), (b) and (c), respectively. The frequencies are estimated separately for two groups of climate stations, according to their elevation. Figure 3 shows that the stations located at or below 900 m a.s.l. (represented by grey bars) have their maxima mostly in June (318 climate stations), the secondary maxima mostly in July (257 climate stations) and minima in February (325 climate stations). The climate stations located above 900 m a.s.l. (black bars) generally have their maxima in July (100), secondary maxima in August (76 climate stations) and minima in February (85 climate stations). Overall, the seasonality of long-term mean monthly precipitation over both countries exhibits a clear pattern characterized by the occurrence of maxima and secondary maxima in summer and a typical winter minimum. An exception is southern Carinthia (Region 2 in Fig. 1) and the southern part of the Danube lowland in Slovakia, where the characteristic weather patterns from the south cause autumn maxima and secondary maxima, respectively. Seasonality of mean monthly runoff The seasonality of mean monthly runoff is presented in Fig. 4. Figure 4(a) shows the seasonality of the maximum long-term mean monthly runoff. The spatial variability in runoff seasonality shows a more heterogeneous pattern than that of precipitation, which is a consequence of the diversity in runoff generation processes. In the high Alpine catchments, maxima in runoff tend to occur in July, while in the lower Alpine catchments they tend to occur in May or June. In Slovakia, a snowmelt-induced maximum in May is observed only in the highest catchments in the High Tatras Mountains (Region 5 in Fig. 1). In other mountain regions, snowmelt runoff dominates, but the season with maximum mean monthly runoff is shifted to April and May. Catchments with mean elevations below 600 m a.s.l., located mostly in the hilly regions of the Carpathian Mountain range, show typical runoff maxima in March. In the lowland areas, no distinct maximum can be found. In both countries the maxima are mostly in March and April, which partly reflects the aggregation of discharge from hilly landscapes of the top parts of these catchments. Analysis of the Smax frequency of mean monthly runoff shows that in the lowland catchments the mean monthly runoff coincides only in ten years with long-term mean monthly maxima. This is likely the result of the diversity of runoff generation processes and/or the inter-annual variability in

Comparative analysis of the seasonality of hydrological characteristics in Slovakia and Austria
Copyright © 2009 IAHS Press
463
0 40y
Jan
Feb
Mar
Apr
May
Jun
Jul
Aug
Sep
Oct
Nov
Dec
Undefined
(a)
(b)
(c)
Fig. 4 Seasonality of long-term mean monthly runoff (LMR) in Austria and Slovakia, showing the season and frequency of: (a) the maximum (Smax); (b) the secondary maximum (S2max); and (c) the minimum (Smin) LMR in the period 1961–2000.
monthly mean precipitation and evapotranspiration in these regions. In contrast, the Smax frequency evaluated for the Alpine catchments shows, on average, an agreement with the long-term mean in more than 20 years, which indicates strong seasonality of runoff. Clearly, this is related to glacier and snowmelt being important processes in these regions. The seasonality of the secondary runoff maximum is presented in Fig. 4(b). The seasonality of the secondary maxima shows spatial patterns similar to those of the season maxima. If July is a maximum, June tends to be the secondary maximum in the high Alpine catchments. Similarly, the June and May maxima coincide with the July and June secondary maxima, respectively. In Slovakia, the May runoff maxima in the highest catchments are most frequently followed by a June secondary maximum. In the hilly regions most of the catchments have the secondary maxima in March and April, however the seasonality is weaker than for the runoff maxima. The evaluation of S2max shows that the long-term mean secondary maxima occur, on average, in 11 years of the period 1961–2000, the frequency of approximately 20 years is observed in high Alpine catchments. The seasonality of monthly runoff minima (Fig. 4(c)) shows two typical regimes. In the high mountain regions of both countries, winter (January and February) minima occur. This is caused by negative air temperatures and thus freezing and accumulation of precipitation in the form of

J. Parajka et al.
Copyright © 2009 IAHS Press
464
J F M A M J J A S O N DMonth
0
30
60
90
120
150
Num
ber o
f cat
chm
ents
J F M A M J J A S O N DMonth
0
30
60
90
120
150
Num
ber o
f cat
chm
ents
J F M A M J J A S O N DMonth
0
30
60
90
120
150
Num
ber o
f cat
chm
ents
Maximum Secondary maximum Minimum
(b) (a) (c)
Fig. 5 The distribution of catchments with similar long-term mean monthly (a) maximum, (b) second-ary maximum, and (c) minimum runoff seasonality. The frequencies are evaluated separately for catchments with mean elevation at or below (147 catchments, represented by light grey bars) and above 900 m a.s.l. (196 catchments represented by dark grey bars), respectively.
snow in the mountains. The winter minima are also observed in southern Austria, which is likely a consequence of the occurrence of winter precipitation minima. In contrast, in the lowlands and hilly regions, a typical summer-autumn (August, September and October) minimum is observed. This is most likely caused by relatively dry catchment conditions influenced by antecedent soil moisture conditions, excess of evaporation over precipitation and the geological characteristics of the region. The analysis of the Smin frequency of mean monthly runoff exhibits a consistent seasonality of winter minima in the Alpine regions. The February minima occur, on average, in 20 years of the period 1960–2000, at 25% of the gauging stations Smin is more than 26 years. The autumn minima are less typical, the Smin frequency is, on average, nine years of the long-term period. The frequency of catchments with similar monthly runoff seasonality is presented in Fig. 5, which shows a clear effect of altitude on the seasonality of mean monthly runoff. The runoff maxima (Fig. 5(a)) in catchments with mean elevation below 900 m a.s.l. (lowland and hilly regions) occur mainly in March and April; the Alpine catchments (with mean elevation at or above 900 m a.s.l.) are typically characterized by runoff maxima in May and June. The secondary maxima (Fig. 5(b)) occur close to the runoff maxima—in lower catchments mostly in the period March–May, and for Alpine catchments typically from April to August. A distinct February minimum (Fig. 5(c)) in Alpine catchments is in contrast with the summer-autumn minima occurring in lowland and hilly catchments. A comparison with Bower et al. (2004) indicates that the monthly runoff peaks in the UK are typically observed in the period from December to February, while in Slovakia and Austria these are observed from March to July. As would be expected, more similarity is found with the runoff regime classification of Scandinavia and Western Europe (Krasovskaia et al., 1994), where the North-Scandinavian (H1L1) and mountain glacial regime (H1MGL1) types are similar to the dominant snowmelt-induced runoff regime of the high Alpine catchments in this study. The runoff regime of hilly catchments in Slovakia and Austria is similar to the Inland-Baltic (H1L3) regime of Krasovskaia & Gottschalk (1992); however, the mean monthly runoff minima are shifted to September and October. Seasonality of annual maximum daily precipitation The impact of the magnitude of extreme daily precipitation on the seasonality is evaluated in Fig. 6. The top panels show the cumulative distribution functions (cdf) of the variability of the mean date of occurrence of annual maximum daily precipitation rj, evaluated separately for the climate stations located below (left) and above (right) 900 m a.s.l. The bottom panels show the difference in the date of occurrence of the largest extreme event Θ 1 and the mean date of

Comparative analysis of the seasonality of hydrological characteristics in Slovakia and Austria
Copyright © 2009 IAHS Press
465
0 100 200 300 400Stations
-90.0
-60.0
-30.0
0.0
30.0
60.0
90.0
Θj -
Θ1
0.0
0.2
0.4
0.6
0.8
1.0r j
0 40 80 120Stations
j=2j=3j=5j=10j=40
Elevation < 900 m a.s.l. Elevation ≥ 900 m a.s.l.
Fig. 6 Change of the seasonality with the magnitude of annual maximum daily precipitation. See text for explanation. The left and right panels show the cdfs for the climate stations located below and above 900 m a.s.l., respectively.
occurrence, Θ j. The values of rj and Θ j were estimated using different numbers of largest annual maximum values (j = 2, 3, 5, 10 and 40). Figure 6 demonstrates that the seasonality of the largest extreme precipitation events differs significantly from the seasonality assessment based on 40 years of annual maxima records. The main difference is the increase in the variability of the mean date of occurrence (rj) with increased length of records, which is reflected by a decrease in the r index value. This means that extreme rainfall events tend to occur in a single month. The differences between the date of occurrence of the largest event and the mean dates of occurrence estimated from two or more records tend to be similar in both groups of climate stations, which indicates small altitudinal effects on the seasonality of extreme precipitation. The spatial patterns of the maximum daily precipitation seasonality are presented in Fig. 7, which shows the Burn index of annual maxima estimated from the complete data set (Fig. 7(a)), and that from the three largest precipitation maxima (Fig. 7(b)). The Burn index, r40, calculated from all events in the period 1961–2000 exhibits distinct regional patterns. Most striking is a band-shaped region at the northern fringe of the Central Alps showing very little seasonality (r40 < 0.2). This is likely caused by orographic rainfall which may occur throughout the year. The Alps act as a topographic barrier to northwesterly airflows. In the hilly region of south-eastern Austria (Styria,
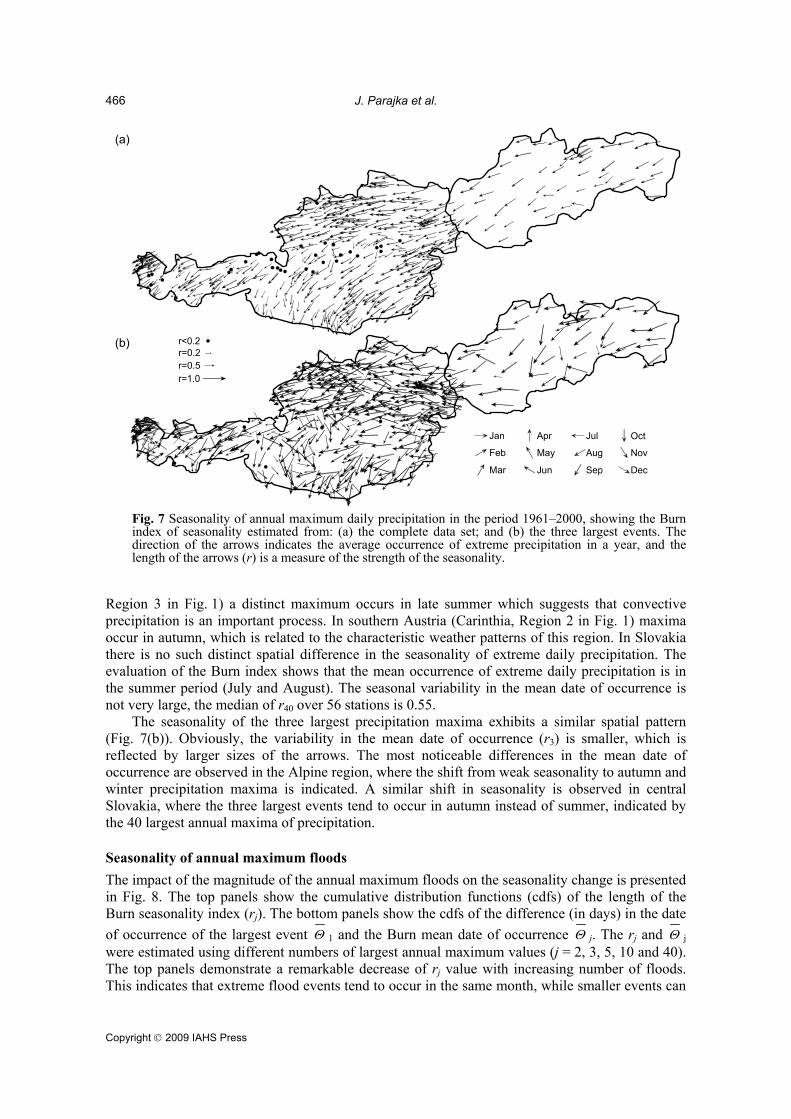
J. Parajka et al.
Copyright © 2009 IAHS Press
466
r=0.2r=0.5r=1.0
Feb
Mar
Apr
May
Jun
Jul
Aug
Sep
Oct
Nov
Dec
Jan
r<0.2
(a)
(b)
Fig. 7 Seasonality of annual maximum daily precipitation in the period 1961–2000, showing the Burn index of seasonality estimated from: (a) the complete data set; and (b) the three largest events. The direction of the arrows indicates the average occurrence of extreme precipitation in a year, and the length of the arrows (r) is a measure of the strength of the seasonality.
Region 3 in Fig. 1) a distinct maximum occurs in late summer which suggests that convective precipitation is an important process. In southern Austria (Carinthia, Region 2 in Fig. 1) maxima occur in autumn, which is related to the characteristic weather patterns of this region. In Slovakia there is no such distinct spatial difference in the seasonality of extreme daily precipitation. The evaluation of the Burn index shows that the mean occurrence of extreme daily precipitation is in the summer period (July and August). The seasonal variability in the mean date of occurrence is not very large, the median of r40 over 56 stations is 0.55. The seasonality of the three largest precipitation maxima exhibits a similar spatial pattern (Fig. 7(b)). Obviously, the variability in the mean date of occurrence (r3) is smaller, which is reflected by larger sizes of the arrows. The most noticeable differences in the mean date of occurrence are observed in the Alpine region, where the shift from weak seasonality to autumn and winter precipitation maxima is indicated. A similar shift in seasonality is observed in central Slovakia, where the three largest events tend to occur in autumn instead of summer, indicated by the 40 largest annual maxima of precipitation. Seasonality of annual maximum floods The impact of the magnitude of the annual maximum floods on the seasonality change is presented in Fig. 8. The top panels show the cumulative distribution functions (cdfs) of the length of the Burn seasonality index (rj). The bottom panels show the cdfs of the difference (in days) in the date of occurrence of the largest event Θ 1 and the Burn mean date of occurrence Θ j. The rj and Θ j were estimated using different numbers of largest annual maximum values (j = 2, 3, 5, 10 and 40). The top panels demonstrate a remarkable decrease of rj value with increasing number of floods. This indicates that extreme flood events tend to occur in the same month, while smaller events can

Comparative analysis of the seasonality of hydrological characteristics in Slovakia and Austria
Copyright © 2009 IAHS Press
467
0 40 80 120Catchments
-90.0
-60.0
-30.0
0.0
30.0
60.0
90.0
Θj -
Θ1
0.0
0.2
0.4
0.6
0.8
1.0r j
0 40 80 120 160Catchments
Mean catchment elevation < 900 m a.s.l. Mean catchment elevation ≥ 900 m a.s.l.
j=2j=3j=5j=10j=40
Fig. 8 Change of the seasonality with the magnitude of annual maximum floods. See text for explanation. The left and right panels show the cdfs for the catchments with mean catchment elevation below and above 900 m a.s.l., respectively.
occur throughout the year. In contrast to the annual precipitation maxima (Fig. 6), the bottom panels show, a more significant shift in the mean date of occurrence in comparison to the occurrence of the largest flood. The most noticeable shift is observed in the case of the 40-year flood record seasonality in the lowland and hilly regions, where a more than two-month shift in the mean date of occurrence is observed in 56% of the catchments. In the Alpine region, the two-month shift is observed in 20% of the catchments. The spatial patterns of the maximum annual floods seasonality are presented in Fig. 9. The top panel shows the seasonality indices estimated from all annual maxima records in the period 1961–2000, the bottom panel exhibits the seasonality of the three largest flood events. It is clear that the maps show more heterogeneous spatial pattern than those of annual maximum daily precipitation which is due to differences in catchment processes. In the high Alpine catchments, floods tend to occur in summer showing a strong seasonality. In this region, the maxima of mean monthly runoff also occur in summer, while annual maximum daily precipitation exhibits very little seasonality. This indicates that glacier melt is an important flood-producing process while convective and synoptic events are less important. The same patterns and conclusions are drawn by Pfaundler (2001) for the high Alpine catchments in Switzerland. The strongest flood seasonality in Slovakia is observed in the highest mountain catchments, with mean catchment elevation above

J. Parajka et al.
Copyright © 2009 IAHS Press
468
Feb
Mar
Apr
May
Jun
Jul
Aug
Sep
Oct
Nov
Dec
Jan
r=0.2r=0.5r=1.0
r<0.2
(a)
(b)
Fig. 9 Seasonality of maximum annual flood peaks in the period 1961–2000, showing the Burn index of seasonality estimated from: (a) the complete data set, and (b) the three largest flood events. The direction of the arrows indicates the average occurrence of extreme annual floods in a year, and the length of the arrows (r) is a measure of the strength of the seasonality.
1500 m a.s.l. In these catchments, the highest floods occur mainly in July. In other mountain catchments in central Slovakia a noticeable shift in seasonality is observed. The seasonality of the 40-year flood records (Fig. 9(a)) shows a mean date of flood occurrence in May and June. However, the seasonality of the largest three flood events (Fig. 9(b)) indicates that the largest floods tend to occur in autumn (September and October), which corresponds well to the seasonality of the three largest precipitation maxima in this region. In Austria, a distinct pattern of flood occurrence in late summer is found in south-eastern Austria (hilly region of Styria). However, mean monthly runoff and extreme precipitation exhibit almost no seasonality and mean monthly precipitation has a weak maximum in early summer (June). This suggests that convective storms are an important flood producing process. A particular flood behaviour can be found in southern Carinthia. While the seasonality of monthly runoff is similar to that of other regions of the same altitude, the seasonality of mean monthly precipitation, annual maximum daily precipitation and annual maximum floods are very different. This suggests that this region is climatologically and hydrologically different from the rest of Austria. Indeed, weather patterns from the south are known to cause floods in this part of Austria in autumn. The region of low altitude catchments of northern Austria has a similar flood seasonality as most of the catchments in western Slovakia. In this region, the mean date of occurrence of the floods varies. The seasonality of all flood records shows the tendency of the occurrence of flood maxima in March and April, while the seasonality of largest floods indicates the maxima in summer (June and July). While the mean monthly runoff data (maxima in spring) do indicate that snowmelt is an important process, there exist other important flood producing processes, e.g. synoptic rainfall. In these catchments, local effects may also be important which confound the interpretation of flood processes.

Comparative analysis of the seasonality of hydrological characteristics in Slovakia and Austria
Copyright © 2009 IAHS Press
469
DISCUSSION ON THE SPATIO-TEMPORAL VARIABILITY OF THE PRECIPITATION AND RUNOFF SEASONALITY
The main objective of this study was to compare the seasonal distribution of runoff and precipitation characteristics and to discuss their links to the main flood producing processes in Austria and Slovakia. We have evaluated the seasonality of mean monthly precipitation and runoff and annual maxima of daily precipitation and floods. We believe that the combined analyses of mean monthly and extreme values shed additional light on the hydrological conditions that goes beyond the separate analysis in studies such as presented by Parde (mean monthly values) and Burn (extremes). A key message from the evaluation in this paper is that the seasonality of selected hydrological characteristics is an important indicator of flood process occurrence, but varies considerably in space. The spatial patterns of the regime indices show that the variability in monthly runoff and flood seasonality shows a more heterogeneous pattern than that of the monthly and extreme daily precipitation, which is a consequence of the diversity in runoff generation processes. In order to supplement the general findings of this study and to discuss in more detail the similarities and differences in seasonality, a detailed plot of two typical regimes is presented in Figs 10 and 11. Figure 10 shows the seasonal distribution of precipitation, runoff and annual
1 3 5 7 9 11Month
1 3 5 7 9 11Month
1 3 5 7 9 11Month
1961
1971
1981
1991
Yea
r
0 100 200 0 40 80 120
1 3 5 7 9 11Month
0 30 60 900 100 200
Precipitation [mm/month]Annual max.flood [m3/s]Runoff [mm/month]
Annual max. dailyprecipitation [mm/day]
Fig. 10 Mean monthly precipitation, runoff, annual maxima of floods and daily precipitation in the period 1961–2000 for a lowland catchment. Runoff observed at Neudorf bei Ilz/Ilzbach (190 km2) catchment and precipitation at Sinabelkirchen (330 m a.s.l.).

J. Parajka et al.
Copyright © 2009 IAHS Press
470
maxima of daily precipitation and floods in a catchment situated in the lowland (Region 3 in Fig. 1). Similarly, Fig. 11 shows a typical regime for a catchment situated in the mountains (Region 5, in Fig. 1). The temporal pattern of mean monthly precipitation indicates that the lowlands tend to have less precipitation in winter and spring (December–April) than the mountains. The monthly runoff seasonality in mountain regions is, as it could be expected, more stable than in the lowlands. Clearly this is because of snowmelt processes which result in spring/summer maxima of runoff in all years and decades. In the lowlands, in contrast, other mechanisms (convective, synoptic) may be equally, or more important and lead to less stable seasonality. The diversity in runoff generation processes is also reflected in a higher variability in the season of flood occurrence in the lowlands, while in the mountains the floods are related mainly to the spring snowmelt period or summer extreme precipitation. The seasonality of extreme precipitation events is generally less stable and the annual maxima may occur from April to November. Interestingly, in the last two decades, the variability of the date of occurrence of annual precipitation maxima tends to increase in the mountain catchment (Fig. 11). The assessment of the variation in seasonality with flood magnitude suggests that there exists a shift in the seasonality with flood magnitude. The detailed evaluation of major flood indicators showed that extreme runoff events tend to occur in a single month, while smaller events can occur
1 3 5 7 9 11Month
1 3 5 7 9 11Month
1 3 5 7 9 11Month
1961
1971
1981
1991
Yea
r
Precipitation [mm/month]Annual max.flood [m3/s]Runoff [mm/month]
0 100 200 0 10 20 30
1 3 5 7 9 11Month
0 30 60 900 100 200
Annual max. dailyprecipitation [mm/day]
Fig. 11 Mean monthly precipitation, runoff, annual maxima of floods and daily precipitation in the period 1961–2000 for an Alpine catchment. Runoff observed at Rackova dolina (35.1 km2) catchment and precipitation at Strbske Pleso (1354 m a.s.l.).

Comparative analysis of the seasonality of hydrological characteristics in Slovakia and Austria
Copyright © 2009 IAHS Press
471
JanFebMar
AprMayJunJulAug
SepOctNovDec
Elevation
1961-2000
1961-19701971-19801981-19901991-2000
0 100 200 300 400 500 600 700Distance [km]
0
1000
2000
3000
Elev
atio
n [m
a.s
.l.]
Max. monthly precipitation
Max. monthly runoff
Annual max. daily precipitation
Annual max. flood
1961-2000
1961-19701971-19801981-19901991-2000
1961-2000
1961-19701971-19801981-19901991-2000
1961-2000
1961-19701971-19801981-19901991-2000
Austria Slovakia Fig. 12 Seasonality of hydrological characteristics along a transect (Fig. 1). The coloured boxes represent the season (month) of the occurrence of mean monthly maxima and annual maxima of precipitation and runoff characteristics in different decades of the period 1961–2000. The bottom panel shows the elevation profile of the transect. Along the transect, the precipitation stations and catchment outlets are within a radius of 10 and 25 km from the profile, respectively.
in different seasons. This is well documented, e.g. in Fig. 11, where a characteristic seasonality of runoff is snowmelt-induced and floods typically occur in May, but the major floods occur in July. When comparing the spatial patterns in hydrological seasonality the question of the seasonality change with time arises. In order to investigate a more general pattern of this spatio-temporal variability, we plotted the seasonal distribution of hydrological characteristics along a transect (Fig. 1). Figure 12 presents a profile showing the spatial and temporal variability in the seasonal maxima of precipitation and runoff in different decades of the 1961–2000 period. Such a plot enables one to evaluate the spatial, altitudinal and temporal variations of mean monthly precipitation and runoff and their relation to the seasonality of extreme precipitation and floods. The assessment of the Austrian-Slovak profile demonstrates that decades of seasonality exist. A shift in mean monthly precipitation is observed, e.g. for the climate stations situated between 470 and 670 km of the profile, where a typical maximum in July shifts to May in the 1981–1990 decade, and for stations between 250 and 300 km of the profile, where a July maximum shifts to a December maximum. Another shift is observed between 100 and 300 km, where a July maximum shifts to August in the 1961–1970 decade. Interestingly, the shift in the precipitation seasonality does not affect the seasonality of mean monthly runoff along the profile. The snowmelt-induced

J. Parajka et al.
Copyright © 2009 IAHS Press
472
monthly runoff maxima are relatively stable along the profile over different decades. The noticeable shift is observed only in the 1971–1980 decade, where a May maximum (for catchments between 140 and 200 km of the profile) shifts to August. The shift in the seasonality of extreme precipitation is observed between 200 and 400 km of the profile, where especially in the last two decades a shift from July maxima to different seasons is observed. A shift in the flood seasonality is observed, e.g. in the decades 1971–1980 and 1981–1990, where a January occurrence of floods observed in the hilly region near the Slovak-Austrian border (situated in between 220 and 340 km of the profile) does not correspond to the typical July maxima. An opposite shift is observed for catchments between 450 and 540 km of the profile, where typical snowmelt-induced floods occur in March and during 1971–1980 and 1981–1990 decades the maxima shift to August. The effect of vertical zonality on the seasonality of annual floods demonstrated that in the mountain regions (the Alps and the Tatras in the transect) the seasonality is more similar in different decades than in the hilly regions or the lowlands. This finding indicates that the altitude is one of the key factors that control the temporal stability of flood seasonality in Austria and Slovakia. CONCLUSIONS AND OUTLOOK
The comparative assessment of similarities and differences in hydrological regimes of Austria and Slovakia suggests that the seasonality of the selected hydrological characteristics vary considerably in space and are a reflection of the most important flood producing processes. The common evaluation of mean monthly and extreme seasonality characteristics presented in this study indicates that the seasonality tends to change with the flood magnitude. Extreme flood events tend to occur in a single month for a given catchment, while smaller events can occur in different seasons. The change of seasonality with the flood magnitude is more pronounced in the lowland and hilly regions than it is in the mountains. The stability of the hydrological regime in the mountains has also been documented by the seasonality assessment in different decades. Visualization of the temporal stability along the transect indicates that in the mountain regions (the Alps and the Tatras in the transect) the seasonality is more similar in different decades than in the hilly regions or the lowlands. This finding indicates that the altitude is one of the key factors that control the temporal stability and spatial variability of hydrological regime and flood seasonality in Austria and Slovakia. In order to validate the effects of altitude in other regions and to explore its interplay with the general circulation patterns we plan to direct our next efforts towards the seasonality assessment in the entire Carpathian region. Acknowledgements The authors would like to thank the European Community Sixth Framework Programme (the Project HYDRATE, Contract GOCE 037024), the Austrian Academy of Sciences (APART fellowship), the Austrian Science Foundation (FWF Project no. P18993-N10), and the Slovak VEGA Grant Agency (Project no. 2/0096/08) for financial support. At the same time we would like to acknowledge the Slovak Hydrometeorological Institute (SHMU) and Austrian Hydrographic Service (HZB) for providing hydrological data. REFERENCES Archer, D. (2003) Contrasting hydrological regimes in the upper Indus basin. J. Hydrol. 274, 198–210. Arnell, N. W., Krasovskaia, I. & Gottschalk, L. (1993) River flow regimes in Europe. In: Flow Regimes from International
Experimental and Network Data (FRIEND) (ed. by A. Gustard), vol. 1, 112–121, Institute of Hydrology, Wallingford, UK.
Assani, A. A., Tardif, S. & Lajoie, F. (2006) Statistical analysis of factors affecting the spatial variability of annual minimum flow characteristics in a cold temperate continental region (southern Quebec, Canada). J. Hydrol. 328, 753–763.
Bača, P. & Bačová Mitková, V. (2007) Analysis of seasonal extreme flows using peaks over threshold method. J. Hydrol. Hydromech. 55(1), 16–22.
Birsan, M., Molnar, P., Burlando, P. & Pfaundler, M. (2005) Streamflow trends in Switzerland. J. Hydrol. 314, 312–329.

Comparative analysis of the seasonality of hydrological characteristics in Slovakia and Austria
Copyright © 2009 IAHS Press
473
Bower, D., Hannah, D. M. & McGregor, G. R. (2004) Techniques for assessing the climatic sensitivity of river flow regimes. Hydrol. Processes 18, 2515–2543.
Burn, D. H. (1997) Catchment similarity for regional flood frequency analysis using seasonality measures. J. Hydrol. 202, 212–230.
Čunderlík, J. (1999) Regional estimation of design discharges in Slovakia. PhD Thesis, Slovak Technical University, Bratislava, Slovakia.
Dettinger, M. D. & Diaz, H. F. (2000) Global characteristics of stream flow seasonality and variability. J. Hydromet. 1, 289–310.
Falkenmark, M. & Chapman, T. (1989) Comparative Hydrology: an Ecological Approach to Land and Water Resources. Unesco, Paris, Frence.
Gaál, L. (2005) Introduction of Lapin’s indices into the cluster analysis of maximum k-day precipitation totals in Slovakia. Met. J. 8(2), 85–94.
Garcíja, N. O. & Mechoso, C. R. (2005) Variability in the discharge of South American rivers and in climate. Hydrol Sci. J. 50(3), 459–478.
Gottschalk, L. (1985) Hydrological regionalization of Sweden. Hydrol. Sci. J. 30(1), 65–83. Haines, A. T., Finlayson, B. L. & McMahon, T. A. (1988) A global classification of river regimes. Appl. Geogr. 8, 255–272. Johnston, C. A. & Shmagin, B. A. (2008) Regionalization, seasonality, and trends of streamflow in the US Great Lakes Basin.
J. Hydrol. 362, 69–88. Krasovskaia, I. & Gottschalk, L. (1992) Stability of river flow regimes. Nordic Hydrol. 23, 137–154. Krasovskaia, I., Arnell, N. W. & Gottschalk, L. (1994) Flow regimes in northern and western Europe: development and
application of procedures for classifying flow regimes. In: FRIEND: Flow Regimes from International Experimental and Network Data (ed. by P. Seuna. A. Gustard, N. W. Arnell & G. A. Cole) (Proc. Braunschweig Conf., October 1993), 185–193. IAHS Publ. 221, IAHS Press, Wallingford, UK.
Krasovskaia, I. (1995) Quantification of the stability of river flow regimes. Hydrol. Sci. J. 40(5), 587–598. Krasovskaia, I. (1996) Sensitivity of the stability of river flow regimes to small fluctuations in temperature. Hydrol. Sci. J.
41(2), 251–264. Krasovskaia, I. (1997) Entropy-based grouping of river flow regimes. J. Hydrol. 202, 173–191. Krasovskaia, I. & Gottschalk, L. (2002) River flow regimes in a changing climate. Hydrol. Sci. J. 47(4), 597–609. Kriegerová, I. & Kohnová, S. (2005) Seasonality analysis of flood occurrence in mid-sized catchments in Slovakia. J. Hydrol.
Hydromech. 53(3), 154–163. Laaha, G. & Blöschl, G. (2005) Seasonality indices for regionalizing low flows. Hydrol. Processes 20, 3851–3878. Lapin, M. & Pišútová, Z. (1998) Changes of cyclonicity, air pressure and precipitation totals in the 1901–1995 period. Met. J.
1(1), 15–22. Lapin, M. & Tomlain, J. (2001) Všeobecná a regionálna klimatológia (General and Regional Climatology, in Slovak).
Vydavateľstvo UK, Bratislava, Slovakia. Lapin, M., Damborská, I. & Melo, M. (2001) Downscaling of GCM outputs for precipitation time series in Slovakia. Met. J.
4(3), 29–40. Lvovich, M. I. (1938) Opyt klassifikatsii rek SSSR (Experience from Classification of the USSR's Rivers, in Russian). Trudy
GGI6, Leningrad. Mazúr, E., Lukniš, M., Balatka, B., Loučková, J. & Sládek J. (1986) Geomorfologické členenie SSR a ČSSR. Mapa mierky
1:500 000 (Geomorphological division of Slovakia and Czechoslovakia, in Slovak). Slovenská kartografia, SUGK, Bratislava.
Merz, R., Piock-Ellena, U., Blöschl, G. & Gutknecht, D. (1999) Seasonality of flood processes in Austria. In: Hydrological Extremes: Understanding, Predicting, Mitigating (ed. by L. Gottschalk, J.-C. Olivry, D. Reed & D. Rosbjerg), 273–278. IAHS Publ. 255. IAHS Press, Wallingford, UK.
Merz, R. & Blöschl, G. (2003) A process typology of regional floods. Water Resour. Res. 39(12), 1340, doi:10.1029/2002WR001952.
Molnar, P. & Burlando, P. (2008) Variability in the scale properties of high-resolution precipitation data in the Alpine climate of Switzerland. Water Resour. Res. 44, W10404, doi:10.1029/2007WR006142.
Pardé, M. (1947) Fleuves et rivières (second edn). Colin, Paris, France. Petrow, T., Merz, B., Lindenschmidt, K.-E. & Thieken, A. H. (2007) Aspects of seasonality and flood generating circulation
patterns in a mountainous catchment in south-eastern Germany. Hydrol. Earth System Sci. 11, 1455–1468. Pfaundler, M. (2001) Adapting, Analysing and Evaluating a Flexible Index Flood Regionalization Approach for Heterogeneous
Geographical Environments. Schriftenreihe des Instituts für Hydromechanik und Wasserwirtschaft der ETHZ, Band 8, Zurich, ISBN 3-906445-08-9.
Piock-Ellena, U., Pfaundler, M., Blöschl, G., Burlando, P. & Merz, R. (2000) Saisonalitätsanalyse als Basis für die Regionalisierung von Hochwässern. In: Wasser, Energie, Luft 92(1/2), 13–21, Baden.
Sauquet, E., Gottschalk, L. & Krasovskaia, I. (2008) Estimating mean monthly runoff at ungauged locations: an application to France. Hydrol. Res. 39(5-6), 403–423.
Solin, L. (2008) Analysis of floods occurrence in Slovakia in the period 1996–2006. J. Hydrol. Hydromech. 56(2), 95–115. Sivapalan, M., Blöschl, G., Merz, R. & Gutknecht, D. (2005) Linking flood frequency to long-term water balance:
Incorporating effects of seasonality. Water Resour. Res. 41, W06012, doi:10.1029/2004WR003439. Received 9 July 2008; accepted 2 February 2009