
Exploring Rice Phenotypes Using Gramene A Comparative Mapping Resource GRAMENE.
European Journal of Agriculture and Forestry Research
Vol.4, No.2, pp.9-23, May 2016
___Published by European Centre for Research Training and Development UK (www.eajournals.org)
9 ISSN 2054-6319 (Print), ISSN 2054-6327(online)
COMPARATIVE ANALYSIS OF SYSTEM OF RICE INTENSIFICATION AND
TRADITIONAL SYSTEM OF RICE PRODUCTION IN ABI L.G.A, CROSS RIVER
STATE, NIGERIA
Bassey, Jimmy Ijogu
Department of Agricultural Extension and Rural Sociology, University of Calabar, Nigeria.
ABSTRACT: This study compared the System of Rice Intensification and Traditional System
of Rice Production in Abi L.G.A, Cross River State, Nigeria. The specific objectives included
the description of socio-economic characteristics of rice farmers in Abi L.G.A, determination
of the rate and levels of adoption of SRI, etc. Data were obtained from primary and secondary
sources. Two-stage sampling technique was used in the selection of 100 respondents.
Descriptive statistics, t-test and Likert scale were employed for analysis. The major findings
of the study shows that, majority (78%) were males and 88% of respondents has rice farm sizes
ranging from 1-5ha. The rate of adoption was 50% with 4 levels of adoption of the principles
of SRI. The t-test analysis revealed t-calculated value of 8.40 greater than t-tabulated.
Meaning that adoption of SRI enhanced the income of the adopters. It is recommended that
participation of rice farmers during SRI demonstration be encourage.
KEYWORDS: Production, Income, Adoption.
INTRODUCTION
One important crop that has attained a staple food status in the state and has also become a
major source of calories for the people of Cross River State is rice. Generally, lowland is
cultivated by majority of the farmers in the state in view of its peculiar ecology. However, for
some years now farmers have been operating significantly below capacity, with inefficient
resource use. However, effort is being made by the state to move rice production from
subsistence to commercial level through provision of improved production inputs and
collaboration under the Public Private Partnership (PPP) initiative of the state. Thus, all
government agencies, Community-Based Organizations (CBOs), Non-governmental
Organizations (NGOs) that have rice as their value chain in the state were empowered to
mobilized and trained rice farmers on agronomic practices using System of Rice Intensification
(SRI).This to achieve enhanced rice productivity that could lead Cross River State to self-
sufficiency in rice production. Therefore, the System of Rice Intensification (SRI) was
demonstrated in all part of the state including Abi Local Government Area.
The System of Rice Intensification (SRI) is a way of harmonizing the elements of soil, water,
light and plant to allow the plant to achieve its fullest potential, which is often hidden when
inappropriate techniques are used (Zotoglo, 2011). SRI, as opposed to traditional rice
production, involves alternate wetting and drying (AWD) of rice fields (Kepha, Bancy and
Patrick, 2014). Research and demonstration plots in several tropical countries have shown SRI
techniques as productive resource-saving and environmentally benign when compared to
conventional or traditional rice production (Namara, et al., 2004:Sato and Uphoff, 2007; Sinha
and Talati, 2007). Under the traditional method of rice production water is the most important
component of sustainable rice production. In the traditional method of growing rice, the rice
fields are continuously flooded during vegetative growth of the crop with draining of water
European Journal of Agriculture and Forestry Research
Vol.4, No.2, pp.9-23, May 2016
___Published by European Centre for Research Training and Development UK (www.eajournals.org)
10 ISSN 2054-6319 (Print), ISSN 2054-6327(online)
during grain ripening stage (Uphoff, 2006, Satyanarayana, Thiyagarajan and Uphoff, 2007;
Chapagain and Yamaji, 2010; Kunimitsu, 2006).
SRI differs from TSRP practices by giving the plant all opportunities to achieve its full
production potential. The methodology develops a better root system, a longer amount of
vegetations, and maximum paddy production. It saves time more than 80% in seeds and
fertilizer, uses about 35% water, saves more than 70% in hand wedding and hoeing cost, and
has a much shorter production cycle-two to three weeks. The results are a 35 to 100% increase
in product yield. This improved productivity translates into a more marketable production with
more income for the producer and increased sustainable land use (Zotoglo, 2011; Chapagain,
Riseman and yamaji, 2011; Amod, et al., 2014).
However, SRI and traditional method of rice production are similar in the area land preparation
with require good tilling and mudding. There are six principles guiding SRI, these are:
Seedlings get transplanted at a much younger age
Only single seedling, instead of a handful of seedlings get planted in each hole
Plants are spaced wider apart and in a square pattern
Increased use of organic fertilizer to enhance soil fertility
Intermittent water application to increase wet and dry soil conditions, instead of
continuous flood irrigation.
Rotary weeding to control weeds and promote soil aeration.
All these principles were incorporated in all the demonstration plots in all the three rice
clusters of Abi Local Government Area of Cross River State, Nigeria.
Statement of the Problem
Several efforts were made over the years to increase the production of rice in Nigeria. These
efforts aimed at actualizing the dreams of Nigeria to achieve self-sufficient in rice production.
Currently, the country spends a huge amount of money daily on rice importation. In time past,
many government agencies, community development organization (CBOs), non-governmental
organization, etc. conducted trials and demonstrations in Abi Local Government Area of Cross
River State, Nigeria. These demonstrations aimed at encouraging rice farmers’ adoption of
SRI. However, the rural rice farmers are still faced with low rice yield as well as rural incomes
which are lower than twenty years ago (Cross River State projects/Programmes Monitoring
and Evaluation Unit, 2012).
In Cross River State, for instance some agencies were identified to be involved in rice related
activities in Abi L.G.A including training and demonstration of SRI. These agencies are
Commercial Agriculture Development Project (CADP), Fadama III Project, IFAD/FGN/
Community-based Natural Resource Management Programme (CBNRMP), Sasakawa,
National Food Security Programme (NFSP), Green Earth Implementation Initiatives (GEIDI),
etc. All these intervention from these agencies do no seem to have yielded desirable results as
the rice farmers remain poor with low productivity. This study therefore, attempts to conduct
comparative analysis of System of Rice Intensification (SRI) and Traditional System of Rice
Production (TSRP).
European Journal of Agriculture and Forestry Research
Vol.4, No.2, pp.9-23, May 2016
___Published by European Centre for Research Training and Development UK (www.eajournals.org)
11 ISSN 2054-6319 (Print), ISSN 2054-6327(online)
Objectives of the Study
The main objective of this study is to conduct comparative analysis of System of Rice
Intensification (SRI) and Traditional System of Rice Production (TSRP) in Abi L.G.A of Cross
River State, Nigeria. The specific objectives are to:
(i) describe the socio-economic characteristics of rice farmers in Abi L.G.A
(ii) determine the rate and levels of adoption of System of Rice Intensification
(SRI);
(iii) analyze the differences in incomes of adopters and non-adopters of SRI in the
study area
(iv) identify the problems militating against the adoption of SRI in the study area.
To achieve objective four is hypothesized thus: There is no significant difference between the
incomes of the adopters and non-adopters of SRI.
LITERATURE/THEORETICAL UNDERPINNING
Modern rice farming requires innovation, which systematically adapts scientific knowledge to
rice farming. Innovation is an idea, method, object which is regarded as new by an individual
(Rogers, 1995, Singh and Mishra, 2007; Peter, et al., 2012). According to Rogers (1995)
adoption is a decision to incorporate a new practice into existing practices. It is a mental
process consisting of learning, deciding and acting over a period of time.
A farmer is more inclined to accept (and participate in) a recommended practice if the practice
is profitable, compatible with existing farming system, divisible, simple to use, has relevance
for his labour use, farm inputs, marketing, credit, community values and crop situation (Agwu,
2004; Ekong, 2008). Other factors as mentioned by Bose et al. (2012) include farm size, value
of farm products sold, farming experience, leadership role, empathy and availability of farm
credit.
METHODOLOGY
The study was carried out in Abi Local Government Area of Cross River State, Nigeria. Abi
Local Government Area is located in the Central Senatorial District of the state and is a
riverside local government area with River, Cross River passing through the local government
area. It shares borders with Obubra L.G.A to the North, in the East by Yakurr L.G.A, West by
Ebonyi State and to the South by Biase L.G.A of Cross River State. Communities in Abi L.G.A
are endowed with abundant swamps suitable for swamp rice cultivation. This accounted for
why rice farming is a major livelihood in the area.
The people are engaged in farming, trading, fishing, hunting, post-harvesting processing, etc.
Other crops grown include yams, cassava, vegetables, bush mango (Irvingia spp), etc.
Livestock such as poultry, sheep, goats, etc. are kept in all the community which survive by
scavenging around the homestead and nearby bush. Customary festival pertaining to farming
European Journal of Agriculture and Forestry Research
Vol.4, No.2, pp.9-23, May 2016
___Published by European Centre for Research Training and Development UK (www.eajournals.org)
12 ISSN 2054-6319 (Print), ISSN 2054-6327(online)
activities are observed in most parts of the local government area annually to celebrate the rich
harvest season (Ndifon and Bassey, 2008).
The population of this study was made of 150 rice farmers drawn 50 rice farmers from each of
the three rice clusters in Abi L.G.A. The 150 rice farmers were those trained on System of
Rice Intensification (SRI) and participated at various stages of the demonstration. A two stage
sampling technique was employed for the selection of the sample size of 100 rice farmers
consisting adopters and non-adopters of SRI. In stage one, simple random sampling was
adopted to select 50 adopters and 50 non-adopters from the list of adopters and non-adopters
of SRI compiled by Cross River State Agricultural Development Programme Extension Unit
in 2013. Stage 2, purposive sampling technique was employed to select 10 adopters that
adopted all the six principles and agronomic practices associated with SRI, 15 adopters that
adopted four principles of SRI and associated agronomic practices and 25 adopters that adopted
three principles of SRI and associated agronomic practices.
Data for this study were obtained from two sources, namely primary and secondary sources.
Primary data were obtained through the use of a structured questionnaire which was used as
interview guide. Secondary data were obtained through the use of relevant literature, Journals,
official documents, publications, etc.
Method of Data Analysis
Data relating to socio-economic variables of the farmers, rate of adoption and levels of adoption
of the six principles of SRI were analyzed using frequencies and percentages, while t-test was
employed to analyze the differences in mean income of adopters and non-adopters. Problems
militating against the adoption of SRI were analyzed using Four-point Likert scale with 2.5
mean decision rule.
Rate of adoption was determined by the total number of adopters over the sample size
expressed as a percentage. Thus:
Rate of adoption = Number of adopters x 100%
Sample size.
Level of adoption was measured on the basis of the number of principles of SRI that a particular
farmer adopt out of the six principles of SRI adopted in the study area.
Level of adoption = Number of SRI principles adopted by each rice farmer x 100
Number of SRI Principles adopted in the study area
The model specification for the analysis of the mean income difference is stated below:
t = X1 – X2
S + S
n1 n2
Where
2 2 1 2
European Journal of Agriculture and Forestry Research
Vol.4, No.2, pp.9-23, May 2016
___Published by European Centre for Research Training and Development UK (www.eajournals.org)
13 ISSN 2054-6319 (Print), ISSN 2054-6327(online)
t = T – test statistic = t-calculated
X1 = Mean income of adopters
X2 = Mean income of non-adopters
S = Variance of adopters
S = Variance of non-adopters
n1 = Total number of adopters
n2 = Total number of non-adopters
df = Degree of freedom n1 + n2 – 2
If t-cal is greater than t-tab, we reject the null hypothesis and accept the alternative hypothesis.
The likert formula = X = Σ f
n
Where: X = Critical mean score
f = Total scale score (That is 4, 3, 2 and 1), n = scale points.
The four-point likert scale of strongly agreed, agreed, disagreed and strongly disagreed were
scored as follows: Strongly agreed = 4, Agreed = 3,Disagreed = 2 and strongly disagreed = 1.
RESULTS/FINDINGS
This section focuses the outcomes of the analysis of the objectives formulated for this study.
Socio- economic Characteristics of Respondents.
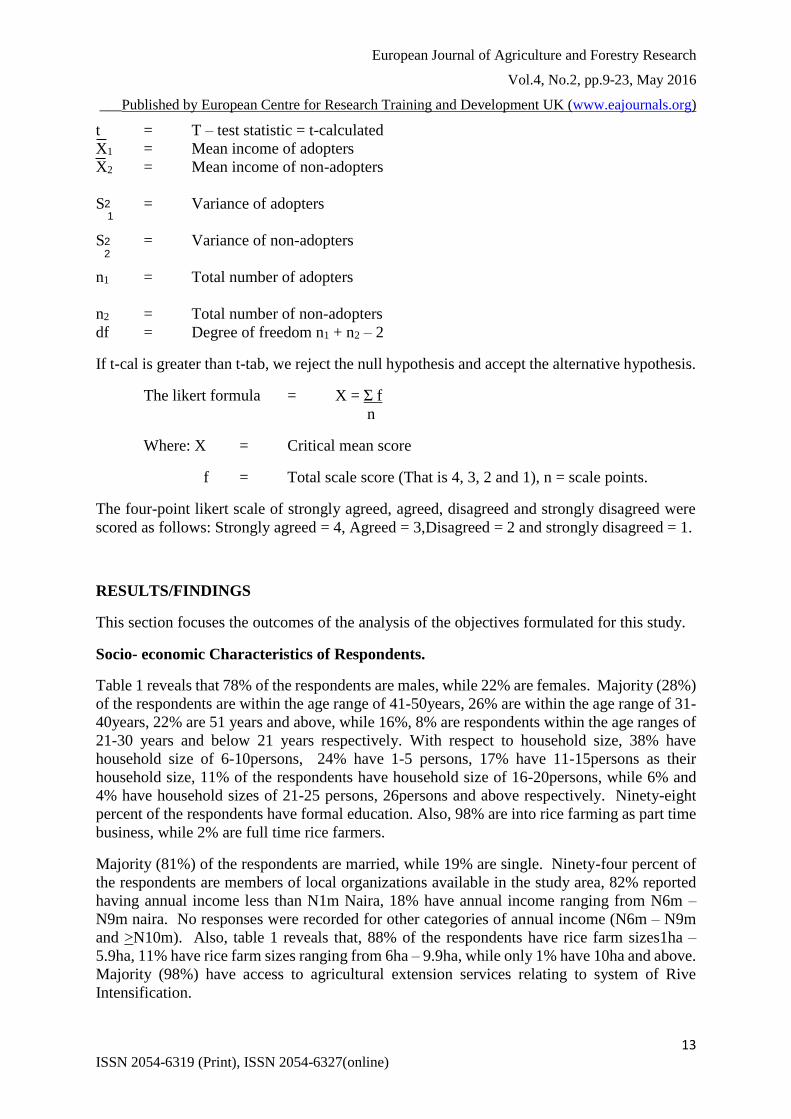
Table 1 reveals that 78% of the respondents are males, while 22% are females. Majority (28%)
of the respondents are within the age range of 41-50years, 26% are within the age range of 31-
40years, 22% are 51 years and above, while 16%, 8% are respondents within the age ranges of
21-30 years and below 21 years respectively. With respect to household size, 38% have
household size of 6-10persons, 24% have 1-5 persons, 17% have 11-15persons as their
household size, 11% of the respondents have household size of 16-20persons, while 6% and
4% have household sizes of 21-25 persons, 26persons and above respectively. Ninety-eight
percent of the respondents have formal education. Also, 98% are into rice farming as part time
business, while 2% are full time rice farmers.
Majority (81%) of the respondents are married, while 19% are single. Ninety-four percent of
the respondents are members of local organizations available in the study area, 82% reported
having annual income less than N1m Naira, 18% have annual income ranging from N6m –
N9m naira. No responses were recorded for other categories of annual income (N6m – N9m
and >N10m). Also, table 1 reveals that, 88% of the respondents have rice farm sizes1ha –
5.9ha, 11% have rice farm sizes ranging from 6ha – 9.9ha, while only 1% have 10ha and above.
Majority (98%) have access to agricultural extension services relating to system of Rive
Intensification.
2 1
2 2
European Journal of Agriculture and Forestry Research
Vol.4, No.2, pp.9-23, May 2016
___Published by European Centre for Research Training and Development UK (www.eajournals.org)
14 ISSN 2054-6319 (Print), ISSN 2054-6327(online)
Table 1: Socio-Economic Characteristics of Respondents
Variable Frequency Percentage (%)
Gender
Male 78 78.00
Female 22 22.00
Total 100 100
Age (Years)
Below 21 8 8.00
21-30 16 16.00
31-40 26 26.00
41-50 28 28.00
51and above 22 22.00
Total 100 100
Household size
1-5 24 24.00
6-10 38 38.00
11-15 17 17.00
16-20 11 11.00
21-15 6 6.00
26 and above 4 4.00
Total 100 100
Level of Education
Informal education 2 2.00
Primary school 39 39.00
Secondary school 41 41.00
Tertiary Institution 18 18.00
Total 100 100
Nature of Rice Farming
Part time 98 98.00
Full time 2 2.00
Total 100 100
Marital Status
Single 19 19.00
Married 81 81.00
Total 100 100
Membership of local organizations
Yes 94 94.00
No 6 6.00
Total 100 100
Annual Income (NM)
<1 82 82.00
1 – 5 18 18.00
6 – 9 0 0.00
>10 0 0.00
Total 100 100
Rice Farm Size (ha)
1 – 5.9 88 88.00
6 – 9.9 11 11.00
10 and above 1 1.00
Total 100 100
Access to Agricultural
Extension Services Relating
to SRI
Have Access 98 98.00
No Access 2 2.00
Total 100 100
Source: Field Survey, 2014.
Rate and Levels of Adoption of SRI
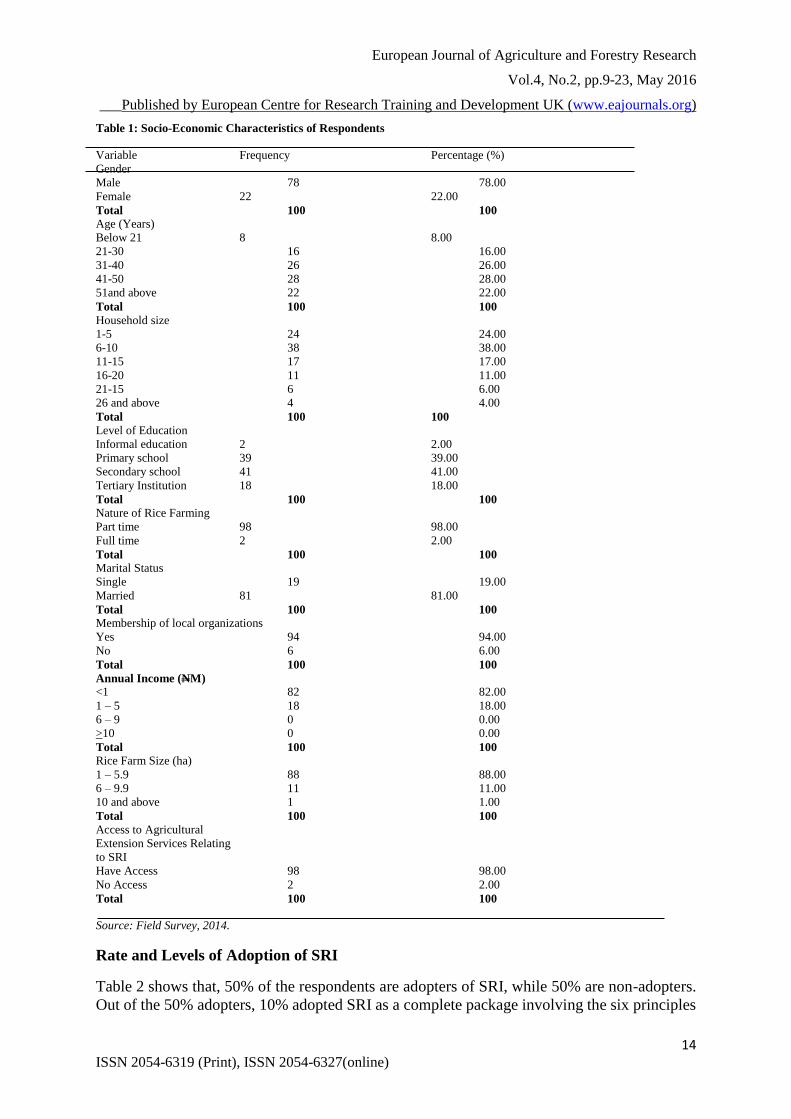
Table 2 shows that, 50% of the respondents are adopters of SRI, while 50% are non-adopters.
Out of the 50% adopters, 10% adopted SRI as a complete package involving the six principles
European Journal of Agriculture and Forestry Research
Vol.4, No.2, pp.9-23, May 2016
___Published by European Centre for Research Training and Development UK (www.eajournals.org)
15 ISSN 2054-6319 (Print), ISSN 2054-6327(online)
of SRI in addition to basic agronomic practices. Also, 15% adopted SRI partially involving 4
principles of SRI and basic agronomic practices, while 25% adopted SRI partially involving 3
principles of SRI. Also, Table 2 reveals that sum of the number of SRI principles adopted by
respondents was 195, while sum of the number of SRI principles adopted in the study area was
300. This mean that, the levels of adoption expressed as a percentage for the six principles of
SRI was 4. This implies that in every sample size of 100 respondents taken from Abi L.G.A,
Cross River State, all things being equal, there is the likelihood tha respondents will adopt 4
out of 6 principles of SRI, since the level for adoption is 4.
Table 2: Rate and Levels of Adoption of SRI
Variable Frequency Percentage (%)
Adoption of SRI
Yes 50 50.00
No 50 50.00
Total 100 100
Levels of Adoption of SRI
Complete Adoption involving
6 principles of SRI 10 20.00
Partial Adoption involving
4 principles of SRI 15 30.00
Partial adoption involving
3 principles of SRI 25 50.00
Total 50 100
Source: Field survey, 2014.
Differences in Income of Adopters and Non-adopters of SRI
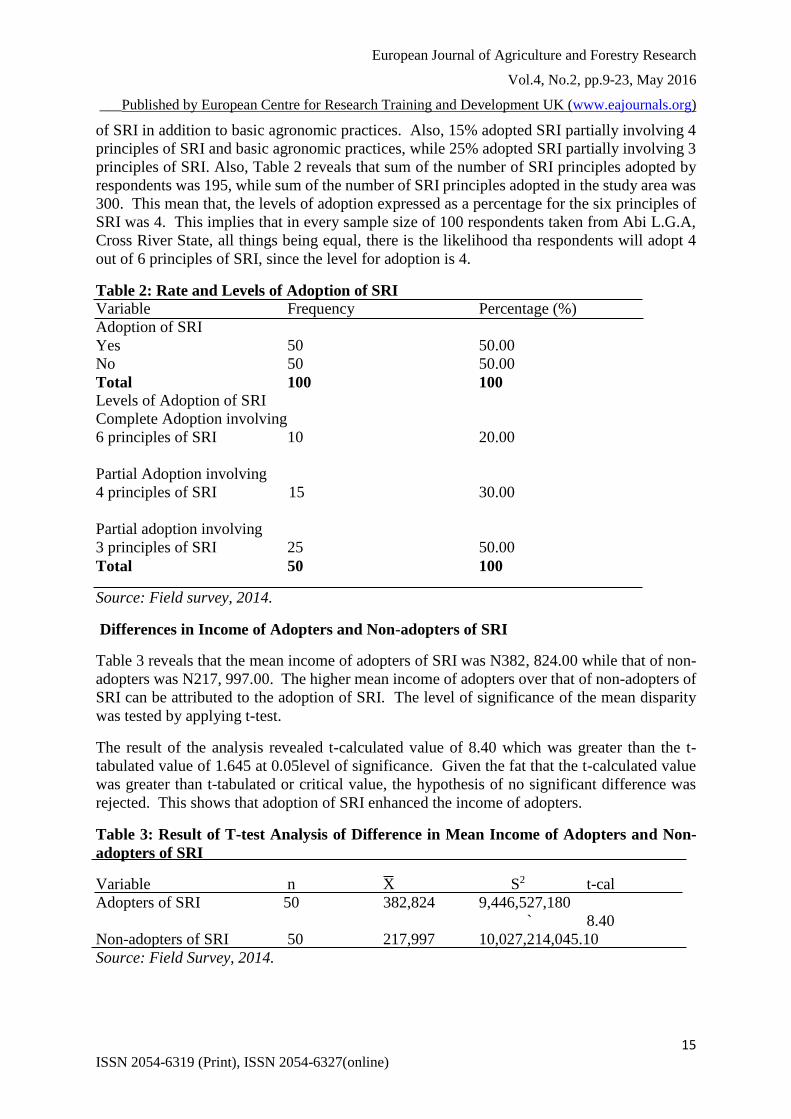
Table 3 reveals that the mean income of adopters of SRI was N382, 824.00 while that of non-
adopters was N217, 997.00. The higher mean income of adopters over that of non-adopters of
SRI can be attributed to the adoption of SRI. The level of significance of the mean disparity
was tested by applying t-test.
The result of the analysis revealed t-calculated value of 8.40 which was greater than the t-
tabulated value of 1.645 at 0.05level of significance. Given the fat that the t-calculated value
was greater than t-tabulated or critical value, the hypothesis of no significant difference was
rejected. This shows that adoption of SRI enhanced the income of adopters.
Table 3: Result of T-test Analysis of Difference in Mean Income of Adopters and Non-
adopters of SRI
Variable n X S2 t-cal
Adopters of SRI 50 382,824 9,446,527,180
` 8.40
Non-adopters of SRI 50 217,997 10,027,214,045.10
Source: Field Survey, 2014.
European Journal of Agriculture and Forestry Research
Vol.4, No.2, pp.9-23, May 2016
___Published by European Centre for Research Training and Development UK (www.eajournals.org)
16 ISSN 2054-6319 (Print), ISSN 2054-6327(online)
Problems Militating Against the Adoption of SRI in the Study Area.
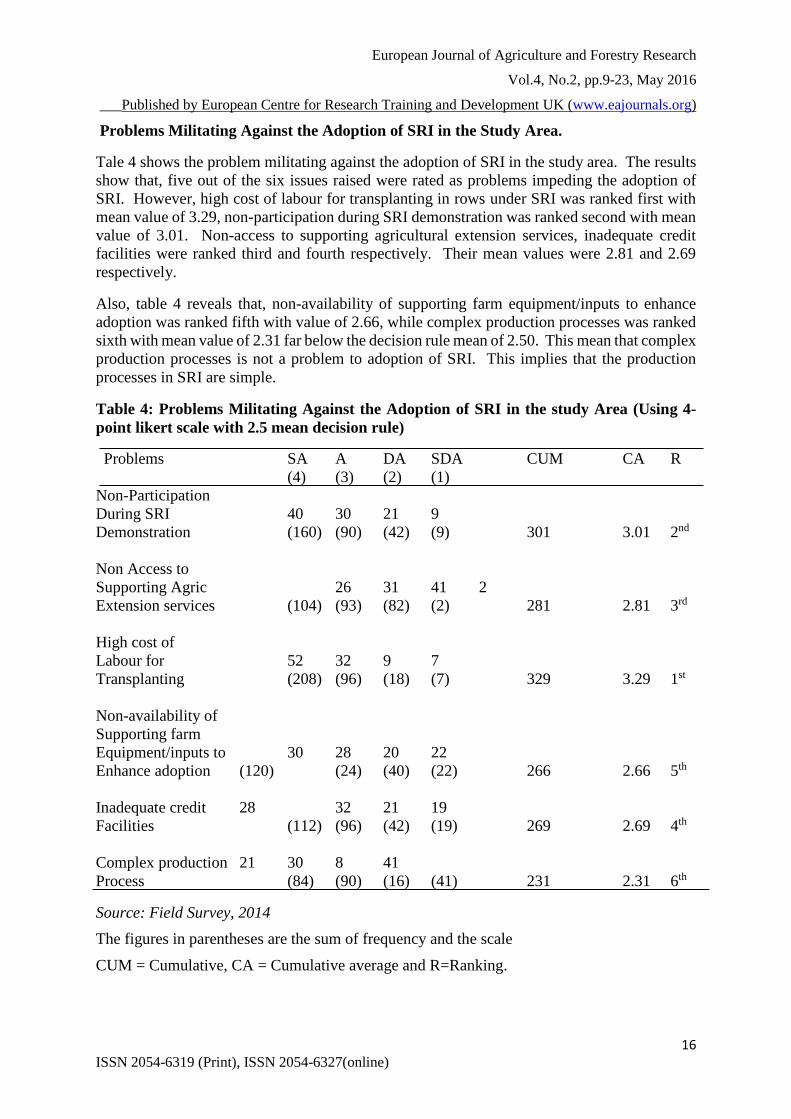
Tale 4 shows the problem militating against the adoption of SRI in the study area. The results
show that, five out of the six issues raised were rated as problems impeding the adoption of
SRI. However, high cost of labour for transplanting in rows under SRI was ranked first with
mean value of 3.29, non-participation during SRI demonstration was ranked second with mean
value of 3.01. Non-access to supporting agricultural extension services, inadequate credit
facilities were ranked third and fourth respectively. Their mean values were 2.81 and 2.69
respectively.
Also, table 4 reveals that, non-availability of supporting farm equipment/inputs to enhance
adoption was ranked fifth with value of 2.66, while complex production processes was ranked
sixth with mean value of 2.31 far below the decision rule mean of 2.50. This mean that complex
production processes is not a problem to adoption of SRI. This implies that the production
processes in SRI are simple.
Table 4: Problems Militating Against the Adoption of SRI in the study Area (Using 4-
point likert scale with 2.5 mean decision rule)
Problems SA A DA SDA CUM CA R
(4) (3) (2) (1)
Non-Participation
During SRI 40 30 21 9
Demonstration (160) (90) (42) (9) 301 3.01 2nd
Non Access to
Supporting Agric 26 31 41 2
Extension services (104) (93) (82) (2) 281 2.81 3rd
High cost of
Labour for 52 32 9 7
Transplanting (208) (96) (18) (7) 329 3.29 1st
Non-availability of
Supporting farm
Equipment/inputs to 30 28 20 22
Enhance adoption (120) (24) (40) (22) 266 2.66 5th
Inadequate credit 28 32 21 19
Facilities (112) (96) (42) (19) 269 2.69 4th
Complex production 21 30 8 41
Process (84) (90) (16) (41) 231 2.31 6th
Source: Field Survey, 2014
The figures in parentheses are the sum of frequency and the scale
CUM = Cumulative, CA = Cumulative average and R=Ranking.
European Journal of Agriculture and Forestry Research
Vol.4, No.2, pp.9-23, May 2016
___Published by European Centre for Research Training and Development UK (www.eajournals.org)
17 ISSN 2054-6319 (Print), ISSN 2054-6327(online)
DISCUSSION
The result of the socio-economic variables indicates that the majority (78%) of the respondents
are males, 22% are females. This implies that men dominate rice production in the study area.
Majority (28%) fell within the age range of 41-50years. This indicates a young population that
guarantees the labour supply for agricultural activities in the study area. With respect to
household size, majority (38%) have household size of 6-10 persons.
The educational status of the respondents revealed that, high percentage of them have formal
education (98%), an observation which tends to disprove the purported rate of illiteracy
common in rural communities in Nigeria (Ijere, 1992). This possible reason for this outcome
is that, Abi L.G.A is a riverside local government area in Cross River State with River, Cross
River passing through the area. The River (Cross River) was the major entry point for the early
Scottish missionaries into the inter land of Cross River State spreading Christianity and western
education and therefore afforded the people of the study area the opportunity for early western
education that is likely handed down to subsequent generations.
This is further explained by the total number of mission schools in the study era. The inference
from this is that, educational attainment is expected to affect positively the productivity of rice
farmers as educated farmers are more likely to adopt modern agricultural practices
(Binswanger, 1989). The nature of rice farming was confirmed by majority (98%) to be on
part-time basis. This is because rice farming in the study area is dominated by small and
medium scale rice farmers that their farming activities cut across different crops in the area.
Married heads accounted for 81%. Majority (94%) of the respondents are members of local
organizations found in the study area. This stresses the importance of local organizations in
the rural Nigeria setting as a major platform for social mobilization, enforcing discipline,
community work, rural development, etc. (Ebong, 2006). Results of the study revealed that,
82% of the respondents earn less than 1 million Naira, 18% earn 1-5million Naira. Eighty-
eight percent of the respondents have rice farm sizes ranging 1-5.9ha, while 11% have rice
farm sizes between 6-9.9ha. With respect to access to agricultural extension services relating
to SRI, 98% have access, while 2% do not have access. Access to extension services is known
to influence adoption of modern farm technologies (Bose, et al., 2012).
The adoption rate of SRI in the study area was 50% with 4 levels of adoption, meaning that, in
every sample size of 100 respondents taken from Abi L.G.A, Cross River State, all things being
equal there is the likelihood that the respondents will adopt 4 out of the 6 principles of SRI,
since the level of adoption is 4. The t-test analysis of the mean income difference revealed t-
calculated value of 8.40 greater than t-tabulated or critical value of 1.645. Meaning that, the
adoption of SRI influenced the yield and income of adopters of SRI. Five out of the six issues
raised on problem that are militating against the adoption of SRI in the study area were scored
above 2.5 mean decision rule on a four-point Likert Scale.
These problems in order of their ranking are, high cost labour for transplanting under SRI,
non-participation during SRI demonstration, non-access to supporting agricultural extension
services, inadequate credit facilities, non-availability of supporting equipment/inputs to
enhance adoption. Complex production processes was rated as not a problem to SRI adoption.
European Journal of Agriculture and Forestry Research
Vol.4, No.2, pp.9-23, May 2016
___Published by European Centre for Research Training and Development UK (www.eajournals.org)
18 ISSN 2054-6319 (Print), ISSN 2054-6327(online)
IMPLICATION TO RESEARCH AND PRACTICE
Apart from adding to existing literature on development of rice value chain in Cross River State
and the country as a whole, this study was motivated by the desire to ascertain the influence of
adoption of SRI in income of adopters by carrying a comparative analysis of System of Rice
Intensification (SRI) and Traditional System of Rice Production (TSRP) in Abi L.G.A, Cross
River State, Nigeria. The results will help agricultural policy makers to determine the most
effective approach for SRI adoption with a view to redirecting and reinforcing training and
demonstration of SRI for optimal adoption. This is necessary as the country move to self-
sufficient in rice production.
CONCLUSION
The assessment of socio-economic characteristics of rice farmers in the study area revealed that
78% were males and 28% were of age range of 41-50 years with 98% having formal education.
This study has also shown that 98% of the respondents were part time rice farmers, while 2%
were full time rice farmers. It also reveals that 81% are married heads, 94% of the respondents
are members of local organizations found in the study area. Also, 82% of the respondents have
<N1million naira annually and majority (88%) of the respondents have rice farm sizes between
1-5.9ha. On access to agricultural extension services relating SRI, 98% have access, while 2%
do not have access to agricultural extension services relating to SRI.
Adoption rate of SRI was 50% with 4 levels of adoption of the six principles of SRI. The t-
calculated value for mean income difference between adopters and non-adopters of SRI was
8.40 greater than t-tabulated value of 1.645. Meaning that SRI adoption enhances the income
of adopters while high cost of labour for transplanting in rows under SRI was ranked first as a
problem militating against the adoption of SRI. This study therefore makes the following
recommendations:
Production cost reducing technologies such as rice seeder, rotary rice weeder, etc.
that can enhance SRI adoption be made available to Rice Farmers.
Participation of rice farmers during SRI demonstration be encourage
Agricultural extension services be step-up on SRI
Credit facilities be made available to rice farmers at a low interest rate, etc.
FUTURE RESEARCH
Several factors in addition to the six issues under this study may be responsible for some rice
farmer not adopting SRI in the study area and therefore need to be further investigated. The
study reveals the dominance of men in rice production than women in the study area, there is
need for further investigation or research. Also, future research may addressed the influence
of socio-economic characteristics on the adoption of SRI
European Journal of Agriculture and Forestry Research
Vol.4, No.2, pp.9-23, May 2016
___Published by European Centre for Research Training and Development UK (www.eajournals.org)
19 ISSN 2054-6319 (Print), ISSN 2054-6327(online)
REFERENCES
Agwu, A. E. (2004). Factors influencing adoption of improved cowpea production technologies
in Nigeria. Journal of International Agricultural and Extension Education. 11(1), 81-
88.
Amod, K. T., Rajeeb, K. M., Dihiraji, U. P. and Ashwani, K. (2014). Impact of water
management on yield and water productivity with system of rice intensification (SRI)
and conventional transplanting system in rice. Paddy and Water Environment. 12 (4),
413-424.
Binswanger, H. P. (1989). Brazilian Policies that encourage deforestation in the Amazon
environment. Government development working paper 16. The World Bank,
Washington, D.C, pp. 342-461.
Bose, A. A., Abdu, Z., S. and Adlu, F.(2012). An assessment of agricultural technology
packages adoption among farmers in Hawal L.G.A. Borno State, Nigeria. Savannah
Journal of Agriculture, 7(1), 93-102.
Chapagain, T. and Yamaji, E. (2010). The Effects of Irrigation method, age of seedling and
spacing on crop performance, productivity and water-wise rice production in Japan.
Paddy Water environment, 8(1), 81-90.
Chapagain, T.; Risema, A. and Yamaji, E. (2011). Assessment of system of rice intensification
(SRI)and conventional practices under organic and inorganic management in Japan.
Rice Science, 18(4), 311-320.
Cross River State Agricultural Development Programme (2013). Field Reports on SRI Cross
River State. Government Press, Calabar, Nigeria, pp. 23-31.
Cross River State Projects/Programmes Monitoring and Evaluation Unit (2012). Cross River
State Projects. Government Press, Calabar, Nigeria, pp.47-56
Ebong, M. O. (2006). Mobilization of Resources for rural development in Nigeria. Ma Bass
Publishers, Calabar, Nigeria, pp.104-128
Ekong, E. E. (2008). An Introduction to rural sociology. Dove Educational Publishers, Uyo,
Nigeria, pp.345-459.Ijere, M. O. (1992). Leading issues in rural development. Acena
Publishers, Enugu, Nigeria, pp.16-26.
Kepha, G. O., Bancy, M. M. and Patrick, G. H. (2014). Determination of the effect of the
system of rice intensification (SRI) on rice Yields and water saving in Mivea irrigation
scheme, Kenya. Journal of Water Resource and protection, 6, 895-901.
Kunimitsu, Y. (2006). Qualification of the economic value of irrigation water for paddy fields.
National Institute for Rural Engineering, Ibaraki, pp. 2-3.
Namara, R. E., Weligamaze, P., Baker, R. (2004). Prospects for adopting system of rice
intensification in Sri. Lanka: A socioeconomic assessment. In Water Management
Research reports. International Water Management Institute, Colombo, pp. 75.
Ndifon, H. M. and Bassey. J. I. (2008). Assessment of te determinants of adoption of bush
mango (Irvingia spp) by rural dwellers in Cross River State. West Africa Journal of
Education Research, 11,23-27.
Peter, H., Cathal, O. D. and Keving, H. (2012). Factors affecting farmers’ adoption of
agricultural innovations: A panel data analysis of the use of artificial insemination
among dairy farmers in Ireland.
Rogers, E. M. (1995). Diffusion of Innovation. The Free Press, New York, pp.208-220.
Sato, S. and Uphoff, N. (2007). A review of on-farm evaluation of system of rice
intensification (SRI) methods in Eastern Indonesia. In CAB Reviews: Perspectives in
Agriculture, Veterinary Science, Nutrition and Natural Resources. Commonwealth
Agricultural Bureau International, Wallingford, pp.117-229.
European Journal of Agriculture and Forestry Research
Vol.4, No.2, pp.9-23, May 2016
___Published by European Centre for Research Training and Development UK (www.eajournals.org)
20 ISSN 2054-6319 (Print), ISSN 2054-6327(online)
Satyanarayana, A., Thiyagarajan, T.M. and Uphoff, N. (2007). Opportunities for water saving
with higher yield from the system of rice intensification. Irrigation Science, 25, 99-115.
Singh, B. B. and Mishra, O. P. (2007). Diffusion and adoption of agricultural innovations.
New York , John Willey and Sons, pp 5-9.
Sinha, S. K. and Talati, J. (2007). Productivity impacts of the system of rice intensification
(SRI): A case study in West Bengal, India. Agric. Water management, 87, 55-60.
Uphoff, N. (2006). The System of rice intensification (SRI) as a methodology for reducing
water requirements in irrigated rice production. CHIFAD, New York, pp.51-68.
Zotoglo, K. (2011). Training manual on system of rice intensification. Integrated Initiatives for
Economic Growth (IICEM), Mali, pp. 3-15.
European Journal of Agriculture and Forestry Research
Vol.4, No.2, pp.9-23, May 2016
___Published by European Centre for Research Training and Development UK (www.eajournals.org)
21 ISSN 2054-6319 (Print), ISSN 2054-6327(online)
APPENDIX
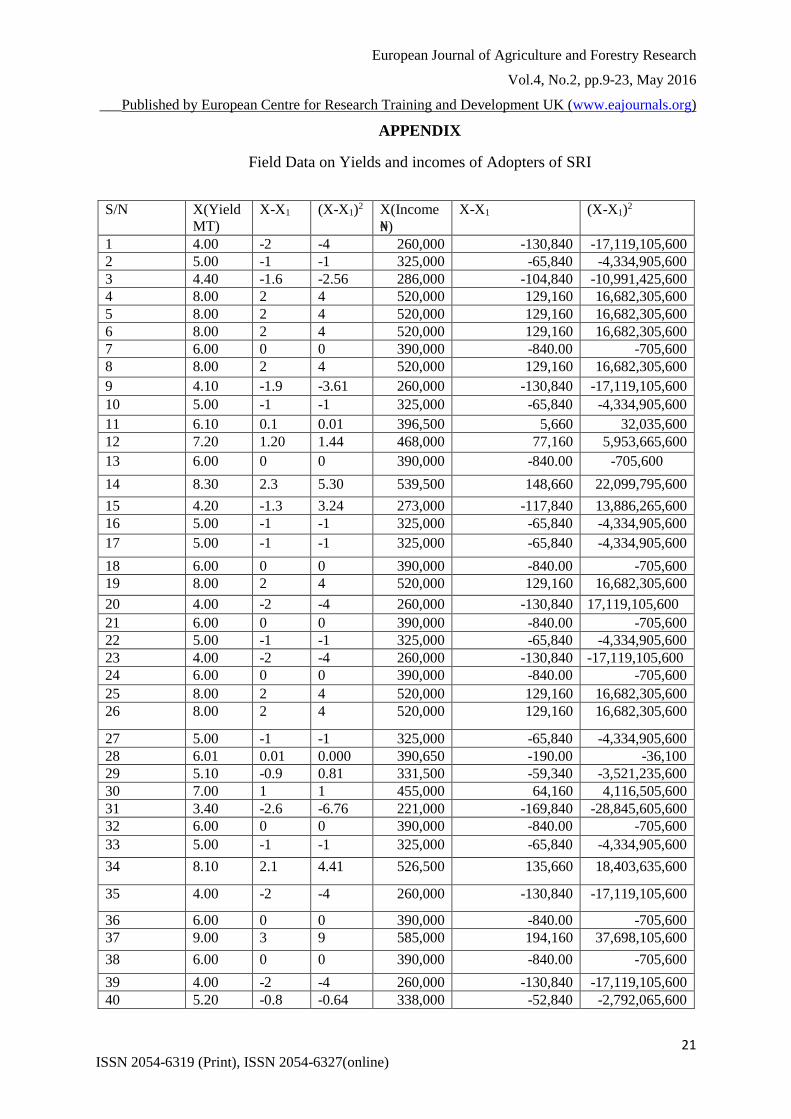
Field Data on Yields and incomes of Adopters of SRI
S/N X(Yield
MT)
X-X1 (X-X1)2 X(Income
₦)
X-X1 (X-X1)2
1 4.00 -2 -4 260,000 -130,840 -17,119,105,600
2 5.00 -1 -1 325,000 -65,840 -4,334,905,600
3 4.40 -1.6 -2.56 286,000 -104,840 -10,991,425,600
4 8.00 2 4 520,000 129,160 16,682,305,600
5 8.00 2 4 520,000 129,160 16,682,305,600
6 8.00 2 4 520,000 129,160 16,682,305,600
7 6.00 0 0 390,000 -840.00 -705,600
8 8.00 2 4 520,000 129,160 16,682,305,600
9 4.10 -1.9 -3.61 260,000 -130,840 -17,119,105,600
10 5.00 -1 -1 325,000 -65,840 -4,334,905,600
11 6.10 0.1 0.01 396,500 5,660 32,035,600
12 7.20 1.20 1.44 468,000 77,160 5,953,665,600
13 6.00 0 0 390,000 -840.00 -705,600
14 8.30 2.3 5.30 539,500 148,660 22,099,795,600
15 4.20 -1.3 3.24 273,000 -117,840 13,886,265,600
16 5.00 -1 -1 325,000 -65,840 -4,334,905,600
17 5.00 -1 -1 325,000 -65,840 -4,334,905,600
18 6.00 0 0 390,000 -840.00 -705,600
19 8.00 2 4 520,000 129,160 16,682,305,600
20 4.00 -2 -4 260,000 -130,840 17,119,105,600
21 6.00 0 0 390,000 -840.00 -705,600
22 5.00 -1 -1 325,000 -65,840 -4,334,905,600
23 4.00 -2 -4 260,000 -130,840 -17,119,105,600
24 6.00 0 0 390,000 -840.00 -705,600
25 8.00 2 4 520,000 129,160 16,682,305,600
26 8.00 2 4 520,000 129,160 16,682,305,600
27 5.00 -1 -1 325,000 -65,840 -4,334,905,600
28 6.01 0.01 0.000 390,650 -190.00 -36,100
29 5.10 -0.9 0.81 331,500 -59,340 -3,521,235,600
30 7.00 1 1 455,000 64,160 4,116,505,600
31 3.40 -2.6 -6.76 221,000 -169,840 -28,845,605,600
32 6.00 0 0 390,000 -840.00 -705,600
33 5.00 -1 -1 325,000 -65,840 -4,334,905,600
34 8.10 2.1 4.41 526,500 135,660 18,403,635,600
35 4.00 -2 -4 260,000 -130,840 -17,119,105,600
36 6.00 0 0 390,000 -840.00 -705,600
37 9.00 3 9 585,000 194,160 37,698,105,600
38 6.00 0 0 390,000 -840.00 -705,600
39 4.00 -2 -4 260,000 -130,840 -17,119,105,600
40 5.20 -0.8 -0.64 338,000 -52,840 -2,792,065,600
European Journal of Agriculture and Forestry Research
Vol.4, No.2, pp.9-23, May 2016
___Published by European Centre for Research Training and Development UK (www.eajournals.org)
22 ISSN 2054-6319 (Print), ISSN 2054-6327(online)
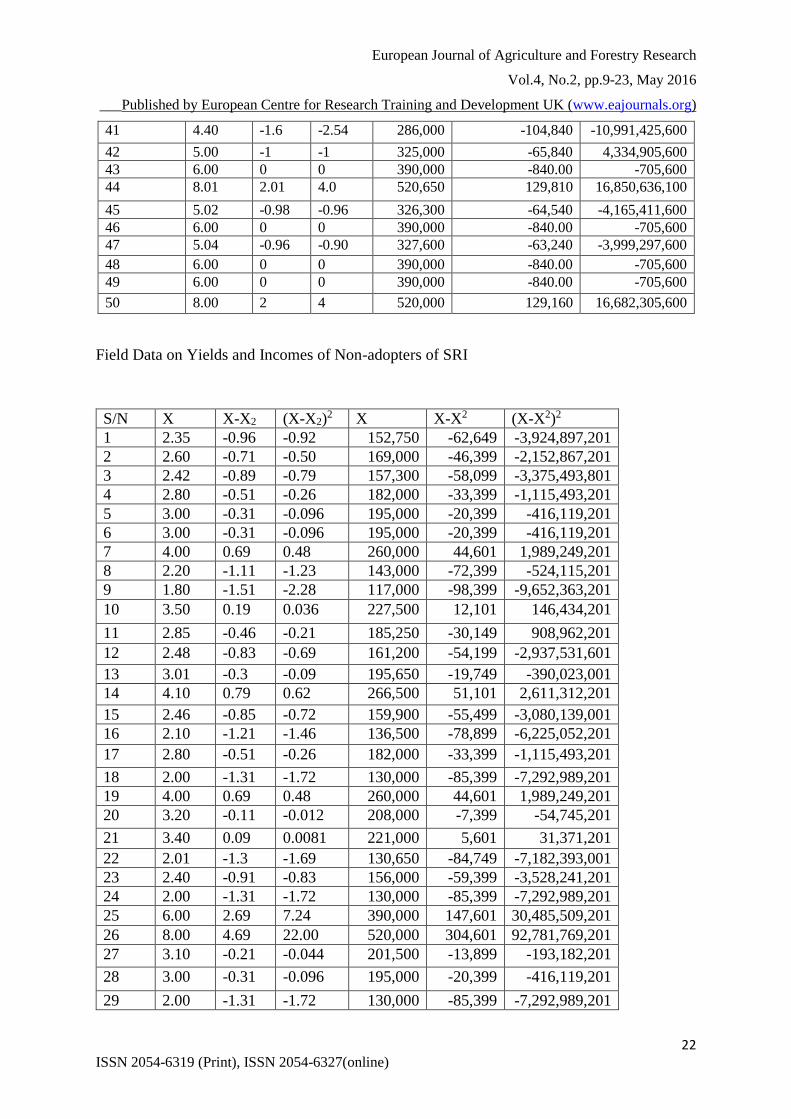
Field Data on Yields and Incomes of Non-adopters of SRI
S/N X X-X2 (X-X2)2 X X-X2 (X-X2)2
1 2.35 -0.96 -0.92 152,750 -62,649 -3,924,897,201
2 2.60 -0.71 -0.50 169,000 -46,399 -2,152,867,201
3 2.42 -0.89 -0.79 157,300 -58,099 -3,375,493,801
4 2.80 -0.51 -0.26 182,000 -33,399 -1,115,493,201
5 3.00 -0.31 -0.096 195,000 -20,399 -416,119,201
6 3.00 -0.31 -0.096 195,000 -20,399 -416,119,201
7 4.00 0.69 0.48 260,000 44,601 1,989,249,201
8 2.20 -1.11 -1.23 143,000 -72,399 -524,115,201
9 1.80 -1.51 -2.28 117,000 -98,399 -9,652,363,201
10 3.50 0.19 0.036 227,500 12,101 146,434,201
11 2.85 -0.46 -0.21 185,250 -30,149 908,962,201
12 2.48 -0.83 -0.69 161,200 -54,199 -2,937,531,601
13 3.01 -0.3 -0.09 195,650 -19,749 -390,023,001
14 4.10 0.79 0.62 266,500 51,101 2,611,312,201
15 2.46 -0.85 -0.72 159,900 -55,499 -3,080,139,001
16 2.10 -1.21 -1.46 136,500 -78,899 -6,225,052,201
17 2.80 -0.51 -0.26 182,000 -33,399 -1,115,493,201
18 2.00 -1.31 -1.72 130,000 -85,399 -7,292,989,201
19 4.00 0.69 0.48 260,000 44,601 1,989,249,201
20 3.20 -0.11 -0.012 208,000 -7,399 -54,745,201
21 3.40 0.09 0.0081 221,000 5,601 31,371,201
22 2.01 -1.3 -1.69 130,650 -84,749 -7,182,393,001
23 2.40 -0.91 -0.83 156,000 -59,399 -3,528,241,201
24 2.00 -1.31 -1.72 130,000 -85,399 -7,292,989,201
25 6.00 2.69 7.24 390,000 147,601 30,485,509,201
26 8.00 4.69 22.00 520,000 304,601 92,781,769,201
27 3.10 -0.21 -0.044 201,500 -13,899 -193,182,201
28 3.00 -0.31 -0.096 195,000 -20,399 -416,119,201
29 2.00 -1.31 -1.72 130,000 -85,399 -7,292,989,201
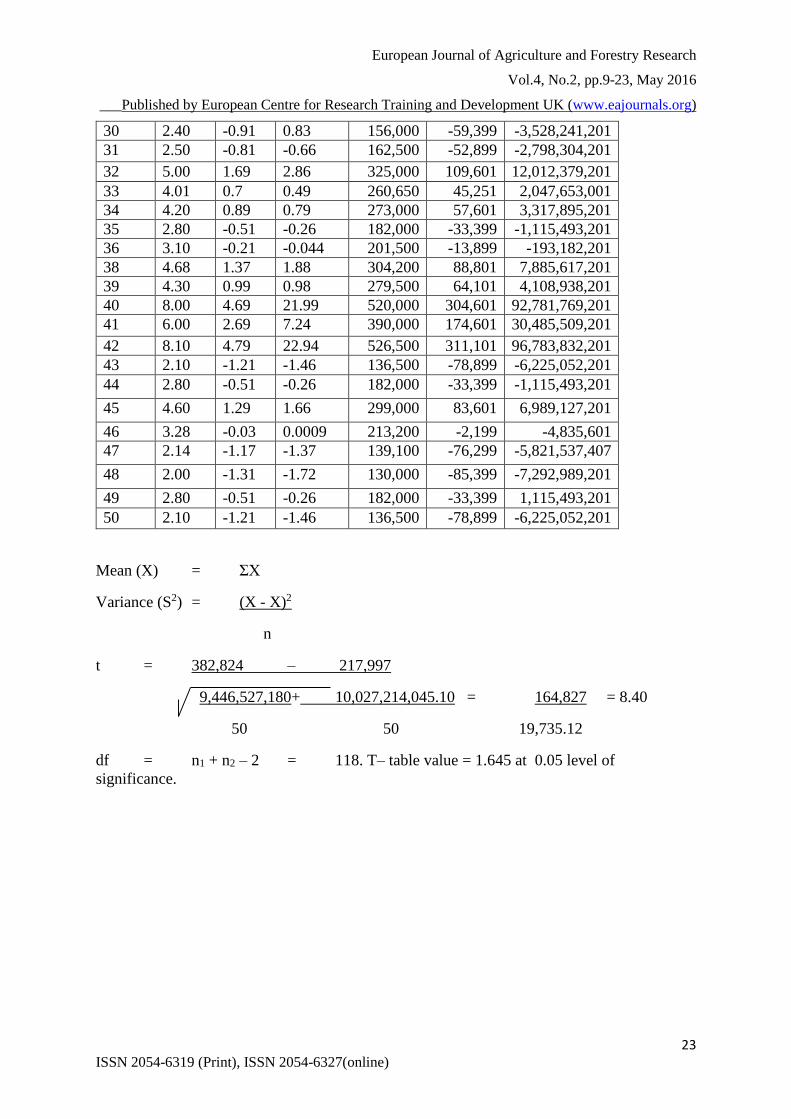
41 4.40 -1.6 -2.54 286,000 -104,840 -10,991,425,600
42 5.00 -1 -1 325,000 -65,840 4,334,905,600
43 6.00 0 0 390,000 -840.00 -705,600
44 8.01 2.01 4.0 520,650 129,810 16,850,636,100
45 5.02 -0.98 -0.96 326,300 -64,540 -4,165,411,600
46 6.00 0 0 390,000 -840.00 -705,600
47 5.04 -0.96 -0.90 327,600 -63,240 -3,999,297,600
48 6.00 0 0 390,000 -840.00 -705,600
49 6.00 0 0 390,000 -840.00 -705,600
50 8.00 2 4 520,000 129,160 16,682,305,600
European Journal of Agriculture and Forestry Research
Vol.4, No.2, pp.9-23, May 2016
___Published by European Centre for Research Training and Development UK (www.eajournals.org)
23 ISSN 2054-6319 (Print), ISSN 2054-6327(online)
30 2.40 -0.91 0.83 156,000 -59,399 -3,528,241,201
31 2.50 -0.81 -0.66 162,500 -52,899 -2,798,304,201
32 5.00 1.69 2.86 325,000 109,601 12,012,379,201
33 4.01 0.7 0.49 260,650 45,251 2,047,653,001
34 4.20 0.89 0.79 273,000 57,601 3,317,895,201
35 2.80 -0.51 -0.26 182,000 -33,399 -1,115,493,201
36 3.10 -0.21 -0.044 201,500 -13,899 -193,182,201
38 4.68 1.37 1.88 304,200 88,801 7,885,617,201
39 4.30 0.99 0.98 279,500 64,101 4,108,938,201
40 8.00 4.69 21.99 520,000 304,601 92,781,769,201
41 6.00 2.69 7.24 390,000 174,601 30,485,509,201
42 8.10 4.79 22.94 526,500 311,101 96,783,832,201
43 2.10 -1.21 -1.46 136,500 -78,899 -6,225,052,201
44 2.80 -0.51 -0.26 182,000 -33,399 -1,115,493,201
45 4.60 1.29 1.66 299,000 83,601 6,989,127,201
46 3.28 -0.03 0.0009 213,200 -2,199 -4,835,601
47 2.14 -1.17 -1.37 139,100 -76,299 -5,821,537,407
48 2.00 -1.31 -1.72 130,000 -85,399 -7,292,989,201
49 2.80 -0.51 -0.26 182,000 -33,399 1,115,493,201
50 2.10 -1.21 -1.46 136,500 -78,899 -6,225,052,201
Mean (X) = ΣX
Variance (S2) = (X - X)2
n
t = 382,824 – 217,997
9,446,527,180+ 10,027,214,045.10 = 164,827 = 8.40
50 50 19,735.12
df = n1 + n2 – 2 = 118. T– table value = 1.645 at 0.05 level of
significance.


![SeedNet India Portal · 11— 35. 36. 37. 38. 39. 41. 42. 43. 45. 47. 3(ii)] (2) Rice Rice Rice Rice Rice Rice Rice Green Gram Red Gram Taramira Täramira Rice Rice Maize](https://static.fdocuments.net/doc/165x107/5f97db6345fe5e455963d66a/seednet-india-portal-11a-35-36-37-38-39-41-42-43-45-47-3ii-2-rice.jpg)


