Comparative Analysis of Spectrum Policy and Mobile Market ...
73
I Comparative Analysis of Spectrum Policy and Mobile Market Structure Thesis submitted in partial fulfillment of requirements for the degree of Master of Science in Technology. Espoo, July 8, 2013 Özkan Demirbilek Supervisor: Heikki Hämmäinen Professor, Networking Business Instructor: Arturo Basaure M.Sc. (Tech)
Transcript of Comparative Analysis of Spectrum Policy and Mobile Market ...
I
Comparative Analysis of Spectrum Policy and Mobile Market Structure
Thesis submitted in partial fulfillment of requirements for the degree of Master of Science in Technology.
Espoo, July 8, 2013
Özkan Demirbilek
Supervisor: Heikki Hämmäinen
Professor, Networking Business
Instructor: Arturo Basaure
M.Sc. (Tech)
II
Aalto University School of Electrical Engineering Abstract of the Master´s Thesis
Author: Özkan Demirbilek
Name of the thesis: Comparative Analysis of Spectrum Policy and Mobile Market Structure
Date: 08. 07. 2013 Language:English
School: School of Electrical Engineering Professorship: Communications Ecosystem
Supervisor: Prof. Heikki Hämmäinen, Aalto University
Instructor: MSc. Arturo Basaure, Aalto University
Differences in the regulatory framework create specific path dependencies in per mobile market.
Correspondingly, there is a need to assess how the mobile markets differ till now as well as the direction of
the market evolution in the future. Therefore the systematic assessment of the mobile markets will present
the insight of the market dynamics along with rising opportunity to make comparison between multiple
mobile markets.
As a part of research methodology, we first perform theoretical review regarding the previous research on
the analysis of mobile market structures. We observe that most of the research focuses on either the
analysis of a single market parameter for multiple mobile markets or comparison of two markets for a set
of parameters in a qualitative or quantitative way. In contrast with above we take a systematic approach
by taking a set of parameters for multiple mobile markets. We complete our analysis by investigating the
market characteristics from spectrum policy and market structure point of view. Based on the evaluation,
we assess the state-of- art outlook of the selected mobile markets: Finland, Chile, Turkey, United Kingdom,
Australia, New Zealand, China, India, United States, Japan and Sweden.
Based on our results, we assess that Herfindahl-Hirschmann Index is the explaining factor for the spectrum
policy. In this regards, India possesses the most decentralized where China has the most centralized mobile
spectrum. Market structure analysis put forward both mobile prices and investments per subscribers as the
explaining factor for the market structure. Based on that, India is the most open mobile market where
Japan has the most closed mobile market structure. European markets; Finland, Sweden and U.K. have
more open market structure than the North American mobile market.
Keywords : Mobile Market Structure, Spectrum Policy, Metric Analysis
III
Acknowledgements
This Master Thesis has been completed for Department of Communications Ecosystem, School of Electrical
Engineering of Aalto University in September 2012-July 2013.
I would like to thank my supervisor, Prof. Heikki Hämmäinen, for providing me the opportunity to on this
thesis and his great effort on creating and coordinating of Communications Ecosystem Master´s Program. I
would like to express my deep gratitude to my instructor Arturo Basaure for teaching, helping, guiding,
motivating, and inspiring me at every stage of my research. This thesis would have not been the same
without his effort.
During my master´s studies, I had amazing time in Finland. For all amazing experiences, I am thankful to my
friends who have impressed me with their generosity in friendship.
My special thanks to my parents, Kiraz and Ahmet Demirbilek, and my sister Özlem Demirbilek Yüksel for
their great support, endless and unconditional love.
Finally, I would like to dedicate this academic study to my dear grandmother, Hatice Akkus, who we has
passed away this year. Her lovely personality and efforts on growing me up made her a great parent and
friend to me.
Helsinki, 07.07.2013
Özkan Demirbilek
IV
Table of Contents
LIST OF FIGURES ………………………………………………………………………………………………………………………………………….vi
LIST OF TABLES………………………………….………………………………….………………………………….…………………………………vii
ABBREVIATIONS………………………………….………………………………….………………………………….………………………………viii
1. INTRODUCTION…………………………………………………….………………………………….………………………………….………..2 1.1. Motivation………………………………….………………………………….………………………………….…………………………..2 1.2. Objective, Scope and Research Questions………………………………….………………………………….……………….2 1.3. Research Methodology………………………………….………………………………….………………………………….………..3 1.4. Structure of the Thesis………………………………….………………………………….………………………………….…………4
2. THEORETICAL FRAMEWORKS………………………………….………………………………….………………………………….………5 3. DESCRIPTION OF CASE MARKETS …………………………………………..………………………………….…………………………..8
3.1. Finland………………………………….………………………………….………………………………….…………………………………8 3.2. Chile………………………………….………………………………….………………………………….…………………………………….9 3.3. Turkey………………………………….………………………………….………………………………….……………………………….10 3.4. United Kingdom………………………………….………………………………….………………………………….…………………11 3.5. Australia………………………………….………………………………….………………………………….…………………………….12 3.6. New Zealand………………………………….………………………………….………………………………….………………………12 3.7. China………………………………….………………………………….………………………………….…………………………………13 3.8. India………………………………….………………………………….………………………………….…………………………………..15 3.9. United States………………………………….………………………………….………………………………….……………………..16 3.10. Japan………………………………….………………………………….………………………………….………………………..17 3.11. Sweden………………………………….………………………………….………………………………….…………………….18 3.12. Summary……………………………………………………………………………………………………………………………..18
4. ANALYSIS OF CASE MARKETS…………………………………….……………….………………………………….…………………….20 4.1. Spectrum Policy Analysis………………………………….………………………………….………………………………….……20
4.1.1. Market share………………………………….………………………………….………………………………….………….....20 4.1.2. Herfindahl-Hirschman Index………………………………….………………………………….………………………...23 4.1.3. Spectrum HHI………………………………….………………………………….………………………………….…………….25 4.1.4. Reselling Rights………………………………….………………………………….…………………………………………….28 4.1.5. Technology Neutrality / Harmonization………………………………….………………………………….…………29 4.1.6. Service Neutrality / Harmonization………………………………….………………………………….………………..32
4.2. Market Structure Analysis………………………………….………………………………….……………………………………..33 4.2.1. Existence of Multinational Mobile Operators………………………………….…………………………………...33 4.2.2. Investments………………………………….………………………………….………………………………………………….33 4.2.3. Mobile Prices………………………………….………………………………….………………………………………………..35 4.2.4. Infrastructure Sharing………………………………….………………………………….……………………………………39 4.2.5. Average Revenue per User………………………………….………………………………….…………………………….40 4.2.6. Prepaid / Postpaid Market Composition………………………………….……………………………………………42 4.2.7. Mobile Number Portability………………………………….………………………………….…………………………….43 4.2.8. Churn Rate………………………………….………………………………….…………………………………………………….44 4.2.9. Industry Bundling /Unbundling………………………………….………………………………….………………………45
5. CONCLUSIONS………………………………….………………………………….………………………………….…………………………..47 5.1. Study Results………………………………….………………………………….………………………………….……………………..47 5.2. Conclusions and Suggestions for Future Research………………………………….…………………………………….52
V
REFERENCES………………………………….………………………………….………………………………….…………………………………….54
APPENDIXES………………………………….………………………………….………………………………….…………………………………….58
VI
LIST OF FIGURES
Figure 1.1. Phase diagram for analysis of country spectrum regulation.
Figure 5.1. Spectrum-HHI versus market-HHI in the studied mobile markets.
Figure 5.2. Prepaid ratio versus monthly churn rate in the studied mobile markets.
Figure 5.3. Prepaid ratio versus mobile ARPU in the studied mobile markets.
Figure 5.4. Mobile ARPU versus investments per subscriber in the studied mobile markets.
Figure 5.5. Phase diagram for mobile telecom regulations.
VII
LIST OF TABLES
Table 1.1. Studied mobile markets in this research based on the their geographical location.
Table 3.1 Spectrum trading in Australia between 1998-2004
Table 3.2 Important characteristics from studied mobile markets
Table 4.1. Mobile Carrier Market Shares Composition for Selected Countries by Number of Subscribers
Table 4.2. Department of Justice / Federal Trade Commission Horizontal Merger Guidelines
Table 4.3 Herfindahl-Hirschman Index Values for Studied Markets
Table 4.4. Spectrum HHI values for Studied Markets
Table 4.5. Reselling Rights in the Studied Countries
Table 4.6. License trading between 1998-2004 in Australia.
Table 4.7. 1G mobile technologies based on geographical area
Table 4.8. Technology Neutrality Parameter in the studied mobile market in respect to regulator and
market practice perspectives
Table 4.9. Existence of multinational mobile operators in studied markets.
Table 4.10. Investment and capacity shortfalls vary by region (calculated as necessary backhaul expenditure minus current planned operator investment):
Table 4.11. The level of mobile investment on mobile networks in the studied markets.
Table 4.12. The investment level per subscriber in the studied markets.
Table 4.13. Mobile Cellular Tariffs in Studied Markets PPP $/min.
Table 4.14. Monthly average revenue per user value in the studied countries.
Table 4.15 Percentage of prepaid subscriptions in the studied countries.
Table 4.16. Monthly churn rate in the studied countries.
Table 4.17. Implementation of Network Operator / Service Operator separation in the studied markets.
Table 4.18. The availability of MVNOs in the studied markets.
VIII
ABBREVIATIONS
2G Second Generation
3G Third Generation
4G Fourth Generation
3GPP Third Generation Partnership Project
ACMA Australian Communications and Media Authority
ARPU Average Revenue per User
CDMA Code Division Multiple Access
EE Everything Everywhere
FCC Federal Communications Commision
FICORA Finnish Communications Regulatory Authority
GSM Global System for Mobile
HHI Herfindahl-Hirschmann Index
ITU International Telecommunication Union
MIIT Ministry of Industry and Information Technology
MVNO Mobile Virtual Network Operator
OFCOM Office of Communications
PTS Swedish Post and Telecom Authority
SUBTEL Subsecretaria de Telecomunicaciones
TD-SCDMA Time Division Synchronous Code Division Multiple Access
TRAI Telecom Regulatory Authority of India
UMTS Universal Mobile Telecommunications System
WCDMA Wideband Code Division Multiple Access

1
2
1. Introduction
This chapter constitutes an introduction to our research work. To begin with, we will present our motivation to involve a research in this particular topic. Then, we will describe our objectives, scope and the research questions. After that, the research methodology that has been utilized in this study will be presented. Lastly, the structure of the thesis will be overviewed. 1.1 Motivation In the last decade, mobile industry has achieved notably a vital share in the economy of the many countries [1]. Accordingly, government bodies have preferred to design tailored mobile industry regulations to sustain the maximum utilization from the mobile industry. Thus, tailored regulation framework and the market response created variant mobile market structures across the countries. Variant mobile market structures are created based on altered power of mobile ecosystem players. In this way, mobile markets may react inconsistently to a certain market parameter. In the literature, there are studies available which analyzes different mobile markets in respect to a certain parameter as well as comparison of two mobile markets for multiple parameters. Watson et. al. has investigated the mobile telecommunications industries in New Zealand and Finland [2]. Also, Basaure et.al. has analyzed mobile market structures in Chile and Finland [3]. Moreover, Sridhar et al. has compared Finnish and Indian market. Analysis on a certain parameter is widely available in the literature such as Ertunc et. al. [4] on mobile coverage and service quality, Kuscu et. al. [5] on regulatory framework regarding mobile network operators and mobile virtual network operators, Karabacak [6] on vertical separation in mobile industry. These studies constitute a great base for understanding inherent mobile market characteristics and market development over time. Mobile markets are very dynamic in respect to dense of high level of technological innovation and rolling-out of new services to satisfy user demand. Radical technological innovations in the mobile industry have resulted the deployment of three different mobile generations (2G, 3G, 4G) in last twenty years. Along with evolving of the technology, mobile operators have provisioned additional services to extract more value from the subscribers. Moreover, regulators enforce the policies which align ecosystem relations. Understanding the relations between market players requires continuous tracing of the market. Collecting both qualitative and quantitative market data give way to understand the situation of a single market. Based on single market reports, analyses of two markets are achievable regarding how much two markets correlates to each other with its dynamics. In this research study, we have focused on put available studies one step forward by enabling comparisons for multiple mobile markets to extract the market situation in a systematic way. 1.2 Objective, Scope and Research Goals
The objective of our research is to develop a study that serves to assess the mobile market structure and spectrum policy along with implementing the study results to the selected mobile markets. This study will provide the opportunity to compare multiple mobile markets simultaneously. As a sub-objective we focus on creating quantitative metrics which demonstrates the present market situation and characteristics of mobile industry in different countries. The quantitative metrics will reflect the results of the market analysis in a straightforward way. Thus, utilizing this study to extract market dynamics for any mobile market will be achievable.
Our work is an effort to extend the span of existing research of Smura et.al. [7] and Basaure et al. (2011). Smura et. al. has introduced basics of phase diagram for mobile telecom regulation. Afterwards, Basaure et al. has developed the phase diagram and utilized it to assess present situation of Chilean and Finnish mobile market as well as analyzing the development of both markets historically. The novelty of our research lies on accomplishing the comparisons between multiple mobile markets via utilizing quantitative metrics. Additionally, our scope enables analysis for broad range of industry characteristics to comprehend
3
the regulatory framework and market dynamics. We evaluate the industry characteristics to provide inputs for deciding economical, technical and regulatory frameworks required to assess the spectrum decentralization and industry openness.
The research on mobile market analysis requires substantial knowledge of mobile operator business as well as possessing deep understanding on individual mobile markets. Furthermore, knowledge on macro-economic situation on the studied markets assists to understand the present situation of the mobile markets in particular.
Having discussed of the objectives and scope of the research we now state the research goals which guide the course of our research study. Following are the research goals which we primarily focus on:
Development of the quantitative metrics which assess spectrum policy and mobile market structure.
Applying the metrics to multiple mobile markets which have been selected to reflect the broad range of mobile market structures.
1.3 Research Methodology
For this research, we have utilized two hand-in-hand sub-projects. In the first one, we have reviewed the analysis by Basaure et al. regarding the spectrum policy and market structure. The study by Basaure et al. has enabled comparisons between Finland and Chile in a qualitative way from the regulatory decisions and evolving market dynamics over time. Our work in this sub-project was assessment of the extending set of parameters in the previous research regarding their suitability to explain dynamics of a set of mobile markets in a straightforward way. In the second sub-project, we have selected mobile markets which we will study in this research. The criterion on selection of the studied mobile markets was reflecting different market structures as much as possible. In this way, the novelty of our research has proved with sustainable data with an adequate representation of the mobile markets.
Based on our previous knowledge on mobile markets, we have determined eleven mobile markets that may
represent variance in mobile market structure in respect to regulatory framework and market dynamics.
Mobile markets we have selected in this research study are listed in Table 1.1 below. With the selection of
these mobile markets except Africa we have covered rest of the continents. Selected mobile markets
comprise both developed and emerging mobile markets.
Location of the Mobile Market (Continent) Mobile Markets
Asia India, China and Japan
Europe Finland, Sweden, United Kingdom and Turkey
North America United States
South America Chile
Oceania Australia and New Zealand
Table 1.1. Studied mobile markets in this research based on the geographical allocation.
As a last step, we have combined the parameters which are analyzed with the corresponding values in the
studied mobile markets. In this way, we have concluded the spectrum policy and mobile market structure
analysis for each studied mobile market. Thus, the studied mobile markets have been assessed
systematically in respect to spectrum decentralization and industry openness.
4
1.4 The Structure of the Thesis
This thesis is structured as followed: In chapter 2 we have presented theoretical background utilized in the
study, in particular phase diagram for mobile telecom regulations and its parameters. This theoretical
review will constitute the core of the study regarding the market analysis. In chapter 3, we have illustrated
state-of-the-art reviews for studied mobile markets. Here, we have introduced characteristics of each
mobile market along with giving insight about the market development and regulatory framework in the
long run. Chapter 4 is dedicated for analyzing the results of the study where we have evaluated the phase
diagram explaining factors along with implementing it to the studied mobile markets. Finally, in chapter 5
we draw results and conclusions by reviewing how effectively we were able to meet the objectives of this
research study, discuss our contributions and suggest directions for future work.
5
2. Theoretical Framework
Until the liberalization trend, telecommunications industry was dominated by state-owned monopolies such as Türk Telekom in Turkey, Telia in Sweden, NTT DoCoMo in Japan. Characteristically, monopolistic market players practice to maximize their profit by deciding the market price even possessing power for price discrimination. Due to being single seller in the market, high barriers were available in the telecommunications industry. In 1990s, during the deployment of 2G networks, countries have open up their mobile markets to create competition between the mobile operators. In this way, oligopolistic market structures have been established. Oligopolistic market structure brings domination of the market by a few number of players. In an oligopoly, each player possesses any power to influence the price. In these markets, the products produced can be homogenous or show any differentiation being that generally, the competition is in the highest level of factors such as quality, customer service, loyalty or image, rather than to the price level. Oligopolistic market structure is observed in the industries where high barriers of entry exist. Thus, oligopolistic markets are common in telecommunications sector because of the high barriers of entry [8].
Telecommunications markets have always been one of the regulated industries by the government authorities via depended or independent institutions. Economides et al. [9] explains the reasons of regulation that the logic of American competition law is the desired outcome of antitrust policy, and competition is the means of achieving it. Antitrust laws are used to guard against the restrictions on competition. Economic regulations are established in the markets where the market forces themselves cannot reach the competitive outcomes. Besides, regulations may provide assistance when economic and social efficiencies diverse. Moreover, regulations on technical standards or market equilibrium provide coordination in the market. In telecommunications industry in particular, the public objectives are important even though these objectives are vague. Some economics claims to increase total surplus, where the others declare interest on promoting innovation and growth. In this way, telecommunications industry creates attractiveness in total economy. Lastly, some regulations may be related to provisioning of basic services to all of the citizens.
Vertical integration happens when the same company operates business in different sections of a production path. Davies et al. [10] has analyzed the telecommunications industry regarding investments and prices in vertically open and closed industry structures. In their analysis, they have defined the aim of regulation as to improve price / service ratio. In these regards, the regulator may unbundle the telecommunications network infrastructure or sharing of telecom´s asset infrastructure. Thus, the regulator facilitates price competition in the market. Thus, the regulator improves the prices of the services relative to the quality. On the other hand, another view is mandating improvement in the quality of the services. The regulator intervenes or creates a market environment to ensure the investments in telecommunications industry. Thus, in this way the prices of the services comparing to the quality may be increased from another point of view. Also, Howell et al. [11] has made investigation on vertical integration in telecommunications based on electricity industry reforms. In their analyses, they have shown that vertical separation experience in electricity sector is an example for possible results for the vertical integration in telecommunications industry. The vertical separation in electricity industry has created benefits on competition meanwhile composing mismatches in investment horizons, entry barriers, risk preference and information asymmetry. The combination of the mismatches lead to thin contract markets, increased hold-up risk, preserve wholesales risk management incentives, and bankruptcies. Thus, the transaction costs becomes available, as the contractual agreements are costly in regards negotiating, creating, monitoring the performance of the other patty and enforcing the contracts along with taking risks due to the acquiring and handling information about the other party. Therefore similar direct parallel outcomes can be seen in telecommunications industry if the vertical separation in retail and infrastructure functions happen. Even the retail MVNOs may use hit-and-run tactic to be in the market for a period of time and then go out of market completely as the investment requirements are very minimum. Thus, the
6
profits earned from the telecommunications industry has not been utilize inside the industry which worsens the price / quality ratio.
The roots of our theoretical framework rely on the studies of Smura et al. During their analysis regarding
the future scenarios for local area access, they have performed scenario analysis which created to basics
of our study. First of all, they have identified industry uncertainities for scenario planning as: industry
structure: vertical or horizontal, competition between technology substitutes: low or increase strongly,
spectrum policy and regulation: harmonized or liberalized, role of unlicensed spectrum: limited or
significant, number of connected devices: grow modestly or explode, role of emerging markets in affecting
technology choices: minimal, significant locally or significant worldwide. Then, they have processed these
uncertainties resulting in matrix analysis. The y-axis of the scenario matrix explains the industry structure in
terms of level of vertical integration in access and content / applications provisioning. The vertical
integration is defined as the provision of network access and content applications by the same company
and sold as packages to the end customers. As a contrast in horizontal market structure, content and
application services have been provided by different players.
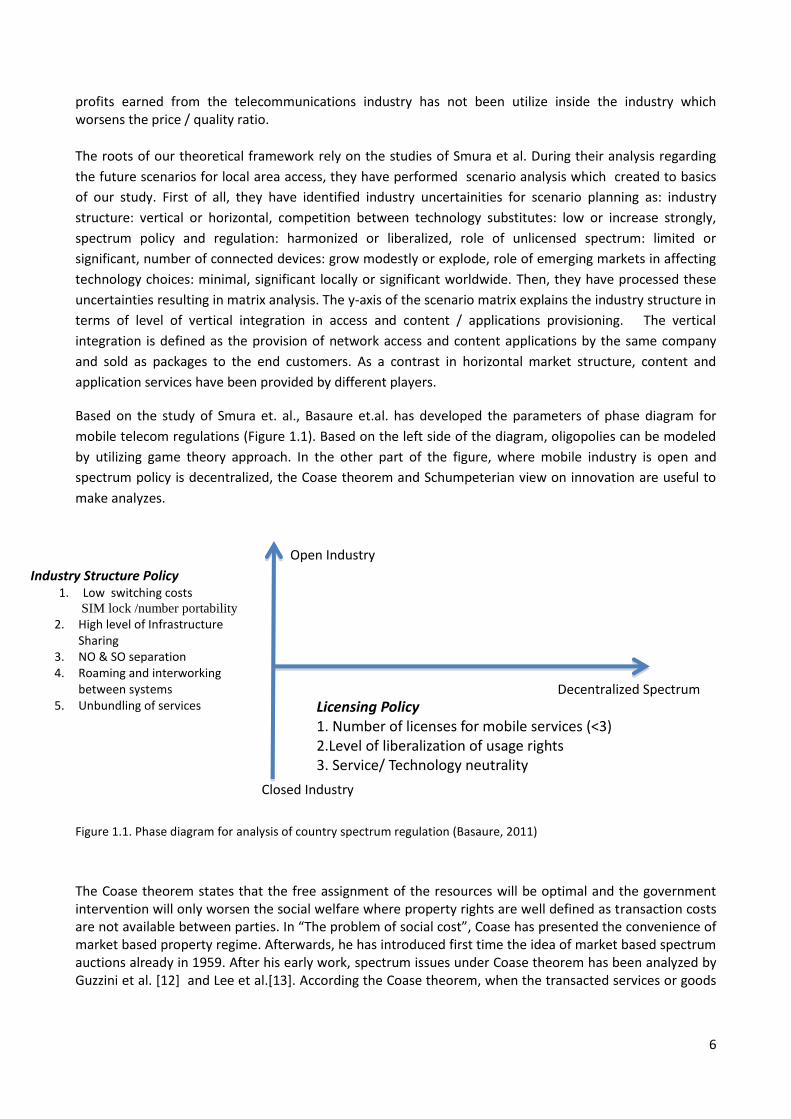
Based on the study of Smura et. al., Basaure et.al. has developed the parameters of phase diagram for
mobile telecom regulations (Figure 1.1). Based on the left side of the diagram, oligopolies can be modeled
by utilizing game theory approach. In the other part of the figure, where mobile industry is open and
spectrum policy is decentralized, the Coase theorem and Schumpeterian view on innovation are useful to
make analyzes.
Figure 1.1. Phase diagram for analysis of country spectrum regulation (Basaure, 2011)
The Coase theorem states that the free assignment of the resources will be optimal and the government intervention will only worsen the social welfare where property rights are well defined as transaction costs are not available between parties. In “The problem of social cost”, Coase has presented the convenience of market based property regime. Afterwards, he has introduced first time the idea of market based spectrum auctions already in 1959. After his early work, spectrum issues under Coase theorem has been analyzed by Guzzini et al. [12] and Lee et al.[13]. According the Coase theorem, when the transacted services or goods
Industry Structure Policy 1. Low switching costs
SIM lock /number portability
2. High level of Infrastructure Sharing
3. NO & SO separation 4. Roaming and interworking
between systems 5. Unbundling of services Licensing Policy
1. Number of licenses for mobile services (<3) 2.Level of liberalization of usage rights
3. Service/ Technology neutrality
Open Industry
Closed Industry
Decentralized Spectrum
7
are diverse, the value of the transaction is increased. Based on that, enabling service-level competition may lead the transaction in the transmission capacity this decreases entry barriers.
In Schumpeterian view, “creative destruction” explains how innovations happen in an industry. Schumpeter has supported that even though bigger companies may have more resources to invest in innovation, the innovation is coming from the smaller companies rather than bigger ones. In this sense, smaller firms do not only benefit the price competition in the market, furthermore they boost the new service innovation [14] [15] [16]. There are plenty of studies available related to parameters located in the phase diagram. Aydin et al. [17] has analyzed the effects switching costs in the mobile telecommunications. Kokko [18] has explained the differences between prepaid and postpaid subscriptions via explaining the characteristics of the user base. Lundborg et. al. [19] has explained the effect of spectrum allocation to the market competition. Owczarczuk [20] has studied churn models in prepaid mobile customers. Similarly to our study, Nakil et al. [21] has tracked the development of OECD mobile markets from 1998 to 2006. In this study, we will process regression analysis between the parameters in the phase diagram to reach the explaining factor for spectrum decentralization and industry openness. In this way, we may find the best quantitative metrics that reflects the insight of the market accordingly. After that we will locate the studied mobile markets to the phase diagram based on selected explaining factors.
8
3. Description of Case Markets
In this section, we have review up-to-date mobile market overview of the studied countries in respect to
regulatory framework and market forces. After reviewing this chapter, you will acquire insight about the
studied mobile markets.
3.1 Finland
As possessing the reputation for accomplishing the first GSM call in the history (1991), Finland possess top
positions in information technology related rankings such as networked readiness (rank #3), internet and
telephony competition (rank #1) and cellular subscriptions w/data (rank #1) [22]. Finnish mobile market
attracts great amount of public attention due to the significant contribution of ICT industry to the national
economy [23]. Nokia, Nokia-Siemens Networks, Tieto and Rovio can be counted among the Finnish
companies which created international recognition and success [24] [25] [26].
Finnish telecommunications industry is regulated by FICORA (Finnish Communication Regulatory Authority)
based on the policy decisions taken by Finnish Ministry of Transport and Communication. Spectrum
allocation policy is categorized in region 1 under ITU recommendations and European Commission decision
for EU countries [27].
Finnish regulator has issued two national GSM licenses through beauty contest in 1990. Following, Radio
Linja (currently named as Elisa) in December 1991, Sonera in June 1992 initiated their mobile operations
[28]. Finally Finnet-owned DNA entered to the mobile business which leaded the end of duopoly period
(2001) along with intensified competition. Finnish regulator put the mobile market competition into priority
by mobile industry liberalization laws (1994), EU-level liberalization standards (1998) and avoiding high
coverage obligations for mobile operators [29]. The high motivation for establishment of a pioneer mobile
market has continued by granting of the first 3G licenses in the world via beauty contest (March 1999). The
licenses were issued three existing players namely; Sonera, Elisa and Finnet as well as the new market
entrant Tele2. Distributed 3G licenses do not comprise any particular requirement for mobile operators
besides permitting the regulator for the market intervention right in case of efficient spectrum usage
violation. In this sense, Tele2´s license have been revoked in June 2005 by the regulator [30]. Thus,
experiment of the new-entrant to the market via 3G licensing has been failed. In 2009, FICORA has
abandoned beauty contest method which is its traditional spectrum granting strategy along with favoring
market-based spectrum assignment methods. Afterwards, the first mobile spectrum auction to grant 2.6
GHz spectrum for 4G services has been organized in November 2009 [31]. The regulator has not sought the
revenue maximization as the goal of the auction instead associating the auction revenue with the
administrative costs. Therefore, the auction has resulted in lower prices comparing the international
equivalents [32]. In addition, auctioned 3G licenses hold service and technology-neutral features along with
reselling rights through the mediation of the regulator to provide the market more power to decide the
best utilization method for the spectrum.
Finnish mobile market performs in highly competitive manner. Unbundling of the industry (1999) resulted
in vertical separation of mobile operators into network operator and service operator. In this way, mobile
virtual network operators (MVNO) obtained the chance to place themselves into the value network (2003).
Coincidence of MVNOs market entrance and the introduction of mobile number portability have affected
the mobile market significantly. One of the successful MVNO in Finnish mobile market was Saunalahti on
account of acquiring 8.5% of the market share in the end of 2004. Establishment of over ten MVNOs,
9
mobile number portability, and disallowance of bundling of mobile devices resulted fierce price
competition and high churn rates in the mobile market. This situation pushed mobile operators to attract
the customers via utilizing costly subscription acquisition methods such as offering up to 500 euros airtime
or unrelated giveaways. Nevertheless, MVNOs have been consolidated with the incumbent operators in
2006 which in the new industry organization MVNOs undertake brand operator responsibilities [33]. In
other words, new industry organization ceased the operations of independent service operators. All these
attempts pushed Finnish mobile prices both voice and broadband to the lowest of the European Union. On
the other hand Finnish mobile market has not shown high development rate in 3G market in mid-2000s. To
accelerate the 3G adoption, regulator has allowed handset and subscription bundling in 2006. Thus, the
regulator moved its attention from price competition to technological innovation. Moreover, Finnish
mobile operators use infrastructure sharing commonly to optimize their financial resources[34].
As of 2013, three mobile operators dominate Finnish mobile market which two of them hold larger market
share (Elisa 39%, TeliaSonera 36%) and one smaller scale (DNA 23%). In regulator side, the spectrum is
currently assigned by auctioning. Latest spectrum auction is planned for the frequency bands which are
freed from analog television broadcasting (2013). In addition to this, regulator has started to spectrum
refarming process by allowing the deployment of UMTS technology in 900 MHz band. Thus, more efficient
use of lower frequencies together with higher frequencies has become possible.
3.2 Chile
Considering the telecom-related rankings, Chilean mobile market certainly can be counted as one of the
developed markets in Americas. Chile has scored 4.3 points in Network Readiness Index which position the
country ranks #39 in overall list along with #2 in upper middle income category, #1 in the Southern
America, #2 in Latin America (Barbados possess the #1 ranking). In addition, Chilean market has obtained
full-score in internet and telephony ranking (#1 ranking). Moreover the country enjoys 100% mobile
coverage as ensuring the mobile service availability for any populated area in the country.
The Chilean Communication Regulatory Authority, Subtel (Subsecretaria de Telecomunicaciones) owns the
responsibility to regulate the Chilean mobile market in respect to the regulation laws initially issued in
1982-1983 and afterwards constantly updated. Chile takes into account ITU´s global direction for region 2.
After the first privatization in Latin America (CTC/Entel), Chilean regulator has granted first 2G licenses in
800 MHz band to CTC and Bellsouth [35]. Chile has adopted beauty-contest method as the only licensing
method so far together with allowing auctions in case of drawing. Also, granted licenses possess
technology-neutral and service-harmonized attributes. By selecting these attributes, regulator has passed
the technology selection process to the market players. Thus, the regulator has decreased its risk for
selecting an inferior technology standard [36]. This decision led the existence of different mobile standards
namely GSM, CDMA, TDMA D-AMPS. After all, the consolidation between mobile operators in 2006
harmonized the technology by selecting GSM and 3GPP framework. In this way, the technology-
harmonization process has been completed by market dynamics instead of centrally taken decisions. In
service-harmonization aspect, the regulator determines the services that can be deployed in certain
frequency bands even though acting liberal in this context by enabling mobile converged services on the
bands which were initially used for long-distance telephony. Moreover, the regulator has issued spectrum
licenses for two new market-entrants which has decreased the market concentration.
10
Chilean mobile market has 24 years of open competition period where at the present time there are five
Chilean mobile operators (three of the mobile operators have the most of the market) as well as two
mobile virtual network operators. Besides, two of the mobile players; Telefónica and Claro (America Móvil)
are multinational cooperations which are operating in Chile. In respect to new entrants and network
updates, the investment that are made by mobile operators to subscriber the amount of subscriber has
reached a high value (49.8 euros) even though the mobile voice tariff PPP dollars/min and mobile ARPU
values are relatively moderate. Also in Chilean market, prepaid subscribers (71%) dominate the mobile
market [37]. To wrap of these parameters; prepaid subscriber ratio, mobile handset unbundling, unified
technology standard are the factors which decrease the switching costs significantly.
3.3 Turkey
Turkey as having the second biggest population in Europe (after Germany) with middle-income level can be
classified as one of the major economies in Europe. Even though the country does not possess advanced
position in telecommunications-related rankings such as Network Readiness Index rank #71, Internet &
Telephony Competition rank #62, Mobile Phone Subscription/100 populations rank #87; Turkey worth to be
studied due to its macro-level economic scale. The country enjoys 5.1% dynamic economic growth rate for
the period between 2003-2012 which exceeds the OECD average 1.7% and the global average 3.5% with a
considerable margin [38]. Turkey´s emerging market and its influence to Europe and Middle East puts its
telecommunications industry as an interesting case to analyze.
Turkish telecommunications industry is regulated by Information and Communication Technologies
Authority (Turkish: Bilgi Teknolojileri ve İletişim Kurumu) that is affiliated to the Ministry of Transport,
Maritime Affairs and Communications [39]. Turkey is subject to ITU regulations for Region 1.
First GSM services in Turkey have been initiated in 1994 under the revenue sharing agreement between
state-owned fixed line monopoly Turkish Telecom and newly established mobile operators: Turkcell and
Telsim. This agreement permitted these two operators to install their own mobile network and rollout their
services under the conditions of the network ownership and 67% of the revenue belongs to Turkish
Telecom [40]. As the conditions of the agreement do not accomplish liberal framework on private
enterprises rights at all, regulator abandoned this scheme by issuing real licenses to these two operators in
1998 to keep tune with the liberalization trend in the world [41]. However, the decisions which are taken
until 1998 have played significant role in the market concentration. Firstly, Turkcell and Vodafone (formerly
Telsim) have larger market penetration than the latecomer operator due to possessing first-mover
advantage. Secondly, the regulator has switched Telsim network off in 1995-1996 for eight months. This
regulatory move created a monopoly in the market and harmed Telsim´s brand value significantly. In the
beginning of 2000s, the regulator has decided to grant three new licenses including one of them for state-
owned Turkish Telecom [42] [43]. The auction design lead one of the license remain unsold due to the high
barriers of entry. As of 2004, the newcomer operators; Aria and Aycell have merged to constitute Avea
[44]. This movement has determined the current players operating in the Turkish market. Turkish regulator
distributed 3G licenses in 2008 via auctioning. In practical terms, the auction resulted with the distribution
of the licenses based on the market power of the mobile operators. The licenses are technology-
harmonized and reselling rights are not determined [45].
11
Turkish mobile market consisted of dominantly from prepaid subscribers (63%, 2011). Also, mobile handset
bundling is not commonly practiced. These two factors are affecting the level of switching costs
significantly. Even though the mobile voice tariff/per minute PPP (0.40 dollars) is higher than United States
or United Kingdom, ARPU level (monthly 12,35 dollars in 2009) is only over India and China among studied
mobile markets in this research.
3.4 United Kingdom
Contrast to continental Europe, British market represents the Anglo-Saxon business approach in Europe.
Combining this fact with dynamic and large market structure, British mobile market becomes an interesting
case to analyze. In international rankings, United Kingdom has scored 5.1 points (rank #15) in Network
Readiness Index. The country has competitive internet telephone market along with high subscription/100
persons ratios (130.6) British mobile market is regulated by Office of Communications or shortly Ofcom.
Ofcom has established in 2002 by the Office of Communications Act. Based on the act, Ofcom possess the
full authority to regulate the broadcasting, telecommunications and postal industries in United Kingdom.
United Kingdom has granted four second-generation licenses to the market. Based on the granting,
Vodafone has started its operations in September 1993. T-Mobile (September 1993), O2 (December 1993),
Orange (April 1994) have entered market with their own network and services. United Kingdom is the first
country that has auctioned the UMTS telecom licenses in the world (March 2000). In the UMTS auctions,
the regulator provided 5 licenses to the market even though there were 13 applications. The regulator has
determined the auction rules carefully to maximize its revenues and utilization of the licenses. To prevent
the secret pacts, each party may buy only one license where the sold licenses cannot be separated. The
offered licenses are not identical: 2 large, 3 small bands have been granted. The license which has the
largest bandwidth is reserved for the newcomer. In this way, the regulator gave incentive to the
newcomers to attract them to the mobile business. The newcomer has advantage by possessing the largest
amount of spectrum (35 MHz) where the existing players may get the licenses which are 30 MHz and 25
MHz. The maximum license fee has been paid by Vodafone (5.9 billion pounds) where total revenue gotten
from the auction has reached over 22 billion pounds. As the licensing auction resulted with extremely
higher prices, the mobile operators placed financially in a hard position. The regulator has put 20%
coverage regulation until 2009 to the mobile operators to provide 3G networks to the population.
Furthermore, mobile operators may provide roaming between 2G and 3G networks. Recently, the regulator
has issued 4G licenses in 2013 meanwhile raising 2.34 billion pounds less than expectations. As an overall,
Ofcom is gradually changing the spectrum management approach by replacing the command-and-control
to market mechanisms to enable trading and liberalization in the bands.
British market has players which have multinational operator expertise along with many MVNOs operating
in the market actively. Currently, Vodafone is the largest mobile network operator in the world by its
multinational business. Moreover, Everything Everywhere brought foreign direct investment to the United
Kingdom. Hence, we may assume that the players in the British mobile market have great managerial
expertise.
12
3.5. Australia
Australian Communications and Media Authority or shortly (ACMA) regulates Australian fixed line and
mobile telecommunications industries. The primary responsibilities of the regulator are management of the
delivery of communications services, enforcement industry and technical standard, monitoring the
performance of the individual service providers along with measuring overall industry performance. Also,
regulator has duties for the consumers such as advising them on their rights and safeguards. Regulator
handles the spectrum assignments based on its own internal policy decisions along with following ITU
Region 3 recommendations.
Australia may be accounted for one of the pioneer to utilize the liberal spectrum assignment policies. In
1990, The Bureau of Transport and Communications Economics has diagnosed the Australian spectrum as
under-utilized in many aspects. Due to this fact, Radio Communications Act has been prepared to reform
the spectrum management in the country. With this act, the radio spectrum management is arranged in
parallel to property rights along with introduction of spectrum pricing. The Radio Communications Act has
put into practice in July 1993. Australian regulator has defined the spectrum bands under four different
categories: Apparatus Licenses, Spectrum Licenses, Class Licenses, Broadcasting and Defense Licenses.
Apparatus Licenses signifies the traditional command-and-control type of licenses. The regulator authorizes
the spectrum holders for the specific type of transmitter/receiver in certain location to provide a
determined service. These licenses are issued for five years along with tradable rights. Secondly, spectrum
licenses are determined neutral in respect to technology and service aspects. Spectrum licenses have
longer licensing period (15 years) comparing to apparatus licenses together with tradable features.
Moreover, these licenses can be leased, combined and broken up if the spectrum holder demands. The
Australian regulator is changing the apparatus licenses to spectrum licenses to liberalize the overall
spectrum management. Class licenses are used in shared basis. Lastly, broadcasting and defense licenses
are treated in a different manner than the rest of the licenses [46] [47].
Based on the Australian policy on the management of the spectrum licenses category, the spectrum is
defined in three dimensional blocks: latitude, meridians and frequency. Hence, spectrum allocation in the
country is completed region by region. Boundary conditions have been determined based on interference
limits. Under the interference limits, spectrum owners are able to deploy any technology regardless of the
type of the device and antenna. The regulator has determined the smallest indivisible spectrum piece as
Standard Trading Unit (STU) which the spectrum may be traded or sub-let based on this unit. Thus, the
players have the chance to separate or aggregate their spectrum holdings. When spectrum holders make a
deal on a spectrum transfer, the regulator does not hold any right to veto the transaction. The regulator
only charges a small administration fee to process the transaction along with holding the up-to-date
database about the list of spectrum licensees.
During our research, we have identified Australia as an interesting case to study especially regarding on its
spectrum licenses approach from the beginning. As we have seen in Table 3.1, Australian mobile market
has already spectrum secondary trading market functioning in some degree.
3.6 New Zealand In New Zealand, the Commerce Commission regulates the telecommunications industry in respect to ITU Region 3 recommendations. The country has been accounted for the pioneer in assessment of mobile spectrum in liberal scheme. In 1989, the country has enabled the sale of spectrum licenses for radio,
13
television and cellular telecommunications under market-mechanisms practices like auctioning. Following this legislation, in 1990 New Zealand has organized the first spectrum auction in the world [48]. The brave move to utilize auctioning for the spectrum assignment cannot be accounted as completely successful. Even tough the regulator has taken advise from a private consultation company (NERA) to determine the auction rules, the method utilized for the auctioning - closed envelope - was not optimal. As the New Zealand has a relatively small telecommunications market, the number of participants to the auction was limited. Due to the limited participation, the auction has resulted with low licensing fees. Thus, if the regulator is seeking to maximize the revenue from the auctioning, this method has not resulted for that aim. Moreover, the lack of minimum price during the auction has resulted the assignment of a certain spectrum band for only 1 New Zealand dollar. As this spectrum auction is an experiment for both New Zealand and the rest of the world, the New Zealander regulator revised its auctioning method for the next spectrum auctions to increase the optimization. The regulator in New Zealand categorizes the spectrum licenses under four types: management rights regime (MRR), radio license regime (RLR), general user licenses (GULs), and other licenses. First of all, the Management Right Regime specifies the spectrum rights under two-tier system. The upper-tier spectrum management rights issues the holder the sole authority to assign the spectrum licenses to others. The Management Rights holder is the decision-maker check the spectrum bands for any technology and service in respect to interference limits. The lower-tier licenses are fully tradable. Secondly in radio license regime covers the licensing of sites and transmitters in both fixed and mobile networks. In this licensing type, the regulator determines the equipment and the method. These licenses are renewed yearly and not tradable. General user licenses are equivalent to class licenses in Australian way of spectrum categorization. These licenses include the license-exempt use of the spectrum. Lastly, the other licenses comprises non-commercial radio licenses and state-owned spectrum licenses. Management Rights regime employed in New Zealand has distinct character in spectrum management method. As the spectrum rights determined under two-tiers system, the upper-tier license holder undertaken various roles. The first role is acting as a spectrum bank by being able to assign the resources it has to the market players. Secondly, the license holder determines the conditions of the usage including technology and service level which are initially under the duties of the regulator. The management rights can be aggregated and sub-divided or even mortgaged in a similar basis with land. However, the regulator does not have to assign the upper-tier rights to the market player in each case. Instead of that, the regulator may chose to keep the upper-tier rights for itself and then issuing only lower-tier rights to the market players. The spectrum licenses are issued in national basis. 3.7 China Ministry of Industry and Information Technology or shortly MIIT has been established in 2008 as a state agency in China to regulate the postal service, broadcasting, telecommunications, production of electronics and communication good. One of the key objectives of the regulator is determined as to promote to knowledge industry. Chinese regulator possesses more exclusive rights on supervising the industry than all the other regulators of this study. In this matter, the regulator has the right to appoint, promote or dismiss key officials of the mobile operators in China. Thus, the management boards of the mobile operators are determined by the direct influence of the regulator. However, any policy of the regulatory body should be supported by SPDC and State Council [49]. First commercial mobile services in China have started in 1987 by China Telecom with the launch of 1G networks. As being the China Telecom was the pure monopoly in the market until 1994, the company has deployed two different 1G mobile standards as TACS as the primary standard and AMPS as the secondary standard. In July 1995, 2G services have been rolled-out the in the country. GSM has dominated to the
14
Chinese market along with limited deployment of CDMA IS-95. In 3G, China has fragmented the technology standard selection with WCDMA, CDMA2000 and homegrown TD-SCMA [50]. In 1990s, Chinese mobile market has grown rapidly as the mobile services have adopted by the large masses. During the 1994-2001, the number of mobile subscribers in China has doubled every year. Breaking of the monopoly has been a positive move for promoting market decentralization in the country. However, this way has not ensured the transition to duopolistic market structure, because China Telecom was acting both as an operator and regulator in the market which puts the China Unicom in relatively disadvantaged position. For instance, service provision approval procedure restrained the network coverage development of China Unicom. Hence, the regulator has put some practical barrier to the newcomer operator. Due to these problems, a new regulatory body(MIIT) was formally established in April 1998. As MIIT is relatively neutral, the real duopoly period has started in China only in 1998. The establishment of the MIIT has changed the regulatory framework completely. The newly organized regulator has favored the raise of market penetration of China Unicom. By this boost, China Unicom has increased its customer base significantly [51]. In 1999, State Council has issued CDMA license to China Unicom. In this way, China Unicom has increased its product portfolio by providing services over GSM and CDMA networks. GSM network has targeted to low-end subscribers who mostly use voice service where CDMA services has aimed medium and high-end subscribers enabling additional wireless data service. In 1999, both of the mobile operators have started prepaid service without installation fee. With this offer, mobile market has enlarged towards the lower-end subscribers. 3G studies in China have started by setting up 3G Technology Assessment Group in 1997. Finally, the regulator has granted 3G licenses in 2009 to mobile operators. During the spectrum assignment, Chinese regulator has protected its decision to keep Chinese mobile market to the state-owned companies. In this way, the profits earned from the mobile industry is received by the government and meanwhile Chinese market stay protected. Chinese regulator has utilized comparative bidding between state-owned companies o issue 3G licenses. Based on these method, 3G standard licenses have been granted base don company`s current performance, previous generation network situation and government policy to differentiate the companies. The regulator has not charged for the spectrum except a regular administrative fee. As a technology strategy, each mobile operator in China has received a different 3G standard to deploy in
its network. Firstly, China Mobile, which is the biggest operator in terms of number of subscribers, has
gotten homegrown TD-SCDMA along with largest frequency band (35 MHz). In international terms, TD-
SCDMA is least desirable due to lack of acceptance. However, in this way the regulator has aimed to put
entry barrier to Chinese market for international product manufacturer while favoring the local
manufacturers. As TD-SCDMA is a new technology standard, the deployment of the technology will take
time and investment. However, the technology standard is completely compatible with the 4G
infrastructure which will drive the pace later on to move to next generation technologies. China Mobile is
aiming to launch 4G network in 2014. Also, company´s plan on integrating TD-LTE and TD-FDD technologies
on the same device will further strengthen the position of this technological standard. Other operators in
Chinese market; China Unicom has received WCDMA technology licenses for 30 MHz frequency range and
China Telecom has gotten CDMA2000 licenses for the same amount of frequency. Both of the operators
aim to prioritize improving its existing network instead of moving towards to deployment of 4G network.
Due to their legacy deployments are not compatible with 4G network, transition to next generation will
drive the level of investment. Thus, both companies target to develop their 3G services while exploiting the
cheapening of 3G products. In this way, they will have additional market potential.
15
As China is the biggest mobile market in the world along with China Mobile is the biggest mobile operator
in the world in terms of number of subscribers, China is considered as an important mobile market.
Moreover, the state influence on market mechanism directly or indirectly differs the Chinese regulation
framework from the rest of the major mobile regulatory bodies. Thus, analyzing the Chinese mobile market
in this study becomes very attractive.
3.8 India Indian telecommunications market, including both fixed and mobile networks, is the second largest market
in respect to number of subscribers. Also, the country has the world´s third largest internet user base. The
weight of information and communications industry on the overall economy has increased up to 7% with
the boost of strong exports. The contribution of the industry to the economy is mainly accomplished by the
private sector as the share of Indian government is quite limited [52]. Indian telecommunications industry
is regulated by Telecom Regulatory Authority of India (TRAI) which has been established in 1997 by the
national parliament [53].
Indian regulator has adopted “ad-hoc” approach for spectrum management. The regulator develops its
regulation strategy considering evolving market conditions and potential market development. In this
sense, Indian regulator has revised its decisions including the amount of spectrum available for the mobile
services along with technology and service administration. The regulator embraced subscriber-based
criterion in 2G services spectrum allocation. In this approach, mobile spectrum is issued to the mobile
operators based on the number of subscriptions. If the mobile operator scales up its customer base, the
regulator may issue additional spectrum bandwidth to satisfy the demand. The regulator has issued two 2G
mobile licenses for every region in 1995, followed by the issue of the third license in 2001. After 2003, the
regulator has adopted first come first served method to issue the spectrum licenses. Finally, 3G spectrum
has been granted via auctioning which provided 14.5 billion dollars revenue for the government. During
the 3G auction, the regulator has sought to grant as many licenses as possible to maximize the revenue
from the spectrum auction.
Indian mobile telecommunications market presents different characteristics in urban and rural areas. As
urban areas are relatively much more developed, the mobile penetration per 100 persons has increased to
155 as of 2011. However, same figure in the rural areas stays about 35 subscriptions for 100 population.
Thus, regions in India show great variety based on the level of mobile market. As Indian regulator grants
the licenses based on regional level, the heterogonous character of the market results with variance in the
prices of the spectrum in different regions.
After 3G auctioning in India, it has been observed that none of the mobile operator has succeeded to provide national coverage in the country. Additionally, mobile tariffs are one of the lowest in the world due to high competition level between the operators. These factors boosted the use of multi-SIM phone to take advantage of different pricing plans and escape from the high roaming rates.
Indian mobile operators are responding the increased demand under limited spectrum resources along with infrastructure problems. As the wired networks have not possess adequate quality as well as limited coverage, utilization of offloading options for the mobile networks becomes problematic. To solve this problem, recently regulator has put effort on to practice the infrastructure sharing between the mobile operators.
16
3.9 United States Federal Communications Commission or shortly FCC is the institution that is responsible for regulating mobile telecommunications in the United States. FCC has established in 1934 and at the present time the regulator acts as an independent agency along with maintaining its own budget from licensing fees. The president and the commissioners of FCC are assigned by U.S. president and senate. In ITU recommendations, United States is placed in region 2 [54]. Before 1993, FCC has utilized lottery, beauty contest and first come first served mechanisms to assign the spectrum resources. However, these approaches possess the risk of inefficient utilization of resources, high cost of assigning process in terms of capital and time. Due to these reasons, following to 1993 FCC has obtained the permission to sell the spectrum licenses via auctions. Embracing auctioning is the most prevalent spectrum assignment method at the moment. American spectrum allocation system allows the regulator to assign the spectrum for limited period of time instead of granting the ownership of the spectrum. The spectrum plan determines the utilization way of the spectrum such as licensed vs. unlicensed use, private carriage vs. common carriage, commercial vs. noncommercial. In unlicensed bands, the regulator determines the transmitting equipment under certain power limits and technical standards to prevent the potential interference. The licensed bands require valid operating license under certain rules from the regulator [55]. In United States, the frequency licenses are granted regionally. Regional licenses increase the number of
licensees along with the potential interference risk. As the licenses may contain complementary value to
each other, the value of the newly assigned spectrum set differs based on current spectrum holdings. The
regulator assigns the spectrum via synchronous auction method to sustain the efficient allocation. In this
way, mobile operators are able to exploit the synergy between the licenses and exert the complementary
value. Moreover, the regulator has enabled to utilize the legacy spectrum holding for next generation
technologies to reduce the pressure on the mobile operators at the 3G auctions. Thus mobile operators do
not have to bid aggressively for 3G licenses or being out of market completely. Mobile operators may utilize
legacy spectrum holdings to provide voice, data and broadband services. Also, they may lease or transfer
spectrum from another player if agreed.
At the present time, four mobile operators –Verizon Wireless, AT&T Mobility, Sprint Nextel, T-Mobile USA
have national coverage. Additionally MetroPCS, Leap Wireless and U.S. Cellular are operating regional
based in the American market. Recently, Japanese mobile operator Softbank has acquired Sprint Nextel
(2013). Softbank has declared that the company will keep Sprint Nextel as a separate entity following the
acquisition. Verizon Wireless is formed as a joint venture between Verizon Wireless and Vodafone. AT&T
Mobility has proposed acquisition of T-Mobile USA (2011). However, concerns from U.S. Department of
Justice and other market players regarding the market competition led withdraw from the acquisiton
proposal. After this failed acquisition, MetroPCS has agreed for a merger with T-Mobile USA (2012). In this
way, both companies will increase the level of utilization of their network and spectrum holdings [56].
As American mobile market is advanced with respect to mobile ecosystem arrangements, extracting the
market dynamics can be accounted as major interest. Moreover, FCC is one of the most followed regulators
in the world based on its spectrum policies and market regulations. Regarding these arguments, American
market is an interesting case to include to this research work.
17
3.10 Japan
Japanese mobile telecommunications industry is regulated by Ministry of Internal Affairs and
Communications. Japanese regulator has never utilized market-based spectrum allocation mechanisms
favoring for beauty-contests to perform spectrum granting. Japan is placed in Region 3 in ITU
recommendation spectrum allocation.
First commercial 1G mobile services in Japan has been initiated by Nippon Telegraph and Telephone (NTT)
in 1979. Following that, NTT has been privatized in 1985 to boost the competition in the
telecommunications market. In 1988, KDDI has started its 1G analog mobile services as being the second
operator in the country. Japanese market has met with digital mobile services in 1993 by the services of
NTT DoCoMo. The company has utilized TDMA service which is branded as Personal Digital Cellular. In
1994, Softbank has come to the market as being third mobile operator in the country. In 1999, NTT
DoCoMo has initiated i-mode service to enable mobile internet services. In i-mode ecosystem, the mobile
operator has undertaken the ecosystem orchestrator role which issued NTT DoCoMo great power to
determine and coordinate the other market players. The success of i-mode in Japan has created great
attention in Europe, Asia and European markets. In this sense, the mobile operators in these markets have
started to deploy similar services through partnership with NTT DoCoMo [57]. As a result, Japanese mobile
industry has started actively export its business approach to abroad. However, this business approach has
not succeeded in the rest of the world in the same way as in Japan due to differences in market structure.
In Japanese mobile ecosystem, mobile operators have the greatest influence and meanwhile they are the
ones who extract the most of the value. In contrast to Japan in the rest of the world, the mobile operators
were not possessing similar power. Additionally, device manufacturers such as Nokia was not interested in
to produce products those are compatible with i-mode services. These reasons have resulted great
disparity in mobile internet services between Japan and the rest of the world.
Japanese regulator has granted 3G licenses via beauty contest to the market players without licensing fees.
After the spectrum allocation, NTT DoCoMo has initiated its WCDMA services under FOMA name. Following
NTT DoCoMo, KDDI has started its 3G services through utilizing CDMA2000 technology. Softbank
(previously J-Phone and Vodafone Japan) has used WCDMA technology. With these deployments, Japanese
mobile market was dominated by different 3G standards.
Until 2008, only locked mobile handsets were sold in Japanese market. These handsets were bundled with
SIM-cards which enables to use the mobile device only in certain mobile operator network. Also, mobile
operators were not selling separate SIM-cards to their subscribers which have their own device. Locking
enforcements in the country created great switching costs between the mobile operators meanwhile
assigning great power to the mobile operators. Mobile operators have provided all access, device and
applications from one hand to the subscribers. In 2008, new regulation has forced mobile operators to
unbundle service and device charges. With the implementation of this regulation, the switching costs in
Japan may decrease in the long term.
As Japanese mobile market possess unique character in respect to difference in implementations from the rest of the world makes it interesting case to study. During our research we have also noted that Japanese market is a very hard to analyze due to lack of information in English from the official institutions.
18
3.11. Sweden Swedish mobile telecommunications industry is regulated by Swedish Post and Telecom Authority (PTS). As well as regulating the mobile industry, the regulator has objectives to secure telecommunications services for people with disability, the procurement of basic services and promotion of broadband services. Sweden lies down to region 1 in ITU recommendations. GSM services in Sweden has started in 1992 by Telia, Comviq (Tel2) and Vodafone. At the present time, four mobile network operators provide mobile services to Swedish subscribers. The biggest mobile operator in terms of number of subscribers, TeliaSonera is created with a merger between Swedish operator Telia and Finnish operator Sonera (2002). Prior to TeliaSonera, Telia has a background on being Swedish telecommunications monopoly. Secondly, Tele2 has established in 1970s and challenged to government monopoly market. The aim of Tele2 was to challenge the monopoly pushing the market towards a more open liberal scheme. In this way, Tele2 would gain ground in the telecommunications market in Sweden. As being successful operations in Swedish market, Tele2 has gone to other mobile markets using its expertise in challenging the dominant monopoly. Telenor, the Norwegian incumbent, has tried to enter the Swedish market via a merger with Telia (1999). Following the failure of merger attempt, Telenor has finally come to Swedish market via acquisition of Vodafone Sweden (2005). Hutchison 3G is providing UMTS services to the Swedish customers. Hutchison is a Hong Kong based company operating in Denmark and Sweden. As an interesting note, Hutchison 3G has not separated its operations in Denmark and Sweden as both networks are perceived as home network. Overall in Swedish mobile market, all of the mobile network operators have multi-national character. 3G frequency spectrum in Sweden has been completed in December 2000 via beauty contest method. At that period of time, it was not possible to organize auctions for sale of spectrum in the country. Ten companies have applied for the license where the regulator preferred to distribute four licenses. With the 3G licensing, Hutchison 3G came to the Swedish mobile market as the fourth player. The regulator has not charged license fees to the operators but the requirement for the 3G licenses were the national coverage of 99,98% until the end of 2003. Also, infrastructure sharing up to 70% has been allowed as well as supported by the regulator [58]. 3.12 Summary In this section, we will introduce a summary of the mobile market descriptions in the table below. The summary table will highlight the important characteristics of each studied mobile market.
Mobile Market Some highlights
Finland - Equal spectrum distribution between players - Competitive market with effective regulatory frame
Chile - Most developed mobile market in South America - Technology-neutral spectrum harmonized by market over time - 2 new MNOs entered the market recently
Turkey - Strong incumbent market share - Low level of ARPU and investment comparing to rest of European mobile
markets
United Kingdom - Harmonization of European rules with Anglo-Saxon business understanding
- Recently, spectrum licenses are becoming to technology neutral even though the market is still harmonized
Australia - Spectrum reselling is allowed - Allocation of spectrum licenses in region level.
19
- Geographical focus by MNOs in spectrum holdings
New Zealand - First mobile spectrum auction in the world - Two-tier mobile spectrum administration system - Spectrum reselling is supported
China - Regulator has great influence on the mobile market - Incumbent operator has great dominance in the market - All of the mobile operators are owned by the state companies
India - Fragmented mobile market where none of the MNOs is able to provide national coverage
- The lowest prices, ARPU and investment per subscriber level in this study
United States - Different mobile standards exists in the market with various market shares - Regional spectrum granting with auctioning method
Japan - Different mobile technology standards exist in the market - Handset bundling and SIM-locking are prevalent
Sweden - Possess good rankings in mobile related rankings such as Network Readiness Index
- Each MNO in the market have multinational structure.
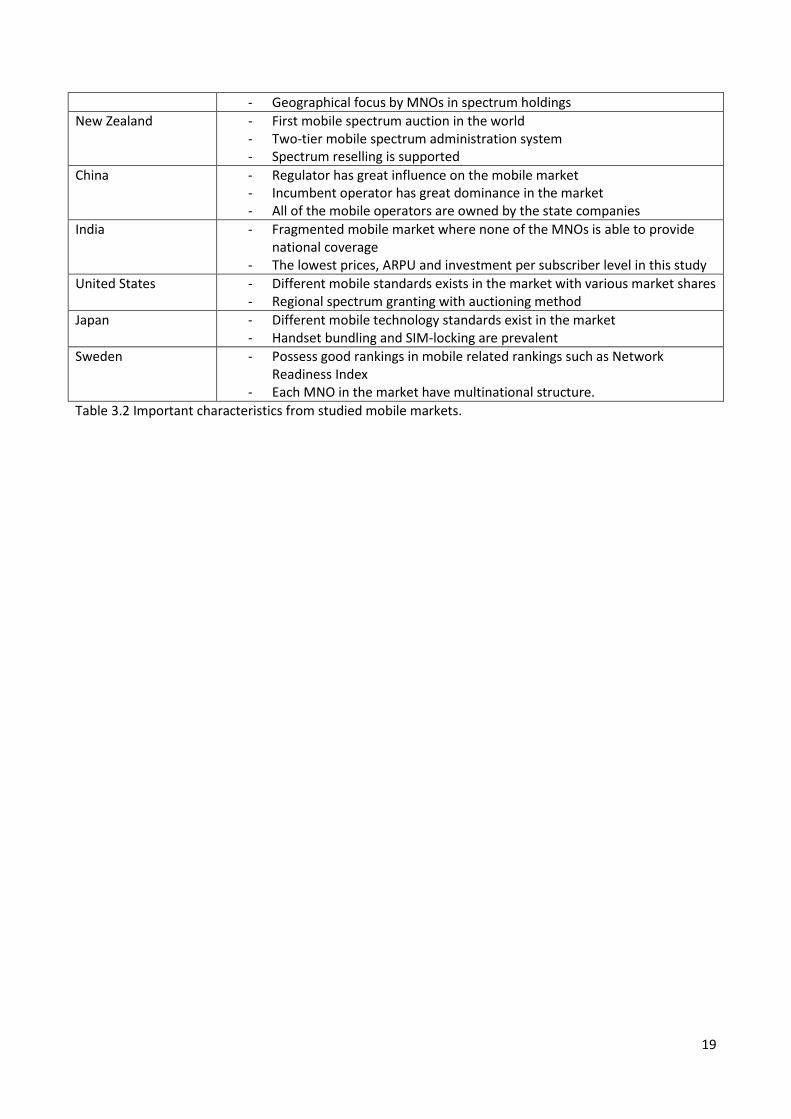
Table 3.2 Important characteristics from studied mobile markets.
20
4. Analysis of Case Markets In this chapter, we will complete analysis on spectrum policy and market structure. We will investigate the parameters one by one along with highlighting the up-to-date trends in the studied mobile markets regarding to relevant parameter.
4.1 Spectrum Policy Analysis
Spectrum regulation constitutes a notable framework by reflecting the regulators´ approach to administer
the mobile market. For reaching broad understanding of the objectives of the regulator and regulator-
market relations, it is a must to complete spectrum policy analysis.
Each mobile market in this study has its own regulatory mechanism, which is in a way connected to the
government bodies, to arrange the mobile market in that country. Even though, every regulator is
independent from each other in theory, undoubtedly the regulators may possess influence to each other.
Besides, the regulators may have similar kind of opinions to create the mobile market. Moreover, they may
like to observe the results of the certain regulatory decisions in other markets to visualize the effects of the
similar actions in their own market. Thus, these factors create similarities or dissimilarities between mobile
market regulatory frameworks.
Differences between the regulatory bodies in respect to the power they possess, their hierarchy, the way of
regulating and cultural norms create toughness in mapping the spectrum policies of different countries in
the same framework. Therefore in this section, we are observing the parameters which describe the mobile
spectrum policy of the regulatory bodies. In this way, we aim to analyze the spectrum policy framework as
well as up-to-date spectrum situation in each studied mobile market. By completing these analysis, we will
be able to show the effects and relations of the spectrum policy parameters.
The parameters, which we will examine as a potential explaining factor in spectrum policy, are; market
share, Herfindahl-Hirschmann Index (HHI), Spectrum Herfindahl-Hirscmann Index, Reselling Rights,
Technology Neutrality / Harmonization, Service Neutrality / Harmonization. In this section, we will scan this
parameters theoretically what they mean and corresponding up-to-date data in the studied markets.
4.1.1 Market share
Market share, as a key indicator to measure market performance, is the percentage of market in terms of units sold or revenues earned (as shown Equation 4.1 and 4.2) accounted for a specific organization . As being less dependent to the macro-level economic environment, market share is accepted as an important parameter that demonstrates how well a specific firm doing in the market. Also, it is counted as a managerial objective to improve business performance. Moreover, losses in the market share can signal long-term problems of viability of a business.
Unit Market share (%) = 100 * Unit Sales / Total Market Unit Sales (Equation 4.1)
Revenue Market share (%) = 100 * Sales Revenue / Total Market Sales Revenue (Equation 4.2)
Possessing a large market share arises many advantages for the firms. The major advantage; economies of scale provides cost advantage, brand awareness among customers, accessing superior advertising channels, better technology and R&D capabilities, better bargaining position with distributers, suppliers, customers and regulators. Cost advantage affects the competitiveness significantly especially if the fixed costs
21
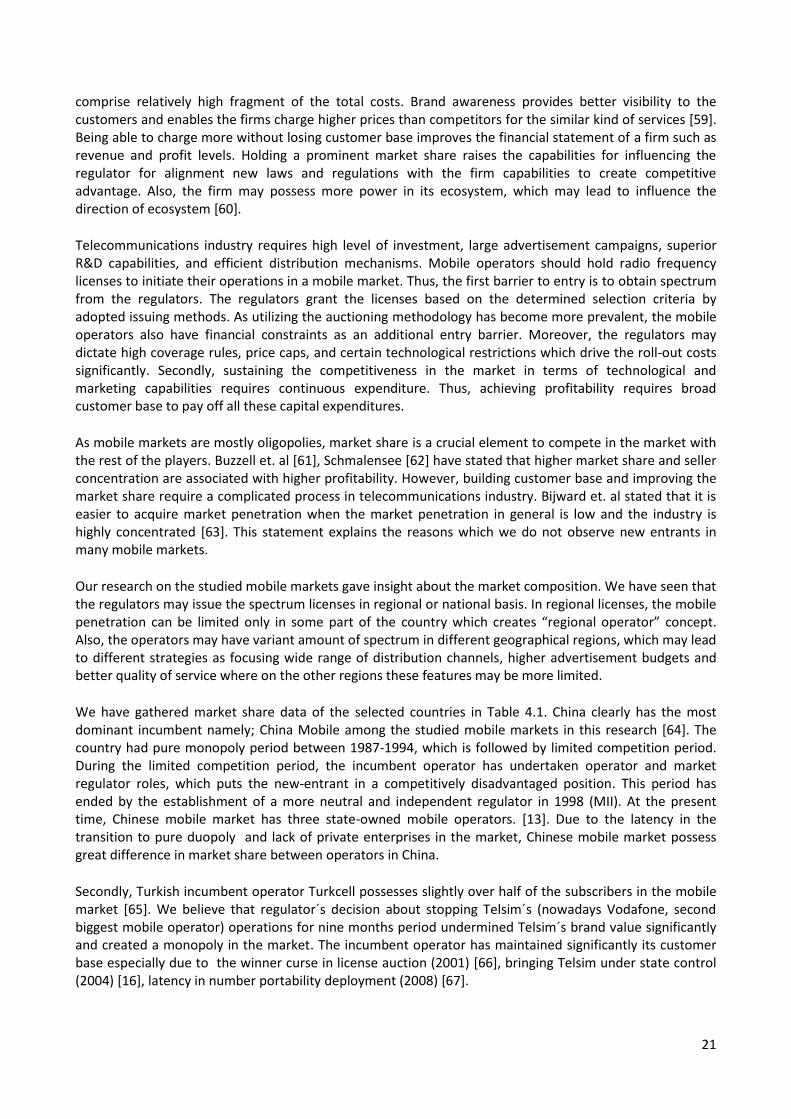
comprise relatively high fragment of the total costs. Brand awareness provides better visibility to the customers and enables the firms charge higher prices than competitors for the similar kind of services [59]. Being able to charge more without losing customer base improves the financial statement of a firm such as revenue and profit levels. Holding a prominent market share raises the capabilities for influencing the regulator for alignment new laws and regulations with the firm capabilities to create competitive advantage. Also, the firm may possess more power in its ecosystem, which may lead to influence the direction of ecosystem [60].
Telecommunications industry requires high level of investment, large advertisement campaigns, superior R&D capabilities, and efficient distribution mechanisms. Mobile operators should hold radio frequency licenses to initiate their operations in a mobile market. Thus, the first barrier to entry is to obtain spectrum from the regulators. The regulators grant the licenses based on the determined selection criteria by adopted issuing methods. As utilizing the auctioning methodology has become more prevalent, the mobile operators also have financial constraints as an additional entry barrier. Moreover, the regulators may dictate high coverage rules, price caps, and certain technological restrictions which drive the roll-out costs significantly. Secondly, sustaining the competitiveness in the market in terms of technological and marketing capabilities requires continuous expenditure. Thus, achieving profitability requires broad customer base to pay off all these capital expenditures.
As mobile markets are mostly oligopolies, market share is a crucial element to compete in the market with the rest of the players. Buzzell et. al [61], Schmalensee [62] have stated that higher market share and seller concentration are associated with higher profitability. However, building customer base and improving the market share require a complicated process in telecommunications industry. Bijward et. al stated that it is easier to acquire market penetration when the market penetration in general is low and the industry is highly concentrated [63]. This statement explains the reasons which we do not observe new entrants in many mobile markets.
Our research on the studied mobile markets gave insight about the market composition. We have seen that the regulators may issue the spectrum licenses in regional or national basis. In regional licenses, the mobile penetration can be limited only in some part of the country which creates “regional operator” concept. Also, the operators may have variant amount of spectrum in different geographical regions, which may lead to different strategies as focusing wide range of distribution channels, higher advertisement budgets and better quality of service where on the other regions these features may be more limited.
We have gathered market share data of the selected countries in Table 4.1. China clearly has the most dominant incumbent namely; China Mobile among the studied mobile markets in this research [64]. The country had pure monopoly period between 1987-1994, which is followed by limited competition period. During the limited competition period, the incumbent operator has undertaken operator and market regulator roles, which puts the new-entrant in a competitively disadvantaged position. This period has ended by the establishment of a more neutral and independent regulator in 1998 (MII). At the present time, Chinese mobile market has three state-owned mobile operators. [13]. Due to the latency in the transition to pure duopoly and lack of private enterprises in the market, Chinese mobile market possess great difference in market share between operators in China.
Secondly, Turkish incumbent operator Turkcell possesses slightly over half of the subscribers in the mobile market [65]. We believe that regulator´s decision about stopping Telsim´s (nowadays Vodafone, second biggest mobile operator) operations for nine months period undermined Telsim´s brand value significantly and created a monopoly in the market. The incumbent operator has maintained significantly its customer base especially due to the winner curse in license auction (2001) [66], bringing Telsim under state control (2004) [16], latency in number portability deployment (2008) [67].
22
Historically, New Zealand has structured its mobile market with market-mechanisms. New Zealand is the first country in the world that has utilized auctioning method for licensing the spectrum. The country has adopted an approach which defines spectrum licensing under property rights regime. However, mobile market in New Zealand is quite small and number of participants to the auctions is limited. Based on these factors, we observe a big gap in market share between the players in New Zealand even though market-based approaches have been embraced.
Traditionally, mobile players in Japan have strong positions and they have undertaken the ecosystem leader role. Japanese subscribers have accessed the mobile access, phone and application via the intermediately of the mobile operator until the recent changes in the regulations [68]. Also, SIM-locking, handset bundling, incompatible standards have increased the switching costs between the operators significantly. High switching costs decrease the customer desire to switch their supplier.
While Australia utilized similar market mechanism licensing scheme with New Zealand, as a difference Australian regulator has preferred to issue the licenses in regional basis. This arrangement resulted asymmetries between the license holdings from region to region between operators [69]. As some operators focused on more to hold licenses in urban areas, the others have relatively larger amount of spectrum in rural areas. Thus, Australian operators have more focus than New Zealand equivalents.
Chile has relatively two close market share holder (37.9% Movistar and 37.8% Entel respectively) and one operator a little behind (23.5% Claro). Recently, Chilean regulator has decided to open up the Chilean market by issuing licenses for the new-entrants [22]. As the newcomers invest on their networks, we may naturally expect that they will increase their market share. Thus, in the future we expect that Chilean mobile market may be much more fragmented than now it is as the mobile services of newcomer operators roll-out. However, it is necessary to keep a keynote that as seen in many other mobile markets there might be a probability of a merger between the existing players and the newcomers.
GSM services in Sweden have started in 1992 by three operators namely; Telia, Comviq (nowadays Tele2) and Vodafone. The fourth player has joined to competition with some delay. 3G licenses have been issued in 2000 by beauty-contest. The regulator has given incentive for infrastructure-sharing which drives the competition to the service-level rather than infrastructure-level.
Finnish GSM market has been initiated by the first services of Radio Linja (nowadays Elisa) in December 1991 which is followed by the services of Sonera in June 1992. The third mobile operator has come to the play in 1998. The regulator has driven price-competition between mobile operators until 2006, afterwards replacing the strategy with technology-incentive to boost the transition to 3G networks.
The UK and USA have similar kind of regulatory framework. Four players are active in British mobile market which three of them quite equal market shares where the fourth is behind (latercomer). British regulatory has approved the merger between Deutsche Telekom and France Telecom UK ventures. Thus, the biggest mobile player; Everything Everywhere (EE) has been established [70]. In United States, seven players have mainly constituted the mobile market where four of them have large customer base and the rest have more restricted number of subscribers. The difference between UK and USA, the licenses in UK have been granted in national level where the American licenses are regional based.
Indian mobile market is very much fragmented with high number of mobile operators. The licenses are distributed regionally and none of the mobile operators have succeeded to reach national coverage. The regulator issue very limited amount of mobile operator to each operator and then mobile operators have the right to request more spectrum bandwidth from the regulator in respect to number of subscribers. The biggest operator in India holds only 19,75 % of the market share [28]. Thus, we can state that Indian mobile market highly fragmented between many players.
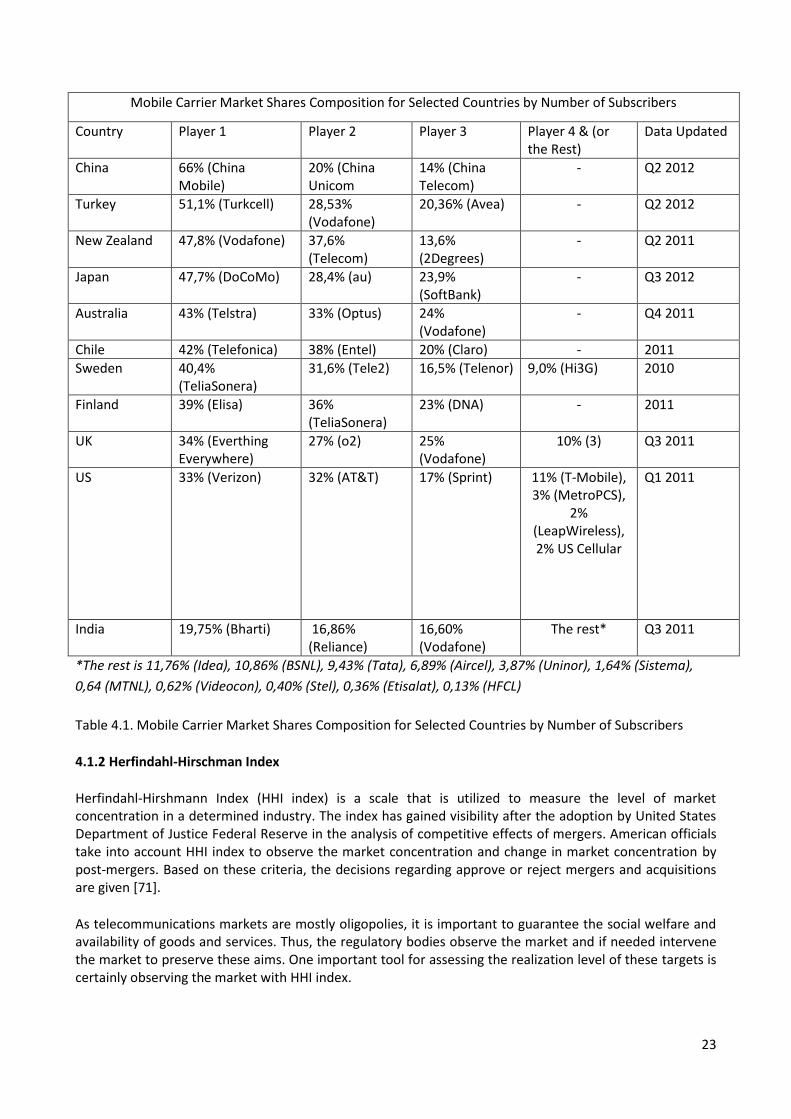
23
Mobile Carrier Market Shares Composition for Selected Countries by Number of Subscribers
Country Player 1 Player 2 Player 3 Player 4 & (or the Rest)
Data Updated
China 66% (China Mobile)
20% (China Unicom
14% (China Telecom)
- Q2 2012
Turkey 51,1% (Turkcell) 28,53% (Vodafone)
20,36% (Avea) - Q2 2012
New Zealand 47,8% (Vodafone) 37,6% (Telecom)
13,6% (2Degrees)
- Q2 2011
Japan 47,7% (DoCoMo) 28,4% (au) 23,9% (SoftBank)
- Q3 2012
Australia 43% (Telstra) 33% (Optus) 24% (Vodafone)
- Q4 2011
Chile 42% (Telefonica) 38% (Entel) 20% (Claro) - 2011
Sweden 40,4% (TeliaSonera)
31,6% (Tele2) 16,5% (Telenor) 9,0% (Hi3G) 2010
Finland 39% (Elisa) 36% (TeliaSonera)
23% (DNA) - 2011
UK 34% (Everthing Everywhere)
27% (o2) 25% (Vodafone)
10% (3) Q3 2011
US 33% (Verizon) 32% (AT&T) 17% (Sprint) 11% (T-Mobile), 3% (MetroPCS),
2% (LeapWireless), 2% US Cellular
Q1 2011
India 19,75% (Bharti) 16,86% (Reliance)
16,60% (Vodafone)
The rest* Q3 2011
*The rest is 11,76% (Idea), 10,86% (BSNL), 9,43% (Tata), 6,89% (Aircel), 3,87% (Uninor), 1,64% (Sistema),
0,64 (MTNL), 0,62% (Videocon), 0,40% (Stel), 0,36% (Etisalat), 0,13% (HFCL)
Table 4.1. Mobile Carrier Market Shares Composition for Selected Countries by Number of Subscribers
4.1.2 Herfindahl-Hirschman Index
Herfindahl-Hirshmann Index (HHI index) is a scale that is utilized to measure the level of market concentration in a determined industry. The index has gained visibility after the adoption by United States Department of Justice Federal Reserve in the analysis of competitive effects of mergers. American officials take into account HHI index to observe the market concentration and change in market concentration by post-mergers. Based on these criteria, the decisions regarding approve or reject mergers and acquisitions are given [71].
As telecommunications markets are mostly oligopolies, it is important to guarantee the social welfare and availability of goods and services. Thus, the regulatory bodies observe the market and if needed intervene the market to preserve these aims. One important tool for assessing the realization level of these targets is certainly observing the market with HHI index.
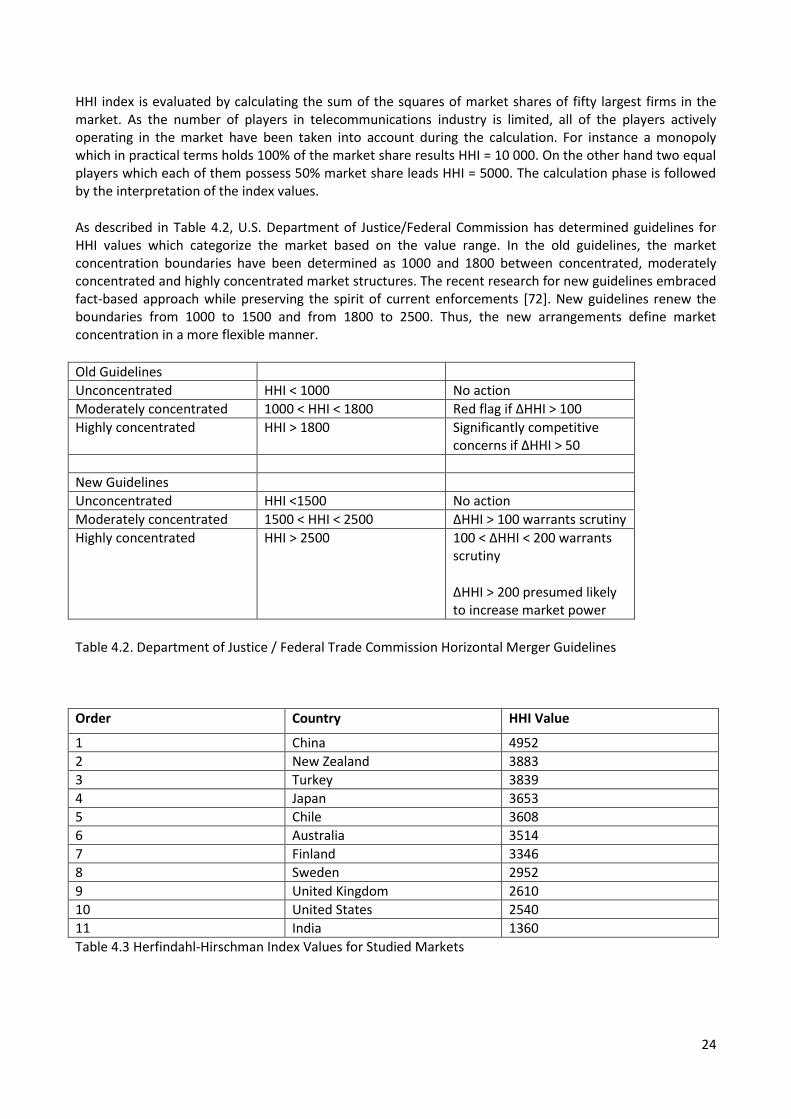
24
HHI index is evaluated by calculating the sum of the squares of market shares of fifty largest firms in the market. As the number of players in telecommunications industry is limited, all of the players actively operating in the market have been taken into account during the calculation. For instance a monopoly which in practical terms holds 100% of the market share results HHI = 10 000. On the other hand two equal players which each of them possess 50% market share leads HHI = 5000. The calculation phase is followed by the interpretation of the index values.
As described in Table 4.2, U.S. Department of Justice/Federal Commission has determined guidelines for HHI values which categorize the market based on the value range. In the old guidelines, the market concentration boundaries have been determined as 1000 and 1800 between concentrated, moderately concentrated and highly concentrated market structures. The recent research for new guidelines embraced fact-based approach while preserving the spirit of current enforcements [72]. New guidelines renew the boundaries from 1000 to 1500 and from 1800 to 2500. Thus, the new arrangements define market concentration in a more flexible manner.
Old Guidelines
Unconcentrated HHI < 1000 No action
Moderately concentrated 1000 < HHI < 1800 Red flag if ∆HHI > 100
Highly concentrated HHI > 1800 Significantly competitive concerns if ∆HHI > 50
New Guidelines
Unconcentrated HHI <1500 No action
Moderately concentrated 1500 < HHI < 2500 ∆HHI > 100 warrants scrutiny
Highly concentrated HHI > 2500 100 < ∆HHI < 200 warrants scrutiny
∆HHI > 200 presumed likely to increase market power
Table 4.2. Department of Justice / Federal Trade Commission Horizontal Merger Guidelines
Order Country HHI Value
1 China 4952
2 New Zealand 3883
3 Turkey 3839
4 Japan 3653
5 Chile 3608
6 Australia 3514
7 Finland 3346
8 Sweden 2952
9 United Kingdom 2610
10 United States 2540
11 India 1360
Table 4.3 Herfindahl-Hirschman Index Values for Studied Markets
25
During our research, we have calculated HHI values for studied mobile markets from the up-to-date
gathered data from regulator, mobile operator and consulting company websites. Based on these
calculations, we have created Table 4.3 above.
The results present important findings related to market concentration. As Chinese mobile incumbent holds
66% of the subscription base in the country, Chinese mobile market is placed to the top of HHI list. The
countries, which have three mobile operators, filled the first seven places except Chile as the country just
accepted two new operators to its mobile market. Sweden and United Kingdom have four players
operating in their markets. The bottom of the list is filled by United States and India, which have large
population figures with regional licenses. Especially India is the most fragmented mobile market in this
study in which none of the mobile operators in the country cannot meet national network coverage.
4.1.3 Spectrum HHI
The spectrum assignment strategies of the regulatory bodies have great deal of impact on the mobile
industry. The primary reason is surely that mobile operators need permission to use the spectrum for
initiating their mobile services. Besides, the method of spectrum assignment has an effect on the mobile
players. For instance, if the regulator chooses to grant the spectrum licenses via beauty-contest, then the
crucial priority of the mobile operators is to fulfill the criteria which have determined by the regulator. On
the other hand, if the regulator decides to grant the licenses via auctions, financial matters become crucial.
3G-spectrum assignment auctions in United Kingdom and Germany resulted in extremely high prices which
obstructed the financial situation of the mobile operators and put them in a difficult situation to invest in
new technologies [73]. Lastly, the amount of spectrum assigned for mobile operators have impact the
mobile market. As the frequency spectrum crucial resource to serve to subscribers, the mobile operators
should have adequate spectrum to provide their services. If the amount of spectrum that a certain mobile
operator possesses is relatively small, the number of subscriptions may be limited due to the congestion
risk in the network. Also, if the operators have only license for certain geographical areas, then the mobile
operator cannot serve the rest of the regions along with losing the subscribers who would like to have
service availability in all regions. Thus, this consideration has an effect on the market positions of the
mobile operators. In this section, we will analyze the mobile operator spectrum concentration in studied
markets in respect to Herfindahl-Hirschmann Index.
In the previous section, we have analyzed the HHI value via taking the input from market penetration of the
mobile operators. Here we will introduce our research on spectrum composition concentration. To
describe this concept, we have combined the Herfindahl-Hirschman index with the spectrum holdings
which we have called “spectrum HHI”. The input of this parameter is the percentage of the spectrum of a
mobile operator possesses relative to total spectrum that is assigned for mobile services by the regulator.
As the licenses are national and the spectrum assignment data is widely available, the calculation was
straightforward. On the other hand during the evaluation of the cases in which the mobile licenses are
regional or the spectrum distribution data to each operator in the market is not completely available, we
made some assumptions to finalize our calculations. Moreover, the data about the amount of spectrum
each mobile operator holds and the percentage of the spectrum holdings to the total mobile spectrum in
the studied markets can be found in the Appendix B.
26
First of all during the first phase of our research we were considering whether to use symmetric or
asymmetric allocation of the mobile spectrum between mobile operators as a parameter in this study.
However, our data gathering process has proved that Finland is the only country that has assigned all
spectrum bands symmetrically between the mobile operators among studied mobile markets. Finnish
regulator, FICORA, has initially granted 2G and 3G licenses via beauty-contest. In this way, the regulator
took attention to give the same amount of resources to not to put any mobile operator in a disadvantaged
position. However, in the upcoming auction for the assignment of digital dividend bandwidth, the regulator
put the spectrum cap as 50% of the auctioned spectrum for any operator. Thus, in the future symmetrical
spectrum distribution in each band in the Finnish mobile spectrum allocation table may change.
Chilean mobile market has in total five mobile operators which two of them new entrants. As the regulator
has decided to open up the mobile market to the new players, the regulator has granted new spectrum
bands for the new entrants. In practical terms, this method was the only way to bring new players to the
market as reselling rights are not defined in the country and the desire of the existing operators for actively
involving the secondary spectrum market is unclear. Even though, the beauty contest method has been
always utilized by the regulator to assign the mobile spectrum in Chile, the asymmetric amount of spectrum
has been granted to the mobile operators. The regulator has opened the 1.7 / 2.1 GHz spectrum band for
new entrants; VTR and Nextel where the existing operators hold spectrum holdings respectively in lower
bands. This situation may put the new entrants in a disadvantaged situation due to the worse propagation
characteristics of the radio links in higher bands. Thus, the new entrants should deploy a higher density of
network infrastructure to handle the coverage problems which leads additional amount of investment.
Furthermore between the new entrants, Nextel holds double amount of mobile spectrum comparing to
VTR which results the rise of asymmetry between these operators. When we review the overall mobile
spectrum, we have observed that only Telefónica and Claro have same amount of spectrum in each
spectrum band. Even though, Nextel and Entel have also same amount of spectrum, their spectrum
holdings are in different bands. As spectrum bands have different characteristic, the value of the spectrum
holdings of Nextel and Entel may not be assessed as equal. VTR clearly possesses the smallest portion of
mobile spectrum in the country. Based on the current spectrum plan, we may say that new release of
spectrum or spectrum refarming may be needed in the future due to the fact that new technologies need
the use of multiple bands; lower and higher frequencies at the same time. As a keynote to our calculations,
we have made our calculation based on the current overall mobile spectrum plan.
Turkish GSM market has started by the initiation of services by Turkcell and Telsim (nowadays Vodafone).
In the first place, the regulator had issued same amount of bandwidth in 900 MHz band for both operators
to rollout their services. Then, as the new entrants come to the market (2001), the mobile spectrum plan
has become asymmetrical between operators. By spectrum assignment to the newcomer, the regulator
has enabled the utilization of 1800 MHz band in the mobile services for the first time. With the consolation
of the new entrants (2004), the smallest mobile operator by number of subscribers has gained the largest
amount of mobile spectrum where incumbents had still equal shares. As 3G licenses have distributed in
Turkey, the regulator had determined four different 3G licenses where the bandwidth of each of the license
is different. The auction had resulted in a parallel with the market share of the operators. Thus, Turkcell the
largest mobile operator by the subscriber penetration has gotten the licence A, where Vodafone B and
Avea C. Fourth license had been reserved for possible new entrant to the market. As a nutshell, the current
situation in the Turkish mobile spectrum plan shows that the smallest mobile operator by number of
subscriber hold the largest amount of spectrum (36%), then the biggest mobile operator Turkcell follows
(33,3%), and lastly Vodafone has the smallest portion of the spectrum (31%).
27
The input for the calculations in New Zealand mobile market has been completed based on the data
available in the national regulatory website based on the total assignment of the spectrum [74]. In contrast
to New Zealand, Australia had a complicated spectrum assignment where the licenses are regional based
and the spectrum dominance of the mobile operators varies from region to region. We have decided to
use the spectrum plans for Melbourne and Sydney which are the most populated regions in the country.
Also, economic activities in these regions are in relatively high level. Thus, we have decided to make an
assumption to calculate Spectrum-HHI value as an average of separate spectrum HHI of these regions and
then make an assumption that this value represents the overall Australia.
We have reviewed the Japanese mobile spectrum plan for all the bands. As four players possess holdings
where one of them (eAccess) has quite a small proportion of spectrum amount (10%) comparing to the rest
of the players [75].
Swedish mobile spectrum plan has been divided between seven players. In Swedish market as a difference
we have seen that the mobile operators had built joint ventures which hold the spectrum on behalf of its
own name. Net4Mobility is the joint venture of Tele2 and Telenor where LTE Svenska UMTSLicens AB is
established by Tele2 and TeliaSonera. These ventures hold 31% of the total mobile spectrum.
In United Kingdom, the biggest mobile spectrum owner is EE (Everything Everywhere) has been created by
a merger between the UK ventures of France Telecom and Deutsche Telekom. Even though EE possess the
largest amount of the mobile spectrum, the company does not have any holdings in the 900 MHz band.
Thus, it would not be possible to exploit lower frequencies for EE. The mobile operator 3 possess its mobile
holdings only in 2G MHz band which currently operates its 3G services. As an overall, the UK spectrum band
is organized asymmetrically between the mobile players [76].
In China, we have only included the 3G spectrum plan during spectrum-HHI calculations due to the lack of
public information in English about the overall spectrum strategy between the mobile operators. 3G
spectrum licenses in China have been granted by comparative bidding. The results of the spectrum
assignment were parallel with the market share composition where the bigger player gets the largest
amount of spectrum vice versa.
Indian regulator issues regional-based licenses to the mobile players. In Indian market, none of the mobile
operators have succeeded to provide service in the national level [77]. This situation has even hardened our
calculation for a national HHI for Indian market. Thus to resolve this problem, we have calculated three
separate HHI values for Mumbai, Delhi and Kolkata as the most developed regions of the country. Then, we
have taken the average of the separate regional HHI values. In this way, we have reached the overall Indian
spectrum-HHI value.
United States mobile spectrum plan has same issues with India and Australia regarding the calculations of
spectrum-HHI value. In Australian case we have included the regions which are most populated. On the
other hand as India is densely populated in every region, we have selected three developed regions and
calculated the resulted spectrum-HHI value based on this data. Nevertheless, we believed that these
methods do not reflect the insight of the U.S. mobile spectrum plan due to the fact that it is hard to elect
the areas which may show the overall market. As plenty of data available in U.S. market, we have selected
to use spectrum holdings/ millions subscribers data source to continue our calculations [9]. From this ratio
via using the U.S. population we have ended up with the spectrum holdings value. Based on the spectrum
holdings value, we have calculated the Spectrum-HHI. Later on, we have calculated Spectrum-HHI based on
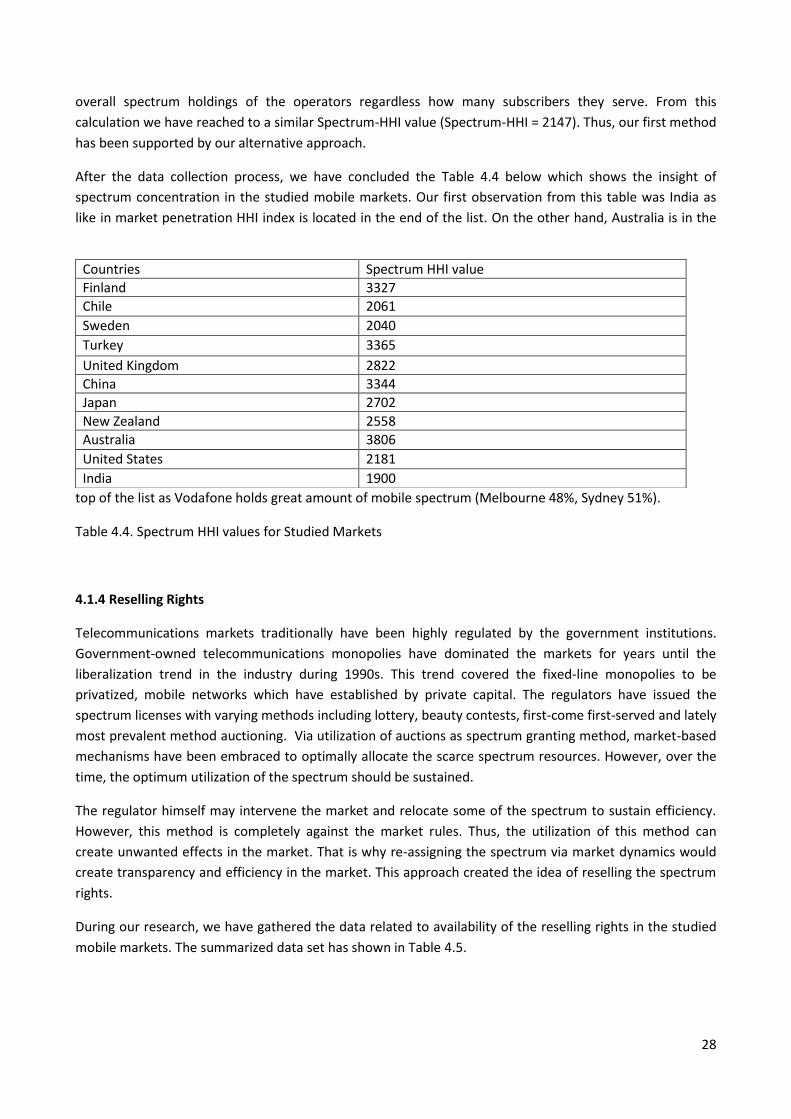
28
overall spectrum holdings of the operators regardless how many subscribers they serve. From this
calculation we have reached to a similar Spectrum-HHI value (Spectrum-HHI = 2147). Thus, our first method
has been supported by our alternative approach.
After the data collection process, we have concluded the Table 4.4 below which shows the insight of
spectrum concentration in the studied mobile markets. Our first observation from this table was India as
like in market penetration HHI index is located in the end of the list. On the other hand, Australia is in the
top of the list as Vodafone holds great amount of mobile spectrum (Melbourne 48%, Sydney 51%).
Table 4.4. Spectrum HHI values for Studied Markets
4.1.4 Reselling Rights
Telecommunications markets traditionally have been highly regulated by the government institutions.
Government-owned telecommunications monopolies have dominated the markets for years until the
liberalization trend in the industry during 1990s. This trend covered the fixed-line monopolies to be
privatized, mobile networks which have established by private capital. The regulators have issued the
spectrum licenses with varying methods including lottery, beauty contests, first-come first-served and lately
most prevalent method auctioning. Via utilization of auctions as spectrum granting method, market-based
mechanisms have been embraced to optimally allocate the scarce spectrum resources. However, over the
time, the optimum utilization of the spectrum should be sustained.
The regulator himself may intervene the market and relocate some of the spectrum to sustain efficiency.
However, this method is completely against the market rules. Thus, the utilization of this method can
create unwanted effects in the market. That is why re-assigning the spectrum via market dynamics would
create transparency and efficiency in the market. This approach created the idea of reselling the spectrum
rights.
During our research, we have gathered the data related to availability of the reselling rights in the studied
mobile markets. The summarized data set has shown in Table 4.5.
Countries Spectrum HHI value
Finland 3327
Chile 2061
Sweden 2040
Turkey 3365
United Kingdom 2822
China 3344
Japan 2702
New Zealand 2558
Australia 3806
United States 2181
India 1900
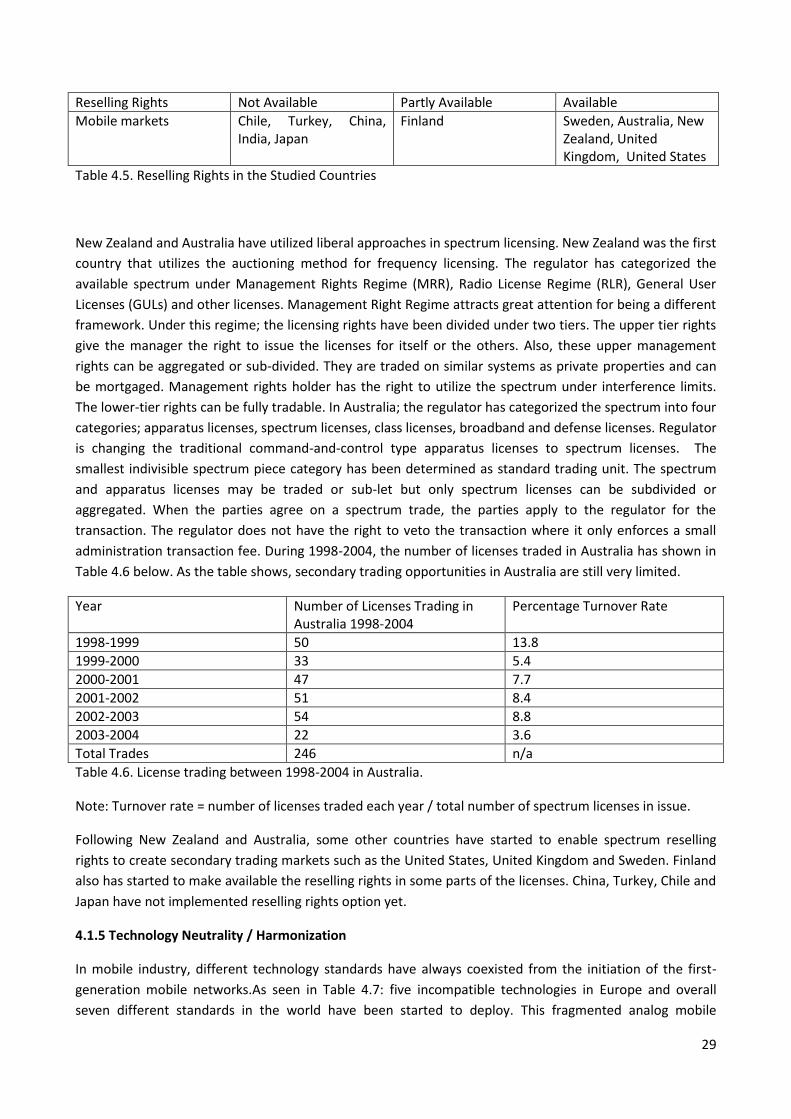
29
Reselling Rights Not Available Partly Available Available
Mobile markets Chile, Turkey, China, India, Japan
Finland Sweden, Australia, New Zealand, United Kingdom, United States
Table 4.5. Reselling Rights in the Studied Countries
New Zealand and Australia have utilized liberal approaches in spectrum licensing. New Zealand was the first
country that utilizes the auctioning method for frequency licensing. The regulator has categorized the
available spectrum under Management Rights Regime (MRR), Radio License Regime (RLR), General User
Licenses (GULs) and other licenses. Management Right Regime attracts great attention for being a different
framework. Under this regime; the licensing rights have been divided under two tiers. The upper tier rights
give the manager the right to issue the licenses for itself or the others. Also, these upper management
rights can be aggregated or sub-divided. They are traded on similar systems as private properties and can
be mortgaged. Management rights holder has the right to utilize the spectrum under interference limits.
The lower-tier rights can be fully tradable. In Australia; the regulator has categorized the spectrum into four
categories; apparatus licenses, spectrum licenses, class licenses, broadband and defense licenses. Regulator
is changing the traditional command-and-control type apparatus licenses to spectrum licenses. The
smallest indivisible spectrum piece category has been determined as standard trading unit. The spectrum
and apparatus licenses may be traded or sub-let but only spectrum licenses can be subdivided or
aggregated. When the parties agree on a spectrum trade, the parties apply to the regulator for the
transaction. The regulator does not have the right to veto the transaction where it only enforces a small
administration transaction fee. During 1998-2004, the number of licenses traded in Australia has shown in
Table 4.6 below. As the table shows, secondary trading opportunities in Australia are still very limited.
Year Number of Licenses Trading in Australia 1998-2004
Percentage Turnover Rate
1998-1999 50 13.8
1999-2000 33 5.4
2000-2001 47 7.7
2001-2002 51 8.4
2002-2003 54 8.8
2003-2004 22 3.6
Total Trades 246 n/a
Table 4.6. License trading between 1998-2004 in Australia.
Note: Turnover rate = number of licenses traded each year / total number of spectrum licenses in issue.
Following New Zealand and Australia, some other countries have started to enable spectrum reselling
rights to create secondary trading markets such as the United States, United Kingdom and Sweden. Finland
also has started to make available the reselling rights in some parts of the licenses. China, Turkey, Chile and
Japan have not implemented reselling rights option yet.
4.1.5 Technology Neutrality / Harmonization
In mobile industry, different technology standards have always coexisted from the initiation of the first-
generation mobile networks.As seen in Table 4.7: five incompatible technologies in Europe and overall
seven different standards in the world have been started to deploy. This fragmented analog mobile
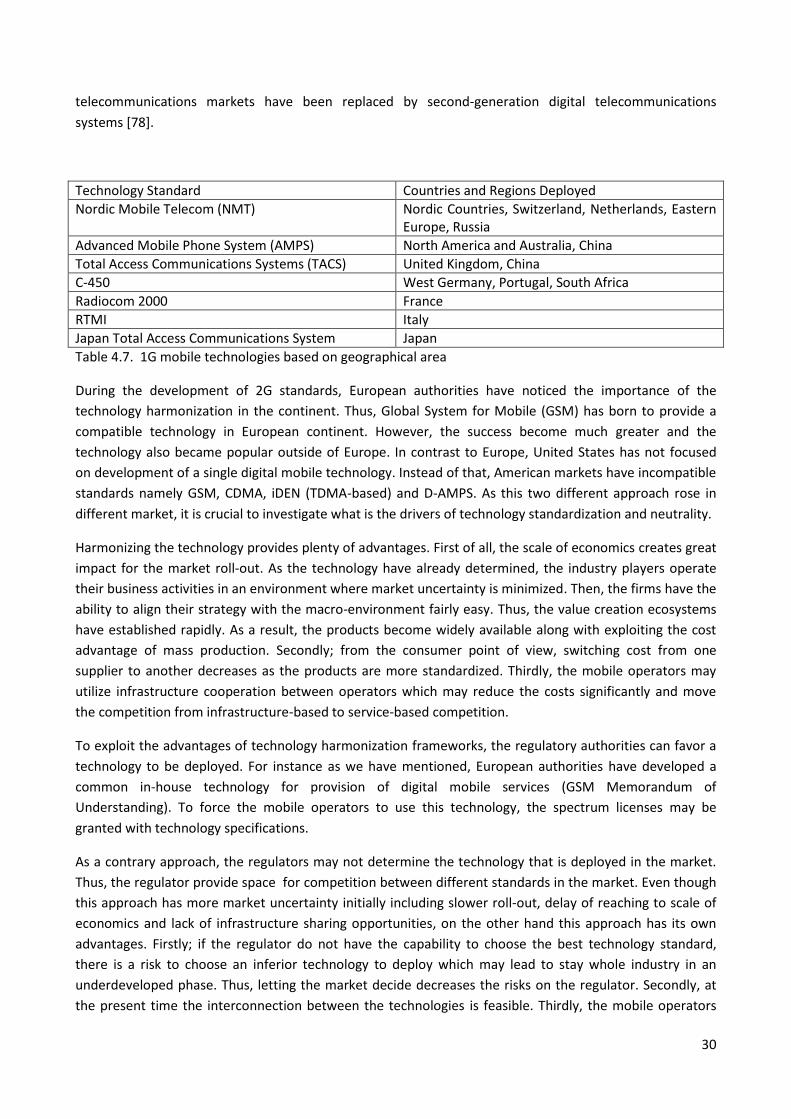
30
telecommunications markets have been replaced by second-generation digital telecommunications
systems [78].
Technology Standard Countries and Regions Deployed
Nordic Mobile Telecom (NMT) Nordic Countries, Switzerland, Netherlands, Eastern Europe, Russia
Advanced Mobile Phone System (AMPS) North America and Australia, China
Total Access Communications Systems (TACS) United Kingdom, China
C-450 West Germany, Portugal, South Africa
Radiocom 2000 France
RTMI Italy
Japan Total Access Communications System Japan
Table 4.7. 1G mobile technologies based on geographical area
During the development of 2G standards, European authorities have noticed the importance of the
technology harmonization in the continent. Thus, Global System for Mobile (GSM) has born to provide a
compatible technology in European continent. However, the success become much greater and the
technology also became popular outside of Europe. In contrast to Europe, United States has not focused
on development of a single digital mobile technology. Instead of that, American markets have incompatible
standards namely GSM, CDMA, iDEN (TDMA-based) and D-AMPS. As this two different approach rose in
different market, it is crucial to investigate what is the drivers of technology standardization and neutrality.
Harmonizing the technology provides plenty of advantages. First of all, the scale of economics creates great
impact for the market roll-out. As the technology have already determined, the industry players operate
their business activities in an environment where market uncertainty is minimized. Then, the firms have the
ability to align their strategy with the macro-environment fairly easy. Thus, the value creation ecosystems
have established rapidly. As a result, the products become widely available along with exploiting the cost
advantage of mass production. Secondly; from the consumer point of view, switching cost from one
supplier to another decreases as the products are more standardized. Thirdly, the mobile operators may
utilize infrastructure cooperation between operators which may reduce the costs significantly and move
the competition from infrastructure-based to service-based competition.
To exploit the advantages of technology harmonization frameworks, the regulatory authorities can favor a
technology to be deployed. For instance as we have mentioned, European authorities have developed a
common in-house technology for provision of digital mobile services (GSM Memorandum of
Understanding). To force the mobile operators to use this technology, the spectrum licenses may be
granted with technology specifications.
As a contrary approach, the regulators may not determine the technology that is deployed in the market.
Thus, the regulator provide space for competition between different standards in the market. Even though
this approach has more market uncertainty initially including slower roll-out, delay of reaching to scale of
economics and lack of infrastructure sharing opportunities, on the other hand this approach has its own
advantages. Firstly; if the regulator do not have the capability to choose the best technology standard,
there is a risk to choose an inferior technology to deploy which may lead to stay whole industry in an
underdeveloped phase. Thus, letting the market decide decreases the risks on the regulator. Secondly, at
the present time the interconnection between the technologies is feasible. Thirdly, the mobile operators
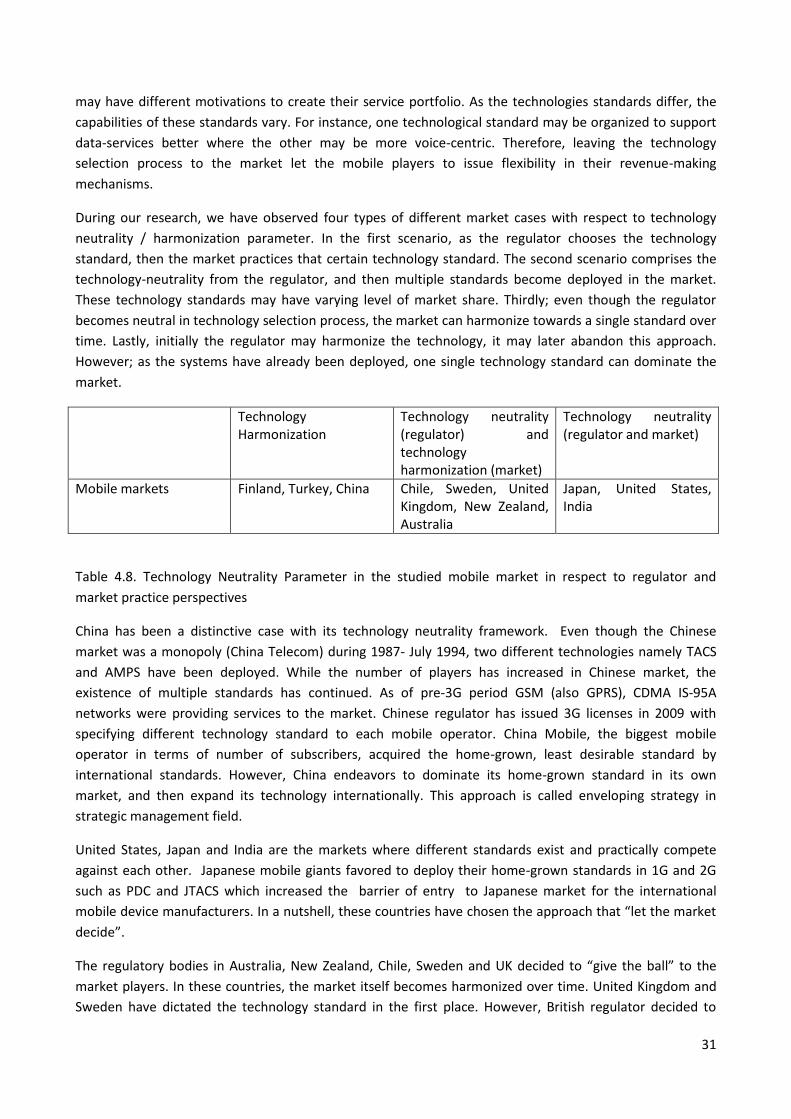
31
may have different motivations to create their service portfolio. As the technologies standards differ, the
capabilities of these standards vary. For instance, one technological standard may be organized to support
data-services better where the other may be more voice-centric. Therefore, leaving the technology
selection process to the market let the mobile players to issue flexibility in their revenue-making
mechanisms.
During our research, we have observed four types of different market cases with respect to technology
neutrality / harmonization parameter. In the first scenario, as the regulator chooses the technology
standard, then the market practices that certain technology standard. The second scenario comprises the
technology-neutrality from the regulator, and then multiple standards become deployed in the market.
These technology standards may have varying level of market share. Thirdly; even though the regulator
becomes neutral in technology selection process, the market can harmonize towards a single standard over
time. Lastly, initially the regulator may harmonize the technology, it may later abandon this approach.
However; as the systems have already been deployed, one single technology standard can dominate the
market.
Technology Harmonization
Technology neutrality (regulator) and technology harmonization (market)
Technology neutrality (regulator and market)
Mobile markets Finland, Turkey, China Chile, Sweden, United Kingdom, New Zealand, Australia
Japan, United States, India
Table 4.8. Technology Neutrality Parameter in the studied mobile market in respect to regulator and
market practice perspectives
China has been a distinctive case with its technology neutrality framework. Even though the Chinese
market was a monopoly (China Telecom) during 1987- July 1994, two different technologies namely TACS
and AMPS have been deployed. While the number of players has increased in Chinese market, the
existence of multiple standards has continued. As of pre-3G period GSM (also GPRS), CDMA IS-95A
networks were providing services to the market. Chinese regulator has issued 3G licenses in 2009 with
specifying different technology standard to each mobile operator. China Mobile, the biggest mobile
operator in terms of number of subscribers, acquired the home-grown, least desirable standard by
international standards. However, China endeavors to dominate its home-grown standard in its own
market, and then expand its technology internationally. This approach is called enveloping strategy in
strategic management field.
United States, Japan and India are the markets where different standards exist and practically compete
against each other. Japanese mobile giants favored to deploy their home-grown standards in 1G and 2G
such as PDC and JTACS which increased the barrier of entry to Japanese market for the international
mobile device manufacturers. In a nutshell, these countries have chosen the approach that “let the market
decide”.
The regulatory bodies in Australia, New Zealand, Chile, Sweden and UK decided to “give the ball” to the
market players. In these countries, the market itself becomes harmonized over time. United Kingdom and
Sweden have dictated the technology standard in the first place. However, British regulator decided to
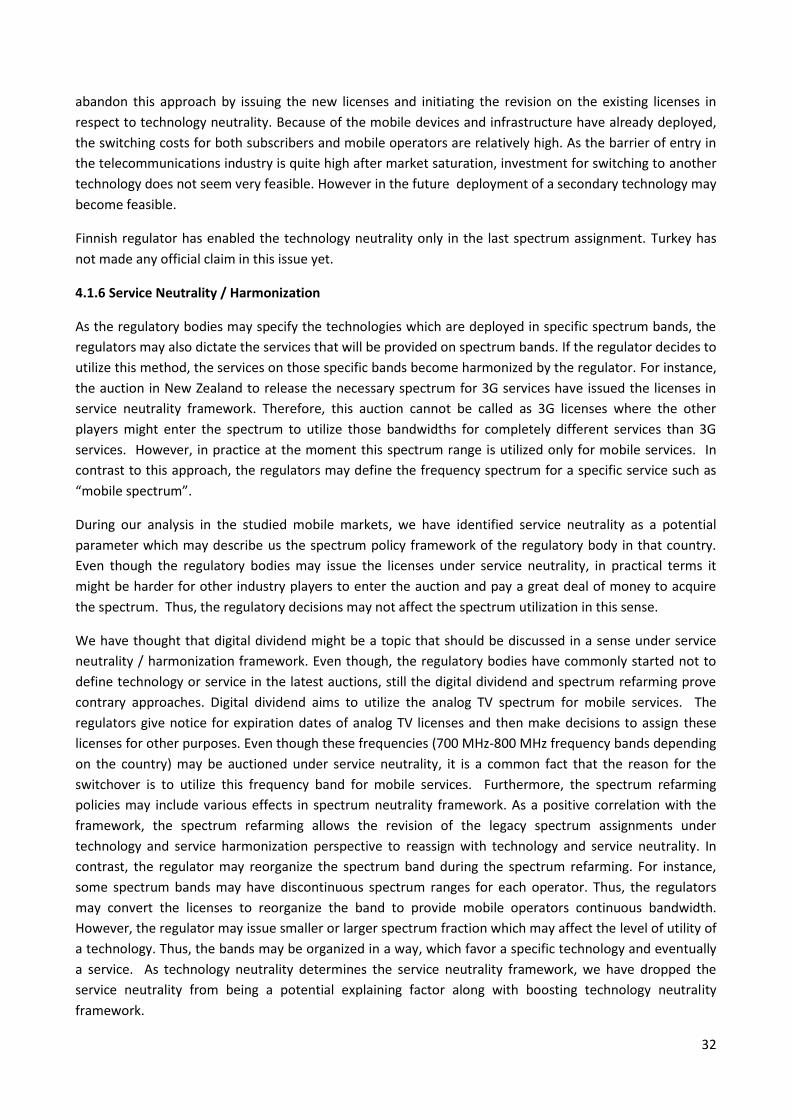
32
abandon this approach by issuing the new licenses and initiating the revision on the existing licenses in
respect to technology neutrality. Because of the mobile devices and infrastructure have already deployed,
the switching costs for both subscribers and mobile operators are relatively high. As the barrier of entry in
the telecommunications industry is quite high after market saturation, investment for switching to another
technology does not seem very feasible. However in the future deployment of a secondary technology may
become feasible.
Finnish regulator has enabled the technology neutrality only in the last spectrum assignment. Turkey has
not made any official claim in this issue yet.
4.1.6 Service Neutrality / Harmonization
As the regulatory bodies may specify the technologies which are deployed in specific spectrum bands, the
regulators may also dictate the services that will be provided on spectrum bands. If the regulator decides to
utilize this method, the services on those specific bands become harmonized by the regulator. For instance,
the auction in New Zealand to release the necessary spectrum for 3G services have issued the licenses in
service neutrality framework. Therefore, this auction cannot be called as 3G licenses where the other
players might enter the spectrum to utilize those bandwidths for completely different services than 3G
services. However, in practice at the moment this spectrum range is utilized only for mobile services. In
contrast to this approach, the regulators may define the frequency spectrum for a specific service such as
“mobile spectrum”.
During our analysis in the studied mobile markets, we have identified service neutrality as a potential
parameter which may describe us the spectrum policy framework of the regulatory body in that country.
Even though the regulatory bodies may issue the licenses under service neutrality, in practical terms it
might be harder for other industry players to enter the auction and pay a great deal of money to acquire
the spectrum. Thus, the regulatory decisions may not affect the spectrum utilization in this sense.
We have thought that digital dividend might be a topic that should be discussed in a sense under service
neutrality / harmonization framework. Even though, the regulatory bodies have commonly started not to
define technology or service in the latest auctions, still the digital dividend and spectrum refarming prove
contrary approaches. Digital dividend aims to utilize the analog TV spectrum for mobile services. The
regulators give notice for expiration dates of analog TV licenses and then make decisions to assign these
licenses for other purposes. Even though these frequencies (700 MHz-800 MHz frequency bands depending
on the country) may be auctioned under service neutrality, it is a common fact that the reason for the
switchover is to utilize this frequency band for mobile services. Furthermore, the spectrum refarming
policies may include various effects in spectrum neutrality framework. As a positive correlation with the
framework, the spectrum refarming allows the revision of the legacy spectrum assignments under
technology and service harmonization perspective to reassign with technology and service neutrality. In
contrast, the regulator may reorganize the spectrum band during the spectrum refarming. For instance,
some spectrum bands may have discontinuous spectrum ranges for each operator. Thus, the regulators
may convert the licenses to reorganize the band to provide mobile operators continuous bandwidth.
However, the regulator may issue smaller or larger spectrum fraction which may affect the level of utility of
a technology. Thus, the bands may be organized in a way, which favor a specific technology and eventually
a service. As technology neutrality determines the service neutrality framework, we have dropped the
service neutrality from being a potential explaining factor along with boosting technology neutrality
framework.
33
4.2 Market Structure Analysis
In this section, we will review the market structure parameters which are located in the y-axis of the phase
diagram for mobile market regulations. Firstly, we will introduce the existence of multinational operators in
the studied mobile markets. Then in an order we will go through the parameters; investments, mobile
prices, infrastructure sharing, ARPU, prepaid / postpaid ratio, mobile network portability (MNP), churn rate
and industry unbundling. Hence, we will examine these parameters in the studied countries finally to reach
the openness of mobile telecommunications industry.
4.2.1 Existence of Multinational Mobile Operators
Even though the regulators have decided to open up the mobile industries to the private sector in 1990s,
still the market players have been determined under the great power of the regulators. The regulators use
the spectrum assignment methods as a tool to specify the characteristics of the market players. For
instance, the regulator may follow a framework to issue the spectrum licenses only to the firms which are
funded by the national equity. This approach considers the telecommunications industry as a critical
importance for national security. Thus, this market structure is only one step forward than the state-owned
monopolies. Besides, the regulator may act in a more liberal manner allowing direct foreign investment in
its mobile market. Firstly, the regulator may allow the mobile operators which have foreign investment up
to certain level to operate in the market (such as 50% as a threshold). Joint ventures may be involved to
this category. Furthermore, the regulator may permit mobile operators which are completely based on
foreign direct investment.
Even though, the regulator allows the foreign investment in the telecommunications industry, still the
industry in the country should be attractive for the foreign investors to enter to the market. To assess the
attractiveness of the industry for a foreign entity, we may use PESTEL analysis which explains the macro
level environment. PESTEL analysis take into account macro level assessments with respect to political,
economical, social, technological, environmental and legal factors. The political factors comprise the level
of government intervention, political stability, tax policy, tariff regulations. The firms would prefer to
constitute their businesses in less bureaucratic markets. Economic factors include the economic growth,
exchange rates, inflation and interest rates. As the foreign investment is mostly looking for new areas to
make its business more profitable, the economic situation of the new potential market is crucial to reach
this target. Social factors implicate the cultural aspects, social behavior and population structure. Due to
offerings are provided to the new customers, the firm should be certain about the match between the
customer expectation and the firm offer. Thus in this way the firm is able to maximize the value of its
offering when the customer utility has been improved. Technology aspects become crucial in telecom
market in respect to the implementation of technological change and incentives. Environmental factors
may include weather conditions which affect the operating conditions of the mobile infrastructure and
devices. For instance, in the winter months, Finland may experience -25 degrees where in the summer
temperatures rise up to +30. Thus, the companies should sustain the operability of the services in both
extreme conditions. Legal factors comprise consumer laws, employment laws and antitrust laws.
If the conditions for a foreign entry are favorable, then the foreign entrant may observe the target market
as a potential to make business. By entering the new market, the foreign company becomes multinational
company structure. Thus the company may increase its overall profitability by leveraging on industry
expertise and economies of scale. Moreover, the company may diversify the revenue streams by possessing
operations in different markets. As we have explained the situation from the firm perspective, now we can
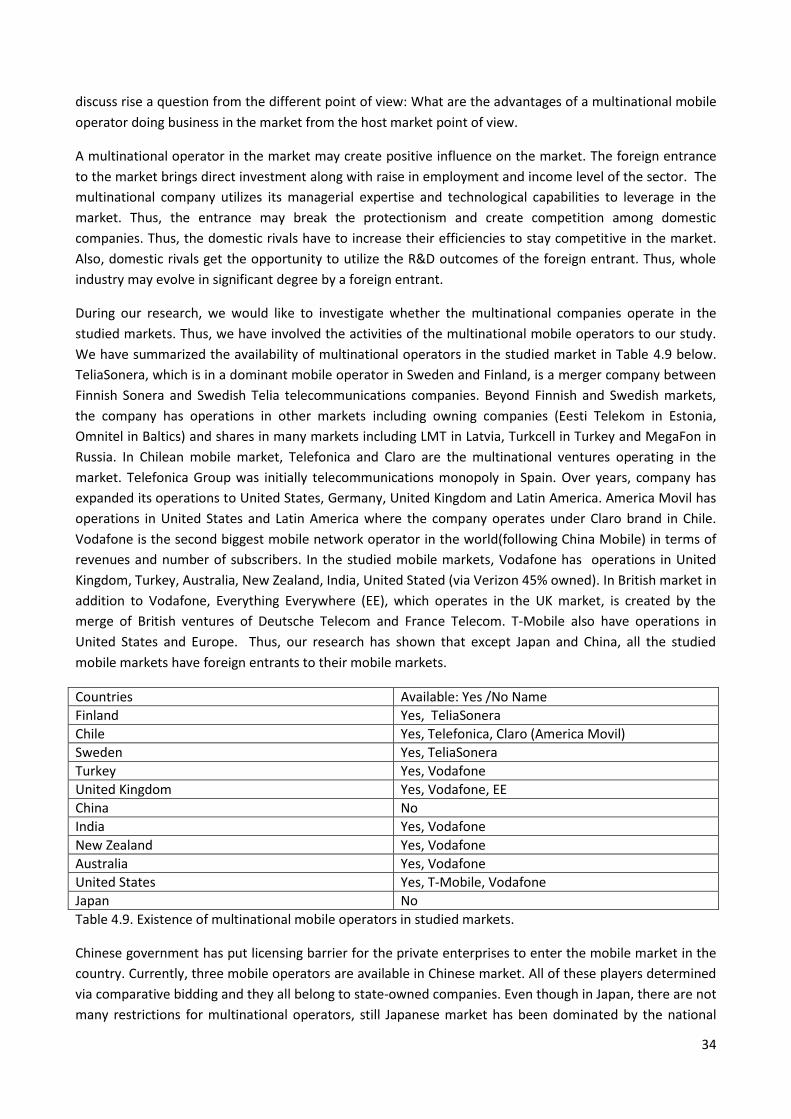
34
discuss rise a question from the different point of view: What are the advantages of a multinational mobile
operator doing business in the market from the host market point of view.
A multinational operator in the market may create positive influence on the market. The foreign entrance
to the market brings direct investment along with raise in employment and income level of the sector. The
multinational company utilizes its managerial expertise and technological capabilities to leverage in the
market. Thus, the entrance may break the protectionism and create competition among domestic
companies. Thus, the domestic rivals have to increase their efficiencies to stay competitive in the market.
Also, domestic rivals get the opportunity to utilize the R&D outcomes of the foreign entrant. Thus, whole
industry may evolve in significant degree by a foreign entrant.
During our research, we would like to investigate whether the multinational companies operate in the
studied markets. Thus, we have involved the activities of the multinational mobile operators to our study.
We have summarized the availability of multinational operators in the studied market in Table 4.9 below.
TeliaSonera, which is in a dominant mobile operator in Sweden and Finland, is a merger company between
Finnish Sonera and Swedish Telia telecommunications companies. Beyond Finnish and Swedish markets,
the company has operations in other markets including owning companies (Eesti Telekom in Estonia,
Omnitel in Baltics) and shares in many markets including LMT in Latvia, Turkcell in Turkey and MegaFon in
Russia. In Chilean mobile market, Telefonica and Claro are the multinational ventures operating in the
market. Telefonica Group was initially telecommunications monopoly in Spain. Over years, company has
expanded its operations to United States, Germany, United Kingdom and Latin America. America Movil has
operations in United States and Latin America where the company operates under Claro brand in Chile.
Vodafone is the second biggest mobile network operator in the world(following China Mobile) in terms of
revenues and number of subscribers. In the studied mobile markets, Vodafone has operations in United
Kingdom, Turkey, Australia, New Zealand, India, United Stated (via Verizon 45% owned). In British market in
addition to Vodafone, Everything Everywhere (EE), which operates in the UK market, is created by the
merge of British ventures of Deutsche Telecom and France Telecom. T-Mobile also have operations in
United States and Europe. Thus, our research has shown that except Japan and China, all the studied
mobile markets have foreign entrants to their mobile markets.
Countries Available: Yes /No Name
Finland Yes, TeliaSonera
Chile Yes, Telefonica, Claro (America Movil)
Sweden Yes, TeliaSonera
Turkey Yes, Vodafone
United Kingdom Yes, Vodafone, EE
China No
India Yes, Vodafone
New Zealand Yes, Vodafone
Australia Yes, Vodafone
United States Yes, T-Mobile, Vodafone
Japan No
Table 4.9. Existence of multinational mobile operators in studied markets.
Chinese government has put licensing barrier for the private enterprises to enter the mobile market in the
country. Currently, three mobile operators are available in Chinese market. All of these players determined
via comparative bidding and they all belong to state-owned companies. Even though in Japan, there are not
many restrictions for multinational operators, still Japanese market has been dominated by the national
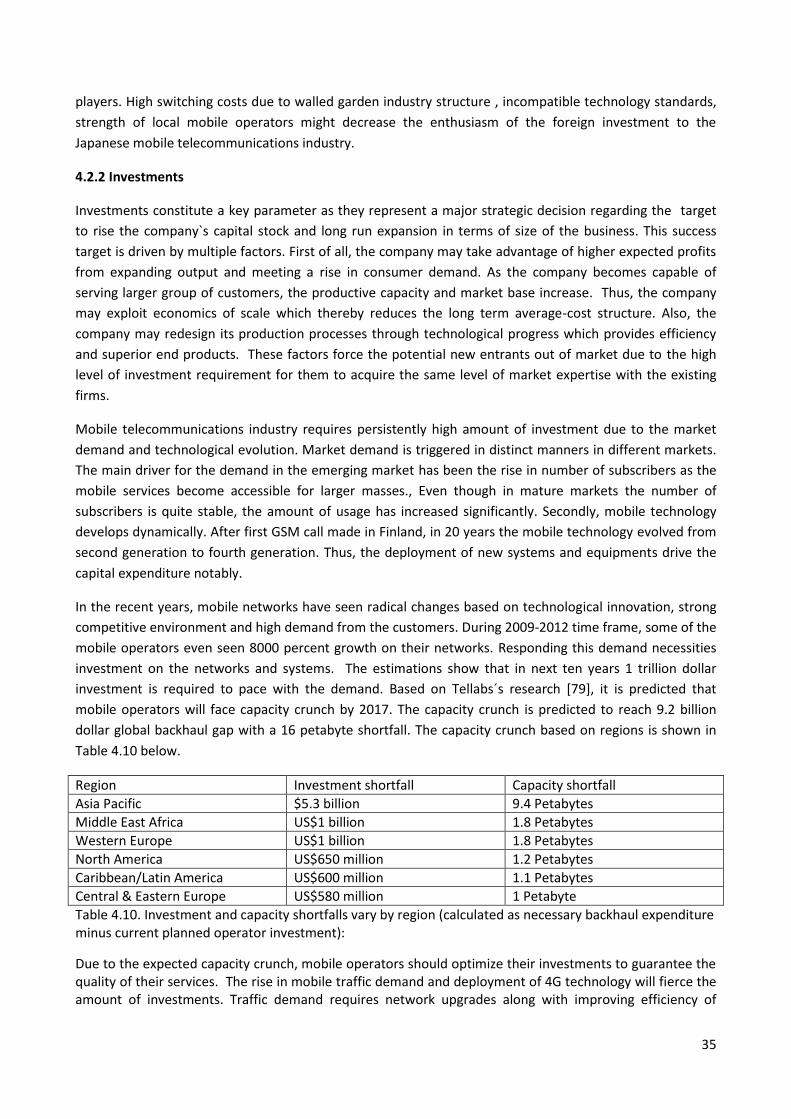
35
players. High switching costs due to walled garden industry structure , incompatible technology standards,
strength of local mobile operators might decrease the enthusiasm of the foreign investment to the
Japanese mobile telecommunications industry.
4.2.2 Investments
Investments constitute a key parameter as they represent a major strategic decision regarding the target
to rise the company`s capital stock and long run expansion in terms of size of the business. This success
target is driven by multiple factors. First of all, the company may take advantage of higher expected profits
from expanding output and meeting a rise in consumer demand. As the company becomes capable of
serving larger group of customers, the productive capacity and market base increase. Thus, the company
may exploit economics of scale which thereby reduces the long term average-cost structure. Also, the
company may redesign its production processes through technological progress which provides efficiency
and superior end products. These factors force the potential new entrants out of market due to the high
level of investment requirement for them to acquire the same level of market expertise with the existing
firms.
Mobile telecommunications industry requires persistently high amount of investment due to the market
demand and technological evolution. Market demand is triggered in distinct manners in different markets.
The main driver for the demand in the emerging market has been the rise in number of subscribers as the
mobile services become accessible for larger masses., Even though in mature markets the number of
subscribers is quite stable, the amount of usage has increased significantly. Secondly, mobile technology
develops dynamically. After first GSM call made in Finland, in 20 years the mobile technology evolved from
second generation to fourth generation. Thus, the deployment of new systems and equipments drive the
capital expenditure notably.
In the recent years, mobile networks have seen radical changes based on technological innovation, strong
competitive environment and high demand from the customers. During 2009-2012 time frame, some of the
mobile operators even seen 8000 percent growth on their networks. Responding this demand necessities
investment on the networks and systems. The estimations show that in next ten years 1 trillion dollar
investment is required to pace with the demand. Based on Tellabs´s research [79], it is predicted that
mobile operators will face capacity crunch by 2017. The capacity crunch is predicted to reach 9.2 billion
dollar global backhaul gap with a 16 petabyte shortfall. The capacity crunch based on regions is shown in
Table 4.10 below.
Region Investment shortfall Capacity shortfall
Asia Pacific $5.3 billion 9.4 Petabytes
Middle East Africa US$1 billion 1.8 Petabytes
Western Europe US$1 billion 1.8 Petabytes
North America US$650 million 1.2 Petabytes
Caribbean/Latin America US$600 million 1.1 Petabytes
Central & Eastern Europe US$580 million 1 Petabyte
Table 4.10. Investment and capacity shortfalls vary by region (calculated as necessary backhaul expenditure minus current planned operator investment):
Due to the expected capacity crunch, mobile operators should optimize their investments to guarantee the quality of their services. The rise in mobile traffic demand and deployment of 4G technology will fierce the amount of investments. Traffic demand requires network upgrades along with improving efficiency of
36
legacy deployments. Moving to 4G requires investments in radio access network and backhaul. Naturally, the mobile operators expect revenue growth as they accomplish these investments. However, there are some factors which reduce the level of return from these investments. Firstly, even though LTE systems are much simpler having lower operational costs, at the present time mobile operators should operate their 4G networks along with legacy platforms to support current services and customers. Hence, the co-existence of multiple platforms drives the costs significantly. To reduce these costs, mobile operators should advertise and give radical incentives to their customers to move to LTE networks for reducing the operating costs of legacy platforms. Secondly, mobile operators may outsource the services which do not provide competitive advantage to them in the market. In this way, the operational costs -such as inventory data management, data management, network engineering- reduce significantly.
As the differentiation factor in the mobile business is moving from network to the services domain, there is an opportunity for mobile operators to increase the level of infrastructure sharing and meanwhile focusing on mobile services. Mobile operators establish marketplace differentiation by offering new customer value propositions. Thus, operators may provide diverse portfolio of products and services which may diverse their revenue sources.
Since the mobile operators invest to their networks and services, they may reach better financial performance. First of all, the customer loyalty is improved as 40% of the mobile users listed the poor network performance as a reason to leave the mobile operator. Hence, sufficient investment in backhaul could reduce the churn rate from 4% to 7%. Revenue lost to customer churn is forecasted as 4 times higher than the backhaul investment required the customer demand. Besides, operating margins may be improved up to 5% if backhaul investment increases to meet traffic growth.
As we have discussed the importance of the investment in company level, right now we can direct our attention to the importance of the investments in industry level. As the individual players increase the level of investments to enhance their capabilities, the overall level of investment in the industry proportionally increases. Thus, the level of accumulated expertise in the industry creates higher revenues and contribution to the economy. With good expertise and financial resources, the industry may expand its operations to other markets. Thus, the multinational (or global) firms arise. We can assess multi-national operators under this category. Vodafone`s superior know-how has enabled to sustain successful operations in many markets. The mobile expertise in Nordic countries created global mobile players; Nokia and Ericsson.
In the context of our research, we have thought that the investment data in the studied countries may give insight about the mobile market structure [80]. Thus, we collected the relevant data via desktop search from OECD report, regulator, mobile operator, and news websites. Through our search, the investment information was one of the hardest parameter to obtain and validate.. Because in some markets such as Japan and Australia, mobile operators are horizontally integrated where they provide mobile services as well as fixed line services along with broadband services. Thus, they may not publish separate capital expenditure values for their mobile and fixed-line business segments. Additionally as we study in broad range of mobile markets, availability of the data for the same time period in all of the studied markets has risen as a crucial problem. To overcome this issue, we have focused on having the most up-to-date available data for the mobile markets to visualize the present level of investments in the mobile markets. When we revise the markets, we have noticed that the markets may be in different stages of the deployment of network platforms as the mobile markets are in the different phase to transition to 3G and 4G platforms. Hence, this approach has also supported our idea to utilize most up-to-date data in the mobile network investment. Lastly, we have excluded spectrum fees out of investment parameter to reach pure capital expenditure value.
As we have collected relevant investment data in our research, firstly we have started to form Table 4.11 below. In this table, we have summarized the amount of mobile network investment in the studied countries. To standardize the data, we have determined euro as the currency. Thus, we have converted
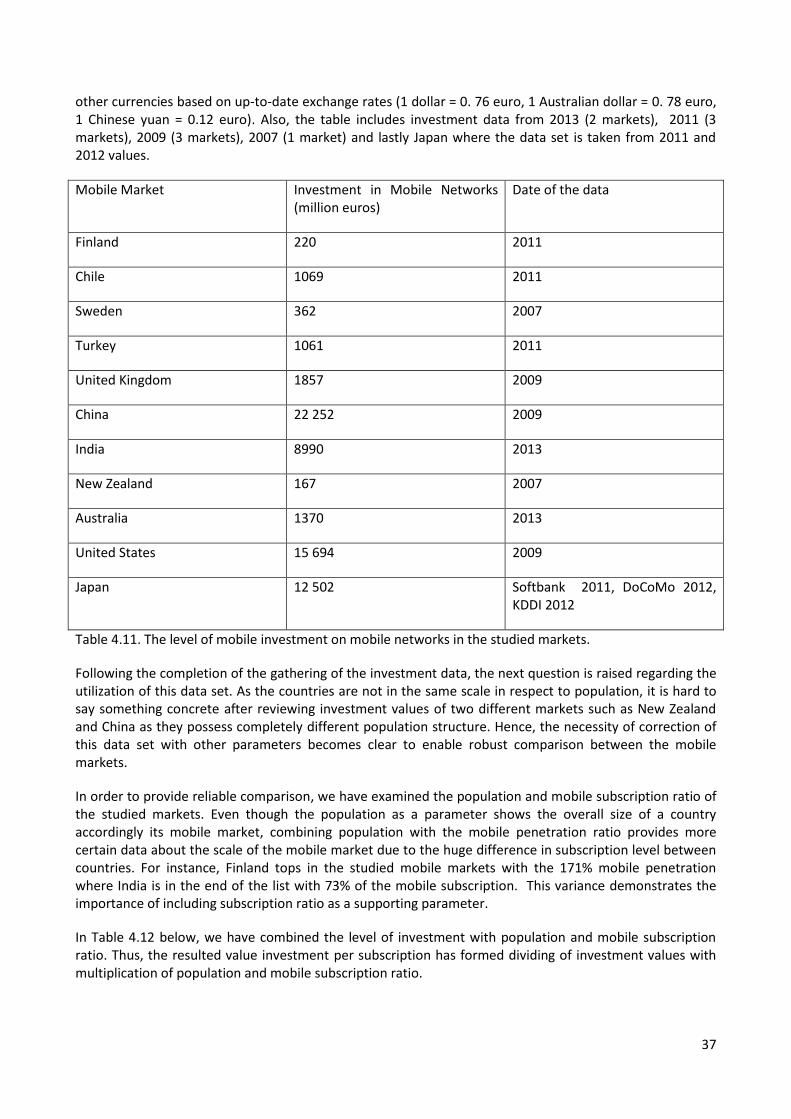
37
other currencies based on up-to-date exchange rates (1 dollar = 0. 76 euro, 1 Australian dollar = 0. 78 euro, 1 Chinese yuan = 0.12 euro). Also, the table includes investment data from 2013 (2 markets), 2011 (3 markets), 2009 (3 markets), 2007 (1 market) and lastly Japan where the data set is taken from 2011 and 2012 values.
Mobile Market Investment in Mobile Networks (million euros)
Date of the data
Finland 220 2011
Chile 1069 2011
Sweden 362 2007
Turkey 1061 2011
United Kingdom 1857 2009
China 22 252 2009
India 8990 2013
New Zealand 167 2007
Australia 1370 2013
United States 15 694 2009
Japan 12 502 Softbank 2011, DoCoMo 2012, KDDI 2012
Table 4.11. The level of mobile investment on mobile networks in the studied markets.
Following the completion of the gathering of the investment data, the next question is raised regarding the utilization of this data set. As the countries are not in the same scale in respect to population, it is hard to say something concrete after reviewing investment values of two different markets such as New Zealand and China as they possess completely different population structure. Hence, the necessity of correction of this data set with other parameters becomes clear to enable robust comparison between the mobile markets.
In order to provide reliable comparison, we have examined the population and mobile subscription ratio of the studied markets. Even though the population as a parameter shows the overall size of a country accordingly its mobile market, combining population with the mobile penetration ratio provides more certain data about the scale of the mobile market due to the huge difference in subscription level between countries. For instance, Finland tops in the studied mobile markets with the 171% mobile penetration where India is in the end of the list with 73% of the mobile subscription. This variance demonstrates the importance of including subscription ratio as a supporting parameter.
In Table 4.12 below, we have combined the level of investment with population and mobile subscription ratio. Thus, the resulted value investment per subscription has formed dividing of investment values with multiplication of population and mobile subscription ratio.
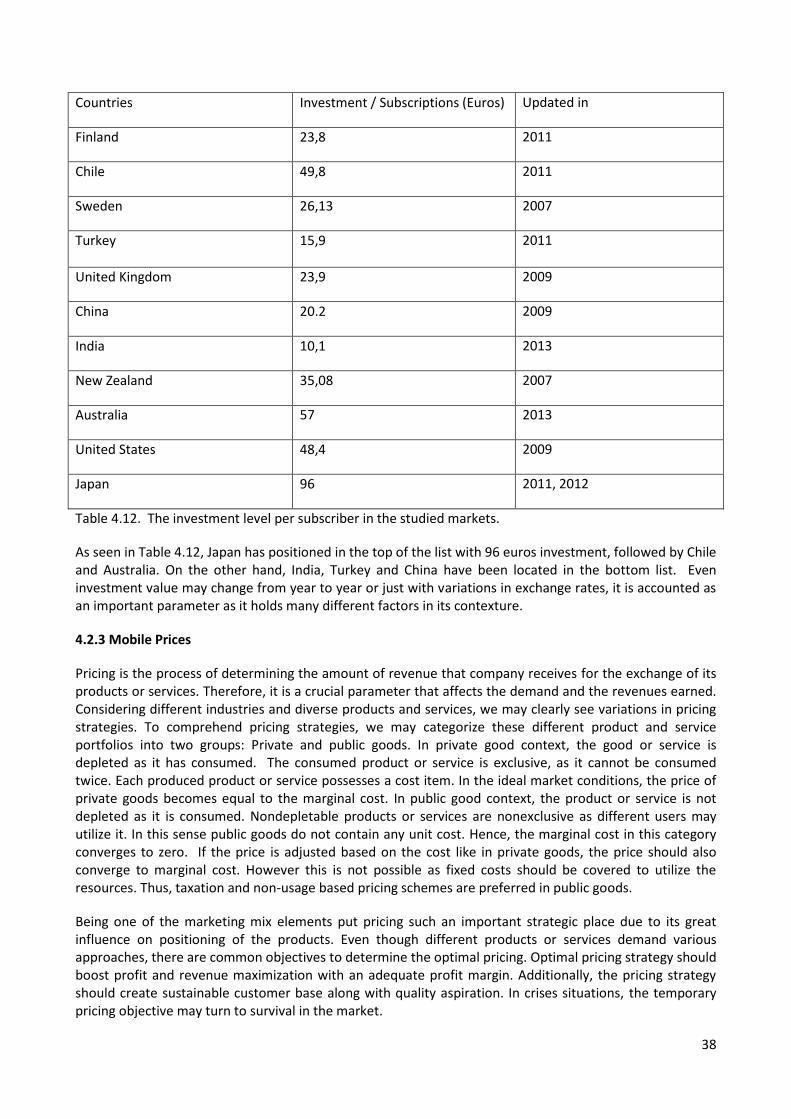
38
Countries Investment / Subscriptions (Euros) Updated in
Finland 23,8 2011
Chile 49,8 2011
Sweden 26,13 2007
Turkey 15,9 2011
United Kingdom 23,9 2009
China 20.2 2009
India 10,1 2013
New Zealand 35,08 2007
Australia 57 2013
United States 48,4 2009
Japan 96 2011, 2012
Table 4.12. The investment level per subscriber in the studied markets.
As seen in Table 4.12, Japan has positioned in the top of the list with 96 euros investment, followed by Chile and Australia. On the other hand, India, Turkey and China have been located in the bottom list. Even investment value may change from year to year or just with variations in exchange rates, it is accounted as an important parameter as it holds many different factors in its contexture.
4.2.3 Mobile Prices
Pricing is the process of determining the amount of revenue that company receives for the exchange of its products or services. Therefore, it is a crucial parameter that affects the demand and the revenues earned. Considering different industries and diverse products and services, we may clearly see variations in pricing strategies. To comprehend pricing strategies, we may categorize these different product and service portfolios into two groups: Private and public goods. In private good context, the good or service is depleted as it has consumed. The consumed product or service is exclusive, as it cannot be consumed twice. Each produced product or service possesses a cost item. In the ideal market conditions, the price of private goods becomes equal to the marginal cost. In public good context, the product or service is not depleted as it is consumed. Nondepletable products or services are nonexclusive as different users may utilize it. In this sense public goods do not contain any unit cost. Hence, the marginal cost in this category converges to zero. If the price is adjusted based on the cost like in private goods, the price should also converge to marginal cost. However this is not possible as fixed costs should be covered to utilize the resources. Thus, taxation and non-usage based pricing schemes are preferred in public goods.
Being one of the marketing mix elements put pricing such an important strategic place due to its great influence on positioning of the products. Even though different products or services demand various approaches, there are common objectives to determine the optimal pricing. Optimal pricing strategy should boost profit and revenue maximization with an adequate profit margin. Additionally, the pricing strategy should create sustainable customer base along with quality aspiration. In crises situations, the temporary pricing objective may turn to survival in the market.
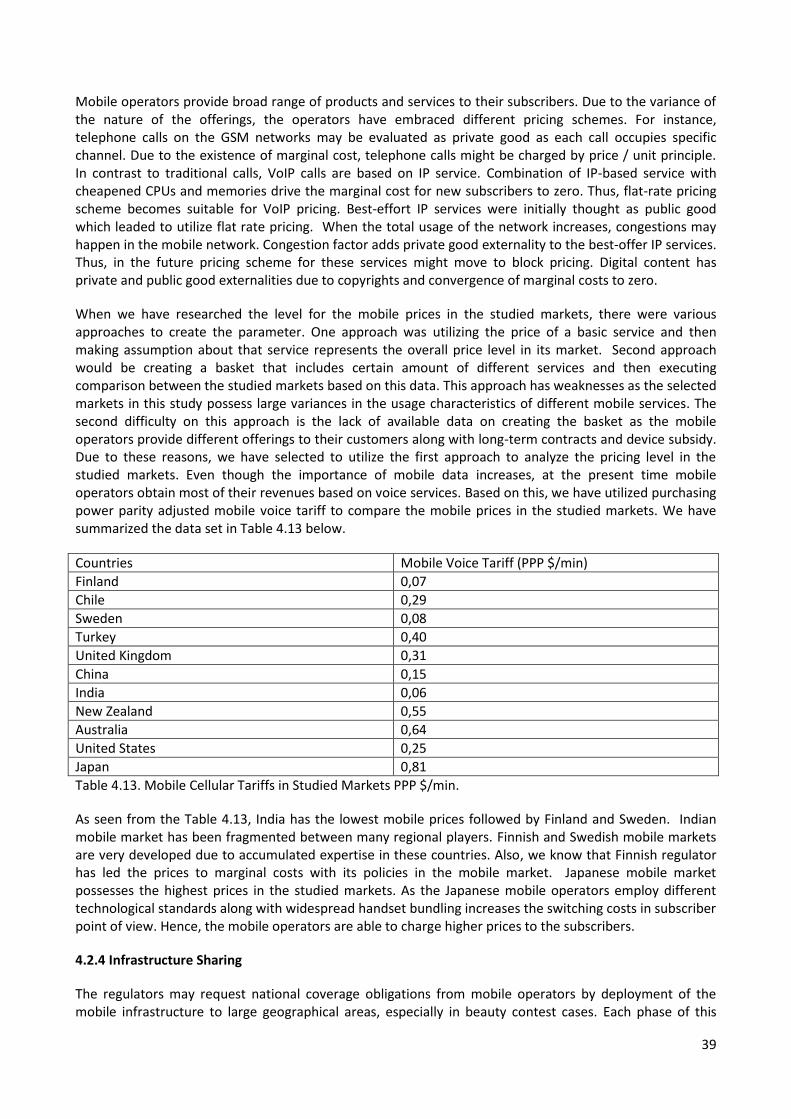
39
Mobile operators provide broad range of products and services to their subscribers. Due to the variance of the nature of the offerings, the operators have embraced different pricing schemes. For instance, telephone calls on the GSM networks may be evaluated as private good as each call occupies specific channel. Due to the existence of marginal cost, telephone calls might be charged by price / unit principle. In contrast to traditional calls, VoIP calls are based on IP service. Combination of IP-based service with cheapened CPUs and memories drive the marginal cost for new subscribers to zero. Thus, flat-rate pricing scheme becomes suitable for VoIP pricing. Best-effort IP services were initially thought as public good which leaded to utilize flat rate pricing. When the total usage of the network increases, congestions may happen in the mobile network. Congestion factor adds private good externality to the best-offer IP services. Thus, in the future pricing scheme for these services might move to block pricing. Digital content has private and public good externalities due to copyrights and convergence of marginal costs to zero.
When we have researched the level for the mobile prices in the studied markets, there were various approaches to create the parameter. One approach was utilizing the price of a basic service and then making assumption about that service represents the overall price level in its market. Second approach would be creating a basket that includes certain amount of different services and then executing comparison between the studied markets based on this data. This approach has weaknesses as the selected markets in this study possess large variances in the usage characteristics of different mobile services. The second difficulty on this approach is the lack of available data on creating the basket as the mobile operators provide different offerings to their customers along with long-term contracts and device subsidy. Due to these reasons, we have selected to utilize the first approach to analyze the pricing level in the studied markets. Even though the importance of mobile data increases, at the present time mobile operators obtain most of their revenues based on voice services. Based on this, we have utilized purchasing power parity adjusted mobile voice tariff to compare the mobile prices in the studied markets. We have summarized the data set in Table 4.13 below.
Countries Mobile Voice Tariff (PPP $/min)
Finland 0,07
Chile 0,29
Sweden 0,08
Turkey 0,40
United Kingdom 0,31
China 0,15
India 0,06
New Zealand 0,55
Australia 0,64
United States 0,25
Japan 0,81
Table 4.13. Mobile Cellular Tariffs in Studied Markets PPP $/min.
As seen from the Table 4.13, India has the lowest mobile prices followed by Finland and Sweden. Indian mobile market has been fragmented between many regional players. Finnish and Swedish mobile markets are very developed due to accumulated expertise in these countries. Also, we know that Finnish regulator has led the prices to marginal costs with its policies in the mobile market. Japanese mobile market possesses the highest prices in the studied markets. As the Japanese mobile operators employ different technological standards along with widespread handset bundling increases the switching costs in subscriber point of view. Hence, the mobile operators are able to charge higher prices to the subscribers.
4.2.4 Infrastructure Sharing
The regulators may request national coverage obligations from mobile operators by deployment of the mobile infrastructure to large geographical areas, especially in beauty contest cases. Each phase of this
40
process: procurement, deployment and operations require the use of big amount of financial resources. Hence, the operator should optimize these deployed resources to reach superior financial performance. In some areas the network is not used optimally due to sparse subscriber base or irregular traffic demand. Improving the level of network utilizations provides significant cost savings to the mobile operators. Cost saving advantages pushes mobile operators and regulators to boast the infrastructure sharing mechanisms.
During our research, we have commonly come across that regulators give incentives for such infrastructure sharing. Such as Swedish regulator has put coverage obligation during the 3G-spectrum assignment process. So that, Swedish mobile operator can fulfill this obligation via roaming to another network in certain level. Also in Sweden, there are joint ventures by the mobile operators to provide mobile services. However, it is hard to proof that infrastructure sharing is commonly practiced in all studied countries. For instance, in Turkey there was a trial to operate base stations via outsourcing and sharing the operational costs. Due to the idea of protecting the competitive advantage in-house, the market players have not embraced this approach.
During the research process, we have noticed that it is hard to differentiate the level of infrastructure sharing practiced in the studied countries. Permission or recommendation of the regulator is not adequate information to reflect the real situation ongoing in the market. Additionally, the conditions of infrastructure sharing agreements may not be publicly available. Due to this reasons, we have concluded that infrastructure sharing as a parameter is not very transparent and certain. Thus, infrastructure sharing is eliminated from being an explaining factor.
Even though we do not have enough data to process infrastructure sharing as a parameter, it will become more and more import in the near future. Since the congestions in the network become more probable as the data services drive up, the need for offloading of mobile traffic to other networks including WLAN and fixed networks will become more feasible. In this way, infrastructure sharing with other communications service providers will be operable. Thus, the mobile operators may overcome the capacity problem in certain conditions.
4.2.5 Average Revenue per User
Average Revenue per User or shortly ARPU is a finance-related parameter that analyzes revenue generation per subscriber level. ARPU provides a way of tracking the revenue growth as a result of promotions and supplemental services. In this way, investors may identify the revenue generation potential of certain products or services. As shown in Equation 4.3, along with number of subscribers, ARPU is a key factor in company revenues.
Total Revenue = ARPU X Number of Subscribers (Equation 4.3)
ARPU is commonly utilized by telecommunications and internet companies to analyze their revenue performance. In this way, the mobile operators are able to assess their relative performance among the competitors` performances. In principle, mobile operators would like to create products or services which increase their ARPU level at the same time avoiding the actions which may result lower ARPU. However, recently mobile operators has raised permanent decline in their revenue streams.
Even though ARPU is a widely-used parameter that is officially announced by regulators and mobile operators, there may be some variations in calculation methods. Ideally, ARPU should be calculated as division of revenues by the number of user that contributes the revenue stream during the calculated period. However in some situations, it is calculated based on the subscribers in the beginning or end of the period. Even the average of subscribers in the beginning and end of the calculated period is utilized to reach the final number of subscribers. Furthermore, the revenues which originate other than subscribers may lead misunderstandings in the assessment of revenue generation. Lastly even though the collected
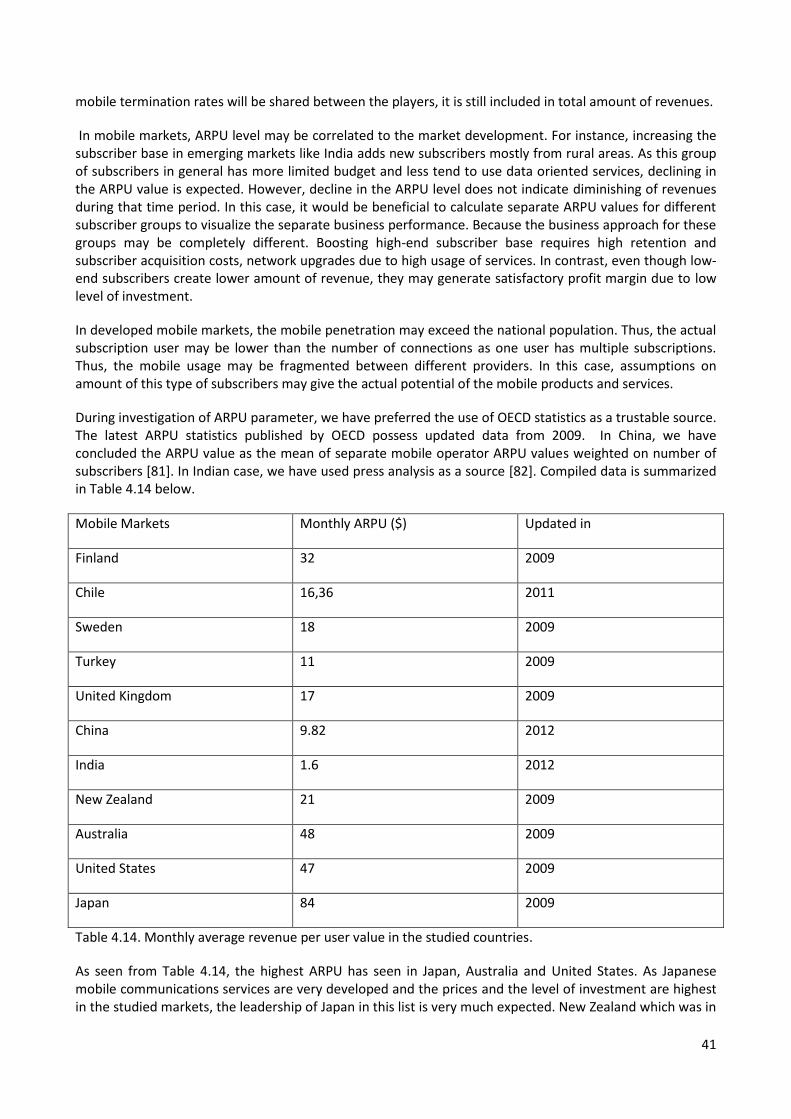
41
mobile termination rates will be shared between the players, it is still included in total amount of revenues.
In mobile markets, ARPU level may be correlated to the market development. For instance, increasing the subscriber base in emerging markets like India adds new subscribers mostly from rural areas. As this group of subscribers in general has more limited budget and less tend to use data oriented services, declining in the ARPU value is expected. However, decline in the ARPU level does not indicate diminishing of revenues during that time period. In this case, it would be beneficial to calculate separate ARPU values for different subscriber groups to visualize the separate business performance. Because the business approach for these groups may be completely different. Boosting high-end subscriber base requires high retention and subscriber acquisition costs, network upgrades due to high usage of services. In contrast, even though low-end subscribers create lower amount of revenue, they may generate satisfactory profit margin due to low level of investment.
In developed mobile markets, the mobile penetration may exceed the national population. Thus, the actual subscription user may be lower than the number of connections as one user has multiple subscriptions. Thus, the mobile usage may be fragmented between different providers. In this case, assumptions on amount of this type of subscribers may give the actual potential of the mobile products and services.
During investigation of ARPU parameter, we have preferred the use of OECD statistics as a trustable source. The latest ARPU statistics published by OECD possess updated data from 2009. In China, we have concluded the ARPU value as the mean of separate mobile operator ARPU values weighted on number of subscribers [81]. In Indian case, we have used press analysis as a source [82]. Compiled data is summarized in Table 4.14 below.
Mobile Markets Monthly ARPU ($) Updated in
Finland 32 2009
Chile 16,36 2011
Sweden 18 2009
Turkey 11 2009
United Kingdom 17 2009
China 9.82 2012
India 1.6 2012
New Zealand 21 2009
Australia 48 2009
United States 47 2009
Japan 84 2009
Table 4.14. Monthly average revenue per user value in the studied countries.
As seen from Table 4.14, the highest ARPU has seen in Japan, Australia and United States. As Japanese mobile communications services are very developed and the prices and the level of investment are highest in the studied markets, the leadership of Japan in this list is very much expected. New Zealand which was in
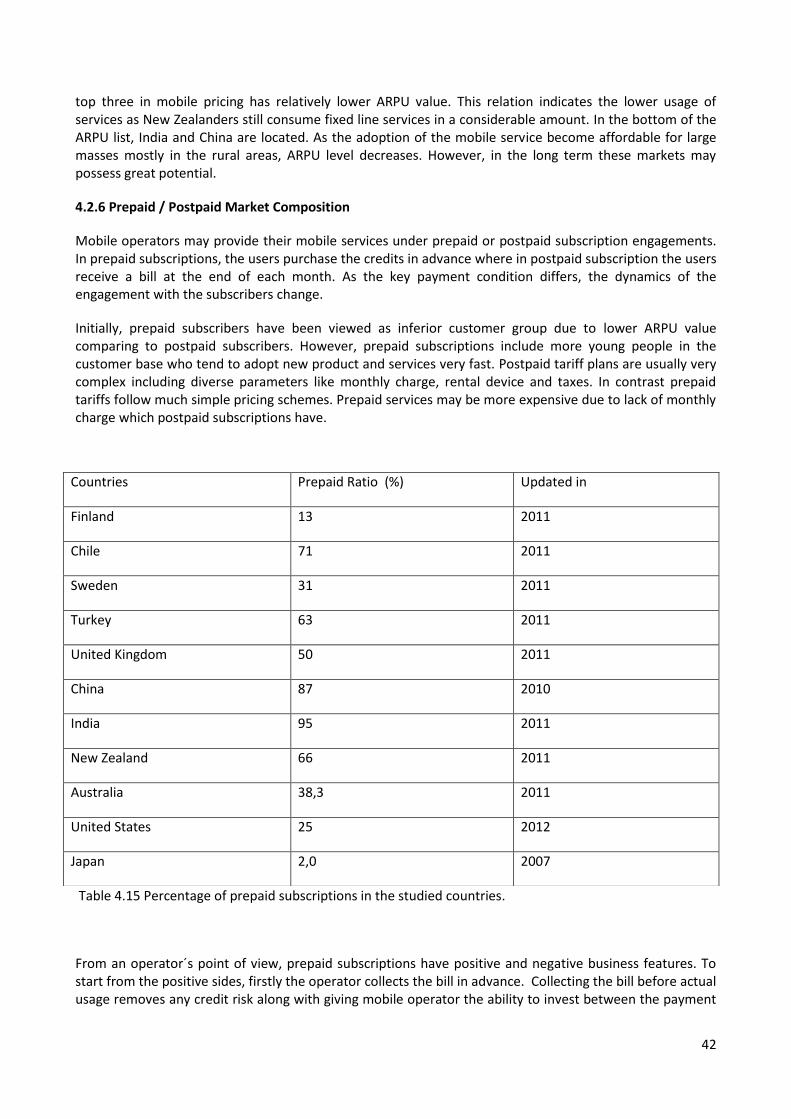
42
top three in mobile pricing has relatively lower ARPU value. This relation indicates the lower usage of services as New Zealanders still consume fixed line services in a considerable amount. In the bottom of the ARPU list, India and China are located. As the adoption of the mobile service become affordable for large masses mostly in the rural areas, ARPU level decreases. However, in the long term these markets may possess great potential.
4.2.6 Prepaid / Postpaid Market Composition
Mobile operators may provide their mobile services under prepaid or postpaid subscription engagements. In prepaid subscriptions, the users purchase the credits in advance where in postpaid subscription the users receive a bill at the end of each month. As the key payment condition differs, the dynamics of the engagement with the subscribers change.
Initially, prepaid subscribers have been viewed as inferior customer group due to lower ARPU value comparing to postpaid subscribers. However, prepaid subscriptions include more young people in the customer base who tend to adopt new product and services very fast. Postpaid tariff plans are usually very complex including diverse parameters like monthly charge, rental device and taxes. In contrast prepaid tariffs follow much simple pricing schemes. Prepaid services may be more expensive due to lack of monthly charge which postpaid subscriptions have.
Table 4.15 Percentage of prepaid subscriptions in the studied countries.
From an operator´s point of view, prepaid subscriptions have positive and negative business features. To start from the positive sides, firstly the operator collects the bill in advance. Collecting the bill before actual usage removes any credit risk along with giving mobile operator the ability to invest between the payment
Countries Prepaid Ratio (%) Updated in
Finland 13 2011
Chile 71 2011
Sweden 31 2011
Turkey 63 2011
United Kingdom 50 2011
China 87 2010
India 95 2011
New Zealand 66 2011
Australia 38,3 2011
United States 25 2012
Japan 2,0 2007
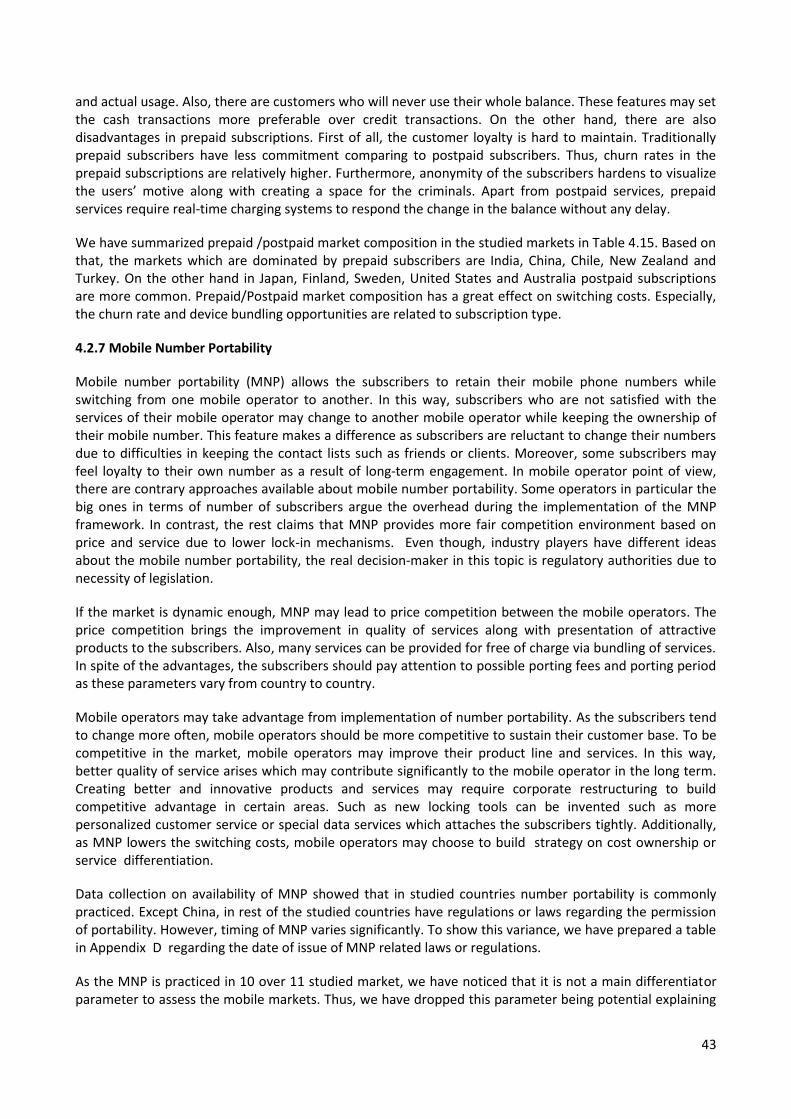
43
and actual usage. Also, there are customers who will never use their whole balance. These features may set the cash transactions more preferable over credit transactions. On the other hand, there are also disadvantages in prepaid subscriptions. First of all, the customer loyalty is hard to maintain. Traditionally prepaid subscribers have less commitment comparing to postpaid subscribers. Thus, churn rates in the prepaid subscriptions are relatively higher. Furthermore, anonymity of the subscribers hardens to visualize the users’ motive along with creating a space for the criminals. Apart from postpaid services, prepaid services require real-time charging systems to respond the change in the balance without any delay.
We have summarized prepaid /postpaid market composition in the studied markets in Table 4.15. Based on that, the markets which are dominated by prepaid subscribers are India, China, Chile, New Zealand and Turkey. On the other hand in Japan, Finland, Sweden, United States and Australia postpaid subscriptions are more common. Prepaid/Postpaid market composition has a great effect on switching costs. Especially, the churn rate and device bundling opportunities are related to subscription type.
4.2.7 Mobile Number Portability
Mobile number portability (MNP) allows the subscribers to retain their mobile phone numbers while switching from one mobile operator to another. In this way, subscribers who are not satisfied with the services of their mobile operator may change to another mobile operator while keeping the ownership of their mobile number. This feature makes a difference as subscribers are reluctant to change their numbers due to difficulties in keeping the contact lists such as friends or clients. Moreover, some subscribers may feel loyalty to their own number as a result of long-term engagement. In mobile operator point of view, there are contrary approaches available about mobile number portability. Some operators in particular the big ones in terms of number of subscribers argue the overhead during the implementation of the MNP framework. In contrast, the rest claims that MNP provides more fair competition environment based on price and service due to lower lock-in mechanisms. Even though, industry players have different ideas about the mobile number portability, the real decision-maker in this topic is regulatory authorities due to necessity of legislation.
If the market is dynamic enough, MNP may lead to price competition between the mobile operators. The price competition brings the improvement in quality of services along with presentation of attractive products to the subscribers. Also, many services can be provided for free of charge via bundling of services. In spite of the advantages, the subscribers should pay attention to possible porting fees and porting period as these parameters vary from country to country.
Mobile operators may take advantage from implementation of number portability. As the subscribers tend to change more often, mobile operators should be more competitive to sustain their customer base. To be competitive in the market, mobile operators may improve their product line and services. In this way, better quality of service arises which may contribute significantly to the mobile operator in the long term. Creating better and innovative products and services may require corporate restructuring to build competitive advantage in certain areas. Such as new locking tools can be invented such as more personalized customer service or special data services which attaches the subscribers tightly. Additionally, as MNP lowers the switching costs, mobile operators may choose to build strategy on cost ownership or service differentiation.
Data collection on availability of MNP showed that in studied countries number portability is commonly practiced. Except China, in rest of the studied countries have regulations or laws regarding the permission of portability. However, timing of MNP varies significantly. To show this variance, we have prepared a table in Appendix D regarding the date of issue of MNP related laws or regulations.
As the MNP is practiced in 10 over 11 studied market, we have noticed that it is not a main differentiator parameter to assess the mobile markets. Thus, we have dropped this parameter being potential explaining
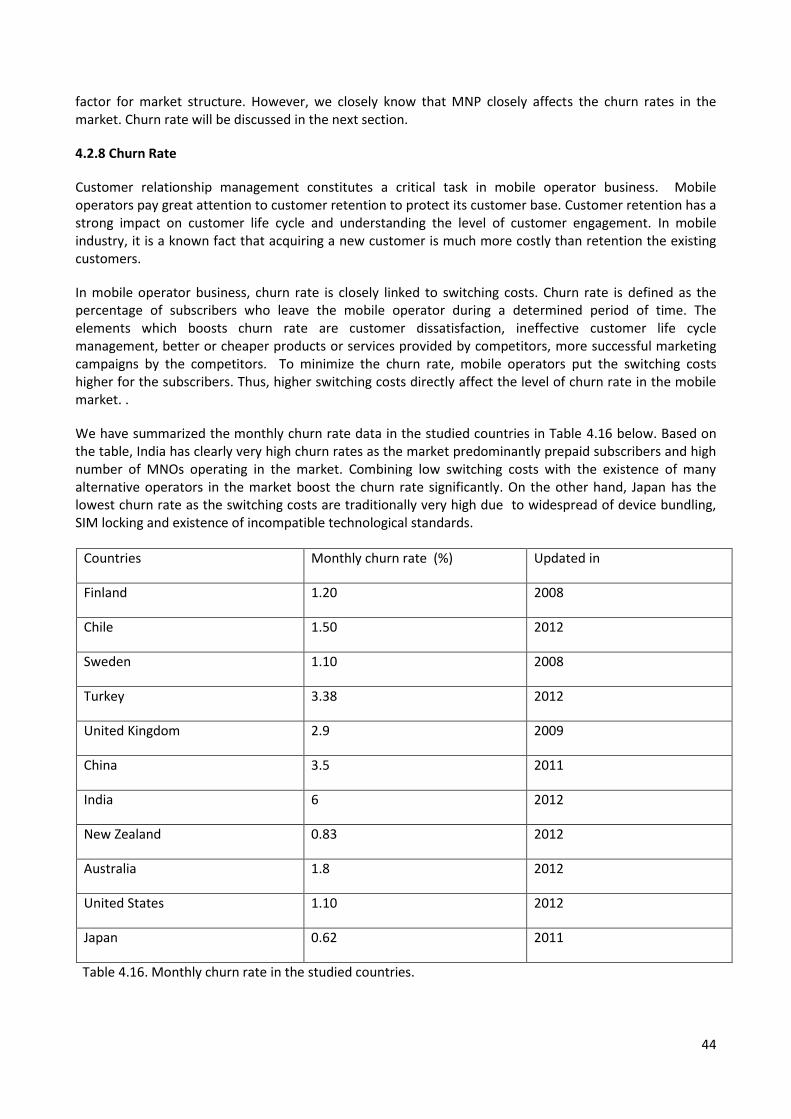
44
factor for market structure. However, we closely know that MNP closely affects the churn rates in the market. Churn rate will be discussed in the next section.
4.2.8 Churn Rate
Customer relationship management constitutes a critical task in mobile operator business. Mobile operators pay great attention to customer retention to protect its customer base. Customer retention has a strong impact on customer life cycle and understanding the level of customer engagement. In mobile industry, it is a known fact that acquiring a new customer is much more costly than retention the existing customers.
In mobile operator business, churn rate is closely linked to switching costs. Churn rate is defined as the percentage of subscribers who leave the mobile operator during a determined period of time. The elements which boosts churn rate are customer dissatisfaction, ineffective customer life cycle management, better or cheaper products or services provided by competitors, more successful marketing campaigns by the competitors. To minimize the churn rate, mobile operators put the switching costs higher for the subscribers. Thus, higher switching costs directly affect the level of churn rate in the mobile market. .
We have summarized the monthly churn rate data in the studied countries in Table 4.16 below. Based on the table, India has clearly very high churn rates as the market predominantly prepaid subscribers and high number of MNOs operating in the market. Combining low switching costs with the existence of many alternative operators in the market boost the churn rate significantly. On the other hand, Japan has the lowest churn rate as the switching costs are traditionally very high due to widespread of device bundling, SIM locking and existence of incompatible technological standards.
Countries Monthly churn rate (%) Updated in
Finland 1.20 2008
Chile 1.50 2012
Sweden 1.10 2008
Turkey 3.38 2012
United Kingdom 2.9 2009
China 3.5 2011
India 6 2012
New Zealand 0.83 2012
Australia 1.8 2012
United States 1.10 2012
Japan 0.62 2011
Table 4.16. Monthly churn rate in the studied countries.
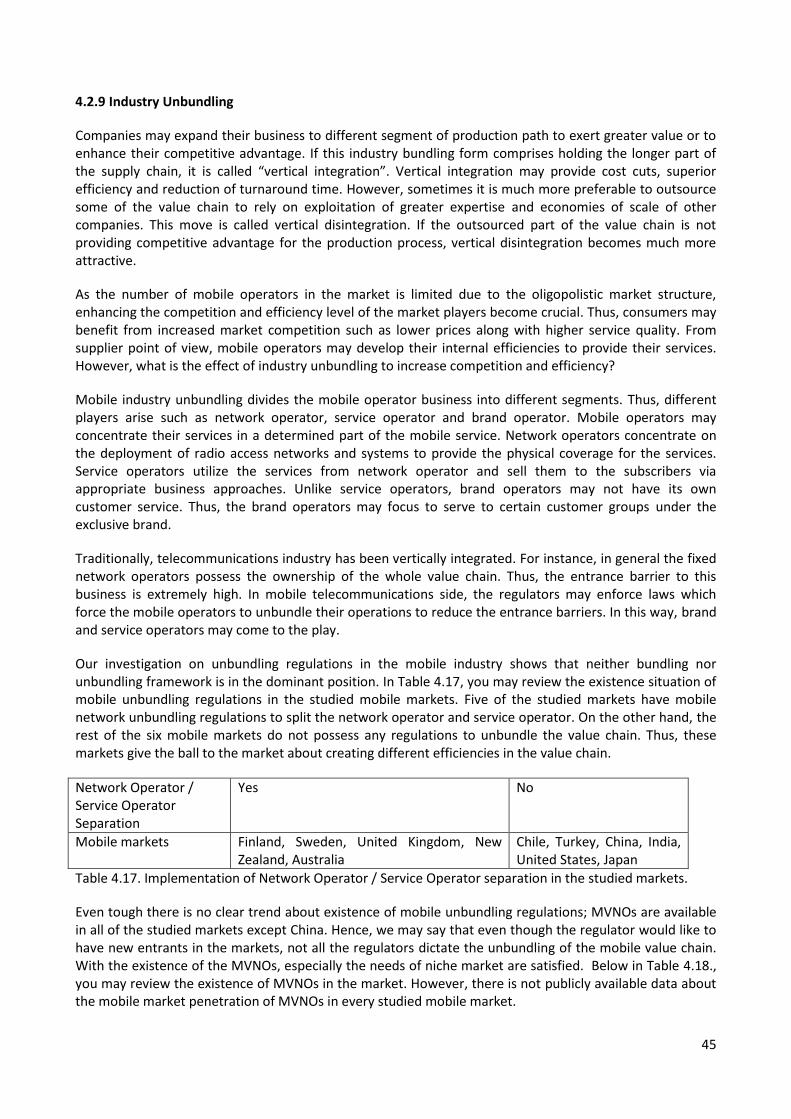
45
4.2.9 Industry Unbundling
Companies may expand their business to different segment of production path to exert greater value or to enhance their competitive advantage. If this industry bundling form comprises holding the longer part of the supply chain, it is called “vertical integration”. Vertical integration may provide cost cuts, superior efficiency and reduction of turnaround time. However, sometimes it is much more preferable to outsource some of the value chain to rely on exploitation of greater expertise and economies of scale of other companies. This move is called vertical disintegration. If the outsourced part of the value chain is not providing competitive advantage for the production process, vertical disintegration becomes much more attractive.
As the number of mobile operators in the market is limited due to the oligopolistic market structure, enhancing the competition and efficiency level of the market players become crucial. Thus, consumers may benefit from increased market competition such as lower prices along with higher service quality. From supplier point of view, mobile operators may develop their internal efficiencies to provide their services. However, what is the effect of industry unbundling to increase competition and efficiency?
Mobile industry unbundling divides the mobile operator business into different segments. Thus, different players arise such as network operator, service operator and brand operator. Mobile operators may concentrate their services in a determined part of the mobile service. Network operators concentrate on the deployment of radio access networks and systems to provide the physical coverage for the services. Service operators utilize the services from network operator and sell them to the subscribers via appropriate business approaches. Unlike service operators, brand operators may not have its own customer service. Thus, the brand operators may focus to serve to certain customer groups under the exclusive brand.
Traditionally, telecommunications industry has been vertically integrated. For instance, in general the fixed network operators possess the ownership of the whole value chain. Thus, the entrance barrier to this business is extremely high. In mobile telecommunications side, the regulators may enforce laws which force the mobile operators to unbundle their operations to reduce the entrance barriers. In this way, brand and service operators may come to the play.
Our investigation on unbundling regulations in the mobile industry shows that neither bundling nor unbundling framework is in the dominant position. In Table 4.17, you may review the existence situation of mobile unbundling regulations in the studied mobile markets. Five of the studied markets have mobile network unbundling regulations to split the network operator and service operator. On the other hand, the rest of the six mobile markets do not possess any regulations to unbundle the value chain. Thus, these markets give the ball to the market about creating different efficiencies in the value chain.
Network Operator / Service Operator Separation
Yes No
Mobile markets Finland, Sweden, United Kingdom, New Zealand, Australia
Chile, Turkey, China, India, United States, Japan
Table 4.17. Implementation of Network Operator / Service Operator separation in the studied markets.
Even tough there is no clear trend about existence of mobile unbundling regulations; MVNOs are available in all of the studied markets except China. Hence, we may say that even though the regulator would like to have new entrants in the markets, not all the regulators dictate the unbundling of the mobile value chain. With the existence of the MVNOs, especially the needs of niche market are satisfied. Below in Table 4.18., you may review the existence of MVNOs in the market. However, there is not publicly available data about the mobile market penetration of MVNOs in every studied mobile market.
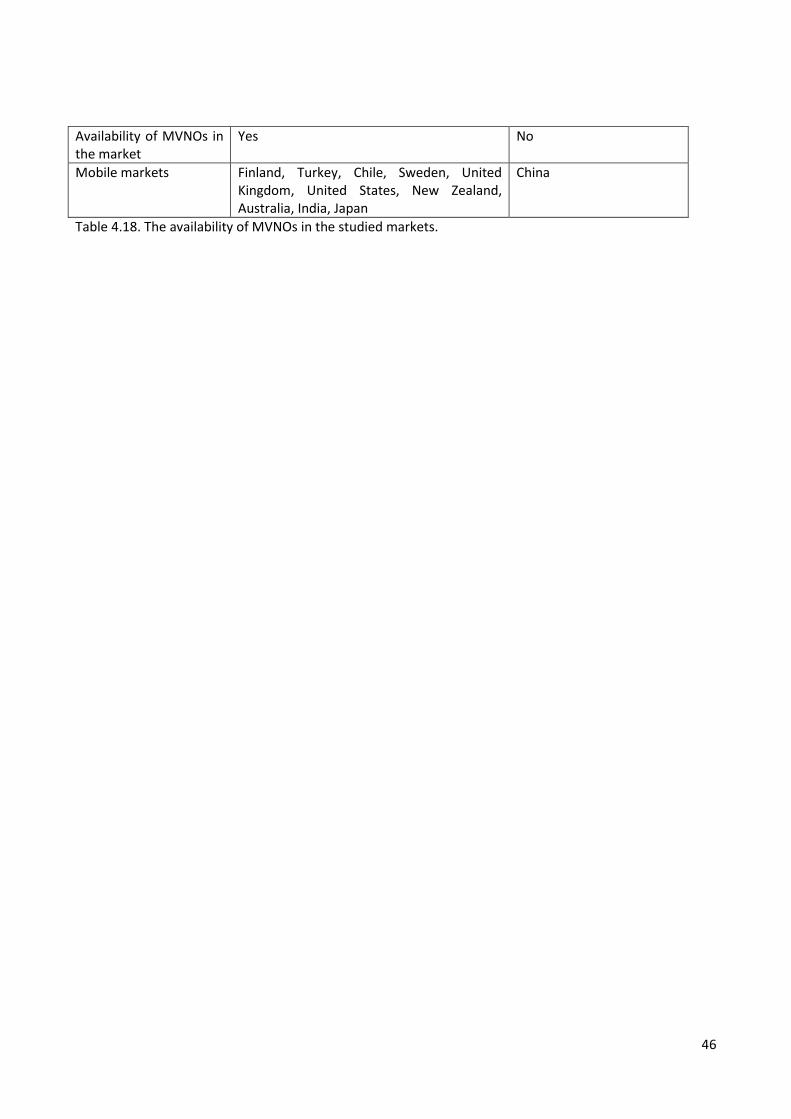
46
Availability of MVNOs in the market
Yes No
Mobile markets Finland, Turkey, Chile, Sweden, United Kingdom, United States, New Zealand, Australia, India, Japan
China
Table 4.18. The availability of MVNOs in the studied markets.
47
5. CONCLUSIONS
In this chapter, we present the results of this research study and our recommendation for further research.
5.1. Results
In this chapter, we will evaluate spectrum policy and market structure parameters placed in phase diagram
for mobile telecom regulation. The evaluation on the parameters will accomplish to determine the
explaining factors which reflect the insight of the mobile market parameters. With the utilization of the
explaining factors, we will be able to make comparative analysis on the case mobile markets. We discuss all
the results proceeding from the previous academic studies as well as our own analysis in this study.
To begin with, we will analyze the parameters regarding to spectrum policy to finalize with the relevant
explaining factor. The spectrum policy parameters, which we will evaluate, are market share composition,
Herfindahl-Hirschmann Index (HHI), reselling rights, technology and service neutrality / harmonization
characteristics.Here, the explaining factor should bring out the spectrum policy based on the level of
spectrum decentralization in the mobile market.
First of all, we have started our analysis by handling spectrum-HHI parameter. Spectrum-HHI describes the
spectrum concentration between the market players in a straightforward way. Lungborg et al. has
explained that spectrum holdings in different frequency bands constitute considerable differences. Thereof,
the total amount of spectrum of each player is not adequate to present neither the competitive advantage
of each player nor the spectrum policy in the market.
Theoretically, reselling rights sustain efficiency on the spectrum allocation over time by allowing spectrum
trading in a dynamic and liberal way. Therefore, mobile operators get the opportunity to optimize their
spectrum holdings by maximizing the synergy between the frequency bands. Australia and New Zealand
have emerged as pioneer markets by defining the spectrum reselling rights long ago. Even though, the
reselling rights have enabled spectrum transactions in these markets, still Australian market possesses the
most concentrated spectrum band among the case markets in this study (spectrum-HHI value for Australia
is 3806). In New Zealand case, spectrum-HHI value points 2558 which is higher than United States, Sweden,
India and Chile. Hence, at the moment we may argue that the reselling rights have no clear effects on
spectrum decentralization. Due to this fact, we are excluding the reselling rights from spectrum policy
analysis. Nevertheless, we assess this parameter as it may potentially affect the spectrum decentralization
at a time when the secondary spectrum trading markets rollout in the rest of the mobile markets.
Technology harmonization and neutrality regulations vary from market to market. In these regards, we
have put the studied mobile markets into three categories: technology-neutral mobile markets, technology-
harmonized mobile markets and the markets where the technology harmonized by the market forces. As
mobile technologies may have different spectrum requirements; the composition of the spectrum holding
as well as technology harmonization and neutrality framework become crucial. As the selection of
technological standard determines the basics of the services which can be provided over the network,
these services influence the market share of the mobile operators.
Spectrum holdings and overall spectrum concentration in the market constitutes for mobile operators a
base to provide services to the subscribers. Lungborg et al. stated that spectrum allocation have a clear
effect on competitiveness of the mobile operators. Surely, market share is a key parameter to present the
competitiveness of the mobile operators. Market share composition among the players is well-explained
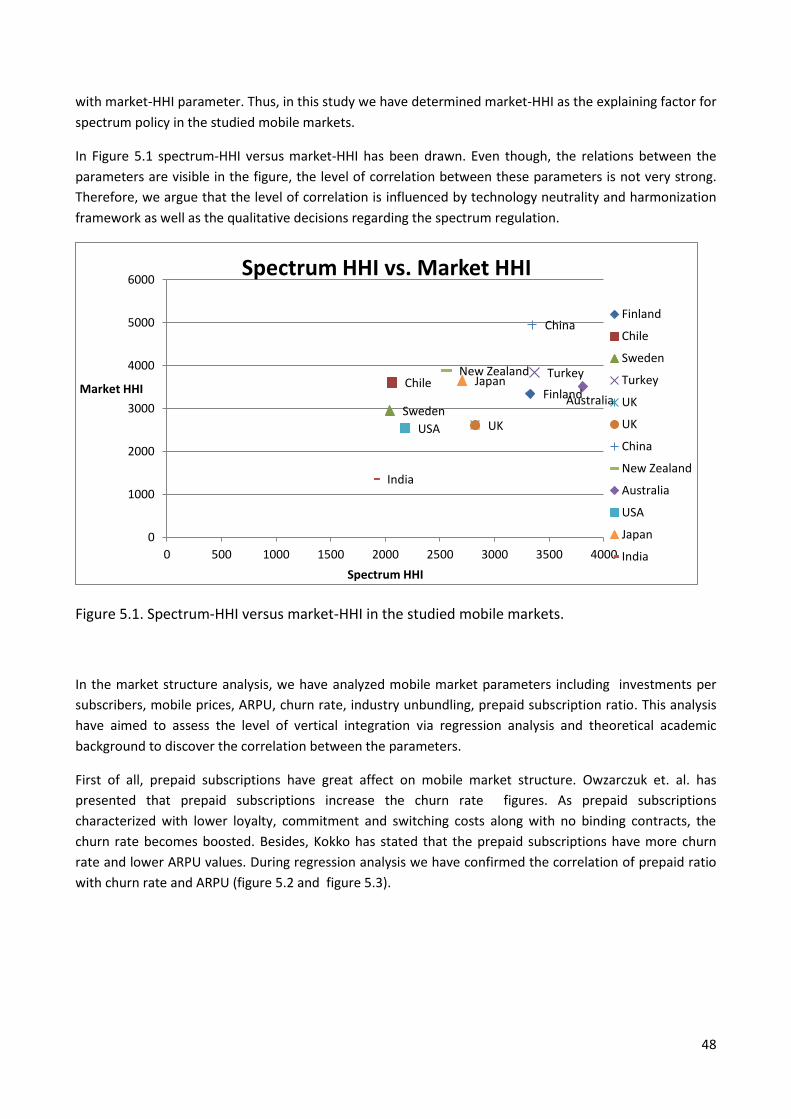
48
with market-HHI parameter. Thus, in this study we have determined market-HHI as the explaining factor for
spectrum policy in the studied mobile markets.
In Figure 5.1 spectrum-HHI versus market-HHI has been drawn. Even though, the relations between the
parameters are visible in the figure, the level of correlation between these parameters is not very strong.
Therefore, we argue that the level of correlation is influenced by technology neutrality and harmonization
framework as well as the qualitative decisions regarding the spectrum regulation.
Figure 5.1. Spectrum-HHI versus market-HHI in the studied mobile markets.
In the market structure analysis, we have analyzed mobile market parameters including investments per
subscribers, mobile prices, ARPU, churn rate, industry unbundling, prepaid subscription ratio. This analysis
have aimed to assess the level of vertical integration via regression analysis and theoretical academic
background to discover the correlation between the parameters.
First of all, prepaid subscriptions have great affect on mobile market structure. Owzarczuk et. al. has
presented that prepaid subscriptions increase the churn rate figures. As prepaid subscriptions
characterized with lower loyalty, commitment and switching costs along with no binding contracts, the
churn rate becomes boosted. Besides, Kokko has stated that the prepaid subscriptions have more churn
rate and lower ARPU values. During regression analysis we have confirmed the correlation of prepaid ratio
with churn rate and ARPU (figure 5.2 and figure 5.3).
Finland Chile
Sweden
Turkey
UK
China
New Zealand
Australia
USA
Japan
India
0
1000
2000
3000
4000
5000
6000
0 500 1000 1500 2000 2500 3000 3500 4000
Market HHI
Spectrum HHI
Spectrum HHI vs. Market HHI
Finland
Chile
Sweden
Turkey
UK
UK
China
New Zealand
Australia
USA
Japan
India
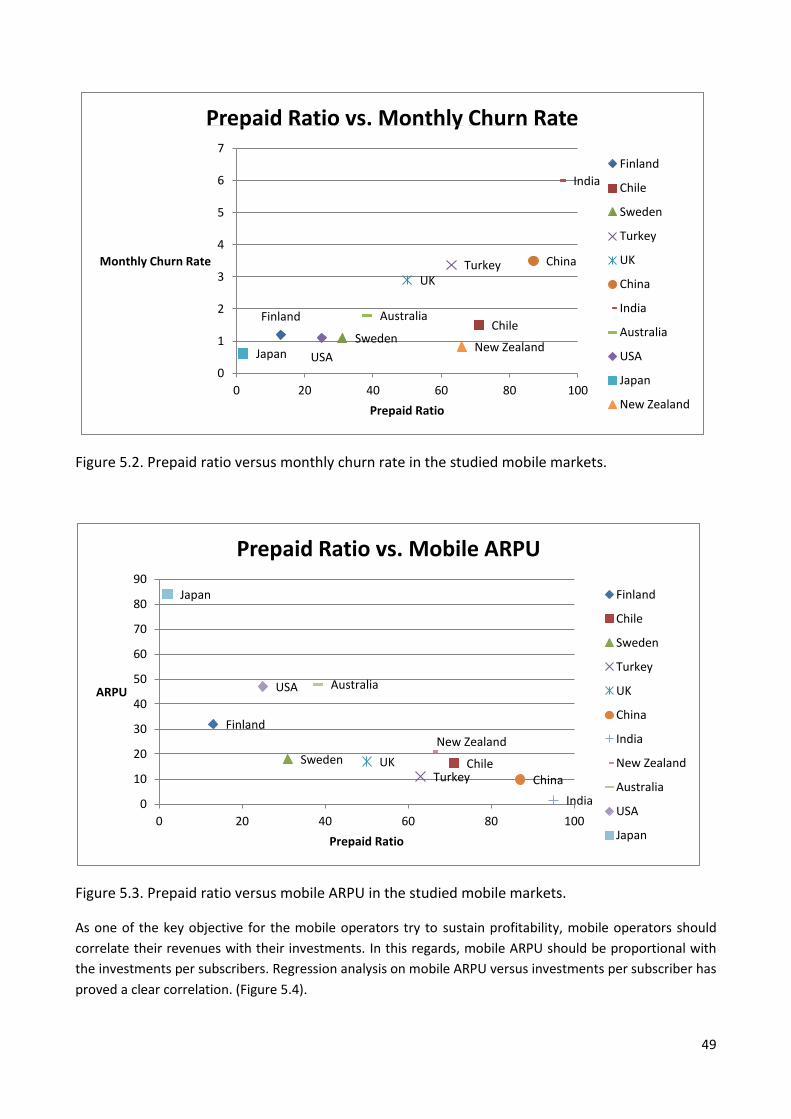
49
Figure 5.2. Prepaid ratio versus monthly churn rate in the studied mobile markets.
Figure 5.3. Prepaid ratio versus mobile ARPU in the studied mobile markets.
As one of the key objective for the mobile operators try to sustain profitability, mobile operators should
correlate their revenues with their investments. In this regards, mobile ARPU should be proportional with
the investments per subscribers. Regression analysis on mobile ARPU versus investments per subscriber has
proved a clear correlation. (Figure 5.4).
Finland Chile
Sweden
Turkey UK
China
India
Australia
USA Japan New Zealand
0
1
2
3
4
5
6
7
0 20 40 60 80 100
Monthly Churn Rate
Prepaid Ratio
Prepaid Ratio vs. Monthly Churn Rate
Finland
Chile
Sweden
Turkey
UK
China
India
Australia
USA
Japan
New Zealand
Finland
Chile Sweden
Turkey UK
China
India
New Zealand
Australia USA
Japan
0
10
20
30
40
50
60
70
80
90
0 20 40 60 80 100
ARPU
Prepaid Ratio
Prepaid Ratio vs. Mobile ARPU
Finland
Chile
Sweden
Turkey
UK
China
India
New Zealand
Australia
USA
Japan
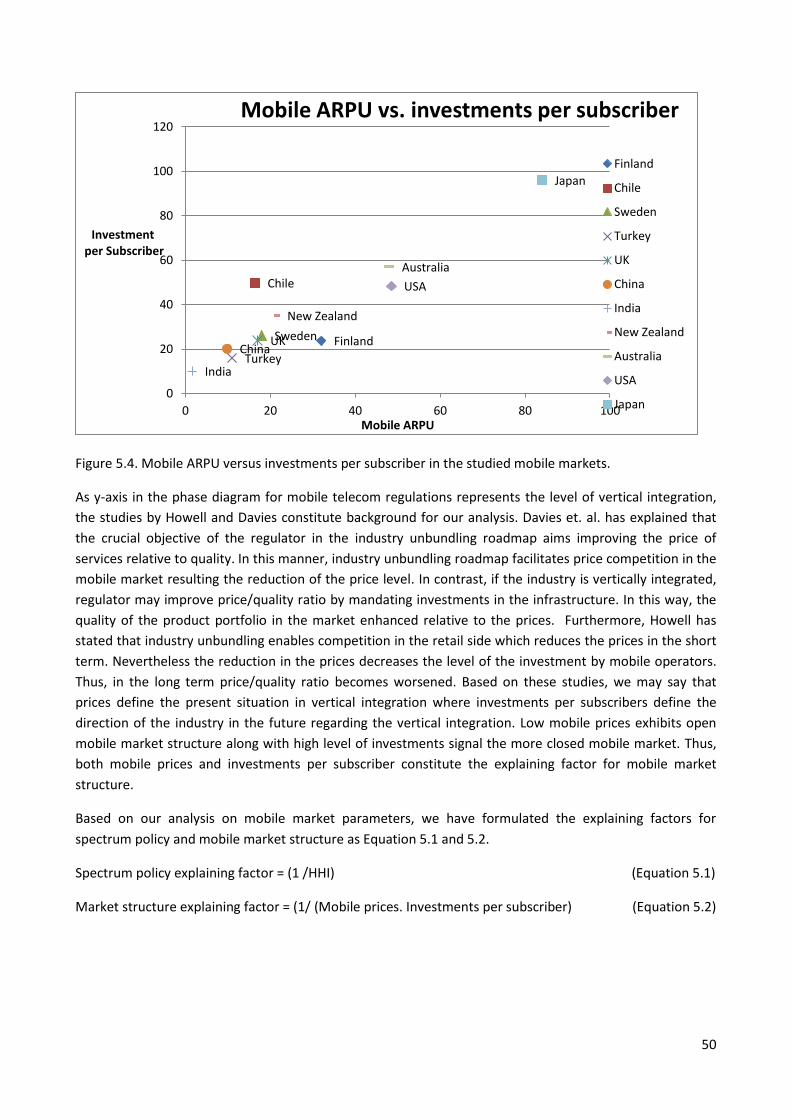
50
Figure 5.4. Mobile ARPU versus investments per subscriber in the studied mobile markets.
As y-axis in the phase diagram for mobile telecom regulations represents the level of vertical integration,
the studies by Howell and Davies constitute background for our analysis. Davies et. al. has explained that
the crucial objective of the regulator in the industry unbundling roadmap aims improving the price of
services relative to quality. In this manner, industry unbundling roadmap facilitates price competition in the
mobile market resulting the reduction of the price level. In contrast, if the industry is vertically integrated,
regulator may improve price/quality ratio by mandating investments in the infrastructure. In this way, the
quality of the product portfolio in the market enhanced relative to the prices. Furthermore, Howell has
stated that industry unbundling enables competition in the retail side which reduces the prices in the short
term. Nevertheless the reduction in the prices decreases the level of the investment by mobile operators.
Thus, in the long term price/quality ratio becomes worsened. Based on these studies, we may say that
prices define the present situation in vertical integration where investments per subscribers define the
direction of the industry in the future regarding the vertical integration. Low mobile prices exhibits open
mobile market structure along with high level of investments signal the more closed mobile market. Thus,
both mobile prices and investments per subscriber constitute the explaining factor for mobile market
structure.
Based on our analysis on mobile market parameters, we have formulated the explaining factors for
spectrum policy and mobile market structure as Equation 5.1 and 5.2.
Spectrum policy explaining factor = (1 /HHI) (Equation 5.1)
Market structure explaining factor = (1/ (Mobile prices. Investments per subscriber) (Equation 5.2)
Finland
Chile
Sweden
Turkey
UK China
India
New Zealand
Australia
USA
Japan
0
20
40
60
80
100
120
0 20 40 60 80 100
Investment per Subscriber
Mobile ARPU
Mobile ARPU vs. investments per subscriber
Finland
Chile
Sweden
Turkey
UK
China
India
New Zealand
Australia
USA
Japan
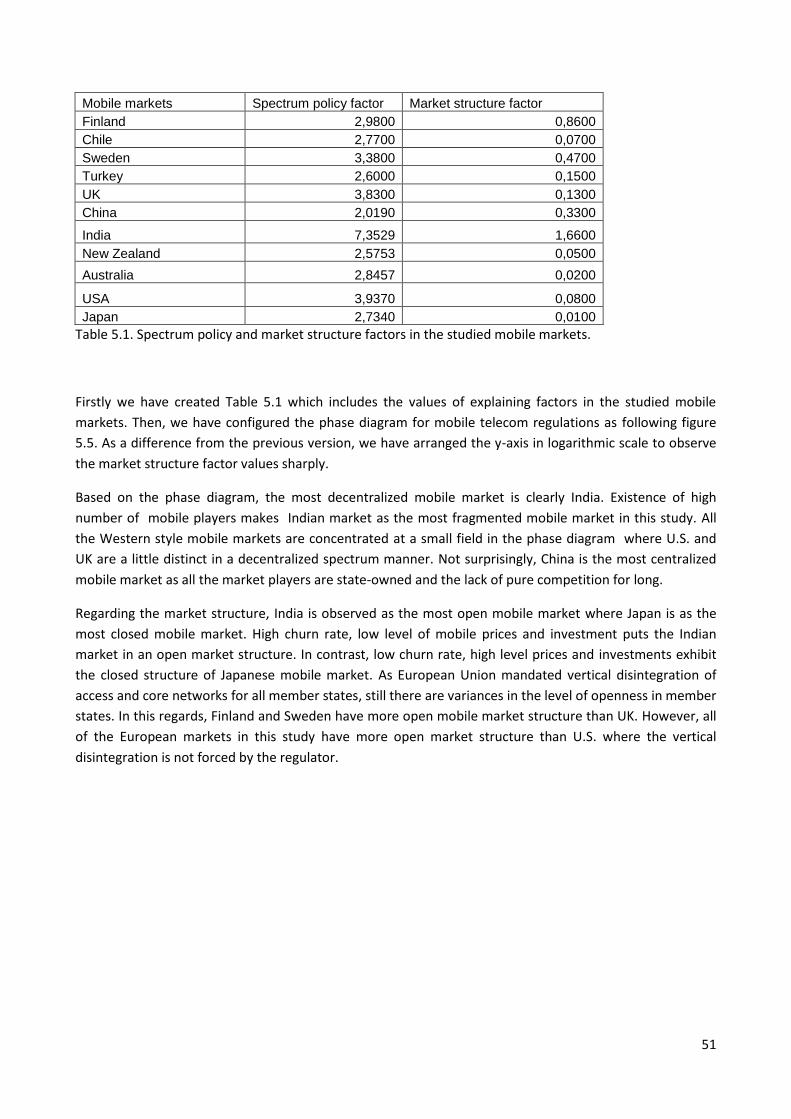
51
Mobile markets Spectrum policy factor Market structure factor
Finland 2,9800 0,8600
Chile 2,7700 0,0700
Sweden 3,3800 0,4700
Turkey 2,6000 0,1500
UK 3,8300 0,1300
China 2,0190 0,3300
India 7,3529 1,6600
New Zealand 2,5753 0,0500
Australia 2,8457 0,0200
USA 3,9370 0,0800
Japan 2,7340 0,0100
Table 5.1. Spectrum policy and market structure factors in the studied mobile markets.
Firstly we have created Table 5.1 which includes the values of explaining factors in the studied mobile
markets. Then, we have configured the phase diagram for mobile telecom regulations as following figure
5.5. As a difference from the previous version, we have arranged the y-axis in logarithmic scale to observe
the market structure factor values sharply.
Based on the phase diagram, the most decentralized mobile market is clearly India. Existence of high
number of mobile players makes Indian market as the most fragmented mobile market in this study. All
the Western style mobile markets are concentrated at a small field in the phase diagram where U.S. and
UK are a little distinct in a decentralized spectrum manner. Not surprisingly, China is the most centralized
mobile market as all the market players are state-owned and the lack of pure competition for long.
Regarding the market structure, India is observed as the most open mobile market where Japan is as the
most closed mobile market. High churn rate, low level of mobile prices and investment puts the Indian
market in an open market structure. In contrast, low churn rate, high level prices and investments exhibit
the closed structure of Japanese mobile market. As European Union mandated vertical disintegration of
access and core networks for all member states, still there are variances in the level of openness in member
states. In this regards, Finland and Sweden have more open mobile market structure than UK. However, all
of the European markets in this study have more open market structure than U.S. where the vertical
disintegration is not forced by the regulator.
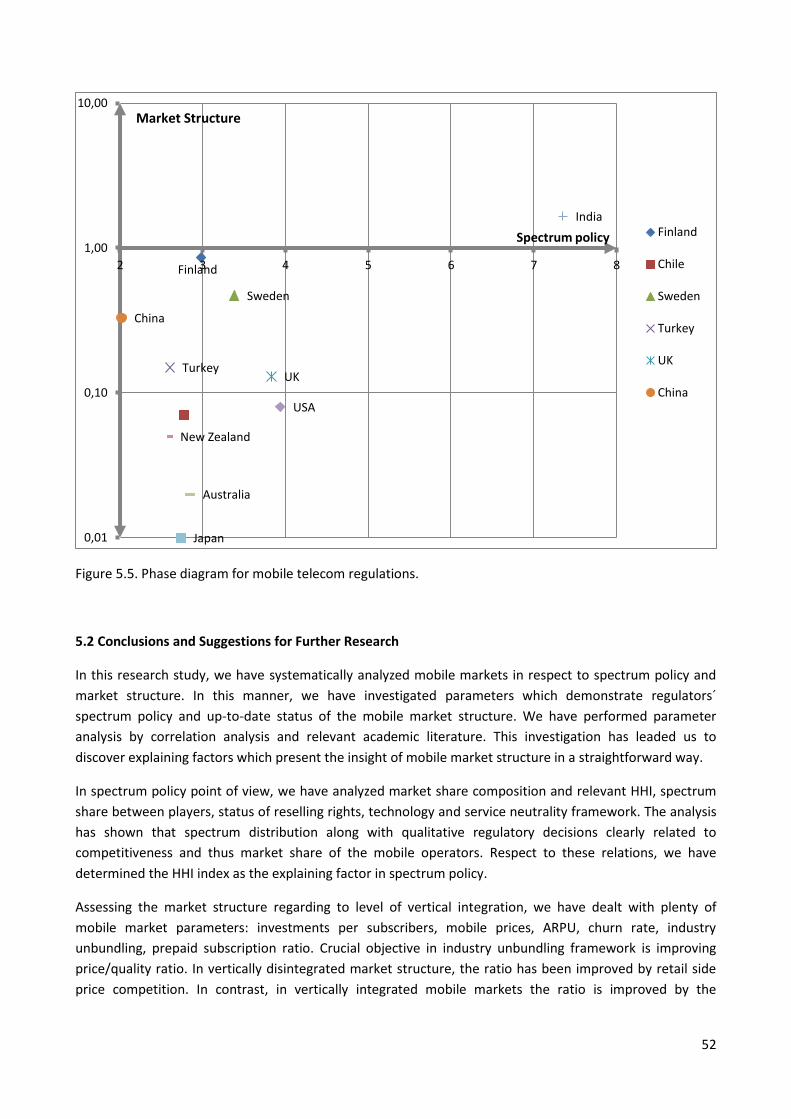
52
Figure 5.5. Phase diagram for mobile telecom regulations.
5.2 Conclusions and Suggestions for Further Research
In this research study, we have systematically analyzed mobile markets in respect to spectrum policy and
market structure. In this manner, we have investigated parameters which demonstrate regulators´
spectrum policy and up-to-date status of the mobile market structure. We have performed parameter
analysis by correlation analysis and relevant academic literature. This investigation has leaded us to
discover explaining factors which present the insight of mobile market structure in a straightforward way.
In spectrum policy point of view, we have analyzed market share composition and relevant HHI, spectrum
share between players, status of reselling rights, technology and service neutrality framework. The analysis
has shown that spectrum distribution along with qualitative regulatory decisions clearly related to
competitiveness and thus market share of the mobile operators. Respect to these relations, we have
determined the HHI index as the explaining factor in spectrum policy.
Assessing the market structure regarding to level of vertical integration, we have dealt with plenty of
mobile market parameters: investments per subscribers, mobile prices, ARPU, churn rate, industry
unbundling, prepaid subscription ratio. Crucial objective in industry unbundling framework is improving
price/quality ratio. In vertically disintegrated market structure, the ratio has been improved by retail side
price competition. In contrast, in vertically integrated mobile markets the ratio is improved by the
Finland
Sweden
Turkey UK
China
India
New Zealand
Australia
USA
Japan 0,01
0,10
1,00
10,00
2 3 4 5 6 7 8
Finland
Chile
Sweden
Turkey
UK
China
Spectrum policy
Market Structure
53
mandated high level of investments. Based on these characteristics, we have determined both mobile
prices and investment per subscriber as mobile structure explaining factor.
Based on these explaining factors, we have assessed the spectrum policy and market structure in the
studied mobile markets via phase diagram for mobile telecom regulation. Our research has shown that
India has clearly the most decentralized spectrum along with the most vertically disintegrated market. After
India, American market has the second most decentralized spectrum even though American market is more
integrated than Finland, Sweden and United Kingdom. As Japanese market has high switching cost, Japan
has the most vertically integrated mobile market in this study. European Union regulates the mobile
markets based on unbundling framework. Parallel to this framework; Finnish, Swedish and British markets
have more open structure relative to American mobile market.
As further research, we believe that enhancing the data set which reflects mobile market characteristics,
may raise the differences between the mobile markets even sharper. Based on that, explaining factors may
be developed even further. Moreover, enhancing number of the mobile markets can rise scope of the
research.
54
References
1. Page, M. et al., The Mobile Economy 2013, Kearney, A.T., 2013.
2. Watson, R., IT Industry Success in Small Countries: The Cases of Finland and New Zealand, 2002.
3. Basaure, A.; Casey, T.s R.; Hämmäinen, H. (2012): Different regulation paths towards cognitive radio
technologies: Cases of Finland and Chile, 23rd European Regional Conference of the ITS, Vienna,
Austria, 1-4 July 2012.
4. Ertunc, E., 3N Mobil Haberlesme Sistemlerinde Kapsama Alani ve Hizmet Kalitesi Denetimlerine
Iliskin Ölcum ve Analiz Yöntemleri: Dünya Örneklerä ve Türkiye Önerileri, 2011.
5. Kuscu, B., How Should Regulators Approach to the Relationship Between Mobile Network
Operators and Mobile Virtual Network Operators? An Assessment for the Case of Turkish Mobile
Market, 2009.
6. Karabacak, N. and Marsden,C. Functional Separation in Telecommunications? Better Regulatory
Solution, 2009.
7. Smura, T.; Sorri, A. (2009): Future Scenarious for Local Area Access: Industry Structure and Access
Fragmentation, 8th International Conference on Mobile Business, Dalian China, June 27-28, 2009.
8. Santos, V., Competition and oligopoly in telecommunications industry in the EU.
9. Economides, N., Telecommunications Regulation: An introduction.
10. Davies, J.; Howell, B.; Mabin, V., Telecommunications Regulation, Regulatory Behavior and its
Impact a Systems View, 2008.
11. Howell, B and Meade, R., Structural separation versus vertical integration:Lessons for
telecommunications from electricity reforms, 2010, Telecommunications Policy 34
12. Guzzini, E. and Palestrini, A., Coase theorem and exchangeable rights in non-cooperative games,
2009.
13. Lee,J. and Sabourian, H., Coase theorem complexity and transaction costs, 2006.
14. Atkinson, October 2010. Network Policy and Economic Doctrines. 2010 Telecommunications Policy
Research Conference (TPRC).
15. Andersen, E.S., 2007. Bridging the Gap between Schumpeterian Competition and Evolutionary
Game theory. DRUID Summer Conference 2007, Aalborg University, Denmark.
16. Krafft, J., 2008. Telecommunicatons, the Internet and Mr. Schumpeter. Published by Elgar
Companion to Neo-Schumpeterian Economics, Edward Elgar (Ed.), 2007, 621-632
17. Aydin, S.; Özer, G, How switching costs affect subscriber loyalty in the Turkish mobile phone market:
An exploratory study, 2005.
18. Kokko, J., Mobile internet charging: prepaid vs. postpaid, Helsinki University of Technology.
19. Lundborg, M.; Reichl, W.; Ruhle, E., Spectrum allocation and its relevance for competition, 2012.
20. Owczarczuk, M., Churn models for prepaid customers in the cellular telecommunications industry
using large data-marts, 2010.
21. Nakil, S; Mi-ae, K. An empirical analysis of the state of competition in OECD mobile wireless
markets.
22. Dutta, S. and Mia, I. The Global Information Technology Report 2010-2011 Transformations 2.0
World Economic Forum. Report number: 10, 2011.
23. Top 2000 Companies, [Online] Available from:
http://www.kauppalehti.fi/5/i/yritykset/menestyjat/lista.jsp?id=1 [Accessed 11th July 2013].
24. Wallis-Brown, P.H. The secret of the global success of Nokia Mobile Phones and Ericsson Mobile,
[Online] 2000, p.1. Available from: http://ieeexplore.ieee.org/ [Accessed 10th April 2013].
55
25. About us, [Online] Available from: http://www.tieto.com/about-us [Accessed 11th July 2013].
26. Rovio`s success and ex-Nokia engineers boosts entrepreneurship in Finland, [Online] Available from:
http://www.investinfinland.fi/articles/news/ict/mobile-cluster/rovios-success-and-ex-nokia-
engineers-boosts-entrepreneurship-in-finland/46-282 [Accessed 11th July 2013].
27. Timofeev, V. ITU-R Sector Activities on Climate Change, [Online] Available from:
http://www.itu.int/ITU-R/information/promotion/e-flash/03-2008/article4.html [Accessed 11th July
2013].
28. Büyükbas, A. et al, 3G Dünya Tecrübeleri, Bilgi Teknolojileri ve Iletisim Kurumu. 2002.
29. History of DNA Group, [Online] Available from:
https://www.dna.fi/en/dnagroup/informationaboutdna/Sivut/HistoryofDNAGroup.aspx [Accessed
11th July 2013].
30. Tele2 ends Wireless Service in Finland, [Online] Available from: http://www.rcrwireless.com/
[Accessed 10th April 2013].
31. Finnish Telecom Policy Ministry of Transport and Communications, 2003.
32. Roetter, M. Spectrum for Mobile Broadband in the Americas: Policy Issues for Growth and
Competition GSMA. 2011.
33. Gimeno, J. Launching 3G Mobile Services in Finland: War or Peace?, INSEAD, 2007, pp. 2-3.
34. The International Communications Market Market Review 1/2009 FICORA, 2009.
35. Carvallo-Fernandini, R. et al. The History of CTC and Entel: Precursors of the Telecommunications in
Chile, Universidad Católica de Valparaíso, p.5
36. Ministerio de Transporte y Telecomunicaciones, Subtel, 2008.
37. Subtel, 2012. Informe Estadístico, Sector Telecomunicaciones, Septiembre 2012.
38. Turkey Leading OECD in GDP Growth, [Online] Available from: http://www.invest.gov.tr/en-
US/infocenter/news/Pages/141212-turkey-leading-oecd-in-gdp-growth-rate.aspx [Accessed 11th
July 2013].
39. Establishment, [Online] Available from: http://eng.btk.gov.tr/ [Accessed 10th April 2013].
40. GSM Sektöründe Ulusal Dolasim Sorunu, [Online] Available from: http://arama.hurriyet.com.tr
[Accessed 10th April 2013].
41. Genel Bakis, [Online] Available from:
http://www.turkcell.com.tr/site/tr/turkcellhakkinda/Sayfalar/genel-bakis/genel.aspx [Accessed 10th
April 2013].
42. Yayla, F., Frekans Ihalelerinin Ihale Teorisi Kapsaminda Degerlendirilmesi: Dunya Uygulamalari ve
Türkiye icin Model Önerisi, 2009, p.95.
43. Türkiye GSM Pazari, [Online] Available from: http://www.turkcell.com.tr [Accessed 10th April
2013].
44. Türkiye´de Telekomunikasyon Tarihcesi , [Online] Available from: http://www.emo.org.tr [Accessed
10th April 2013].
45. Basin Bülteni, Bilgi Teknolojileri ve İletişim Kurumu, 2009.
Üç Aylık Pazar Verileri Raporu, , Bilgi Teknolojileri ve İletişim Kurumu, 2012.
46. Experience of Spectrum Trading in Australia and New Zealand, [Online] Available from:
http://www.ofcom.org.uk/static/archive/ra/publication/ra_info/ra335/annexa.htm [Accessed 11th
July 2013].
47. The Australian communications, [Online] Available from: http://www.acma.gov.au [Accessed 21th
May 2013].
48. Mueller, M., New Zealand´s revolution in spectrum management, 1993, Rutgers University, USA.
56
49. Shuai, T., Radio Spectrum Licensing in 3G an LTE: Facts and Evaluation in China, Helsinki University
of Technology.
50. Yu, J., The evolution of China´s mobile telecommunications industry:past, present and future, 2005.
51. Zhang, X.; Prybutok, V., How the mobile communication markets differ in China, the U.S. and
Europe, 2005.
52. India´s ICT Industry: Increasing in global visibility and relevance, [Online] Available from:
http://www.innovasjonnorge.no [Accessed 21th May 2013].
53. Home Telecom Regulation Authority of India, Available from: http://www.trai.gov.in/ [Accessed
21th May 2013].
54. Federal Communications Commision, Available from: http://www.fcc.gov/ [Accessed 21th May
2013].
55. Markus, J. et al., Towards more flexible spectrum regulation, 2005.
56. Year Report, Chetan Sharma Consulting, 2011.
57. About us, Available from: http://www.nttdocomo.co.jp/english/corporate/ [Accessed 1th
December 2012].
58. Davidsson, P., The Swedish Telecommunications Market, 2010.
59. Hoeffler, S. and Keller, K., The marketing advantages of strong brand, 2003.
60. Jansen, S. and Cusumano, M., Defining Software Ecosystems: A Survey of Software Platforms and
Business Network Governance, Utrecht University, 2012.
61. Buzzell, R.D. and Gale, B.T., The PIMS Principles-Linking Strategy to Performance, The Free Press,
1987.
62. Schmalansee, M. et al., Handbook of Industrial Organization, Volume 3, 1989.
63. Bijwaard, G. et al., Early Mover Advantages: An Empirical Analysis of European Mobile Phone
Markets, 2008.
64. China to Suprass 1 billion Mobile Connections in May 2012, [Online] Available from:
https://wirelessintelligence.com/ [Accessed 11th April 2013].
65. Karhan, V., Sektör Raproru, Strateji Menkul Kiymetler A.S., 2000.
66. Türkiye´de Telekomunikasyon Tarihcesi , [Online] Available from: http://www.emo.org.tr [Accessed
11th April 2013].
67. Numara Tasinabilirligi, [Online] Available from: http://www.nts.gov.tr/ [Accessed 11th April 2013].
68. Tallberg, M., Bundling of Handset and Subscription, Helsinki University of Technology, 2004.
69. Spectrum Licenses by Category, [Online] Available from: http://web.acma.gov.au/ [Accessed 11th
April 2013].
70. Wray, R., Orange and T-Mobile Settle Down for Everything Everywhere, [Online] Available from:
http://www.guardian.co.uk/, [Accessed 11th April 2013].
71. Horizontal Merger Guidelines, US Federal of Justice, 2010. 72. Concentration and Market Shares, [Online] Available from: http://www.justice.gov/ [Accessed
11th April 2013]. 73. Klemperer, P., How (Not) to Run Auctions:the European 3G Telecom Auctions, 2001.
74. Cellular Spectrum in New Zealand, [Online] Available from: http://www.nztelco-com, [Accessed 15th
April 2013].
75. Nortfeld, D., Japan Allocates 700 MHz, Bolsters Lofty Operators Plans for LTE, [Online] Available
from: http://www.tolaga.com/, [Accessed 25th April 2013], 2012.
76. Eco Report 03 The Licensing of “Mobile Bands” in CEPT, European Communications Office, 2012.
77. Lewin,D. et al., An assessment of spectrum management in India, AEGS spectrum engineer, 2008.
57
78. Gunther, C.G.; Hattori, T., Overview of Wireless Personal Communications, 1995.
79. Mobile industry faces 9.2 billion dollars shortfall in backhaul investment, Tellabs study finds,
Online] Available from: http://www.tellabs.com/ 2013,[Accessed 15th April 2013].
80. OECD Communications Outlook Preliminary version, 2011.
81. China Unicom Q2 net slips as handset subsidies rise, [Online] Available from: http://www.
chicagotribune.com, [Accessed 25th April 2013], 2012.
82. Qing, L. , India´s first drop in mobile subscriber base just a bip, , [Online] Available from:
http://www. zdnet.com, [Accessed 20th May 2013], 2012.
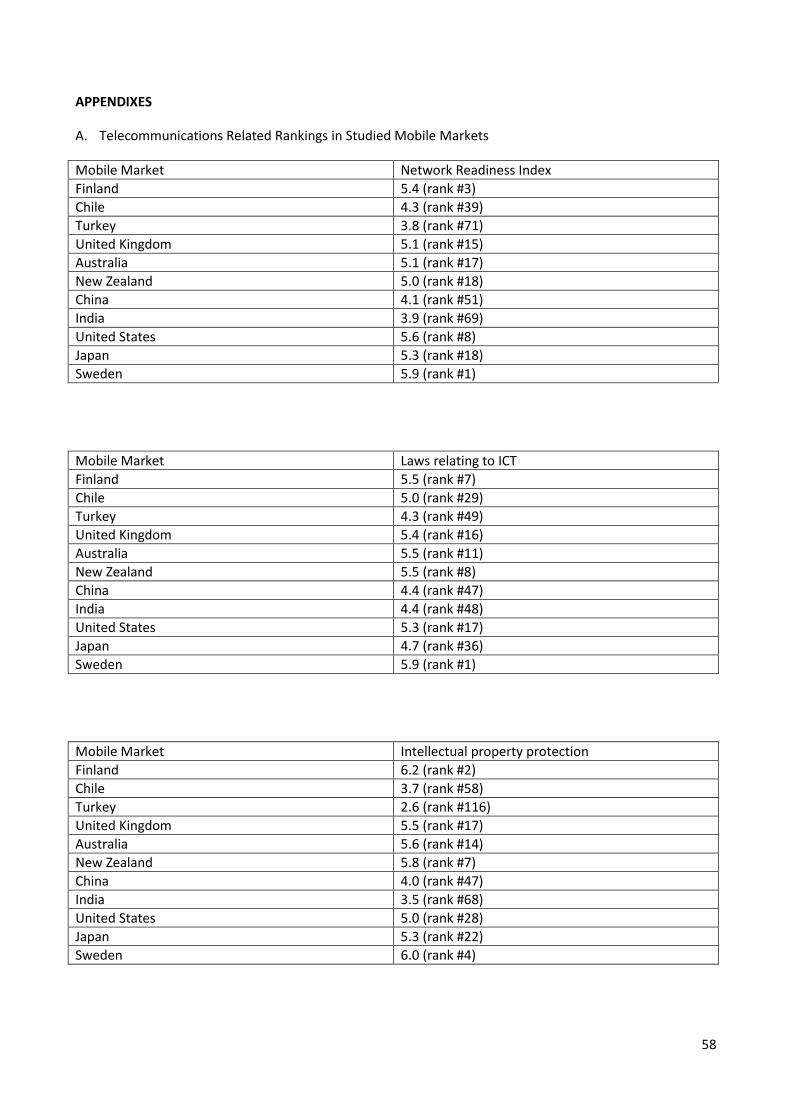
58
APPENDIXES
A. Telecommunications Related Rankings in Studied Mobile Markets
Mobile Market Network Readiness Index
Finland 5.4 (rank #3)
Chile 4.3 (rank #39)
Turkey 3.8 (rank #71)
United Kingdom 5.1 (rank #15)
Australia 5.1 (rank #17)
New Zealand 5.0 (rank #18)
China 4.1 (rank #51)
India 3.9 (rank #69)
United States 5.6 (rank #8)
Japan 5.3 (rank #18)
Sweden 5.9 (rank #1)
Mobile Market Laws relating to ICT
Finland 5.5 (rank #7)
Chile 5.0 (rank #29)
Turkey 4.3 (rank #49)
United Kingdom 5.4 (rank #16)
Australia 5.5 (rank #11)
New Zealand 5.5 (rank #8)
China 4.4 (rank #47)
India 4.4 (rank #48)
United States 5.3 (rank #17)
Japan 4.7 (rank #36)
Sweden 5.9 (rank #1)
Mobile Market Intellectual property protection
Finland 6.2 (rank #2)
Chile 3.7 (rank #58)
Turkey 2.6 (rank #116)
United Kingdom 5.5 (rank #17)
Australia 5.6 (rank #14)
New Zealand 5.8 (rank #7)
China 4.0 (rank #47)
India 3.5 (rank #68)
United States 5.0 (rank #28)
Japan 5.3 (rank #22)
Sweden 6.0 (rank #4)
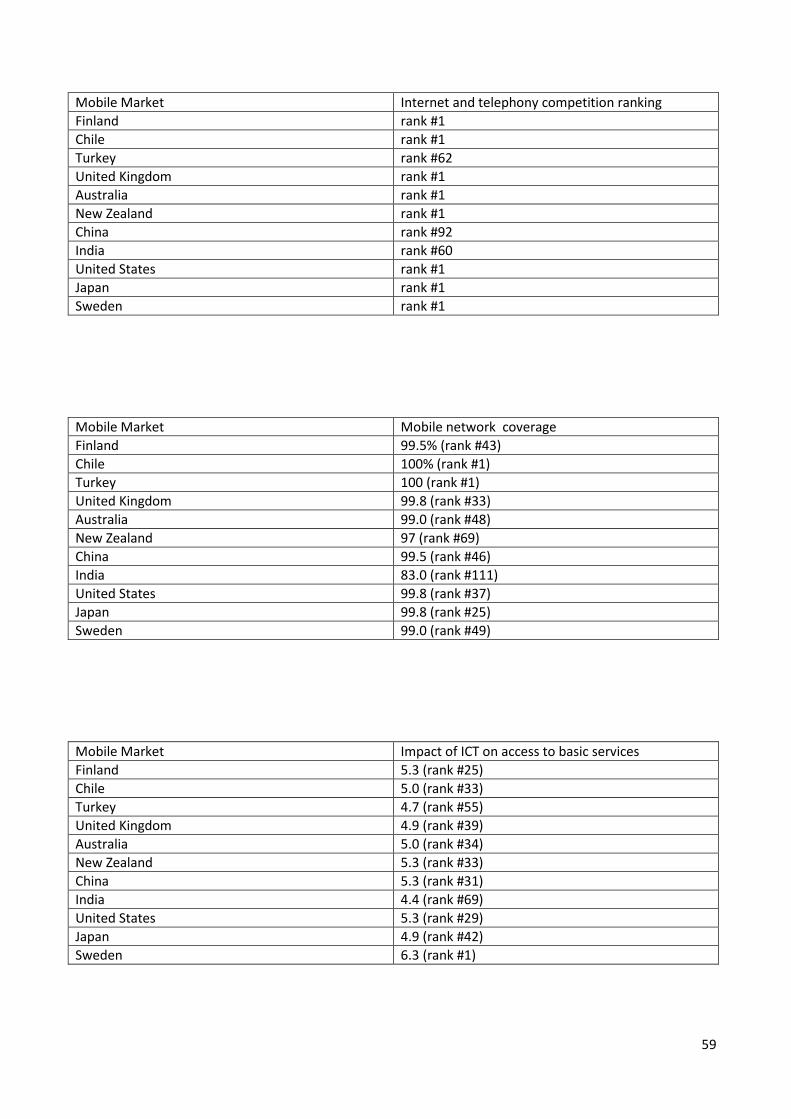
59
Mobile Market Internet and telephony competition ranking
Finland rank #1
Chile rank #1
Turkey rank #62
United Kingdom rank #1
Australia rank #1
New Zealand rank #1
China rank #92
India rank #60
United States rank #1
Japan rank #1
Sweden rank #1
Mobile Market Mobile network coverage
Finland 99.5% (rank #43)
Chile 100% (rank #1)
Turkey 100 (rank #1)
United Kingdom 99.8 (rank #33)
Australia 99.0 (rank #48)
New Zealand 97 (rank #69)
China 99.5 (rank #46)
India 83.0 (rank #111)
United States 99.8 (rank #37)
Japan 99.8 (rank #25)
Sweden 99.0 (rank #49)
Mobile Market Impact of ICT on access to basic services
Finland 5.3 (rank #25)
Chile 5.0 (rank #33)
Turkey 4.7 (rank #55)
United Kingdom 4.9 (rank #39)
Australia 5.0 (rank #34)
New Zealand 5.3 (rank #33)
China 5.3 (rank #31)
India 4.4 (rank #69)
United States 5.3 (rank #29)
Japan 4.9 (rank #42)
Sweden 6.3 (rank #1)
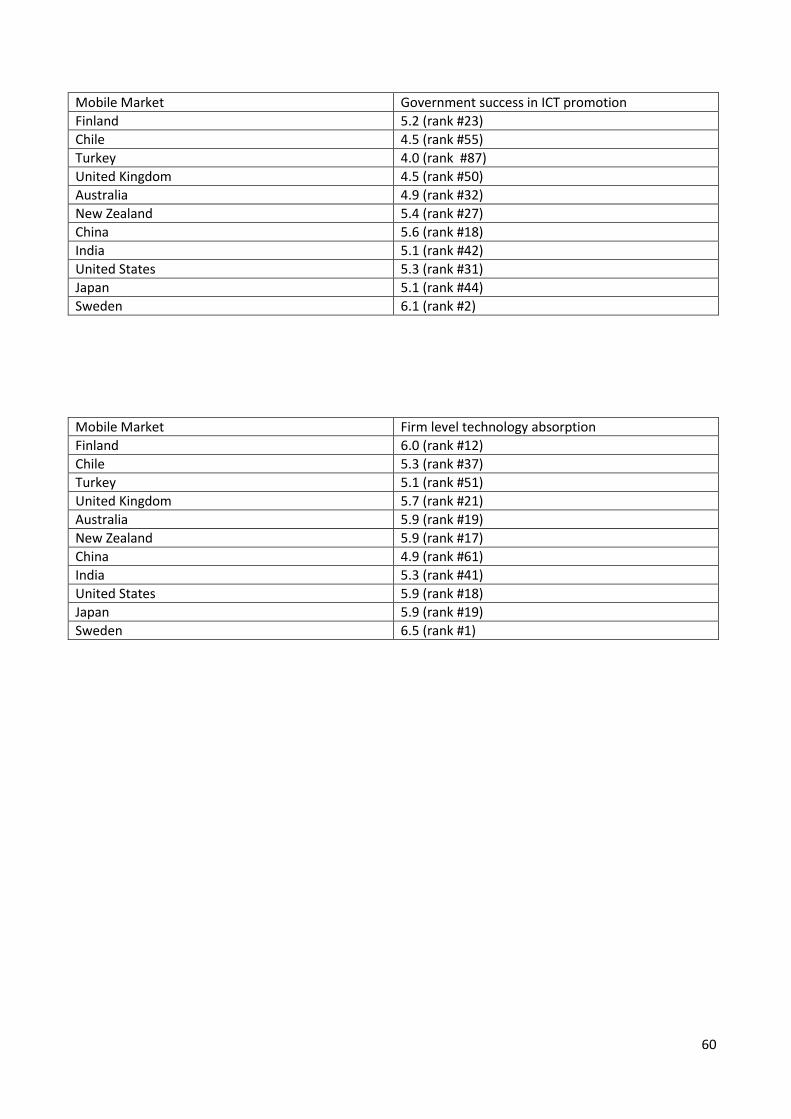
60
Mobile Market Government success in ICT promotion
Finland 5.2 (rank #23)
Chile 4.5 (rank #55)
Turkey 4.0 (rank #87)
United Kingdom 4.5 (rank #50)
Australia 4.9 (rank #32)
New Zealand 5.4 (rank #27)
China 5.6 (rank #18)
India 5.1 (rank #42)
United States 5.3 (rank #31)
Japan 5.1 (rank #44)
Sweden 6.1 (rank #2)
Mobile Market Firm level technology absorption
Finland 6.0 (rank #12)
Chile 5.3 (rank #37)
Turkey 5.1 (rank #51)
United Kingdom 5.7 (rank #21)
Australia 5.9 (rank #19)
New Zealand 5.9 (rank #17)
China 4.9 (rank #61)
India 5.3 (rank #41)
United States 5.9 (rank #18)
Japan 5.9 (rank #19)
Sweden 6.5 (rank #1)
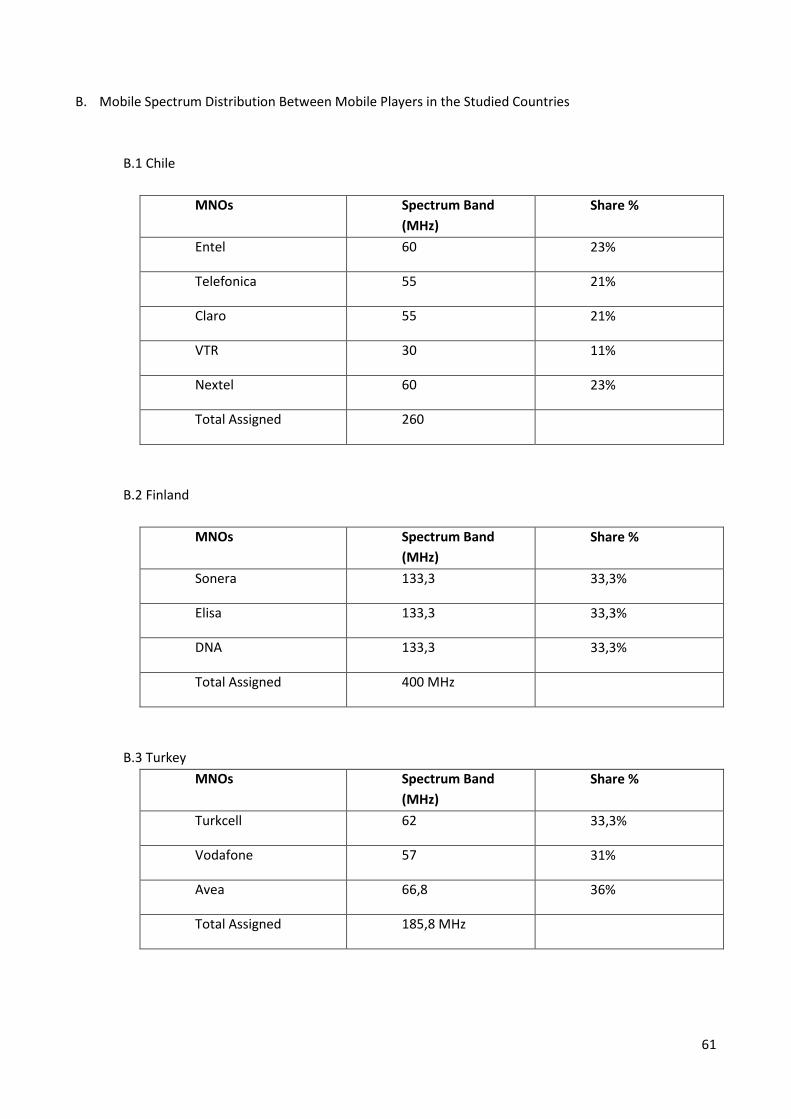
61
B. Mobile Spectrum Distribution Between Mobile Players in the Studied Countries
B.1 Chile
MNOs Spectrum Band
(MHz)
Share %
Entel 60 23%
Telefonica 55 21%
Claro 55 21%
VTR 30 11%
Nextel 60 23%
Total Assigned 260
B.2 Finland
MNOs Spectrum Band
(MHz)
Share %
Sonera 133,3 33,3%
Elisa 133,3 33,3%
DNA 133,3 33,3%
Total Assigned 400 MHz
B.3 Turkey
MNOs Spectrum Band
(MHz)
Share %
Turkcell 62 33,3%
Vodafone 57 31%
Avea 66,8 36%
Total Assigned 185,8 MHz
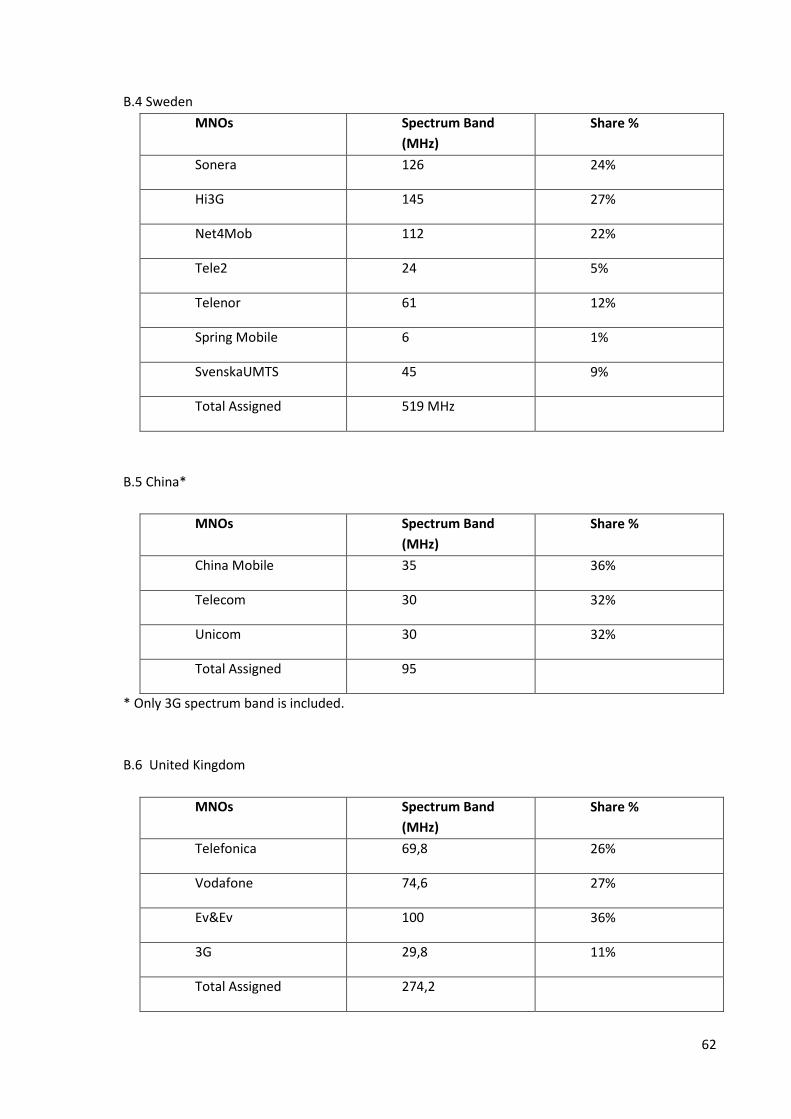
62
B.4 Sweden
MNOs Spectrum Band
(MHz)
Share %
Sonera 126 24%
Hi3G 145 27%
Net4Mob 112 22%
Tele2 24 5%
Telenor 61 12%
Spring Mobile 6 1%
SvenskaUMTS 45 9%
Total Assigned 519 MHz
B.5 China*
MNOs Spectrum Band
(MHz)
Share %
China Mobile 35 36%
Telecom 30 32%
Unicom 30 32%
Total Assigned 95
* Only 3G spectrum band is included.
B.6 United Kingdom
MNOs Spectrum Band
(MHz)
Share %
Telefonica 69,8 26%
Vodafone 74,6 27%
Ev&Ev 100 36%
3G 29,8 11%
Total Assigned 274,2
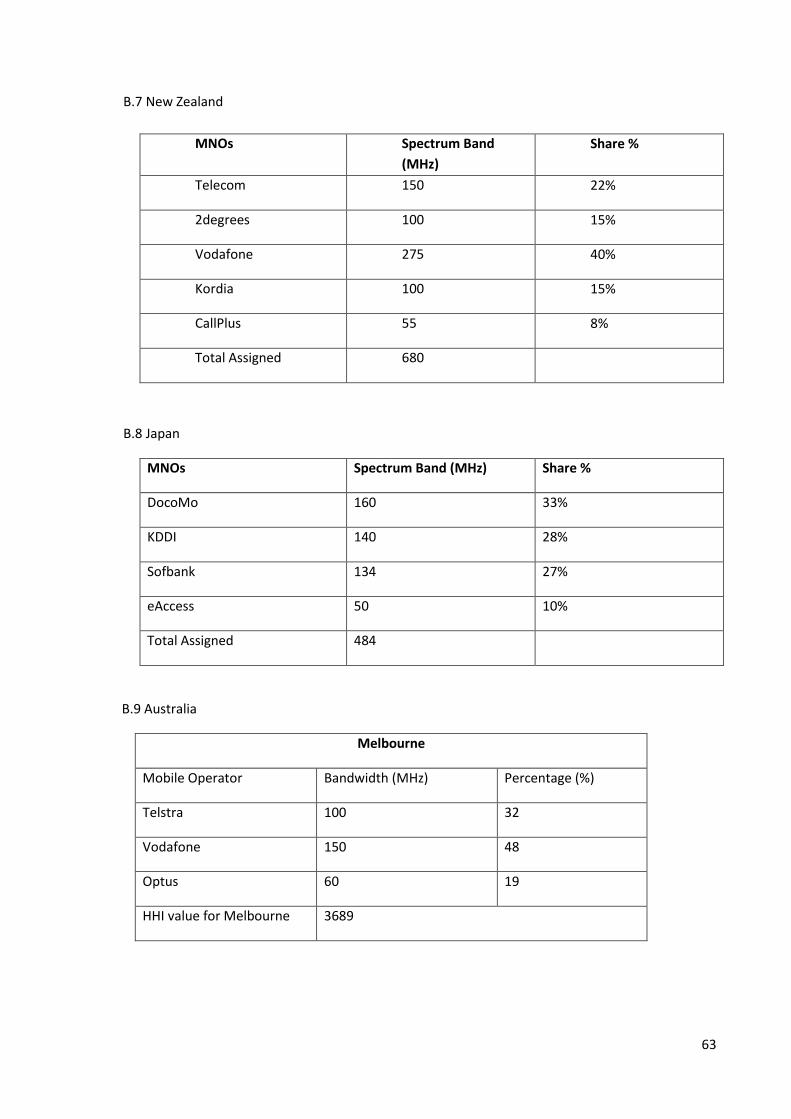
63
B.7 New Zealand
MNOs Spectrum Band
(MHz)
Share %
Telecom 150 22%
2degrees 100 15%
Vodafone 275 40%
Kordia 100 15%
CallPlus 55 8%
Total Assigned 680
B.8 Japan
MNOs Spectrum Band (MHz) Share %
DocoMo 160 33%
KDDI 140 28%
Sofbank 134 27%
eAccess 50 10%
Total Assigned 484
B.9 Australia
Melbourne
Mobile Operator Bandwidth (MHz) Percentage (%)
Telstra 100 32
Vodafone 150 48
Optus 60 19
HHI value for Melbourne 3689
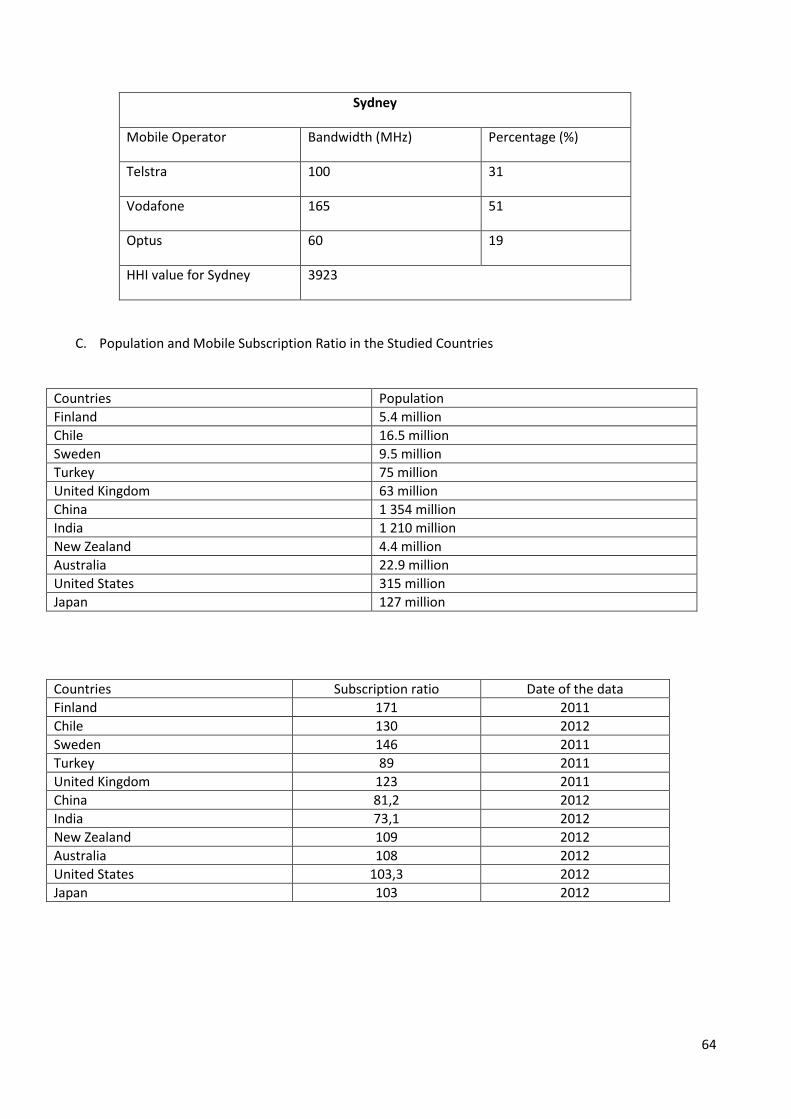
64
Sydney
Mobile Operator Bandwidth (MHz) Percentage (%)
Telstra 100 31
Vodafone 165 51
Optus 60 19
HHI value for Sydney 3923
C. Population and Mobile Subscription Ratio in the Studied Countries
Countries Population
Finland 5.4 million
Chile 16.5 million
Sweden 9.5 million
Turkey 75 million
United Kingdom 63 million
China 1 354 million
India 1 210 million
New Zealand 4.4 million
Australia 22.9 million
United States 315 million
Japan 127 million
Countries Subscription ratio Date of the data
Finland 171 2011
Chile 130 2012
Sweden 146 2011
Turkey 89 2011
United Kingdom 123 2011
China 81,2 2012
India 73,1 2012
New Zealand 109 2012
Australia 108 2012
United States 103,3 2012
Japan 103 2012
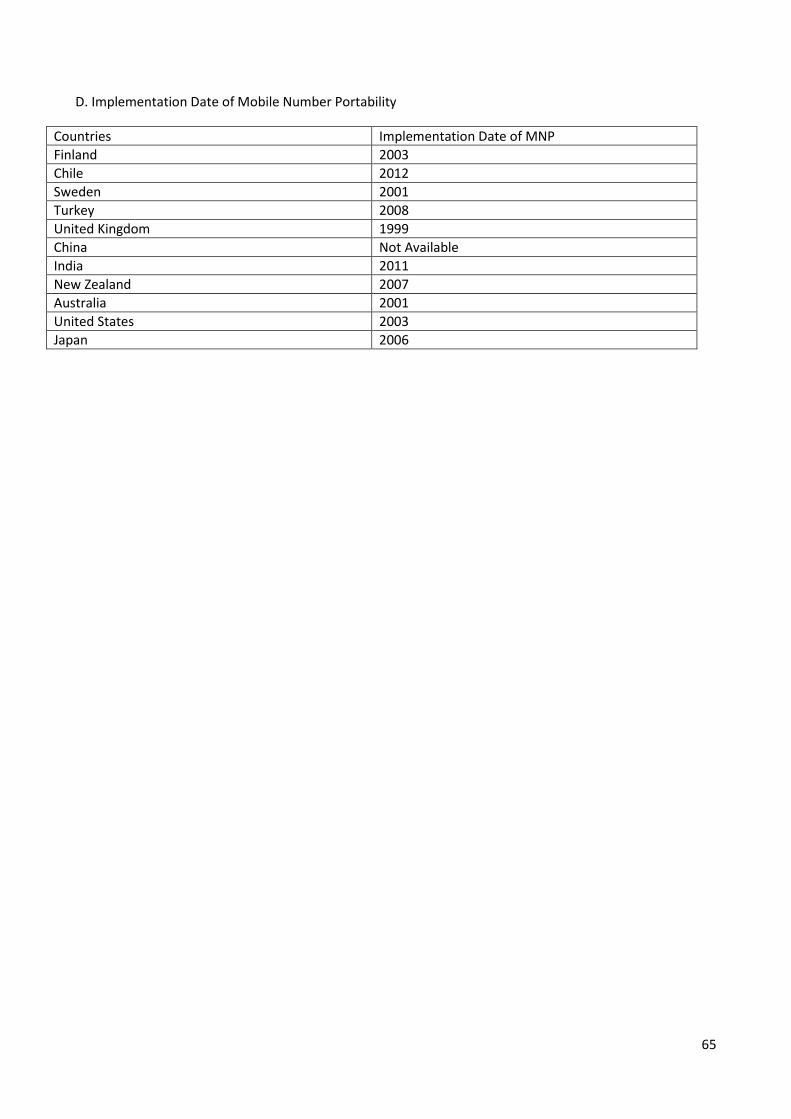
65
D. Implementation Date of Mobile Number Portability
Countries Implementation Date of MNP
Finland 2003
Chile 2012
Sweden 2001
Turkey 2008
United Kingdom 1999
China Not Available
India 2011
New Zealand 2007
Australia 2001
United States 2003
Japan 2006