Comparative Analysis of Spanish Banks’ Standalone Credit ... · João Pedro Pereira January, 2016...
25
A Work Project, presented as part of the requirements for the Award of a Master Degree in Finance from the NOVA – School of Business and Economics. Comparative Analysis of Spanish Banks’ Standalone Credit Profile Reka Bogosi, 889 A Project carried out on the Master in Finance Program, under the supervision of: João Pedro Pereira January, 2016
Transcript of Comparative Analysis of Spanish Banks’ Standalone Credit ... · João Pedro Pereira January, 2016...

A Work Project, presented as part of the requirements for the Award of a Master Degree in
Finance from the NOVA – School of Business and Economics.
Comparative Analysis of Spanish Banks’ Standalone Credit Profile
Reka Bogosi, 889
A Project carried out on the Master in Finance Program, under the supervision of:
João Pedro Pereira
January, 2016

2
Comparative Analysis of Spanish Banks’ Standalone Credit Profile
Abstract
The paper studies the relationship between four differently rated bank’s financial profile and
their standalone credit rating issued by Moody’s. The comparative analysis shows an example
that despite their pricing power and geographical coverage, larger banks do not necessarily have
better credit ratings. Instead, business model and risk appetite seem to be the defining factors
of banks’ vulnerability to shocks, such as the Spanish real estate crisis. The risk-return
relationship is also identified in the banks’ fundamentals meaning that while expansionary
strategy in riskier asset classes enhances margins, it also potentially distorts the credit risk
profile.
Keywords: non-performing loans, capitalization, net interest margin, wholesale funding

3
Introduction
Since the outbreak of the euro area debt crisis, Spain has been downgraded five times by
Moody’s, notching down the country’s Long-Term Issuer rating from Aaa (June 2010 – On
watch for possible downgrade) to Baa3 (June 2012). After a series of downgrades, the sovereign
has been upgraded by the agency for the first time in February 20141 supported by 1) the
improvements made by the economy on the back of structural reforms (such as labour and
pension systems as well as changes to the fiscal framework) and 2) progress in the government’s
funding profile compared to mid-2012 conditions.
Over the same period of time, there were similar actions taken for a large cluster of Spanish
banks2. While the underlying reasons for the deterioration of banks’ credit profile generally
corresponded for the sector as a whole, there are various firm specific indicators that define
why a bank is downgraded sooner or later vs. the others, or how many notches were applied in
the downgrade. Figure 1 shows that some bank’s credit rating has been more stable over the
past four years (E.g. Caixabank) while others suffered much more when economic conditions
were weak (E.g. Banco Popular).
The paper compares those financial indicators that define banks’ credit worthiness for four
Spanish banks with slightly altered risk profiles, each of them currently rated differently by
Moody’s. The purpose of the study is to outline the particularities in the analysed banks’ risk
profile by identifying the factors that are credit positive or credit negative for the institutions’
standalone credit rating.
1 Rating action: Moody's upgrades Spain's government bond rating to Baa2; assigns positive outlook (February, 2014) 2 Rating Action: Moody's downgrades Spanish banks; ratings carry negative outlooks or remain on review for downgrade (May, 2012)

4
Methodology
The paper is built on the comparative analysis of four Spanish banks’ standalone credit profile,
which is generally affected by two major risks: 1) asset quality, with the bank’s capitalization
and profitability serving as risk mitigants and 2) funding, which is mitigated by liquidity. In
order to assess these risks and their mitigants, I have analysed the following financial ratios:
Asset Quality Capitalization Profitability Funding & Liquidity
Non-performing loans /
Gross loans (NPL ratio)
Common Equity Tier 1
(CET1) ratio
Net Interest Margin
(NIM)
Loan-to-Deposit ratio
(LDR)
Loan provisions / Gross
loans (Cost of risk) Total Capital Ratio (TCR)
Return on risk-weighted
assets (RRWA)
Liquid assets / total
assets
Commercial Real Estate
loans / Gross loans
(CRE/gross loans)
Deferred tax assets / CET1
(DTA/CET1)
Return on average equity
(ROAE)
Liquid assets /
Wholesale funding
maturities
Repossessed Real Estate
assets / Gross loans
Adjusted CET1 ratio for
DTAs
Cost-to-Income (C/I)
ratio
The vast majority of these ratios are used by rating agencies Moody’s and Fitch in their global
credit rating methodologies for banks3. The more specific ratios, such as: CRE/Gross loans,
Repossessed real estate assets/Gross loans, DTA/CET1 and Adjusted CET1 for DTAs, are not
directly implemented in the global rating methodologies since they point out the weaknesses
characteristic of Spanish banks. Therefore, if applicable, they are used as adjustments to the
score given to certain risk factors (i.e. asset quality, capitalization, profitability, funding &
liquidity) to add accuracy to the resulting standalone credit rating.
While Moody’s publishes a wide range of rating symbols4, this study considers the Baseline
Credit Assessment (BCA), which indicates the bank’s standalone credit strengths, excluding
any external support from affiliate or government and is the core input to the final long-term
rating5. Since my study also focuses on the standalone creditworthiness of banks based on their
financial profile, the BCA is the most suitable rating type for my analysis. The BCAs are
3 For example as described in Fitch Ratings Global Bank Rating Criteria, March 2015 and Moody’s Investors Service Rating Methodology: Banks, March 2015 4 Moody’s Rating Symbols and Definitions, August 2015 5 Moody’s Bank Rating Methodology: Analytical Approach in Brief, March 2015

5
denoted on a lower-case alpha-numeric scale (aaa, aa1, aa2, ..., c) corresponding to the one used
for the global long-term ratings.
Moody’s currently issues BCAs to 18 Spanish banks, which jointly accounted for 91% of total
domestic bank assets at 31 December 2014 (See Figure 2). The asset-weighted average BCA
of the 18 banks is baa3, mainly driven by Santander (baa1) and BBVA (baa2) which account
for 54% of total domestic assets (excluding these two banks, the average is ba3). Despite the
two systematically important banks, out of the 18 rated banks three were subject to restructuring
in 2012 (Bankia, Catalunya Banc, Abanca), four went through significant structural changes
through mergers during the consolidation of the Spanish banking sector (Unicaja, Ibercaja,
Liberbank, Kutxabank) and five have either a specific function or business profile (Cecabank,
Banco Cooperativo Espanol, Caja Laboral Popular, Caja Rural de Navarra, Banca March)
which makes them less suitable for comparison purposes. Therefore, the banks chosen for the
analysis are: Bankinter (baa3), Caixabank (ba1), Banco Sabadell (ba3) and Banco Popular
Espanol (b1), which represent different rating categories but belong to the same peer group.
Figure 1 shows how these banks compare to each other in terms of their standalone rating
migration: Caixabank shows the most stability, Bankinter is the only one with an upgraded
BCA in the past 4 years, Sabadell has been downgraded once by 1 notch, while Banco Popular
has suffered a 2-notch downgrade a few months before Sabadell. The comparative analysis of
the fundamentals reveals the underlying reasons for these rating migrations.
The remainder of the paper is divided into five sections providing a full credit opinion on the
banks by commenting on each of the four key areas: asset quality, capitalization, profitability
and liquidity & funding. The last section presents the conclusions and a forward looking rating
evolution for each bank.

6
1) Asset Quality
Close links between banks’ Commercial Real Estate (CRE) exposure and rating
It is observed, that there is a strong relationship between banks’ asset quality and their credit
rating migration. More specifically, banks with high exposure to the weak CRE segment have
suffered the most during the crisis, as is the case of Banco Popular, which has experienced the
most severe downgrade by four notches in June 2012 (from A3 to Ba1), when the agency has
reduced the rating on 28 Spanish banks by one to four notches6, following the downgrade of
the sovereign to Baa3. This is underpinned also by Figure 3 which shows the evolution of the
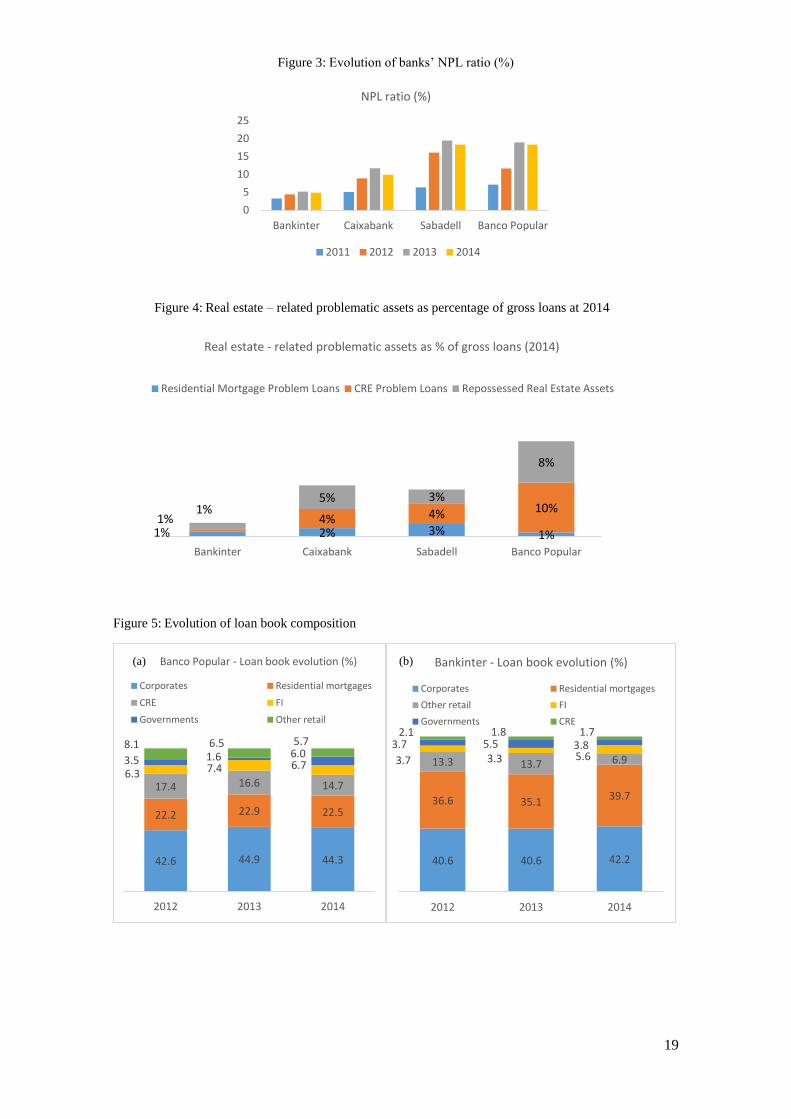
NPL ratio across banks. Banco Popular, the weakest bank in terms of asset quality with an NPL
ratio of 18%, has also the largest portion of real estate-related problem loans (Figure 4). While
the bank has been reducing its lending portfolio to CRE (Figure 5a), NPLs remained on the
upsurge over the past years due to the deterioration of other asset classes such as residential
mortgages and corporates, mainly due to Banco Popular’s strategic orientation towards risky
SME lending (+24% yoy at 3Q15) in search for higher yields (as a result, Banco Popular’s net
interest margin is the highest among peers – See Profitability section). Apart from NPLs, the
bank has also accumulated a large stock of repossessed real estate assets, which account for 8%
of gross loans (Figure 4), and if included, would raise the NPL ratio to 27%.
Sabadell’s asset quality is the second worst among the four peers, with an NPL ratio of 18.3%
at 2014, well above the system average of 12.6%, although down from the previous year’s
19.5%. The material deterioration in the bank’s asset quality in 2012 is in conjunction with the
acquisition of the distressed Banco CAM, for which Sabadell has received an Asset Protection
Scheme guaranteed by the FGD (Fondo de Garantia de Depositos) reaching the amount of ca.
€21bn, net of provisions already in place. Excluding the non-performing loans covered by the
APS, the bank’s adjusted NPL ratio is estimated at 13.2% (vs. 14.2% at 2013). Additionally,
6 Rating Action: Moody's downgrades Spanish banks (June, 2012)

7
the bank has actively reduced its CRE portfolio over the past 3 years (7% of loans at 2014 vs.
12% at 2012 – See Figure 5d), while there is a visible shift towards SME and corporate lending,
which now account for almost half of the loan book. On the other hand, real estate related
problem loans in the form of repossessed assets are still material (Figure 4), and if included,
results in an NPL ratio of 21%.
Caixabank’s asset quality ranks second best among the four banks. Although still weak, the
NPL ratio has come down to 9.9% at 2014 from previous year’s 11.7%, thanks to the active
management of the doubtful loans represented by additional foreclosures (€5bn at 2014 vs.
€4.7bn at 2013) combined with improving economic conditions. The drag on asset quality is
realized through the CRE portfolio, which had an NPL ratio of 55% at 2014, although down
from 59% at 2013. The bank has decreased its CRE exposure to 5% of the loan book at 2014
from 10% at 2012 (Figure 5c), however the divestment process was slowed down in the
meantime by the acquisitions of Banco Civica and Banco de Valencia, which triggered a peak
of NPLs in 2013. Additionally, Caixabank still maintains a material stock of repossessed real
estates, which accounted for 5% of gross loans at 2014 (See Figure 4) and would push up the
NPL ratio to 15% if included, which still compares favourably against Sabadell’s 21% and
Banco Popular’s 27%.
Bankinter has a superior asset quality which has been resilient over the crisis, and compares
favourably not only against the presented peers, but sector-wide as well. The bank’s NPL ratio
has stayed close to 5% throughout the crisis (See Figure 3), due to the small CRE exposure in
the loan book (ca. 2% - Figure 5b). Moreover, the bank historically focused on retail lending
with residential mortgages to middle - and high income households accounting for 40% of the
loan book at 2014 (See Figure 5b) characterised by low LTV (loan-to-value) of 59%. Therefore,
Bankinter’s credit rating has been only marginally affected by the system-wide downgrade in
June 2012, suffering only a 1 notch adjustment. Additionally, unlike its peers, Bankinter’s asset

8
quality is not heavily contaminated by large stock of repossessed real estate assets (only 1% of
gross loans – See Figure 4), while if we take into account the refinanced loans, the NPL ratio
would increase to 8%, which still compares favourable against Caixabank’s 18%, Sabadell’s
33% and Banco Popular’s 33%.
2) Capitalization
System average Common Equity Tier 1 ratio (CET1%) of 11.8% and Total Capital Ratio
(TCR) of 13.6% comfortably reach the minimum requirements of 4.5% and 8% (Source:
Bank of Spain)
In the peer group, only Caixabank beats the system average capital ratios (See Figure 6). While
the acquisition of Barclays Bank SAU7 in the beginning of 2015 had a negative impact of 78
bps on the bank’s CET1%, the bank managed to close the 3rd quarter with a phased-in CET1
ratio of 12.8% and a TCR of 15.8% supported by organic capital generation (See Profitability
section).
Bankinter ranks second in terms of capital ratios with comfortable buffers above the minimum
requirements (CET1% of 11.9% and TCR of 12.9% at 3Q15) underpinned by 1) the bank’s
profitability (highest ROAE among peers of 7.8% at 2014) and 2) above average asset quality
(lowest NPL ratio among peers of 5.1% at 2014).
Sabadell’s capital position has been continuously strengthened over the past four years (See
Figure 6), with CET1 ratio of 11.6% and TCR of 13% at 3Q15. While Sabadell has completed
the acquisition of 100% of the UK based TSB in August 2015, the bank’s capitalization has not
suffered, due to the €1.6bn rights issue8 executed in relatively the same time period.
7 http://press.lacaixa.es/caixabank/press-releases/barclays-bank-sau-will-be-assimilated-into-caixabank-after-the-two-firms-agreed-to-merge__1775-c-21901__.html 8 http://prensa.bancsabadell.com/en/News/2015/04/banco-sabadell-obtained-1746-million-euro-in-attributable-net-profit-1152-more-than-in-1q14

9
Although the weakest among the four banks, Banco Popular has gradually improved its
capitalization by 1) realizing capital gains on the sale of non-core businesses and the securities
portfolio, 2) deleveraging the loan book and 3) tapping equity markets. While capital ratios are
above the minimum requirements (CET1% of 12.65% and TCR of 13.2% at 3Q15), Banco
Popular’s capitalization is challenged by the high amount of NPLs which exposes the bank to
potential shocks.
Favourable results of the ECB CA (Comprehensive Assessment) for Spanish banks
Among the four banks analysed, each of them has passed the ECB’s Comprehensive
Assessment (Stress Test and Asset Quality Review9) and they all maintained comfortable
buffers of core capital above the minimum requirements both in the adverse (5.5%) and baseline
(8%) scenarios of the stress test. The AQR had a limited impact on banks’ CET1, the best result
shown by Sabadell with an adjustment of zero basis points on CET1 while Banco Popular was
the weakest with an impact of ca. 57 bps on CET1 (See Figure 7). Overall, the CA has not
shown the need for extensive additional provisions suggesting that reserve coverage ratios and
the classification and valuation of assets have been adequate as of end-2013.
Deferred Tax Assets (DTAs) significant and weak part of capital
DTAs originate from past negative profits, mainly caused by the substantial provisioning
requirements faced by the Spanish banks during the clean-up exercise in 2012. In order to allow
them to retain capital for DTAs under Basel III, the Spanish government (along with the Italian,
Portuguese and Greek) passed a law (Royal Decree Law 14/2013) which allows part of the
DTAs to be converted into tax credits and treat them as core capital10. Spanish banks’ DTAs
represent ca. 40% of the system’s CET1 capital (Source: ECB CA results) with approximately
9 https://www.bankingsupervision.europa.eu/banking/comprehensive/2014/html/index.en.html 10 Mainly refers to DTAs stemming from temporary differences (caused by different tax and accounting treatments) related to i) allowances and provisions for credit risk and insolvency and ii) allowances or contributions to welfare and early retirement schemes (Source: EY, KPMG).

10
half of it being eligible for conversion (Source: IMF, February 2014). Figure 8 shows how the
peer group compares to the system average. Bankinter’s solvency is the least penalized, while
Sabadell’s capital quality is significantly harmed by the above average DTA-to-CET1 of 71%,
followed by Caixabank (52%) and Banco Popular (37%) at 2014. When applying a more
conservative definition of capital where all DTAs (not only the non-eligible ones) are deducted
from CET1 capital, I have estimated the fully loaded CET1 ratios (See Figure 9), which reached
only 4.6% for Sabadell – barely above the 4.5% minimum requirement, 9.6% for Caixabank
and 9.3% for Banco Popular - which are still adequate, while Bankinter’s capital ratio remains
almost entirely unaffected (11.5%).
3) Profitability
Profitability remains weak sector-wise given 1) low interest rates, 2) ongoing deleveraging
and 3) still high albeit declining loan impairments (58% of pre-impairment profits in 2014
vs. ca. 100% in 201311)
On the positive side, earnings benefitted from 1) reduced funding costs (14.8% drop yoy12)
and 2) non-recurrent gains realized on carry trades with sovereign bonds
Banco Popular’s NIM of 1.7% is the best among its peers (See Figure 10a) thanks to its
extensive strategic focus on the higher yield SME segment, which accounted for 44% of the
loan book granting the bank a market share of 12% in this segment at 1H15. However, this is
partially offset by the riskiness of this client segment which resulted in credit costs that eroded
ca. 70% of pre-impairment profits at 2014 (See Figure 11a).
Bankinter’s superior asset quality helps top-line earnings (See Figure 10b), which is not
weighed down by the large share of non-earning assets. On the other hand, the bank is faced
with a substantial residential mortgage loan portfolio earning low yields and a sophisticated
client base of high-net-worth individuals, in which segment the bank is a price taker rather than
11 11 Bank of Spain, Financial Stability Report (May 2015)

11
a price maker. Unlike Banco Popular, bottom-lines are not heavily penalized by loan
impairments, with provisioning charges declining by 17% yoy at 2014 and making up only 37%
of pre-impairment profits, which compares well against peers. Overall, the bank has a return on
average equity of 7.6%, the highest among the four peers (See Figure 11b).
Sabadell’s earnings have benefitted from the bank’s strategic orientation towards the higher
yield SME sector as well as the expansion strategy through acquisitions. While the total
operating revenue has been upward sloping in the past 3 years (See Figure 10d), this was largely
attributable to the net trading income represented by one-off gains on the sale of securities
given favourable market conditions. The bank has the lowest cost-to-income ratio among the
peers with 41% at 2014 vs. 56% at 2013 (See Figure 15) as cost synergies from acquisitions
materialize.
Despite its position as 3rd largest bank in Spain with the strongest retail franchise and branch
network among the four banks, Caixabank’s bottom line profitability is the weakest when
measured by ROAE and RRWA (See Figure 15). This is partly due to the weak operating
efficiency, having the highest cost-to-income ratio (61% at 2014), but the bank targets to go
below 45% by 2018. The bank should gradually see the materialization of the cost synergies
from the Banca Civica, Banco de Valencia and Barclays Bank SAU acquisitions.
4) Funding and Liquidity
Focus on attracting customer deposits and reduce reliance on wholesale markets
Liquidity is supported by the ongoing deleveraging and the ECB’s TLTRO
Bankinter has been historically wholesale funded shown by the generally high Loan-to-Deposit
ratio (See Figure 12), although declined from 178% at 2011 to 138% at 3Q15 supported by the
expanding customer deposit base (Figure 13a), but still the highest among the four banks and
compares negatively against industry averages as well. It is noted that 59% of the wholesale
funds represent mortgage covered bonds, which can be considered as quasi-deposits since they

12
are mainly sold to retail clients. If these bonds are included in the LDR calculation, the ratio
drops from 138% at 3Q15 to ca. 116%, which is still slightly above that of domestic peers but
more manageable. In terms of liquidity, Bankinter reports €8.7bn in liquid assets (ca. 15% of
assets) at 3Q15, which covers more than two times the wholesale maturities of €3.8 in the next
three years (See Figure 14a).
Caixabank has the strongest funding profile in the peer group supported by its robust customer
deposit base which accounted for 73% of the funding at 3Q15 (See Figure 13b) thanks to its
strong retail franchise as third largest bank in Spain. This is also reflected by the LDR, which
has dropped from 141% at 2011 to 110% at 3Q15, driven by a combination of loan deleveraging
and expanding customer deposits (See Figure 12). Similarly to Bankinter, wholesale funding
(15% of the funding base) mainly stems from covered bonds (81% of wholesale at 3Q15).
Caixabank reports an ample stock of liquid assets (cash, interbank assets, deposits with central
banks, unencumbered sovereign bonds) in the amount of €51bn at 3Q15 (15% of assets) out of
which €23.8bn constitute the unused ECB facility. These resources provide more than enough
buffer against the wholesale maturities of €22.6bn in the next three years, which are well-spread
over time (See Figure 14b).
Sabadell has been historically retail funded, with customer deposits accounting for 72% of
funding sources at 3Q15 (See Figure 13c), after gradually increasing in the last 3 years mainly
supported by the bank’s growth strategy through acquisitions (2015: TSB, 2013: Banco Gallego
and Lloyds Spain, 2012: Banco CAM). This customer deposit growth can be traced down also
in the evolution of the LDR, which dropped from 127% at 2012 to 107% at 3Q15 (See Figure
12 and 13c). Additional funding is provided by 1) wholesale (14% at 3Q15), of which 58%
related to covered bonds, 2) ECB funding (6.3% of funding base or 6% of assets) and 3) repos
(5.5%). Sabadell reports an adequate stock of liquid assets reaching €24.4bn at 3Q15 (12% of
assets) out of which €11.5bn can be pledged with the ECB in case of need. Considering the

13
wholesale maturities of €9.4bn in the next three years (See Figure 14c), it is safe to state that
Sabadell has a sound liquidity buffer.
Banco Popular’s customer deposits have been the most resilient in the crisis, with a CAGR
(compound annual growth rate) of 9% over the period of 2011-2014. This is mirrored by the
evolution of the LDR as well, which has dropped from 153% at 2011 to 115% at 3Q15 (See
Figure 12 and 13d). It is notable that unlike peers, Banco Popular heavily relies on clearing
houses and repos, which provided 16% of the total funding base at 3Q15. This, together with
the bank’s sizeable funding from the ECB (10%) mainly from TLTRO (Targeted Longer-Term
Refinancing Operations), exposes the bank to political risks and margin call risks, putting
pressure on liquidity. Additionally, the bank resorts to wholesale funding (15%), in line with
peers, with 56% relating to covered bonds. The bank reports available liquid assets of €12.4bn
at 2014, which is enough to cover wholesale maturities in the next two years (Figure 14d).
5) Conclusions
Bankinter (baa3) is currently the highest rated bank in the peer group and the second highest
along with Banca March in the pool of rated Spanish banks by Moody’s following Banco
Santander (baa1) and BBVA (baa2). While it has the smallest market share among the four
banks, with total assets three times lower than Sabadell’s and Banco Popular’s, it generates
3/4th of their net profit, and total assets six times lower than Caixabank’s, but profits reach
almost half of Caixa’s at 2014. I believe it is safe to state that the biggest driving force of the
baa3 BCA is Bankinter’s superior asset quality, which materializes in the smallest NPL ratio,
immaterial CRE exposure and the lowest cost of risk. In my opinion, the baa3 rating is the
highest it can get, since the two Spanish banks (Santander & BBVA) rated only 1-2 notches
higher account for more than half of the domestic bank assets and they benefit from an extensive
geographic diversification in more advanced economies outside Spain. On the negative side,

14
downward pressure on the rating could materialize from 1) a higher reliance on wholesale
funding and 2) deterioration in the bank’s internal capital generation.
Caixabank (ba1) is the second highest rated among the four banks, to a large extent
underpinned by the strong retail franchise as third largest bank in Spain. Positive factors on the
bank’s credit rating are 1) the resilient customer deposit base and 2) the stabilizing and below
system average NPL ratio. In my view, the factor that could trigger a positive or negative rating
action is the evolution of Caixabank’s profitability, which is currently weak relative to the
bank’s size (ROAE and RRWA are the lowest in the peer group, see Figure 15).
Sabadell (ba3) comes the closest to Banco Popular in terms of market share and size as well
as risk profile. The 1-notch rating difference between the two mainly stems from the asset
quality indicators in which Sabadell compares favourably with stronger loan loss reserve
coverage, significantly lower CRE exposure and lower NPL ratio when accounting for the Asset
Protection Scheme. In my opinion, Sabadell’s credit rating could move upwards if the bank
manages 1) to continue the wind-down of the legacy portfolio linked to real estate with limited
losses, 2) improves its profitability indicators as it embarks on a corporate and SME banking
driven business profile, similar to Banco Popular and 3) enhances its capital quality, which is
currently harmed by the large stock of DTAs.
Banco Popular (b1) is the fifth largest bank in Spain, number one player in SME banking, but
with a historically weaker and more vulnerable credit risk profile compared to peers. I strongly
believe that the key to a higher rating is the wind down of the NPLs and real estate related
problem assets, which not only pressure the risk absorption capacity of the bank, but
significantly weighs down bottom line earnings, as cost of risk wipes out more than half of pre-
impairment profits.

15
Concluding, this paper serves as the foundation to future credit rating-related studies, such as
the potential development of a rating scorecard composed of financial ratios that define banks’
standalone credit worthiness. The comparative analysis allowed for exploiting how the chosen
banks are positioned relative to the sector and to each other as peers (See Figure 15), based on
the interactions between these financial fundamentals.

16
References
Reports and published articles
Banco de España. 2015. “Financial Stability Report”
Banco de España. 2014. “Presentation of the results of the ECB’s Comprehensive
Assessment”
European Central Bank. 2014. “Aggregate Report on the Comprehensive
Assessment”
European Commission. 2015. “Post-Programme Surveillance Report Spain”.
Occasional Papers 211
European Commission. 2015. “Macroeconomic imbalances Country Report – Spain”.
Occasional Papers 216
IMF. 2015. “Article Iv Consultation — Press Release; Staff Report; And Statement
By The Executive director For Spain”. IMF Country Report No. 15/232
IMF. 2015. “Spain – Selected Issues”. IMF Country Report No. 15/233
SEC’s Office of Investor Education and Advocacy - Investor Bulletin. 2013. “The
ABCs of Credit Ratings”. SEC Pub. No. 161
Fitch Ratings Global Bank Rating Criteria. 2015.
Moody’s Investors Service:
Rating Methodology: Banks (16th March, 2015)
Rating Symbols and Definitions (August, 2015)
Rating Action: Moody’s concludes reviews on 20 Spanish banks’ ratings (17th
June, 2015)
Announcement: Moody's publishes its new bank rating methodology (16th March,
2015)
Bank Rating Methodology: Analytical Approach in Brief (March, 2015)
Rating action: Moody's upgrades Spain's government bond rating to Baa2; assigns
positive outlook (21st February, 2014)
Rating Action: Moody's downgrades Spanish banks (25th June, 2012)
Rating Action: Moody's downgrades Spanish banks; ratings carry negative
outlooks or remain on review for downgrade (17th May, 2012)
Special Comment: Key Drivers of Spanish Bank Rating Actions (17th May, 2012)

17
Working Papers
Altunbas, Yener & Manganelli, Simone & Marques – Ibanez, David. 2011. “Bank
Risk During the Financial Crisis: Do Business Models Matter?”. ECB Working paper
No. 1394
De Santis, Roberto A. 2012. “The Euro Area Debt Crisis: Safe Haven, Credit Rating
Agencies and the Spread of the Fever from Greece, Ireland and Portugal”. ECB
Working paper No. 1419
Books
Bessis, Joel. 2010. Risk Management in Banking. Chichester: John Wiley & Sons Ltd
Resti, Andrea & Sironi, Andrea. 2007. Risk Management and Shareholders’ Value in
Banking. Chichester: John Wiley & Sons Ltd
Saunders, Anthony & Cornett, Marcia M. 2008. Financial Institutions Management:
A Risk Management Approach. New York: McGraw-Hill/Irwin
Financial Information for Bankinter, Caixabank, Banco de Sabadell and Banco Popular
Espanol:
Annual Reports 2010, 2011, 2012, 2013, 2014
Interim financials for 3Q15
Websites
http://ec.europa.eu/index_en.htm
http://www.consilium.europa.eu/
http://www.eba.europa.eu/
http://www.imf.org/en/Data
http://www.wsj.com/europe
http://www.reuters.com/
https://next.ft.com/uk
http://www.bloomberg.com/europe
https://www.fitchratings.com/
https://www.moodys.com/
http://bruegel.org/
https://www.pwc.com
http://www.bankinter.com
http://www.caixabank.com
https://www.grupbancsabadell.com/en/
http://www.grupobancopopular.com

18
Appendix
Figure 1: Moody’s Baseline Credit Assessment of the four Spanish banks (Source: Moody’s)
Figure 2: List of Spanish banks rated by Moody’s at June, 2015 (Source: Moody’s)
2011 2012 2013 2014
Baseline Credit Assessment (BCA)
Bankinter Caixabank Sabadell Banco Popular
baa2
baa3
ba1
ba2
ba3
b1
b2
Spanish Banks Rated by Moody's
17 June, 2015
Baseline Credit
Assessment (BCA)
Banco Santander, S.A. baa1
Banco Bilbao Vizcaya Argentaria, S.A. baa2
Caixabank ba1
Bankia, S.A. b2
Banco Sabadell, S.A. ba3
Banco Popular Espanol, S.A. b1
Unicaja Banco b1
Ibercaja Banco SA b1
Kutxabank, S.A. ba2
Bankinter, S.A. baa3
ABANCA Corporacion Bancaria, S.A. b3
Catalunya Banc caa2
Liberbank b1
Caja Laboral Popular Coop. de Credito ba1
Banco Cooperativo Espanol, S.A. ba2
Banca March S.A. baa3
CECABANK S.A. ba1
Caja Rural de Navarra baa3
Tota
l ass
ets
19
Figure 5: Evolution of loan book composition
42.6 44.9 44.3
22.2 22.9 22.5
17.4 16.6 14.76.3 7.4 6.73.5 1.6 6.08.1 6.5 5.7
2012 2013 2014
Banco Popular - Loan book evolution (%)
Corporates Residential mortgages
CRE FI
Governments Other retail
40.6 40.6 42.2
36.6 35.139.7
13.3 13.7 6.93.7 3.3 5.63.7 5.5 3.8
2.1 1.8 1.7
2012 2013 2014
Bankinter - Loan book evolution (%)
Corporates Residential mortgages
Other retail FI
Governments CRE
(b)
Figure 3: Evolution of banks’ NPL ratio (%)
0
5
10
15
20
25
Bankinter Caixabank Sabadell Banco Popular
NPL ratio (%)
2011 2012 2013 2014
(a)
Figure 4: Real estate – related problematic assets as percentage of gross loans at 2014
1% 2% 3% 1%1% 4% 4% 10%1%
5% 3%
8%
Bankinter Caixabank Sabadell Banco Popular
Real estate - related problematic assets as % of gross loans (2014)
Residential Mortgage Problem Loans CRE Problem Loans Repossessed Real Estate Assets

20
43.0 45.1 44.3
31.3 29.4 29.9
9.0 11.7 11.76.2 5.2 7.49.9 6.6 5.1
0.6 2.2 1.6
2012 2013 2014
Caixabank - Loan book evolution (%)
Residential mortgages Corporates Other retail
Governments CRE FI
(c)
(d)

21
Figure 6: Evolution of banks’ Total Capital Ratio (%)
Figure 7: ECB Comprehensive Assessment results for Spanish banks – ranked by basis points impact of
AQR on CET1 (Source: ECB)
6
11
16
21
Bankinter Caixabank Sabadell Banco Popular
Total Capital Ratio (%)
2011 2012 2013 2014
Adverse Baseline AQR Adverse Baseline AQR
Cajamar 11.0 8.0 10.2 10.0 -196 22 -105
Liberbank 8.7 5.6 8.5 7.8 -220 69 -83
Banco Popular 10.6 7.6 10.2 10.1 -250 14 -57
Banco Mare Nostrum 9.4 8.1 10.3 9.0 -93 128 -43
Bankinter 12.0 10.8 11.6 11.7 -87 -4 -37
BBVA 10.8 9.0 10.2 10.5 -158 -31 -21
Unicaja 11.1 8.9 11.1 10.9 -199 25 -21
Catalunya Banc 12.3 8.0 11.8 12.2 -420 -45 -10
Kutxabank 12.1 11.8 12.4 12.0 -22 33 -8
BFA / Bankia 10.7 10.3 12.3 10.6 -30 173 -8
Abanca (NCG Banco) 10.3 9.1 11.5 10.2 -104 132 -7
Banco Santander 10.4 8.9 11.1 10.3 -140 71 -4
Caixabank 10.3 9.3 10.8 10.2 -99 55 -4
Ibercaja 10.0 7.8 10.3 10.0 -219 30 -2
Banco de Sabadell 10.3 8.3 10.2 10.3 -193 -10 0
Bank Unstressed
FYE13 CET1%
Basis Points ImpactStressed CET1%
Figure 8: Deferred tax assets as percentage of
Common Equity Tier 1
5%
52%
71%
37%
Bankinter Caixabank Sabadell BancoPopular
DTA / CET1 at 2014
System average: 40%
Figure 9: Adjusted CET1 ratio for DTAs
0.0%
5.0%
10.0%
15.0%
Bankinter Caixabank Sabadell Banco Popular
Adjusted CET1% for DTAs at 2014
CET1 less DTC (%) CET1 %

22
Figure 10: Evolution of the operating revenue (€m) and Net Interest Margin (%)
0.0%
0.5%
1.0%
1.5%
2.0%
2.5%
0
1,000
2,000
3,000
4,000
5,000
2010 2011 2012 2013 2014
Banco Popular
Net Interest Income Net Fee
Net Trading NIM
0.0%
0.5%
1.0%
1.5%
0
500
1,000
1,500
2010 2011 2012 2013 2014
Bankinter
Net Interest Income Net FeeNet Trading NIM
(b)
1.1%
1.2%
1.3%
1.4%
1.5%
0
2,000
4,000
6,000
8,000
2011 2012 2013 2014
Caixabank
Net Interest Income Net FeeNet Trading NIM
(c)
0.0%
0.5%
1.0%
1.5%
2.0%
0
2,000
4,000
6,000
2010 2011 2012 2013 2014
Sabadell
Net Interest Income Net Fee
Net Trading NIM
(d)
(a)

23
Figure 11: Impact of loan provisions on net profit
Figure 12: Evolution of the Loan – to – Deposit Ratio
-30%
-20%
-10%
0%
10%
-5,000
-4,000
-3,000
-2,000
-1,000
0
1,000
2010 2011 2012 2013 2014
Banco Popular
Net Profit Loan provisions ROAE
(a)
0%
2%
4%
6%
8%
-600
-400
-200
0
200
400
2010 2011 2012 2013 2014
Bankinter
Net Profit Loan provisions ROAE
(b)
0%
2%
4%
6%
-6,000
-4,000
-2,000
0
2,000
2011 2012 2013 2014
Caixabank
Net Profit Loan provisions ROAE
(c)
0%
2%
4%
6%
8%
-2,000
-1,500
-1,000
-500
0
500
2010 2011 2012 2013 2014
Sabadell
Net Profit Loan provisions ROAE
(d)
178%
141%
124%
153%
177%
132% 127% 131%139%
113%114% 119%
142%
105%113%
121%
Bankinter Caixabank Sabadell Banco Popular
Loan - to - deposit ratio
2011 2012 2013 2014

24
Figure 13: Evolution of funding structure
Figure 14: Wholesale funding maturities at 3Q15 (€bn)
50% 48%62% 61% 64%
34% 27%24% 24% 25%
17% 25% 14% 15% 10%
178%177%
139%
142%
138%
2011 2012 2013 2014 3Q15
Bankinter
Customer deposits Wholesale funding
Net Interbank LDR
64% 62% 68% 74% 73%
26% 22% 18% 17% 15%
9% 17% 14% 9% 11%
141%132%
113% 105%110%
2011 2012 2013 2014 3Q15
Caixabank
Customer deposits Wholesale funding
Net interbank LDR
(b)
66% 59%69% 70% 72%
24%21%
17% 17% 14%
10%20% 14% 13% 14%
124% 127%114% 113% 107%
2011 2012 2013 2014 3Q15
Sabadell
Customer deposits Wholesale funding
Net Interbank LDR
54% 59% 66% 59% 59%
24% 20% 14%13% 15%
11% 8% 18% 22% 16%12% 13%
3%7% 10%
153% 131%119% 121% 115%
2011 2012 2013 2014 3Q15
Banco Popular
Deposits Wholesale
Clearing H. & Repo ECB
LDR
0.6
1.4
10.8
2015 2016 2017 2018
Bankinter
3.8
7.8
5.8 5.2
2015 2016 2017 2018
Caixabank (b)
0.5
4.6
3.1
1.7
2015 2016 2017 2018
Sabadell (c)
4.3
2.93.5
1.4
2015 2016 2017 2018
Banco Popular (d)(a)
(a)
(c) (d)

25
Figure 15: Peer Group Table
Moody's BCA ba1 ba1 ba1 baa3 ba1 ba1 ba1 ba1 ba2 ba2 ba3 ba3 ba2 b1 b1 b1
12-months ended (€m) 2011 2012 2013 2014 2011 2012 2013 2014 2011 2012 2013 2014 2011 2012 2013 2014
Asset Quality (%)
NPL ratio 3.2 4.4 5.2 4.8 5.1 8.9 11.7 9.9 6.4 16.1 19.5 18.3 7.1 11.6 18.9 18.3
Cost of risk (bps) 34 92 65 52 119 170 189 103 68 109 83 149 95 357 104 155
CRE / gross loans N/A 2.1 1.8 1.7 N/A 9.9 6.6 5.1 N/A 11.7 10.0 7.2 N/A 17.4 16.6 14.7
Capitalization (%)
CET1 ratio 8.8 10.4 12.9 11.9 12.5 11.0 12.9 13.0 9.0 10.5 12.0 11.7 10.0 10.3 11.2 11.5
Total Capital Ratio 11.7 12.9 14.1 13.1 12.8 11.6 14.5 16.1 11.0 11.4 12.8 12.8 10.2 11.0 11.6 12.0
DTA / CET1 4.1 5.6 4.5 4.7 13.2 40.1 57.5 51.9 19.7 70.9 71.1 70.7 11.8 38.8 34.8 37.3
Profitability (%)
Net interest margin 0.9 1.2 1.2 1.4 1.3 1.2 1.3 1.4 1.7 1.3 1.3 1.6 1.7 1.9 1.9 1.6
RRWA 0.6 0.5 0.8 1.1 0.8 0.1 0.2 0.4 0.4 0.1 0.2 0.5 0.5 -2.8 0.3 0.4
ROAE 5.9 3.9 5.7 7.6 5.1 1.1 1.3 2.5 4.1 1.3 1.7 3.5 5.8 -26.8 2.4 2.7
Cost-to-Income Ratio 62.7 53.7 55.8 54.7 46.4 46.3 61.8 61.5 51.8 61.8 55.7 40.9 39.3 47.5 42.9 43.8
Funding & Liquidity (%)
Loan - to - deposit ratio 178.0 176.9 139.4 141.6 141.1 132.1 113.1 104.8 124.3 127.5 113.7 112.9 153.3 131.0 118.6 121.3
Market share (of assets at FYE14) 2% 9% 4.6% 4.5%
Banco PopularSabadellBankinter Caixabank