
Comparability of Suspended-Sediment Concentration and ... · Total Suspended Solids ... to quantify...
16
Comparability of Suspended-Sediment Concentration and Total Suspended-Solids Data for Two Sites on the L’Anguille River, Arkansas, 2001 to 2003 U.S. Department of the Interior U.S. Geological Survey Scientific Investigations Report 2005-5193
-
Upload
nguyenmien -
Category
Documents
-
view
222 -
download
0
Transcript of Comparability of Suspended-Sediment Concentration and ... · Total Suspended Solids ... to quantify...
Comparability of Suspended-Sediment Concentration and Total Suspended-Solids Data for Two Sites on the L’Anguille River, Arkansas, 2001 to 2003
U.S. Department of the Interior U.S. Geological Survey
Scientific Investigations Report 2005-5193

.
Front Cover: Photograph of the L’Anguille River looking downstream from the U.S. Geological Survey gaging station at Palestine, Arkansas, May 2005. Photograph by Elizabeth A. Beavers, U.S.Geological Survey.
Comparability of Suspended-Sediment Concentration and Total Suspended-Solids Data for Two Sites on the L’Anguille River, Arkansas, 2001 to 2003
By Joel M. Galloway, Dennis A. Evans, and W. Reed Green
U.S. Department of the Interior U.S. Geological Survey
Scientific Investigations Report 2005-5193

U.S. Department of the InteriorGale A. Norton, Secretary
U.S. Geological SurveyP. Patrick Leahy, Acting Director
U.S. Geological Survey, Reston, Virginia: 2005For sale by U.S. Geological Survey, Information Services Box 25286, Denver Federal Center Denver, CO 80225
For more information about the USGS and its products: Telephone: 1-888-ASK-USGS World Wide Web: http://www.usgs.gov/
Any use of trade, product, or firm names in this publication is for descriptive purposes only and does not imply endorsement by the U.S. Government.
Although this report is in the public domain, permission must be secured from the individual copyright owners to repro-duce any copyrighted materials contained within this report.
Contents
iii
Abstract...................................................................................................................................................................................................... 1Introduction ............................................................................................................................................................................................... 1
Purpose and Scope ...................................................................................................................................................................... 2Study Area Description ................................................................................................................................................................ 2
Methods of Study ..................................................................................................................................................................................... 2Field Methods ................................................................................................................................................................................ 2Laboratory Methods ..................................................................................................................................................................... 2
Suspended-Sediment Concentration ............................................................................................................................. 2Total Suspended Solids..................................................................................................................................................... 5
Statistical Methods....................................................................................................................................................................... 5Description of Data Used in Evaluation ................................................................................................................................................ 5Comparability of Suspended-Sediment Concentration and Total Suspended-Solids Data ........................................................ 7Summary .................................................................................................................................................................................................. 10References .............................................................................................................................................................................................. 10
Figures
1. Map showing locations of water-quality sites on the L’Anguille River at Palestine and near Colt in eastern Arkansas........................................................................................................................................................................................ 3
2. Graphs showing daily mean streamflow for the L’Anguille River near Colt and the L’Anguille River at Palestine from August 2001 to October 2003............................................................................................................................................. 4
3. Boxplots showing distribution of suspended-sediment concentrations and total suspended solids for the L’Anguille River near Colt and the L’Anguille River at Palestine from August 2001 to October 2003.............................. 5
4. Graph showing time series of suspended-sediment concentrations and total suspended solids data for the L’Anguille River near Colt and the L’Anguille River at Palestine from August 2001 to October 2003.............................. 6
5. Boxplot showing distribution of suspended-sediment concentrations from samples collected using automatic pumping samplers and using the equal width increment cross-section method for the L’Anguille River near Colt and the L’Anguille River at Palestine, Arkansas from August 2001 to October 2003 ........................................................ 7
6-9. Graphs showing:6. Differences between suspended-sediment concentration and total suspended solids for the L’Anguille
River near Colt from August 2001 to October 2003 in relation to time and streamflow .............................................. 77.Relation between suspended-sediment concentration and total suspended solids for the L’Anguille
River near Colt from August 2001 to October 2003............................................................................................................ 88. Differences between suspended-sediment concentrations and total suspended solids for the L’Anguille River
at Palestine from August 2001 to October 2003 in relation to time and streamflow.................................................... 89. Relation between suspended-sediment concentration and total suspended solids for the L’Anguille River
at Palestine from August 2001 to October 2003................................................................................................................. 9
Comparability of Suspended-Sediment Concentration and Total Suspended-Solids Data for Two Sites on the L’Anguille River, Arkansas, 2001 to 2003
By Joel M. Galloway, Dennis A. Evans, and W. Reed Green
Abstract
Suspended-sediment concentration and total suspended solids data collected with automatic pumping samplers at the L'Anguille River near Colt and the L'Anguille River at Pales-tine, Arkansas, August 2001 to October 2003 were compared using ordinary least squares regression analyses to determine the relation between the two datasets for each of the two sites. The purpose of this report is to describe the suspended-sediment concentration and total suspended-solids data and examine the comparability of the two datasets for each site.
Suspended-sediment concentration and total suspended solids data for the L'Anguille River varied spatially and tempo-rally from August 2001 to October 2003. The site at the L'Anguille River at Palestine represents a larger portion of the L'Anguille River Basin than the site near Colt, and generally had higher median suspended-sediment concentration and total suspended solids and greater ranges in values. The differences between suspended-sediment concentration and total suspended solids data for the L'Anguille River near Colt appeared inversely related to streamflow and not related to time. The rela-tion between suspended-sediment concentration and total sus-pended solids at the L'Anguille River at Palestine was more variable than at Colt and did not appear to have a relation with flow or time. The relation between suspended-sediment con-centration and total suspended solids for the L'Anguille River near Colt shows that total suspended solids increased propor-tionally as suspended-sediment concentration increased. How-ever, the relation between suspended-sediment concentration and total suspended solids for the L'Anguille River at Palestine showed total suspended solids increased less proportionally as suspended-sediment concentration increased compared to the L’Anguille River near Colt.
Differences between the two analytical methods may par-tially explain differences between the suspended-sediment con-centration and total suspended solids data at the two sites. Total suspended solids are analyzed by removing an aliquot of the original sample for further analysis, and suspended-sediment concentrations are analyzed using all sediment and the total mass of the sample. At the L’Anguille River at Palestine another source of variability in the two data sets could have been the location of the automatic pumping sampler intake. The
intake was located at a point in the stream cross-section that was subject to sedimentation, which may have resulted in positive sample bias.
Introduction
The L'Anguille River in eastern Arkansas is considered to have impaired water quality to the extent that a total daily max-imum load (TMDL) for turbidity and fecal coliform has been established by the Arkansas Department of Environmental Quality (Arkansas Department of Environmental Quality, 2005). The major land use in the L'Anguille River Basin is row-crop agriculture (Green and others, 2000). The Arkansas Natu-ral Resources Commission (ANRC) currently (2005) is provid-ing assistance to implement best management practices (BMP's) to improve water quality in the L'Anguille River Basin. As part of the evaluation of BMP's, ANRC is developing and calibrating a soil and water assessment model (SWAT) (U.S. Department of Agriculture Agricultural Research Service, 2004) to test the effectiveness of BMP implementation. The SWAT model requires data in the form of suspended-sediment concentration (SSC) for calibration.
SSC and total suspended solids (TSS) commonly are used to quantify concentrations of suspended solid-phase material in surface water. Often TSS is used as a surrogate for SSC, which includes the inorganic sand, silt, and clay matrix transported in streams, and SSC and TSS frequently have been used inter-changeably. However, the analytical methods differ and the two may not be equivalent when solid-phase material, especially sand, becomes more concentrated (Gray and others, 2000). SSC analytical methods measure all the sediment and the mass of the entire water-sediment mixture of the original sample; TSS methods only use an aliquot of the original sample for subse-quent analysis. SSC typically is used to analyze natural water while TSS originally was designed for wastewater discharge analyses and later was extended operationally to include natural water (Gray and others, 2000).
Gray and others (2000) show that TSS is fundamentally unreliable for the analysis of solid-phase material in natural-water samples with sand-size material, but concluded that the SSC method produces relatively reliable results regardless of

2 Comparability of Suspended-Sediment Concentration and Total Suspended-Solids Data for Two Sites on the L’Anguille River, Arkansas, 2001 to 2003
the amount or percentage of sand-size material. Gray and others (2000) also concluded that SSC and TSS data collected from natural water are not comparable and should not be used inter-changeably, and that the accuracy and comparability of sus-pended solid-phase concentrations of natural waters would be greatly enhanced if SSC data were used.
Many water-quality monitoring programs analyze TSS to measure the solid-phase material in natural water. However, the SWAT model uses SSC. The U.S. Geological Survey (USGS) has collected SSC and TSS data at the L'Anguille River near Colt and the L'Anguille River at Palestine, Arkansas, in cooper-ation with the ANRC from August 2001 to October 2003 for the purpose of comparing the two methods of quantifying the sus-pended solid-phase material in the stream.
Purpose and Scope
The purpose of this report is to describe the SSC and TSS data collected at the L'Anguille River near Colt and the L'Anguille River at Palestine, Arkansas, and examine the com-parability of the SSC and TSS data. Streamflow, SSC, and TSS data were collected at the two sites on the L'Anguille River from August 2001 to October 2003. Paired SSC and TSS data col-lected using automatic pumping samplers were compared using ordinary least squares regression analyses to determine the rela-tion between the two datasets for each of the two sites.
Study Area Description
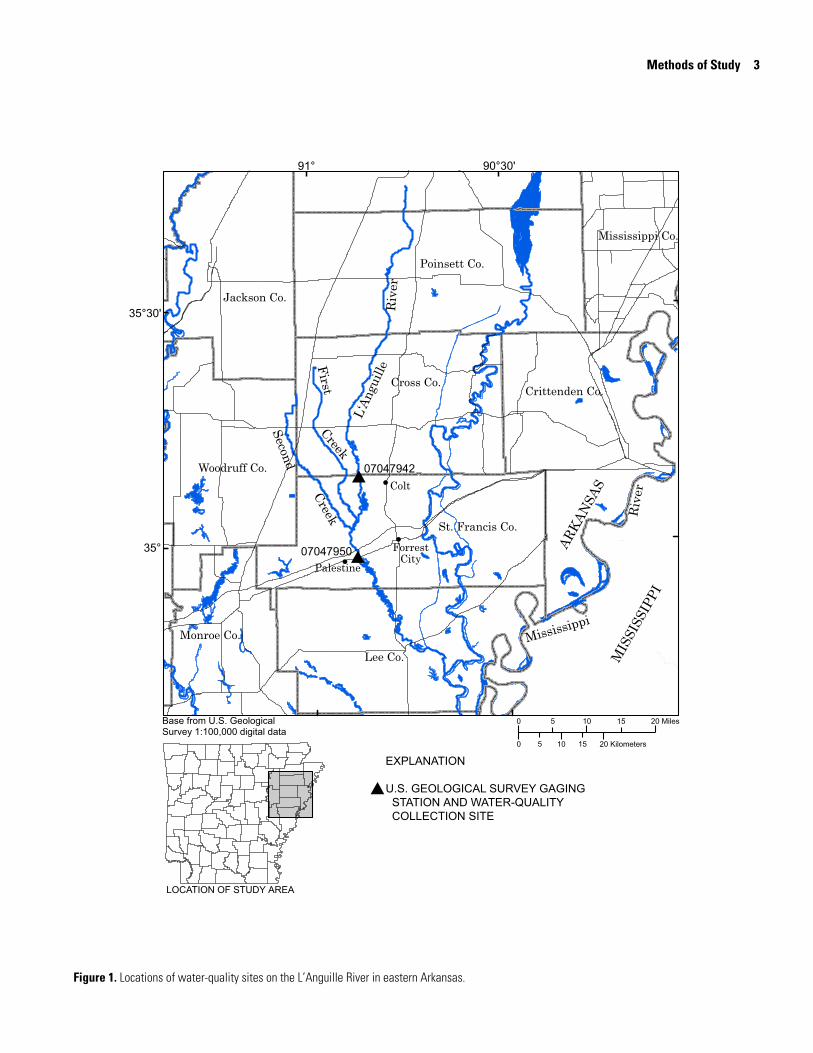
The L'Anguille River (fig. 1) is within the St. Francis River Basin and has a drainage area of 938 square miles at the conflu-ence with the St. Francis River in eastern Arkansas (Christensen and others, 1967). The L'Anguille River Basin is composed pre-dominately of agricultural land and many of the stream chan-nels within the basin have been modified for flood control in support of agricultural purposes (Green and others, 2000). Large quantities of sediment are transported in the L'Anguille River system because of the natural physiography (Kleiss and others, 2000) and as a result of channel modifications.
Streamflow for the L'Anguille River varies annually and seasonally (fig. 2). The mean annual streamflow for the L'Anguille River near Colt was 724 cubic feet per second (ft3/s) for the period of record (1970 to 2003) and the mean annual streamflow for the L'Anguille River at Palestine was 1,128 ft3/s for the period of record (1949 to 2003) (Evans and others, 2004). The mean streamflow for the L’Anguille River near Colt for the period of August 2001 to October 2003 was 856 ft3/s, which was greater than the mean annual streamflow for the period of record. Daily mean streamflows ranged from 2.27 to 9,986 ft3/s for August 2001 through October 2003. Similarly, the mean streamflow for the L’Anguille River at Palestine for the period of August 2001 to October 2003 (1,450 ft3/s) was greater than the mean annual streamflow for the period of record. The daily mean streamflow ranged from 0 to 22,400 ft3/s for August 2001 through October 2003 (Porter and others,
2002; Brossett and Evans, 2003; Evans and others, 2004). The highest streamflow for the L'Anguille River generally occurs in the winter (December through February) and spring (March through May), and the lowest streamflow generally occurs in the summer (June through August) and fall (September through November).
Methods of Study
Field Methods
Samples were collected at the L'Anguille River near Colt and the L'Anguille River at Palestine using automatic pumping samplers with fixed-point intakes. The intake at the site near Colt was mounted vertically on a bridge at the deepest point in the stream cross section. Because of mounting restrictions on the bridge at the L'Anguille River at Palestine, the intake was mounted horizontally with a slight downward angle on the shal-low bank of the stream, extending to the deepest point of the stream cross section. Samples were collected once daily at about 12:00 noon and during site inspections (approximately monthly), when the sampler was operated manually to collect a sample. Periodically, cross-sectional and depth-integrated com-posite samples were collected manually using the equal width increment (EWI) method described in Wilde and others (1999). EWI samples were collected to adjust SSC values from samples collected by the automatic pumping sampler, which collects samples at a single point, to reflect the representative concentra-tions in the entire stream cross section. Samples collected using the EWI method were not analyzed for TSS, and only samples collected by the automatic pumping samplers were used for the comparison between SSC and TSS. Unadjusted SSC values were used in the comparison with TSS values at both sites, because EWI samples were not analyzed for TSS to apply cor-rections to the point samples.
Laboratory Methods
Samples collected by the automatic pumping samplers and manually using the EWI method were analyzed for SSC by the USGS Missouri Water Science Center laboratory using proce-dures presented in Guy (1969). Samples collected by the auto-matic pumping samplers also were analyzed for TSS by the USGS Arkansas Water Science Center laboratory following procedures presented in American Public Health Association, American Water Works Association, and Water Pollution Con-trol Federation (1995).
Suspended-Sediment Concentration
SSC was determined using a filtration method (Guy, 1969). The gross weight of the sample (water-sediment mix-ture) was determined, and the total sample volume was filtered
Methods of Study 3
Figure 1. Locations of water-quality sites on the L’Anguille River in eastern Arkansas.

4 Comparability of Suspended-Sediment Concentration and Total Suspended-Solids Data for Two Sites on the L’Anguille River, Arkansas, 2001 to 2003
Figure 2. Daily mean streamflow for the L’Anguille River near Colt and the L’Anguille River at Palestine from August 2001 to October 2003.
Description of Data Used in Evaluation 5
through a Whatman grade 934AH, 24-millimeter (mm)-diame-ter filter that had been inserted into a crucible and dried at 110 degrees Celsius (°C) + 2 °C, cooled, and weighed. The filtered sample then was dried until all visible water was evaporated, and heated for 1 hour at 110 °C + 2 °C. The crucible was cooled in a desiccator at room temperature and weighed. The weight of the remaining material in the crucible (milligrams) then was divided by the volume of the water-sediment mixture passed through the filter (liters) to determine the concentration of the sample (milligrams per liter).
Total Suspended Solids
According to the American Public Health Association, American Water Works Association, and Water Pollution Con-trol Federation (1995), the TSS analytical method uses a prede-termined volume from the original water sample obtained immediately after the sample has been well mixed. An aliquot of the sample, usually 100 to 200 milliliters (mL), was poured into a graduated cylinder after sufficient agitation of the sample. The aliquot was filtered through a Whatman grade 934AH, 24-mm-diameter filter (that had been inserted into a crucible) and dried at 103 °C to 105 °C for 1 hour, cooled, and weighed. The process is repeated until the loss in weight is less than 4 percent of the previous weight. The filtered aliquot then was dried at 103 °C to 105 °C for 1 hour. The crucible then was cooled in a desiccator at room temperature and weighed. The weight of the remaining material in the crucible (milligrams) then was divided by the volume of the aliquot passed through the filter (liters) to determine the concentration of the sample (milligrams per liter).
Statistical Methods
SSC and TSS data were analyzed or summarized using several statistical and graphical techniques. Boxplots and time-series plots were used to compare SSC and TSS data between sites for data collected from August 2001 to October 2003. The Wilcoxon rank sum test (Helsel and Hirsch, 1992) was used to test for differences between SSC and TSS at each site. The Wil-coxon rank sum test is a nonparametric test that determines the probability (p) that the mean of a dataset is similar to the mean of another dataset. An ordinary least squares regression analysis was used to compare paired SSC and TSS data at each site. The error of the regression analyses are given by the 95-percent con-fidence intervals and the prediction intervals. The 95-percent confidence interval around the estimated slope of the regression line would include the true slope 95 percent of the time. The prediction interval defines a range of values for the dependent variable (SSC) for a given level of uncertainty. For this report, 95-percent prediction intervals were determined for each regression. For a given independent variable (TSS), the 95-per-cent prediction interval represented the range of values expected for the dependent variable 95 percent of the time. The larger the range of values, the more uncertainty there was asso-ciated with the regression model (Helsel and Hirsch, 1992).
Description of Data Used in Evaluation
SSC and TSS data in the L'Anguille River varied spatially and temporally from August 2001 to October 2003. The site at the L'Anguille River at Palestine represents a larger portion of the L'Anguille River Basin than the site near Colt, and generally had higher median SSC and TSS values and greater ranges in
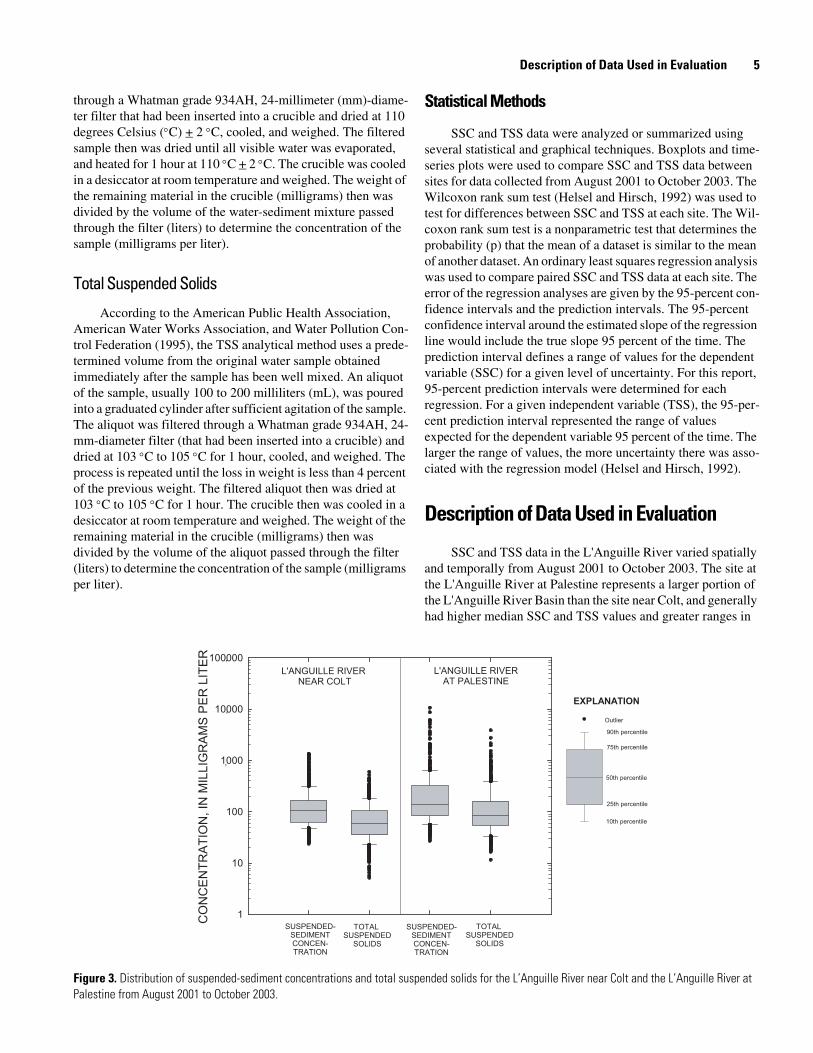
Figure 3. Distribution of suspended-sediment concentrations and total suspended solids for the L’Anguille River near Colt and the L’Anguille River at Palestine from August 2001 to October 2003.

6 Comparability of Suspended-Sediment Concentration and Total Suspended-Solids Data for Two Sites on the L’Anguille River, Arkansas, 2001 to 2003
values (fig. 3). The median SSC and TSS for the L'Anguille River at Palestine were 137 and 86 milligrams per liter (mg/L), respectively. The SSC ranged from 27 to 10,700 mg/L and TSS ranged from 12 to 3,875 mg/L. The median SSC and TSS for the L'Anguille River near Colt were 104 and 60 mg/L, respectively.The SSC ranged from 24 to 1,360 mg/L and the TSS ranged from 5.2 to 601 mg/L. SSC and TSS generally were greater during the spring and summer months and less during the fall and winter months at both sites (fig. 4).
Water samples collected using the EWI method were ana-lyzed for SSC and compared to SSC collected by the automatic pumping samplers. The difference between paired SSC from the automatic sampler and the EWI method (EWI method SSC minus automatic sampler SSC) for the L’Anguille River near Colt ranged from -149 mg/L to 307 mg/L. The median SSC for samples collected using the EWI method was 94 mg/L and the median SSC for paired samples collected using the automatic sampler was 129 mg/L (fig. 5). The difference between paired SSC values from the automatic sampler and the EWI method for
the L’Anguille River at Palestine ranged from -5,474 mg/L to 43 mg/L. The median SSC for samples collected using the EWI method was 92 mg/L and the median SSC for paired samples collected using the automatic sampler was 264 mg/L, which is nearly three times the median SSC from samples collected using the EWI method. The differences in SSC between sam-pling methods at the L’Anguille River at Palestine probably are related to the location of the automatic sampler intake at the site. Because of unavoidable limitations on the placement of the intake, the intake was installed horizontally, with a slight down-ward angle at a point in the stream cross section that was not ideal. The intake was subject to sedimentation at this location, which may have resulted in the observed positive bias. The intake at the site near Colt was placed in a more ideal location (oriented vertically and in the deepest part of the stream cross section), which resulted in more similar SSC between water samples collected by these two methods, then observed at the L’Anguille River at Palestine.
Figure 4. Time series of suspended-sediment concentrations and total suspended solids for the L’Anguille River near Colt and the L’Anguille River at Palestine from August 2001 to October 2003.
Comparability of Suspended-Sediment Concentration and Total Suspended-Solids Data 7
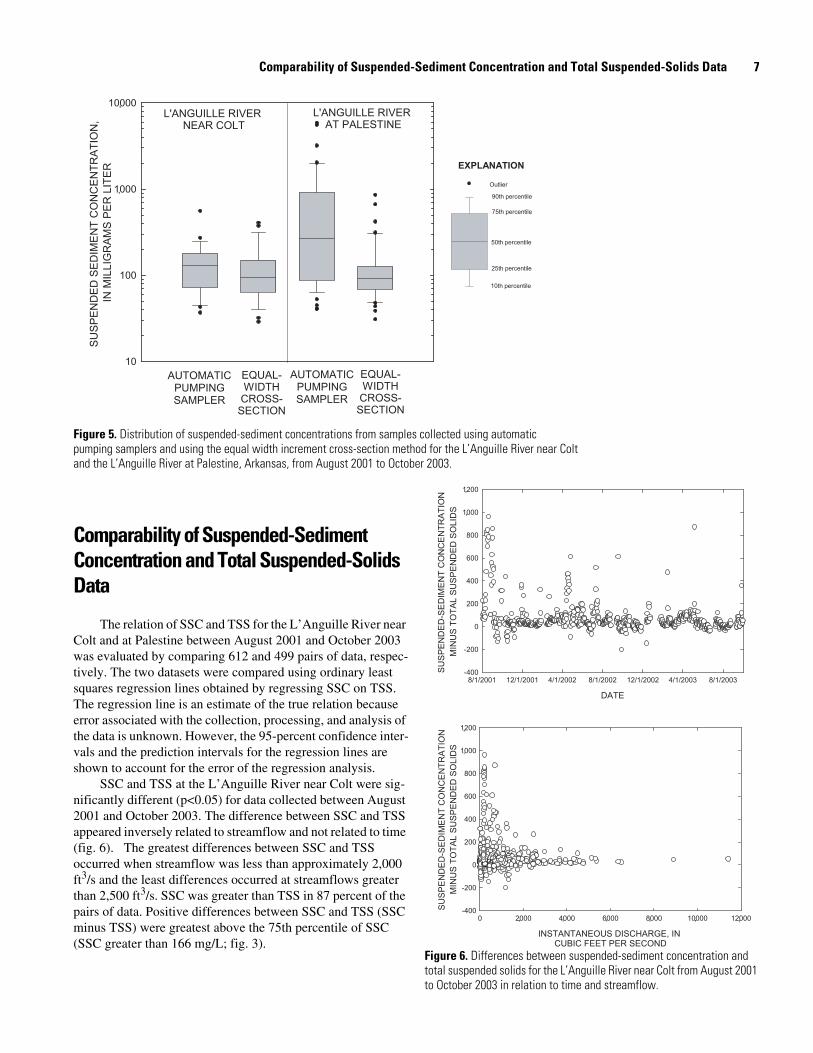
Figure 5. Distribution of suspended-sediment concentrations from samples collected using automatic pumping samplers and using the equal width increment cross-section method for the L’Anguille River near Coltand the L’Anguille River at Palestine, Arkansas, from August 2001 to October 2003.
Comparability of Suspended-Sediment Concentration and Total Suspended-Solids Data
The relation of SSC and TSS for the L’Anguille River near Colt and at Palestine between August 2001 and October 2003 was evaluated by comparing 612 and 499 pairs of data, respec-tively. The two datasets were compared using ordinary least squares regression lines obtained by regressing SSC on TSS. The regression line is an estimate of the true relation because error associated with the collection, processing, and analysis of the data is unknown. However, the 95-percent confidence inter-vals and the prediction intervals for the regression lines are shown to account for the error of the regression analysis.
SSC and TSS at the L’Anguille River near Colt were sig-nificantly different (p<0.05) for data collected between August 2001 and October 2003. The difference between SSC and TSS appeared inversely related to streamflow and not related to time (fig. 6). The greatest differences between SSC and TSS occurred when streamflow was less than approximately 2,000 ft3/s and the least differences occurred at streamflows greater than 2,500 ft3/s. SSC was greater than TSS in 87 percent of the pairs of data. Positive differences between SSC and TSS (SSC minus TSS) were greatest above the 75th percentile of SSC (SSC greater than 166 mg/L; fig. 3).
Figure 6. Differences between suspended-sediment concentration and total suspended solids for the L’Anguille River near Colt from August 2001 to October 2003 in relation to time and streamflow.
8 Comparability of Suspended-Sediment Concentration and Total Suspended-Solids Data for Two Sites on the L’Anguille River, Arkansas, 2001 to 2003
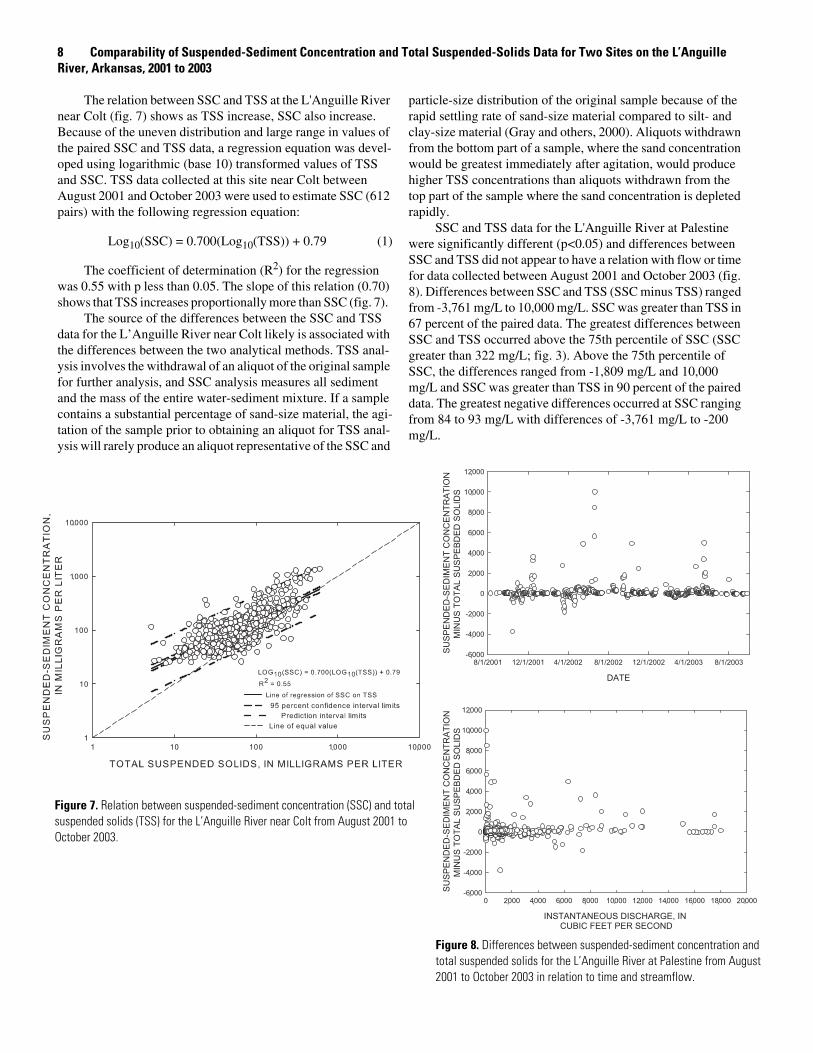
The relation between SSC and TSS at the L'Anguille River near Colt (fig. 7) shows as TSS increase, SSC also increase. Because of the uneven distribution and large range in values of the paired SSC and TSS data, a regression equation was devel-oped using logarithmic (base 10) transformed values of TSS and SSC. TSS data collected at this site near Colt between August 2001 and October 2003 were used to estimate SSC (612 pairs) with the following regression equation:
Log10(SSC) = 0.700(Log10(TSS)) + 0.79 (1)
The coefficient of determination (R2) for the regression was 0.55 with p less than 0.05. The slope of this relation (0.70) shows that TSS increases proportionally more than SSC (fig. 7).
The source of the differences between the SSC and TSS data for the L’Anguille River near Colt likely is associated with the differences between the two analytical methods. TSS anal-ysis involves the withdrawal of an aliquot of the original sample for further analysis, and SSC analysis measures all sediment and the mass of the entire water-sediment mixture. If a sample contains a substantial percentage of sand-size material, the agi-tation of the sample prior to obtaining an aliquot for TSS anal-ysis will rarely produce an aliquot representative of the SSC and
particle-size distribution of the original sample because of the rapid settling rate of sand-size material compared to silt- and clay-size material (Gray and others, 2000). Aliquots withdrawn from the bottom part of a sample, where the sand concentration would be greatest immediately after agitation, would produce higher TSS concentrations than aliquots withdrawn from the top part of the sample where the sand concentration is depleted rapidly.
SSC and TSS data for the L'Anguille River at Palestine were significantly different (p<0.05) and differences between SSC and TSS did not appear to have a relation with flow or time for data collected between August 2001 and October 2003 (fig. 8). Differences between SSC and TSS (SSC minus TSS) ranged from -3,761 mg/L to 10,000 mg/L. SSC was greater than TSS in 67 percent of the paired data. The greatest differences between SSC and TSS occurred above the 75th percentile of SSC (SSC greater than 322 mg/L; fig. 3). Above the 75th percentile of SSC, the differences ranged from -1,809 mg/L and 10,000 mg/L and SSC was greater than TSS in 90 percent of the paired data. The greatest negative differences occurred at SSC ranging from 84 to 93 mg/L with differences of -3,761 mg/L to -200 mg/L.
t
Figure 7. Relation between suspended-sediment concentration (SSC) and total suspended solids (TSS) for the L’Anguille River near Colt from August 2001 to October 2003.
Figure 8. Differences between suspended-sediment concentration andtotal suspended solids for the L’Anguille River at Palestine from Augus2001 to October 2003 in relation to time and streamflow.
Comparability of Suspended-Sediment Concentration and Total Suspended-Solids Data 9
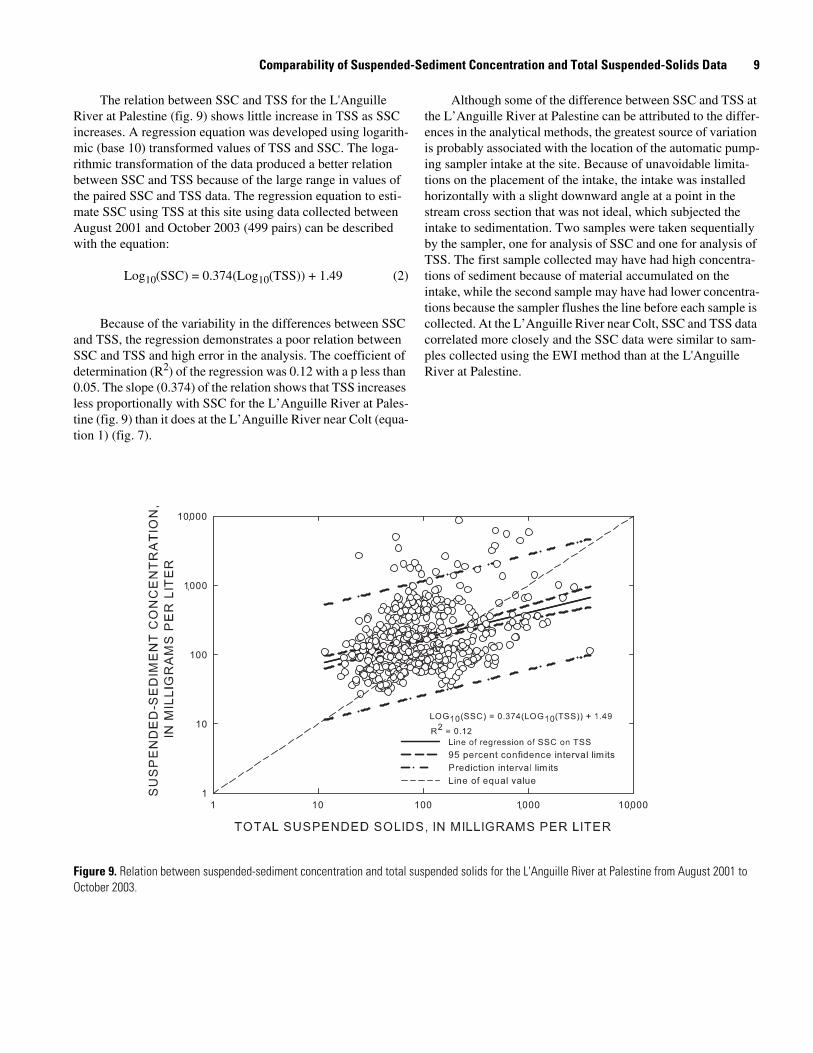
The relation between SSC and TSS for the L'Anguille River at Palestine (fig. 9) shows little increase in TSS as SSC increases. A regression equation was developed using logarith-mic (base 10) transformed values of TSS and SSC. The loga-rithmic transformation of the data produced a better relation between SSC and TSS because of the large range in values of the paired SSC and TSS data. The regression equation to esti-mate SSC using TSS at this site using data collected between August 2001 and October 2003 (499 pairs) can be described with the equation:
Log10(SSC) = 0.374(Log10(TSS)) + 1.49 (2)
Because of the variability in the differences between SSC and TSS, the regression demonstrates a poor relation between SSC and TSS and high error in the analysis. The coefficient of determination (R2) of the regression was 0.12 with a p less than 0.05. The slope (0.374) of the relation shows that TSS increases less proportionally with SSC for the L’Anguille River at Pales-tine (fig. 9) than it does at the L’Anguille River near Colt (equa-tion 1) (fig. 7).
Although some of the difference between SSC and TSS at the L’Anguille River at Palestine can be attributed to the differ-ences in the analytical methods, the greatest source of variation is probably associated with the location of the automatic pump-ing sampler intake at the site. Because of unavoidable limita-tions on the placement of the intake, the intake was installed horizontally with a slight downward angle at a point in the stream cross section that was not ideal, which subjected the intake to sedimentation. Two samples were taken sequentially by the sampler, one for analysis of SSC and one for analysis of TSS. The first sample collected may have had high concentra-tions of sediment because of material accumulated on the intake, while the second sample may have had lower concentra-tions because the sampler flushes the line before each sample is collected. At the L’Anguille River near Colt, SSC and TSS data correlated more closely and the SSC data were similar to sam-ples collected using the EWI method than at the L'Anguille River at Palestine.
Figure 9. Relation between suspended-sediment concentration and total suspended solids for the L'Anguille River at Palestine from August 2001 to October 2003.
10 Comparability of Suspended-Sediment Concentration and Total Suspended-Solids Data for Two Sites on the L’Anguille River, Arkansas, 2001 to 2003
Summary
Many water-quality monitoring programs analyze TSS to measure the solid-phase material in natural water. However, the SWAT model uses SSC. The USGS has collected SSC and TSS data at the L’Anguille River near Colt and the L’Anguille River at Palestine, Arkansas, in cooperation with the ANRC from August 2001 to October 2003 for the purpose of comparing the two methods of quantifying the suspended solid-phase material in the stream. The purpose of this report is to describe the SSC and TSS data collected at the L'Anguille River near Colt and the L'Anguille River at Palestine, Arkansas, and to examine the comparability of the SSC and TSS data. Samples were collected daily and during site inspections using automatic pumping sam-plers with fixed-point intakes. Periodic cross sections and depth-integrated composite samples were collected manually using the EWI method. Paired SSC and TSS data collected using automatic pumping samplers were compared using ordi-nary least squares regression analyses to determine the relation between the two datasets for each of the two sites.
SSC and TSS at the L'Anguille River varied spatially and temporally from August 2001 to October 2003. The site at the L'Anguille River at Palestine represents a larger portion of the L'Anguille River Basin than the site near Colt, and generally had higher median SSC and TSS and greater ranges in values. The difference between SSC and TSS for the L'Anguille near Colt appeared inversely related to streamflow and not related to time. The L'Anguille River at Palestine demonstrated a wide variability in the relation between SSC and TSS and differences between SSC and TSS did not appear to have a relation with flow or time. The relation between SSC and TSS for the L'Anguille River near Colt shows that TSS increases propor-tionally more than SSC. The relation between SSC and TSS for the L'Anguille River at Palestine shows TSS increases less pro-portionally than SSC compared to the L’Anguille River near Colt.
The source of the differences between the SSC and TSS data at the L'Anguille River near Colt and at Palestine likely is associated with the differences between the two analytical methods. TSS analysis involves the withdrawal of an aliquot of the original sample for further analysis, and SSC analysis mea-sures all sediment and the mass of the entire water-sediment mixture. Although some of the difference between SSC and TSS at the L’Anguille River at Palestine can be attributed to the differences in the analytical methods, the greatest source of variation probably is associated with the location of the auto-matic pumping sampler intake at the site. The intake was installed horizontally with a slight downward angle at a point in the stream cross section that was not ideal and was subject to sedimentation, which may have biased samples to higher values than an intake installed in a more ideal location.
References
American Public Health Association, American Water Works Association, and Water Pollution Control Federation, 1995, Standard methods for the examination of water and wastewa-ter (19th ed.): Washington D.C., American Public Health Association, variously paginated.
Arkansas Department of Environmental Quality, 2005, Arkan-sas’ 2004 list of impaired waterbodies, accessed 4/7/05 at URL http://www.adeq.state.ar.us/water/branch_planning/default.htm.
Brossett, T. H. and Evans, D.A., 2003, Water resources data, Arkansas, water year 2002: U.S. Geological Survey Water-Data Report AR-02-1, 461 p.
Christensen, R.C., Gilstrap, R.C., and Sullavan, J.N., 1967, Drainage areas of streams in Arkansas, St. Francis River Basin: U.S. Geological Survey Open-File Report, 32 p.
Edwards, T. K., and Glysson, G.D., 1999, Field methods for sediment analysis: U.S. Geological Survey Techniques of Water-Resources Investigations, book 3, chap. C2, 89 p.
Evans, D.A., Brossett, T.H., and Schrader, T.P., 2004, Water resources data, Arkansas, water year 2003: U.S. Geological Survey Water-Data Report AR-03-1, 450 p.
Gray, J.R., Glysson, G.D., Turcios, L.M., and Schwarz, G.E., 2000, Comparability of suspended-sediment concentration and total suspended solids data: U.S. Geological Water-Resources Investigations Report 00-4191, 14 p.
Green, W.R., Barks, C.S., and Hall, A.P., 2000, Suspended sed-iment in the St. Francis River at St. Francis, Arkansas, 1986-95: U.S. Geological Survey Open-File Report 99-227, 9 p.
Guy, H.P., 1969, Laboratory theory and methods for sediment analysis: U.S. Geological Survey Techniques of Water-Resources Investigations Report 01-4217, 12 p.
Helsel, D.R. and Hirsch, R.M., 1992, Statistical methods in water resources: Amsterdam, Netherlands, Elsevier, 522 p.
Kleiss, B.A., Coupe, R.H., Gonthier, G.J., and Justus, B.G., 2000, Water quality in the Mississippi Embayment, Missis-sippi, Louisiana, Arkansas, Missouri, Tennessee, and Ken-tucky, 1995-98: U.S. Geological Survey Circular 1208, 36 p.
Porter, J.E., Evans, D.A., and Remsing, L.M., 2002, Water resources data, Arkansas, water year 2001: U.S. Geological Survey Water-Data Report AR-01-1, 396 p.
U.S. Department of Agriculture Agricultural Research Service, 2004, Soil and water assessment tool, accessed 1/10/04 at URL http://www.brc.tamus.edu/swat/.
Wilde, F.D., Radke, D.B., Gibs, J., and Iwatsubo, R.T., 1999, Collection of water samples: U.S. Geological Survey Tech-niques of Water-Resources Investigations, book 9, chap A4, variously paginated.

Gallow
ay, J.M., Evans, D
.A., and G
reen, W.R
.—C
OM
PAR
AB
ILITY O
F SUSPEN
DED
-SEDIM
ENT C
ON
CEN
TRATIO
N A
ND
TOTA
L SUSPEN
DED
-SOLID
S D
ATA FO
R TW
O SITES O
N TH
E L’AN
GU
ILLE RIV
ER, A
RK
AN
SAS, 2001 TO
2003—U
.S. Geological Survey Scientific Investigations R
eport 2005-5193


![Figure 3-1 Total Suspended Solids Concentration [TSS ... · PDF fileSource: TAMS/Gradient Database TAMS/ Gradient Figure 3-1 Total Suspended Solids Concentration [TSS], Upper Hudson](https://static.fdocuments.net/doc/165x107/5a9da9ba7f8b9a21688d7a78/figure-3-1-total-suspended-solids-concentration-tss-tamsgradient-database.jpg)


