Company Presentation March March 20132013 Conference 2013.pdfSource: Company estimates public...
23
1 Company Presentation Company Presentation March March 2013 2013
Transcript of Company Presentation March March 20132013 Conference 2013.pdfSource: Company estimates public...
1
Company PresentationCompany Presentation
March March 20132013

2
Company highlights

• World leader in Compressed Natural Gas (CNG) and
Liquefied Petroleum Gas (LPG) with worldwide market
share > 30%
• Full year 2012 consolidated revenues €275.2 m
• Landi’s products are distributed worldwide in more
than 50 countries
• Landi has 16 subsidiaries in 13 countries
Complete System and Installations
Landi Renzo – The World Leader in CNG
and LPG Alternative Fuel Systems
3
• Landi has 16 subsidiaries in 13 countries
• Landi markets its systems through two main channels
– Aftermarket (installers and distributors)
– Car manufacturers
Landi’s business model focuses on R&D and distribution
with substantial outsourcing of production
CNG Reducers
LPG Reducers
Electronic Control Unit
LPG / CNG Injectors
Components

In-H
ou
se
R & D
Production of High
Value Added
Components
(injection Systems)
Testing / Quality
Packaging
Sales &
Marketing
Production Process - Landi Business Model
4
Th
ird
Pa
rtie
s
Production of
Basic components
Assembly Logistics

Geographical footprint
5
6
The sector

LPG Worldwide fleet breakdown
2,500,000
6,050
Vehicles Ref Stations
Poland
1,700,000
Italy
1,600,000
2,000
Vehicles Ref Stations
Russia418,000
6,579
Vehicles Ref Stations
Germany
7
1.8
1.7
3,467,502
9,300
Vehicles Ref Stations
Turkey
2,773
Vehicles Ref Stations
473,000
561
Vehicles Ref Stations
Thailand
2,300,000
1,611
Vehicles Ref Stations
Korea
18,767,502
55,489
Vehicles Ref Stations
World LPG fleet and
stations
Source: Company estimates public available data mid 2012

CNG Worldwide fleet breakdown
2,850,500
3,300
vehicles ref stations
Pakistan681,000
922
vehicles ref stations
Italy
1,694,278
Brazil
1,100,000
724
vehicles ref stations
India
8
1,900,000
1,902
vehicles ref stations
Argentina
2,859,386
1,820
vehicles ref stations
Iran
1,719
vehicles ref stations
1,000,000
2,120
vehicles ref stations
China
Source: Company estimates public available data mid 2012
15,094,754
20,009
vehicles ref stations
World CNG fleet and stations

Market positioning
> 30%> 27%
9 Source: Company estimates 2011
> 27%

10
Strategic Development
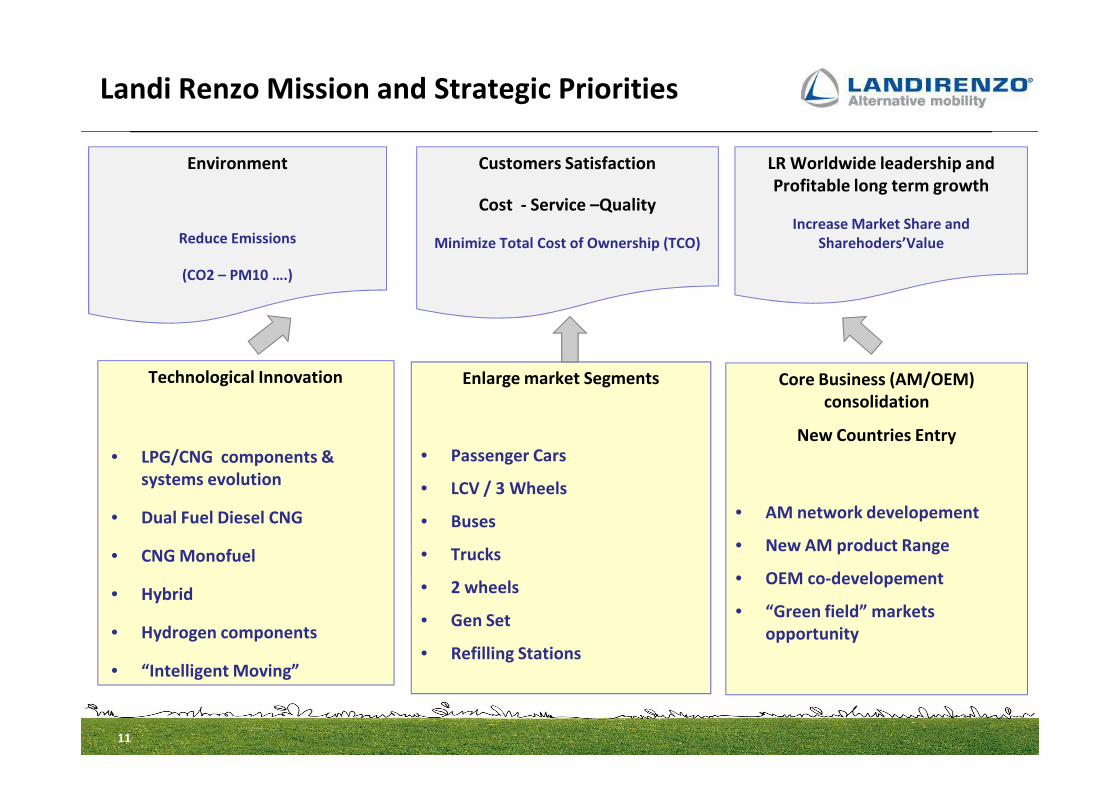
Landi Renzo Mission and Strategic Priorities
LR Worldwide leadership and
Profitable long term growth
Increase Market Share and
Sharehoders’Value
Environment
Reduce Emissions
(CO2 – PM10 ….)
Customers Satisfaction
Cost - Service –Quality
Minimize Total Cost of Ownership (TCO)
Technological Innovation Core Business (AM/OEM)
consolidation
Enlarge market Segments
11
• LPG/CNG components &
systems evolution
• Dual Fuel Diesel CNG
• CNG Monofuel
• Hybrid
• Hydrogen components
• “Intelligent Moving”
consolidation
New Countries Entry
• AM network developement
• New AM product Range
• OEM co-developement
• “Green field” markets
opportunity
• Passenger Cars
• LCV / 3 Wheels
• Buses
• Trucks
• 2 wheels
• Gen Set
• Refilling Stations

Gas application portfolio
Trasportation - Bi-fuel technologies Trasportation - MonoFuel /Dual fuel technologies
LPG/CNG technological
solution: available
for Gasoline native
Engines.
LPG/CNG
technologicalsol
ution available
for Diesel
engines- Bus
and Trucks
Revamping
12
Power generator
engine
conversion
From Diesel to
LPG/CNG
LPG/CNG
refilling stations
supplying
Activity trough
leader partners
Solution for infrastructures

Technologies and Market Segments
CNG Monofuel CNG
Hybrid
Dual Fuel
Diesel CNG (LPG)
Dual Fuel
Diesel CNG
Hydrogen
INTELLIGENT MOVING AND TRACEABILITY
TE
CH
NO
LOG
ICA
L IN
NO
VA
TIO
N
• Reduce Emissions - Preserve Environment
Achieved Results Real Time Traceability
• Customer Satisfaction
• Market Leadership
13
BiFuel LPG - CNG
Diesel CNG (LPG) Diesel CNG
2 Wheels Bus Trucks Gen Set Refilling StationsPC / LCV / 3 Whlrs
MARKET SEGMENTS
TE
CH
NO
LOG
ICA
L IN
NO
VA
TIO
N

14
Financial Results

Eur m
FY 2012 Profit&Loss Highlights
Revenues
EBITDA
EBIT
Profit&Loss
275.2 100.0% 253.5 100.0% 21.7 8.5%
28.3 10.3% 19.5 7.7% 8.8 45.3%
9.8 3.6% 3.3- -1.3% 13.1 n.m.
FY12 FY11 Delta
15
• Revenues increase (+5.6% like for like) though 2012 was one of the worst year for
automotive in markets which are important for CNG and LPG too. Furthermore the increase
came without any public rebate in the main areas: only market driven growth
• Margins recovered above all thanks to cost reductions activities still in progress
Net Profit 2.9 1.0% 9.1- -3.6% 12.0 n.m.

Italy 78.0 28.3% 44.8 17.7% 33.2 74.1%
Europe (ex Italy) 85.0 30.9% 66.1 26.1% 18.9 28.5%
SWAsia 20.1 7.3% 66.9 26.4% 46.8- -70.0%
America 39.1 14.2% 33.6 13.2% 5.5 16.5%
RoW 53.0 19.3% 42.1 16.6% 10.9 25.9%
Total 275.2 100.0% 253.5 100.0% 21.7 8.5%
FY12 FY11 Delta
Revenues Breakdown by Region
Revenues Breakdown
Re
gio
n
Eur m • Italy and Europe grew without any
public incentive. Growth was driven
only by market demand.
Furthermore Landi increased its
market shares in important countries
• American market increased above
16
lpg 171.5 62.3% 120.3 47.5% 51.2 42.5%
cng 82.2 29.9% 118.5 46.7% 36.3- -30.7%
Other 21.6 7.8% 14.7 5.8% 6.8 46.4%
Total 275.2 100.0% 253.5 100.0% 21.7 8.5%
DeltaFY12 FY11Eur m
• CNG decreased due to the fact that South West Asia was negatively impacted
by geo-political factors in Iran and Pakistan (important for cng)
• Other businesses played an important role. SAFE contribute for 7.5€ mln
Revenues Breakdown by Segment
Se
gm
en
t
• American market increased above
all thanks to Latin America. Even
business in US recorded a relative
important growth
• Also RoW confirms its growth trend
with a 25.9% increase driven above
all by Far East markets

77.8 69.2
67.465.9
14.02.6
Working capital and debt level
Net Working Capital Net Financial Position
29.8%
Eur m Eur m
82.0
40.7%
103.2
17
-56.0 -55.9
dec 11 dec 12
Receivables Inventories Payables Other current assets/liabilities
• Net Financial Position moves mainly accordingly
to the changes of NWC and profitability. A positive
net cash-in of about 28.2€ mln
• NWC decreases during the year thanks to
•reduction in receivables
•reductions in other current
assets/liabilities
-90.1
-61.9
dec 11 dec 12

18
Annexes
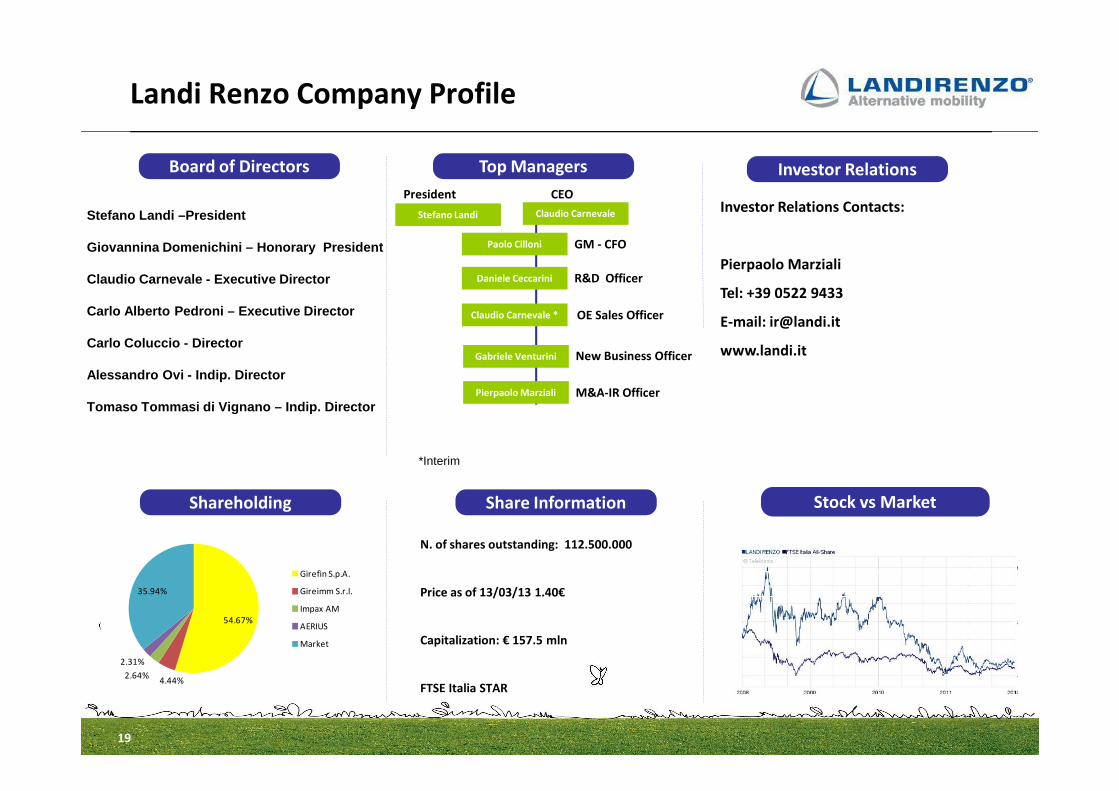
Landi Renzo Company Profile
Investor RelationsTop Managers
Paolo Cilloni
Pierpaolo Marziali
GM - CFO
M&A-IR Officer
Board of Directors
Stefano Landi –President
Giovannina Domenichini – Honorary President
Claudio Carnevale - Executive Director
Carlo Alberto Pedroni – Executive Director
Carlo Coluccio - Director
Alessandro Ovi - Indip. Director
Stefano Landi
President
Claudio Carnevale
CEO
Daniele Ceccarini R&D Officer
Investor Relations Contacts:
Pierpaolo Marziali
Tel: +39 0522 9433
E-mail: [email protected]
www.landi.it
Claudio Carnevale * OE Sales Officer
Gabriele Venturini New Business Officer
19
Pierpaolo Marziali M&A-IR Officer
Shareholding Share Information
Tomaso Tommasi di Vignano – Indip. Director
Stock vs Market
N. of shares outstanding: 112.500.000
Price as of 13/03/13 1.40€
Capitalization: € 157.5 mln
FTSE Italia STAR
*Interim
54.67%
4.44%2.64%
2.31%
35.94%
Girefin S.p.A.
Gireimm S.r.l.
Impax AM
AERIUS
Market
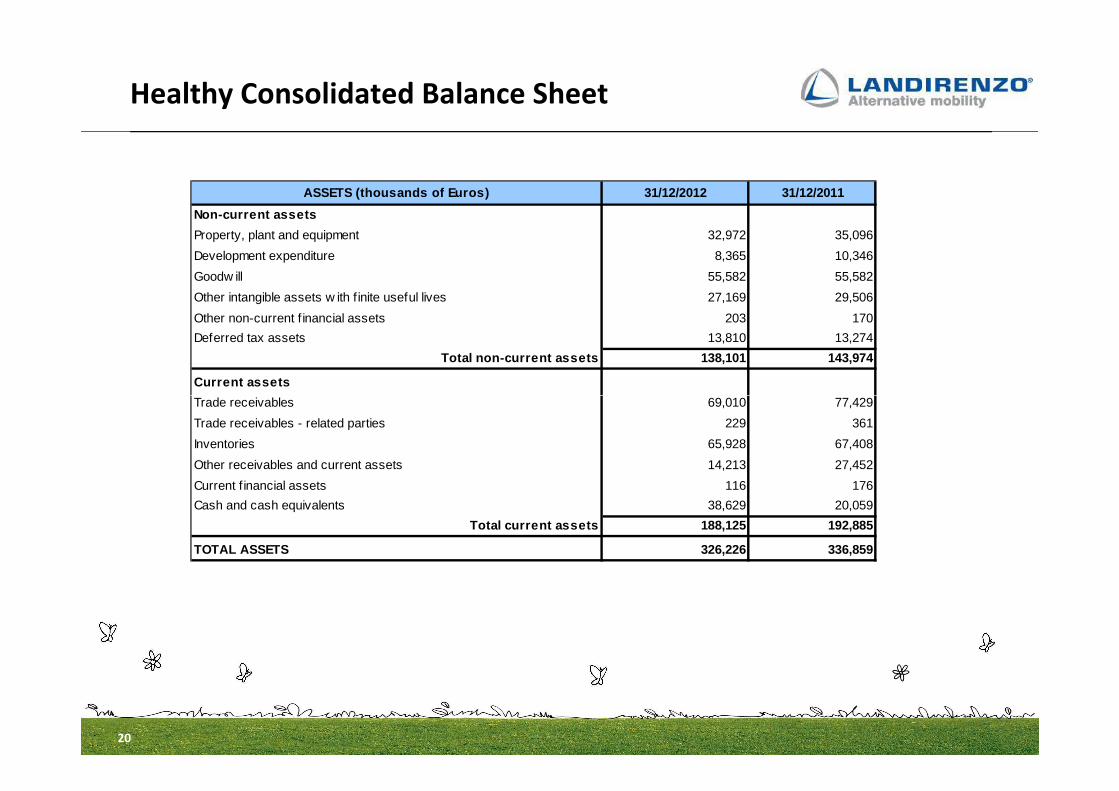
Healthy Consolidated Balance Sheet
ASSETS (thousands of Euros) 31/12/2012 31/12/2011
Non-current assets
Property, plant and equipment 32,972 35,096
Development expenditure 8,365 10,346
Goodw ill 55,582 55,582
Other intangible assets w ith f inite useful lives 27,169 29,506
Other non-current f inancial assets 203 170
Deferred tax assets 13,810 13,274
Total non-current assets 138,101 143,974
Current assets
Trade receivables 69,010 77,429
20
Trade receivables 69,010 77,429
Trade receivables - related parties 229 361
Inventories 65,928 67,408
Other receivables and current assets 14,213 27,452
Current f inancial assets 116 176
Cash and cash equivalents 38,629 20,059
Total current assets 188,125 192,885
TOTAL ASSETS 326,226 336,859

EQUITY AND LIABILITIES (thousands of Euros) 31/12/20 12 31/12/2011
Group shareholders’ equity
Share capital 11,250 11,250
Other reserves 124,322 134,154
Prof it (loss) for the period 2,863 -9,138
Total equity attributable to the shareholders of th e parent 138,435 136,266
Minority interests 623 738
TOTAL EQUITY 139,058 137,004
Non-current liabilities
Non-current bank loans 38,465 40,119
Other non-current f inancial liabilities 25 49
Provisions for risks and charges 5,077 4,860
Healthy Consolidated Balance Sheet
21
Defined benef it plans 3,466 2,835
Deferred tax liabilities 10,583 12,351
Total non-current liabilities 57,616 60,214
Current liabilities
Bank overdrafts and short-term loans 62,017 69,878
Other current f inancial liabilities 24 125
Trade payables 55,722 55,903
Trade payables - related parties 58 61
Tax liabilities 2,445 6,458
Other current liabilities 9,286 7,216
Total current liabilities 129,552 139,641
TOTAL LIABILITIES AND EQUITY 326,226 336,859

Consolidated Profit&Loss
31/12/2012 31/12/2011
274,695 252,312
507 1,217
1,525 1,646
-129,839 -124,018
-71,406 -66,693
-1,552 -1,528
-41,928 -39,896
-3,701 -3,563
28,301 19,477
-18,492 -22,737
Costs for services and use of third party assets
Costs for services and use of third party assets – related parties
Personnel expenses
Accruals, impairment losses and other operating expenses
Gross Operating Profit
Amortization, depreciation and impairment losses
CONSOLIDATED STATEMENT OF COMPREHENSIVE INCOME (tho usands of Euros)
Revenues (goods and services)
Revenues (goods and services)- related parties
Other revenue and income
Cost of raw materials, consumables and goods and change in inventories
22
-18,492 -22,737
0 -4,316
9,809 -3,260
693 482
-4,105 -3,610
-825 -1,825
5,572 -8,213
-2,974 -926
2,598 -9,139
-265 -1
2,863 -9,138
of which: non recurring losses
Net profit (loss) for the Group and minority intere sts, including:
Minority interests
Net Profit (Loss) of the Group
Amortization, depreciation and impairment losses
Net Operating Profit
Financial income
Financial expenses
Exchange rate gains and losses
Profit (Loss) before tax
Taxes

Disclaimer
This presentation has been prepared by Landi Renzo S.p.A. for information purposes only and for use in presentations of the Group’s results and strategies.
For further details on the Landi Renzo Group, reference should be made to publicly available information, including the Quarterly Reports and the Annual
Reports.
Statements contained in this presentation, particularly the ones regarding any Landi Renzo possible or assumed future performance, are or may be forward
looking statements and in this respect they involve some risks and uncertainties.
Any reference to past performance of the Landi Renzo shall not be taken as an indication of future performance.
This document does not constitute an offer or invitation to purchase or subscribe for any shares and no part of it shall form the basis of or be relied upon in
connection with any contract or commitment whatsoever.
By attending the presentation you agree to be bound by the foregoing terms.
23