Company Presentation · Company Presentation February 2019. Agenda 01 Sartorius Stedim Biotech in...
25
1 Company Presentation February 2019
Transcript of Company Presentation · Company Presentation February 2019. Agenda 01 Sartorius Stedim Biotech in...

1
Company PresentationFebruary 2019

Agenda
Sartorius Stedim Biotech in Brief01
03 Sartorius Stedim Biotech 2020 and 2025
Total Solutions Provider for the Biopharma Industry02

Sartorius Stedim Biotech in 2018
Figures as of Dec. 31, 2018; 1 Underlying EBITDA ( )excluding extraordinary items 2 As of end of December, 2018; including SSB free float 3
Bioprocess Technologies Provider
Internationally leading
~35%Americas
~42%EMEA
~23%Asia | Pacific
Publicly listed since 1990
~€342 mnEarnings1
>€1.21 bnSales revenue
Earnings1 margin
~€177 mnInvestments
28.2%
Sales revenue by region
~€8.1 bnMarket capitalization2

Global player with over 30 sales and production sites
4
AmericasUSA: Massachusetts | New York, North Carolina, Pennsylvania, Colorado | Puerto Rico | Mexico | Brazil | Argentina
India | Singapore | Vietnam | China | Malaysia | South Korea | Japan | Australia
Belgium | Ireland | UK | France | Spain | Sweden | Germany | Poland | Austria | Hungary | Russia | Switzerland | Italy | Tunisia | Israel | South Africa
EMEA
Asia|Pacific
Production and Production/SalesSales

Around 5,600 employees worldwide
Figures as of Dec. 31, 2018 5
~ 880Americas
~4,000EMEA
~750Asia|Pacific
Employees by Regions Employees growth 2012-2018
~+70%
2013
2018

Our corporate values
6
Agenda
Sartorius Stedim Biotech in Brief01
03 Sartorius Stedim Biotech 2020 and 2025
Total Solutions Provider for the Biopharma Industry02

8
Solution provider for biomanufacturing
Highly regulated environment |validated processes
Broadest portfolio in the industry
Unique position in an attractive market

What are biopharmaceuticals?
R&D and production labor-intensive
High therapy costs: biologics ~ $50 vs. chemical medications ~ $2 per day
Living, geneticallymodified Cells Production Injection | Infusion
Advantages Challenges
First-time or improved treatment of serious illnesses, such as cancer, multiple sclerosis, rheumatism Targets only diseased cells; fewer side effects New vaccines
9
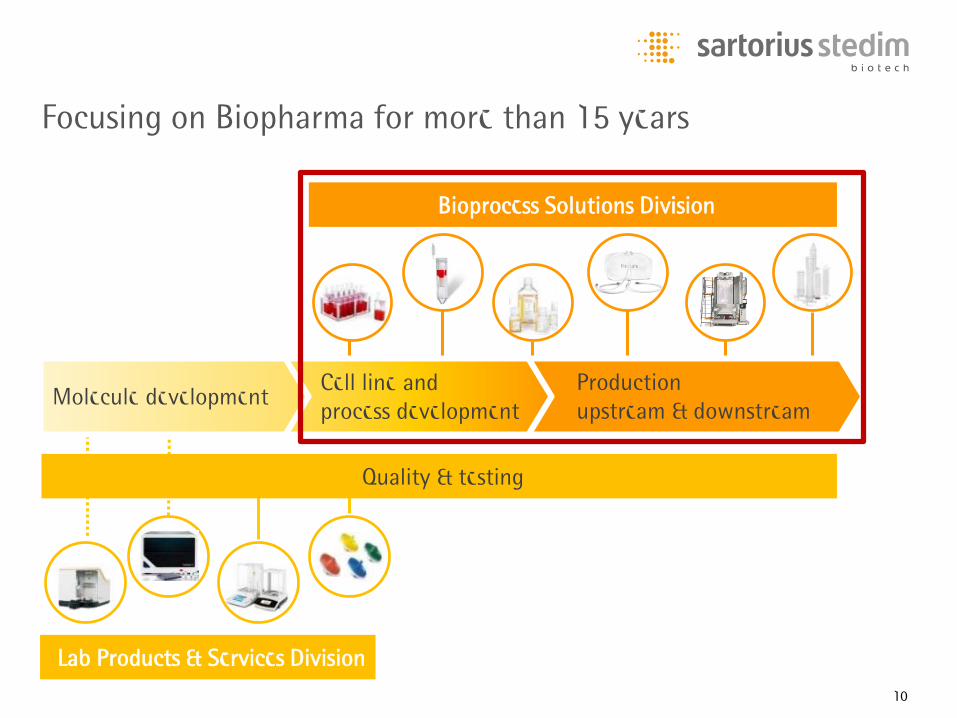
Focusing on Biopharma for more than 15 years
Molecule developmentCell line and process development
Productionupstream & downstream
Lab Products & Services Division
10
Bioprocess Solutions Division
Quality & testing

Driven by strong fundamentals, Biopharma is a growth market
11
+6.4%CAGR
of worldwideprescription drugsales 2018-2024
9 bnpeople by 2050
of which >2 bn60yrs or older
Rise of biosimilars
>30%CAGR of
biosimilar sales2018-2022
Favorable R&D pipeline; strongadvances in gene and cell therapy
~8%CAGR of biopharma market
2018-2025
>40%Share of biologicsin pharma R&D
pipeline
Favorable demographics Increasing healthcare spending
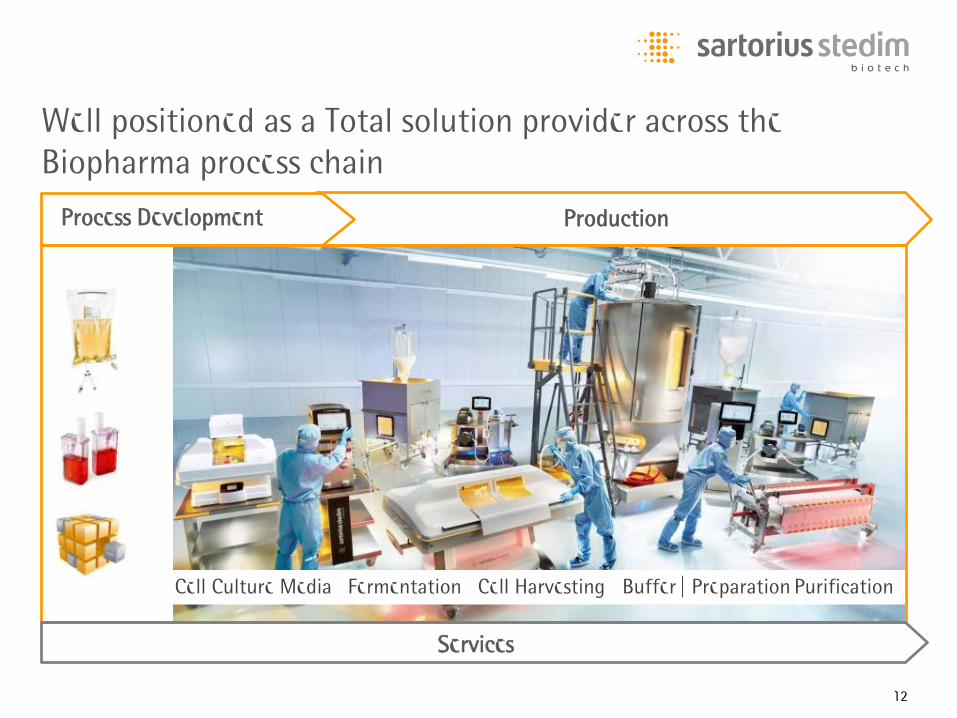
Well positioned as a Total solution provider across the Biopharma process chain
Fermentation Cell Harvesting Buffer | PreparationCell Culture Media
12
Process Development Production
Services
Purification

High initial cost
Considerable cleaning effort
Risk of cross-contamination
13
Pioneer in single-use manufacturing technologies
PresentPast
+ CAPEX reduction over entire lifecycle
+ Lower water and energy consumption
+ Higher flexibility

Around 75% of recurrent business with single-use products
~ €1,21 bnSingle-use~ 75 %
Equipment~25 %
14Figures as of Dec. 31, 2018

>85% of sales revenue generated from top 1-3 positions
Filtration TOP 3 Fluid Management #1 Fermentation #1
Leading market positions worldwide
15

Agenda
Sartorius Stedim Biotech in Brief01
03 Sartorius Stedim Biotech 2020 and 2025
Total Solutions Provider for the Biopharma Industry02
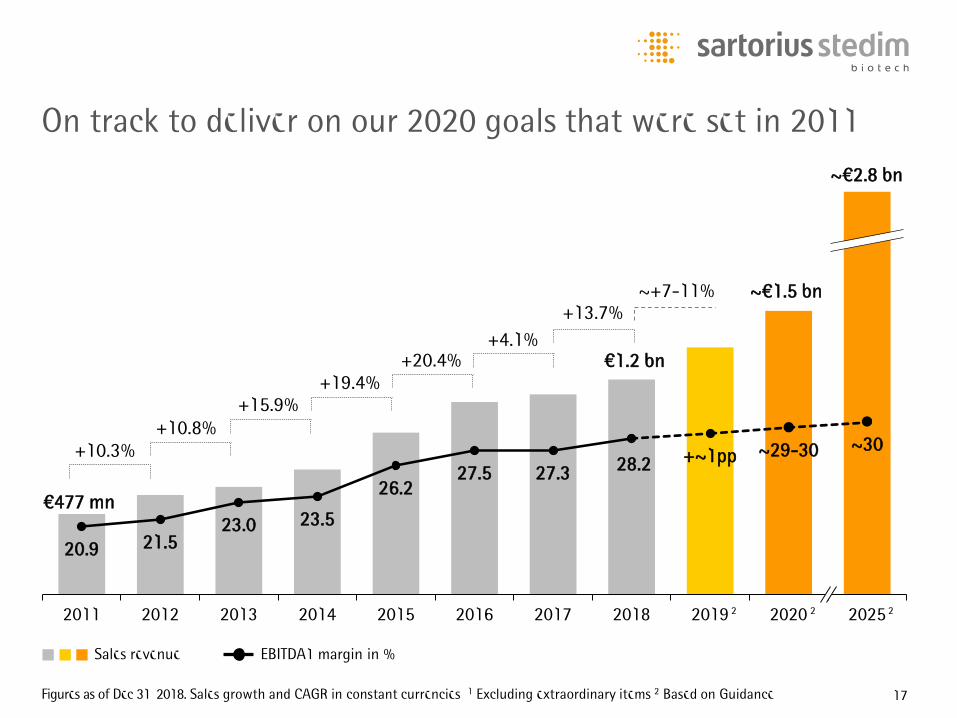
On track to deliver on our 2020 goals that were set in 2011
17Figures as of Dec 31, 2018. Sales growth and CAGR in constant currencies 2 Based on Guidance1 Excluding extraordinary items
Sales revenue EBITDA1 margin in %
20.9 21.523.0 23.5
26.227.5 27.3 28.2 +~1pp ~29-30 ~30
151617181920212223242526272829303132333435363738394041424344454647484950
0
200
400
600
800
1000
1200
1400
1600
1800
2000
2200
2011 2012 2013 2014 2015 2016 2017 2018 2019 2020 2025
€477 mn
€1.2 bn
~€1.5 bn
~€2.8 bn
+13.7%+4.1%
+20.4%+19.4%
+15.9%+10.8%
+10.3%
~+7-11%
2 2 2
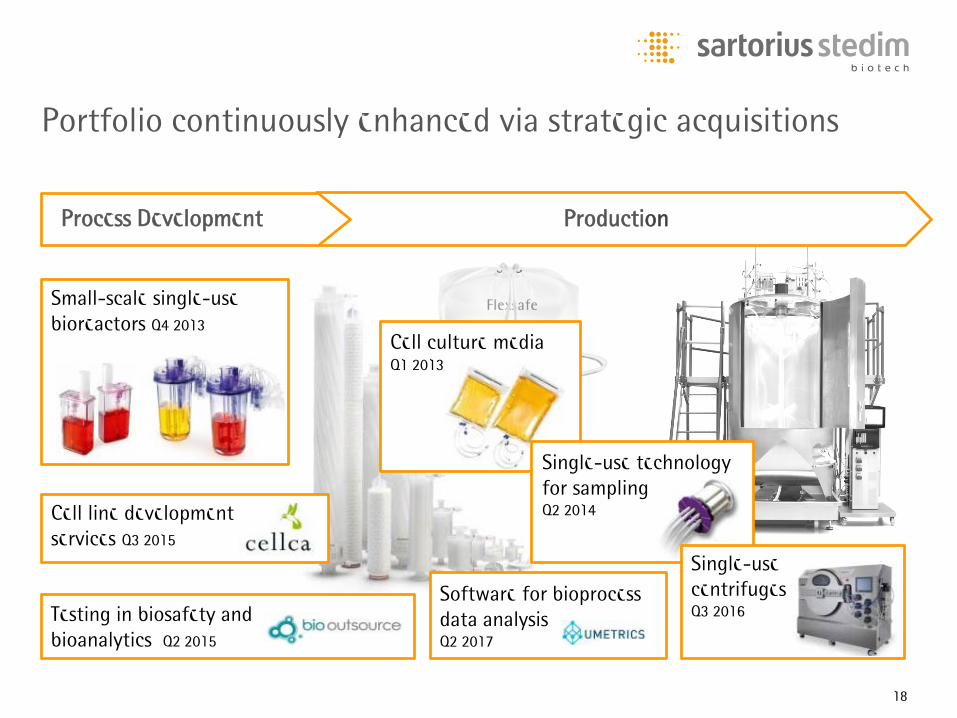
Cell line developmentservices Q3 2015
Testing in biosafety andbioanalytics Q2 2015
Small-scale single-use bioreactors Q4 2013
Cell culture mediaQ1 2013
Single-use technologyfor samplingQ2 2014
Portfolio continuously enhanced via strategic acquisitions
18
Process Development Production
Software for bioprocessdata analysisQ2 2017
Single-usecentrifugesQ3 2016

Infrastructure prepared for further growth
19
Capex ratio
New ERP and extension of globalIT infrastructure
Goettingen, Germany: Extension
Aubagne, France: Capacity extension ofbag production
Yauco, Puerto Rico: Doubling of fluid management and filter capacities ~15%

Our Growth Targets Up to 2025
2025 ambition is based on 2017 currency exchange rates; non-organic revenue growth is accounted for companies acquired from 2018onwards; EBITDA excluding extraordinary items
Regional
Participate in strong Chinese market growth Continue to outgrow the important U.S. market
Strategic Initiatives 2025 Targets
Portfolio
Adding high-impact innovation, e.g. digital tools Enhance process development capabilities Expand into adjacent applications
Operations
Accelerate workflows across the organization through digitalization Extend manufacturing base in Asia
20
~€2.8 bnSales revenue
~30% EBITDA margin

Thank you very muchfor your attention

Disclaimer
This presentation contains statements concerning Sartorius Stedim Biotech Groups’ future performance. These statements are based on assumptions and estimates. Although we are convinced that these forward-looking statements are realistic, we cannot guarantee that they will actually materialize. This is because our assumptions harbor risks and uncertainties that could lead to actual results diverging substantially from the expected ones. It is not planned to update our forward-looking statements.
Throughout this presentation, differences may be apparent as a result of rounding during addition.

Scalable products from process development to productionFermentation | Cell culture
BIOSTAT® RM
0.1 up to 300 liters
UniVessel® SU
0.6 up to 2 liters
BIOSTAT STR®
12.5 up to 2,000 liters
ambr®
15 up to 250 ml
23
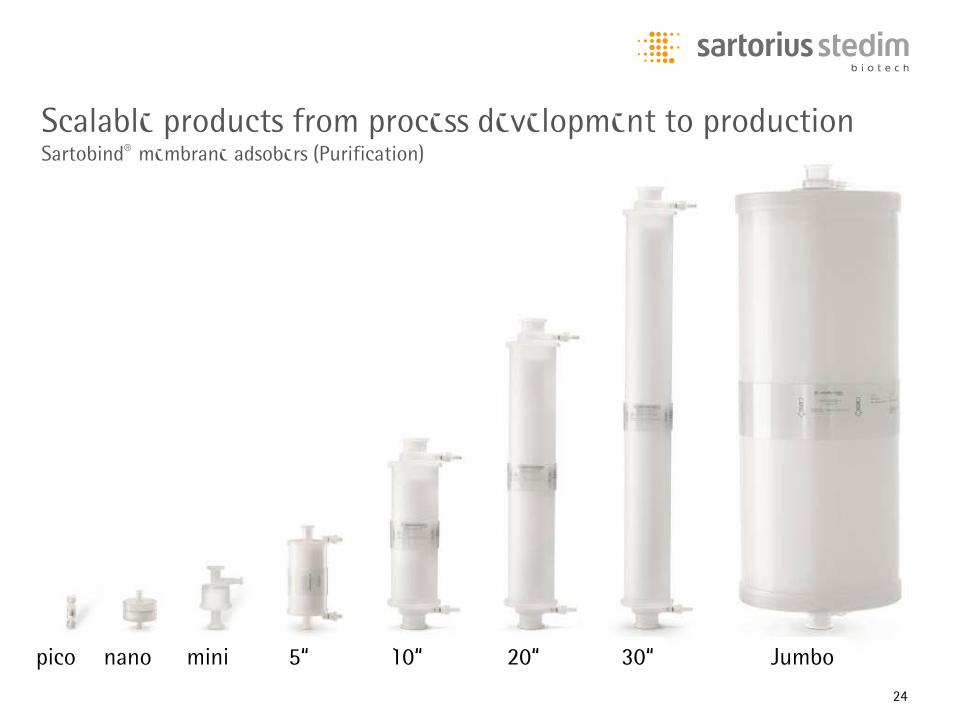
Scalable products from process development to productionSartobind® membrane adsobers (Purification)
nano mini 10“ 20“ 30“ Jumbo5“pico
24

Scalable products from process development to productionFluid Management
Flexsafe® &Flexboy® Bags
50 millilitersup to 50 liters
Flexsafe® & Flexel®
100 up to 3,000 liters
Celsius®-Pak
30 millilitersup to 16.6 liters
Flexsafe ® & Flexel® for Mixer
50 up to 3,000 liters
25