
Company Presentation 2014 - Quiñenco Presentation / October 2014 1. Quiñenco Overview Recent...
49
Company Presentation / October 2014 1
Transcript of Company Presentation 2014 - Quiñenco Presentation / October 2014 1. Quiñenco Overview Recent...

Company Presentation / October 2014
1

Quiñenco Overview Recent Events Financial Overview
Main Operating Companies
Conclusions
2
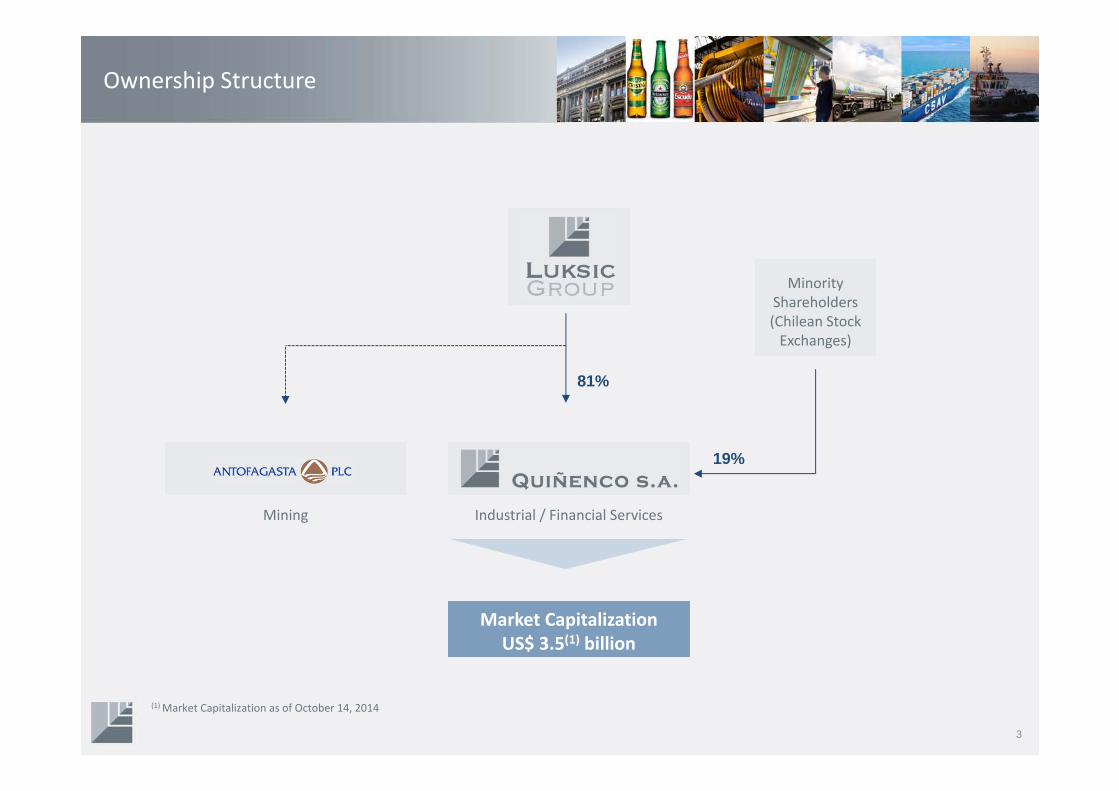
Ownership Structure
(1) Market Capitalization as of October 14, 2014
Mining Industrial / Financial Services
81%
19%
Minority Shareholders (Chilean Stock Exchanges)
Market Capitalization US$ 3.5(1) billion
3
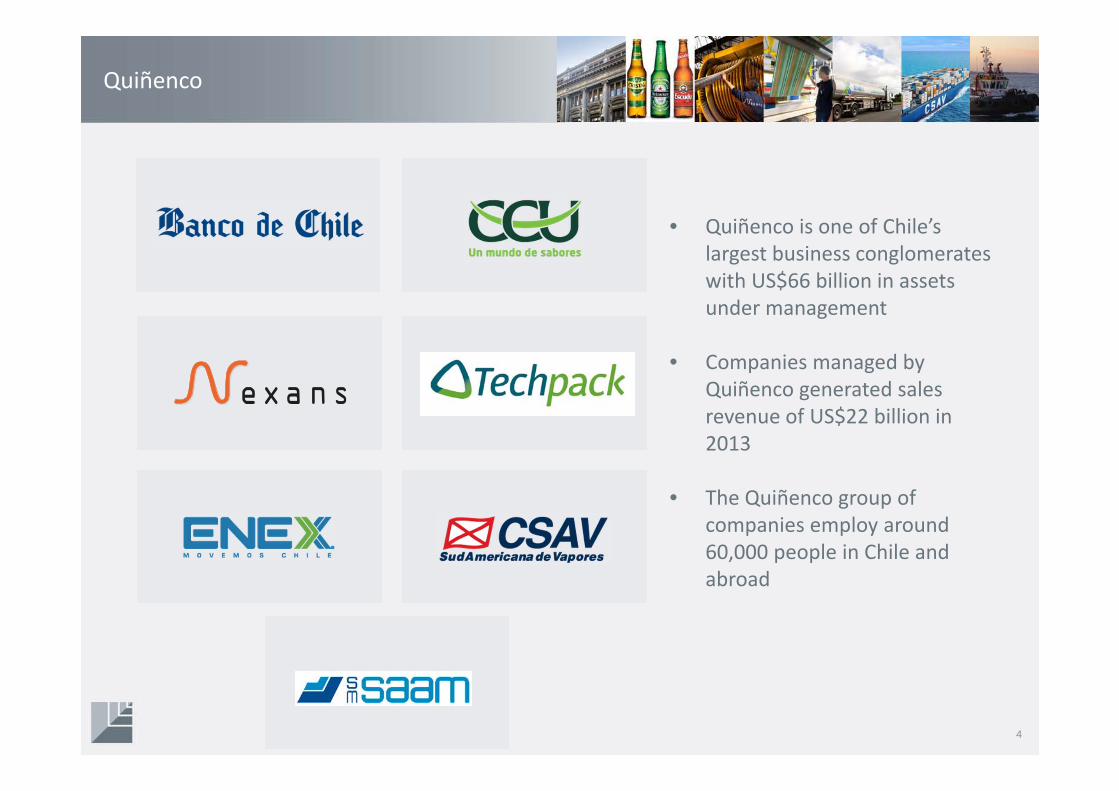
Quiñenco
• Quiñenco is one of Chile’s largest business conglomerates with US$66 billion in assets under management
• Companies managed by Quiñenco generated sales revenue of US$22 billion in 2013
• The Quiñenco group of companies employ around 60,000 people in Chile and abroad
4
Quiñenco: Main Operating Companies
5
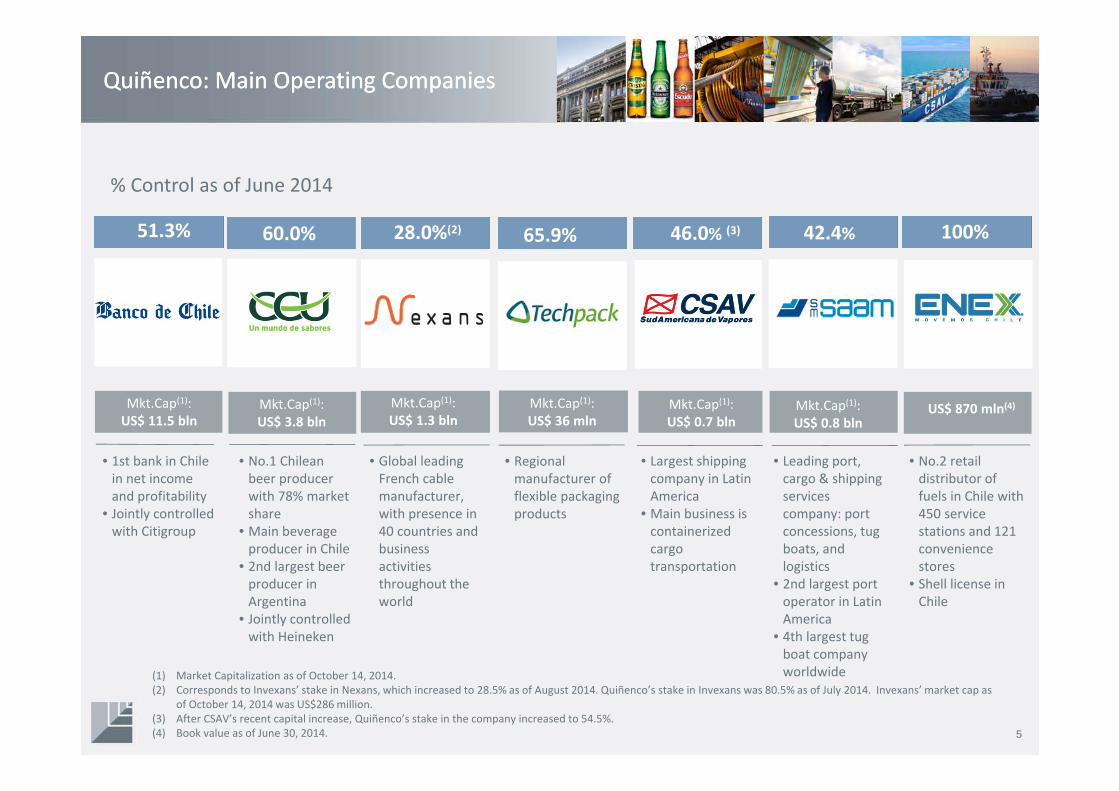
Quiñenco: Main Operating Companies
(1) Market Capitalization as of October 14, 2014.(2) Corresponds to Invexans’ stake in Nexans, which increased to 28.5% as of August 2014. Quiñenco’s stake in Invexans was 80.5% as of July 2014. Invexans’ market cap as
of October 14, 2014 was US$286 million.(3) After CSAV’s recent capital increase, Quiñenco’s stake in the company increased to 54.5%. (4) Book value as of June 30, 2014.
51.3%
5
% Control as of June 2014
• 1st bank in Chile in net income and profitability
• Jointly controlled with Citigroup
• No.1 Chilean beer producer with 78% market share
• Main beverage producer in Chile
• 2nd largest beer producer in Argentina
• Jointly controlled with Heineken
• Global leading French cable manufacturer, with presence in 40 countries and business activities throughout the world
• Largest shipping company in Latin America
• Main business is containerized cargo transportation
• Leading port, cargo & shipping services company: port concessions, tug boats, and logistics
• 2nd largest port operator in Latin America
• 4th largest tug boat company worldwide
• No.2 retail distributor of fuels in Chile with 450 service stations and 121 convenience stores
• Shell license in Chile
Mkt.Cap(1):US$ 11.5 bln
Mkt.Cap(1):US$ 3.8 bln
Mkt.Cap(1):US$ 1.3 bln
Mkt.Cap(1):US$ 0.7 bln
Mkt.Cap(1):US$ 0.8 bln
US$ 870 mln(4)
60.0% 28.0%(2) 65.9% 46.0% (3) 42.4% 100%
Mkt.Cap(1):US$ 36 mln
• Regional manufacturer of flexible packaging products

First Class Board and Management
• Francisco Pérez MackennaChief Executive Officer
• Martín Rodríguez GuiraldesManager of Strategy and Performance Appraisal
• Rodrigo Hinzpeter KirbergChief Counsel
• Carolina García de la Huerta AguirreManager of Corporate Affairs
• Felipe Joannon VergaraManager of Business Development
• Luis Fernando Antúnez BoriesChief Financial Officer
• Pilar Rodríguez AldayInvestor Relations Manager
• Alvaro Sapag RajevicManager of Sustainability
• Pedro Marín Loyola Manager of Performance Appraisal and Internal Auditor
• Andrea Tokman RamosChief Economist
• Davor Domitrovic GrubisicHead Legal Advisor
• Oscar Henríquez VignesGeneral Accountant
Andrónico Luksic CraigChairman
Jean‐Paul Luksic FontbonaVice Chairman
Gonzalo Menéndez DuqueDirector
Hernán Büchi BucDirector
Matko Koljatic MaroevicDirector
Fernando Cañas BerkowitzDirector
Board of Directors(1)
Senior Management
6
Nicolás Luksic PugaDirector
(1) In May 2014, Mr. Andrónico Luksic Lederer joined the Board.
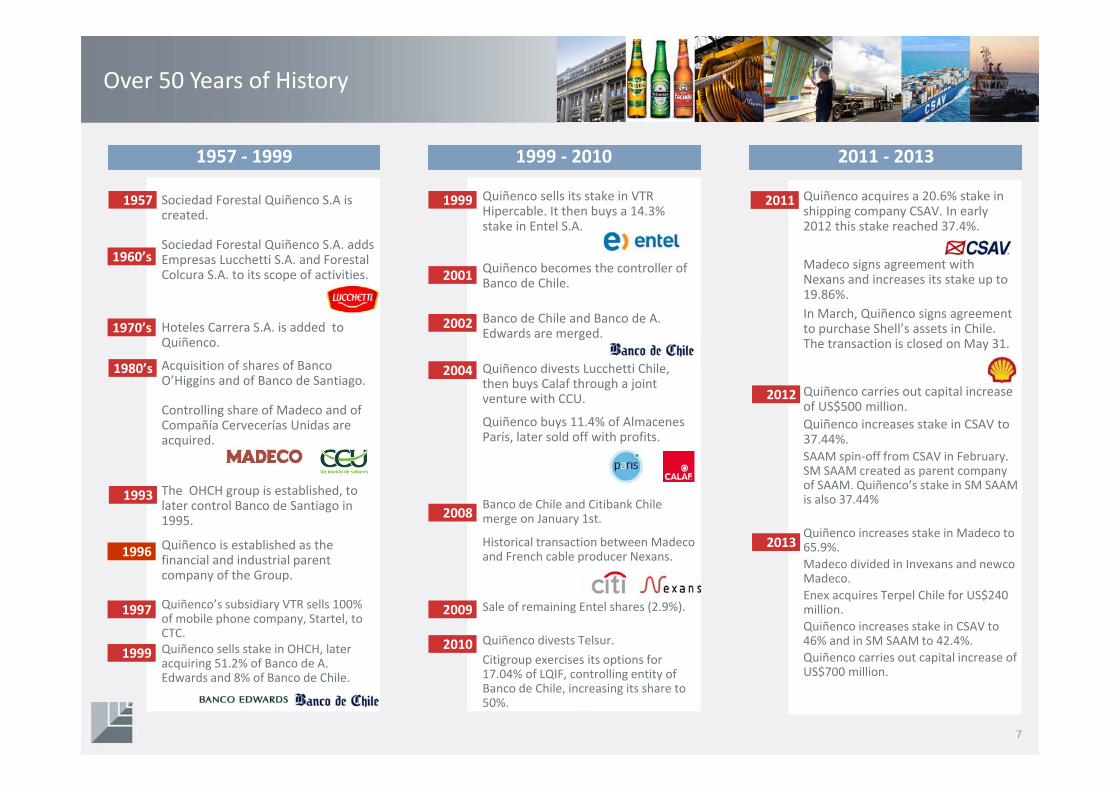
Over 50 Years of History
Sociedad Forestal Quiñenco S.A is created.
Sociedad Forestal Quiñenco S.A. adds Empresas Lucchetti S.A. and ForestalColcura S.A. to its scope of activities.
Hoteles Carrera S.A. is added to Quiñenco.
Acquisition of shares of BancoO’Higgins and of Banco de Santiago.
Controlling share of Madeco and of Compañía Cervecerías Unidas are acquired.
The OHCH group is established, to later control Banco de Santiago in 1995.
Quiñenco is established as the financial and industrial parent company of the Group.
Quiñenco’s subsidiary VTR sells 100% of mobile phone company, Startel, to CTC.Quiñenco sells stake in OHCH, later acquiring 51.2% of Banco de A. Edwards and 8% of Banco de Chile.
Quiñenco sells its stake in VTR Hipercable. It then buys a 14.3% stake in Entel S.A.
Quiñenco becomes the controller of Banco de Chile.
Banco de Chile and Banco de A. Edwards are merged.
Quiñenco divests Lucchetti Chile, then buys Calaf through a joint venture with CCU.
Quiñenco buys 11.4% of AlmacenesParís, later sold off with profits.
Banco de Chile and Citibank Chile merge on January 1st.
Historical transaction between Madecoand French cable producer Nexans.
Sale of remaining Entel shares (2.9%).
Quiñenco divests Telsur.Citigroup exercises its options for 17.04% of LQIF, controlling entity of Banco de Chile, increasing its share to 50%.
1957
1960’s
1970’s
1980’s
1993
1996
1997
1999
2001
2002
2004
2008
2009
2010
2011
1957 ‐ 1999 1999 ‐ 2010 2011 ‐ 2013
7
Quiñenco acquires a 20.6% stake in shipping company CSAV. In early 2012 this stake reached 37.4%.
Madeco signs agreement with Nexans and increases its stake up to 19.86%. In March, Quiñenco signs agreement to purchase Shell’s assets in Chile. The transaction is closed on May 31.
Quiñenco carries out capital increase of US$500 million.Quiñenco increases stake in CSAV to 37.44%. SAAM spin‐off from CSAV in February. SM SAAM created as parent company of SAAM. Quiñenco’s stake in SM SAAM is also 37.44%
Quiñenco increases stake in Madeco to 65.9%.Madeco divided in Invexans and newcoMadeco.Enex acquires Terpel Chile for US$240 million.Quiñenco increases stake in CSAV to 46% and in SM SAAM to 42.4%.Quiñenco carries out capital increase of US$700 million.
2012
2013
1999
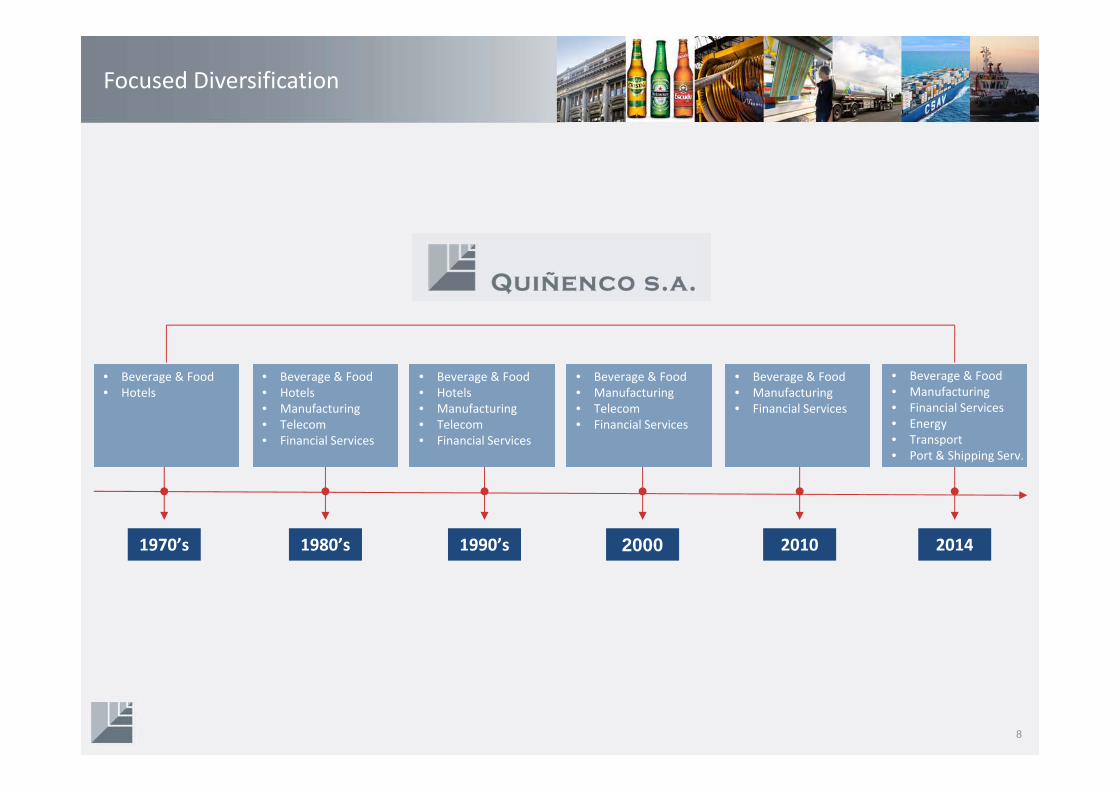
Focused Diversification
1970’s 1980’s 1990’s 2000 2010 2014
• Beverage & Food• Hotels
• Beverage & Food• Hotels • Manufacturing• Telecom• Financial Services
• Beverage & Food• Hotels • Manufacturing• Telecom• Financial Services
• Beverage & Food• Manufacturing• Telecom• Financial Services
• Beverage & Food• Manufacturing• Financial Services
• Beverage & Food• Manufacturing• Financial Services• Energy• Transport• Port & Shipping Serv.
8

Quiñenco – Investment Criteria
Brand & consumer franchise development potential
Sufficient critical mass
Prior operating or industry experience
Access to strategic partners / commercial alliances / synergies
Growth platform or add‐on acquisition potential
Controlling stakes
9

Quiñenco: World Class Strategic & Commercial Alliances
Quiñenco partners with world class players to develop its markets and products totake advantage of combined know‐how, experience and financial capacity
Financial
Manufacturing
Beverage & Food
10
Energy
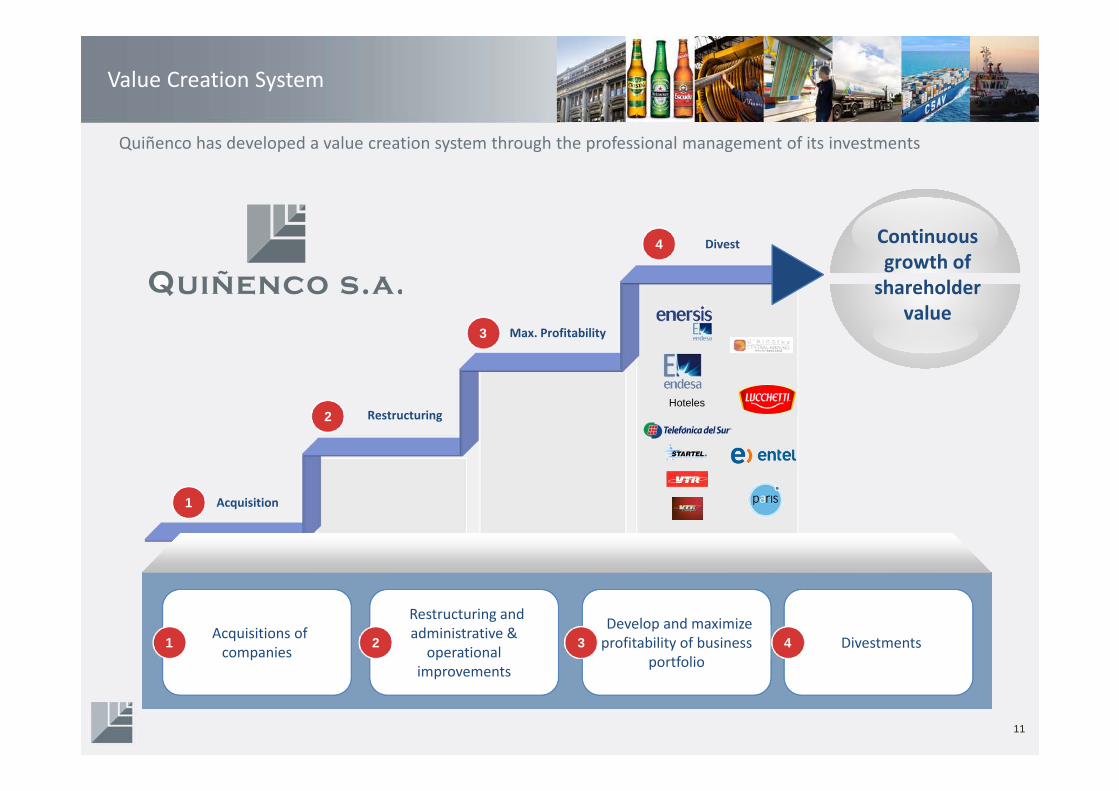
Value Creation System
Quiñenco has developed a value creation system through the professional management of its investments
Divest
Max. Profitability
Restructuring
Acquisition1
2
3
4 Continuous growth of shareholder
value
Hoteles
•Acquisitions of companies
•Restructuring and administrative &
operational improvements
•Develop and maximize profitability of business
portfolio•Divestments1 2 3 4
11

Corporate Level Transactions
Quiñenco has carried out various transactions throughout its history, generating US$1.8 billion in profits over the last 16 years from divestments of US$4.4 billion
12
Note: Figures translated from constant Chilean pesos at the exchange rate as of June 30, 2014, of Ch$552.72= 1US$(1) Includes the gain generated by Citigroup’s first option for 8.52% share of LQIF, before taxes. The second option for an additional 8.52% generated an increment in
equity of US$285.8 million, after taxes.
Hotels
992
62
‐11 ‐12
40
771
1,842
Telecom Retail Real estate/Hotels Beverage & Food Utility Financial Services Total
(1)
671
1.4501.989 2.028
2.7213.071
2.142
3.275
5.789
5.137
6.8586.541
6.015
2002 2003 2004 2005 2006 2007 2008 2009 2010 2011 2012 2013 Jun‐14
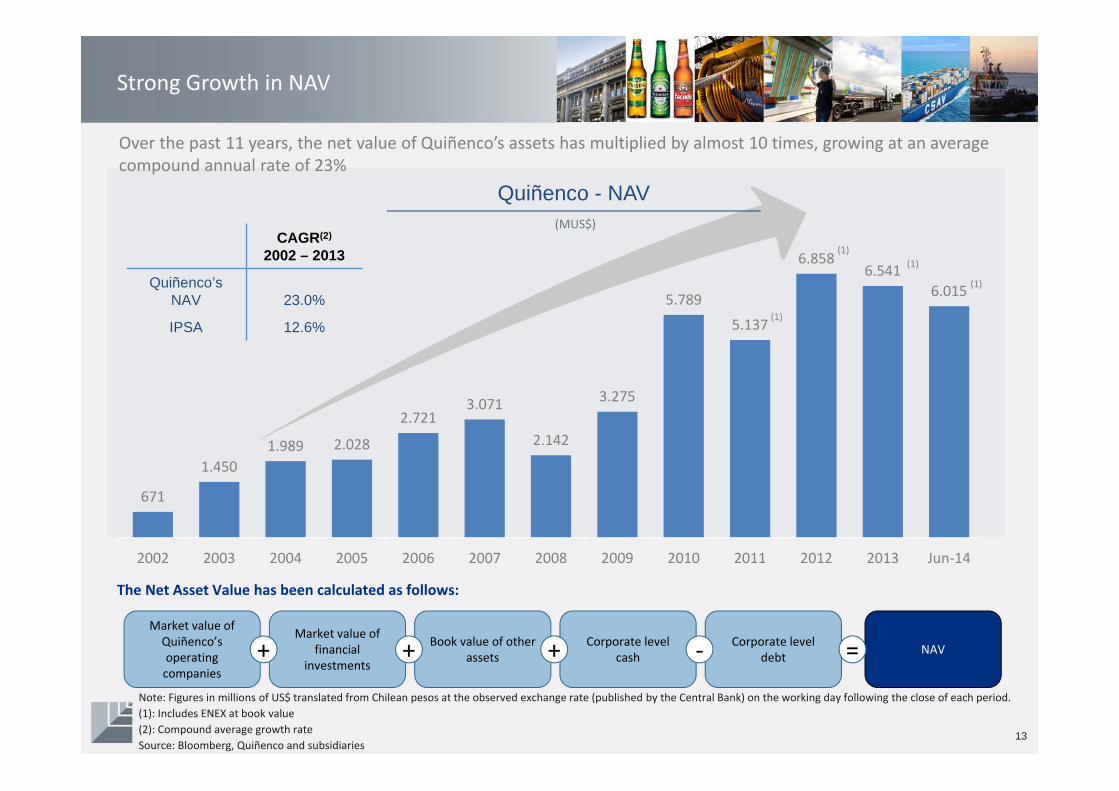
Strong Growth in NAV
Over the past 11 years, the net value of Quiñenco’s assets has multiplied by almost 10 times, growing at an average compound annual rate of 23%
Note: Figures in millions of US$ translated from Chilean pesos at the observed exchange rate (published by the Central Bank) on the working day following the close of each period. (1): Includes ENEX at book value(2): Compound average growth rateSource: Bloomberg, Quiñenco and subsidiaries
Market value of Quiñenco’soperating companies
Market value of financial
investments
Book value of other assets
Corporate level cash
Corporate level debt NAV+ + + ‐ =
The Net Asset Value has been calculated as follows:
CAGR(2)
2002 – 2013
Quiñenco’sNAV 23.0%
IPSA 12.6%
Quiñenco - NAV(MUS$)
13
(1)
(1)(1)
(1)
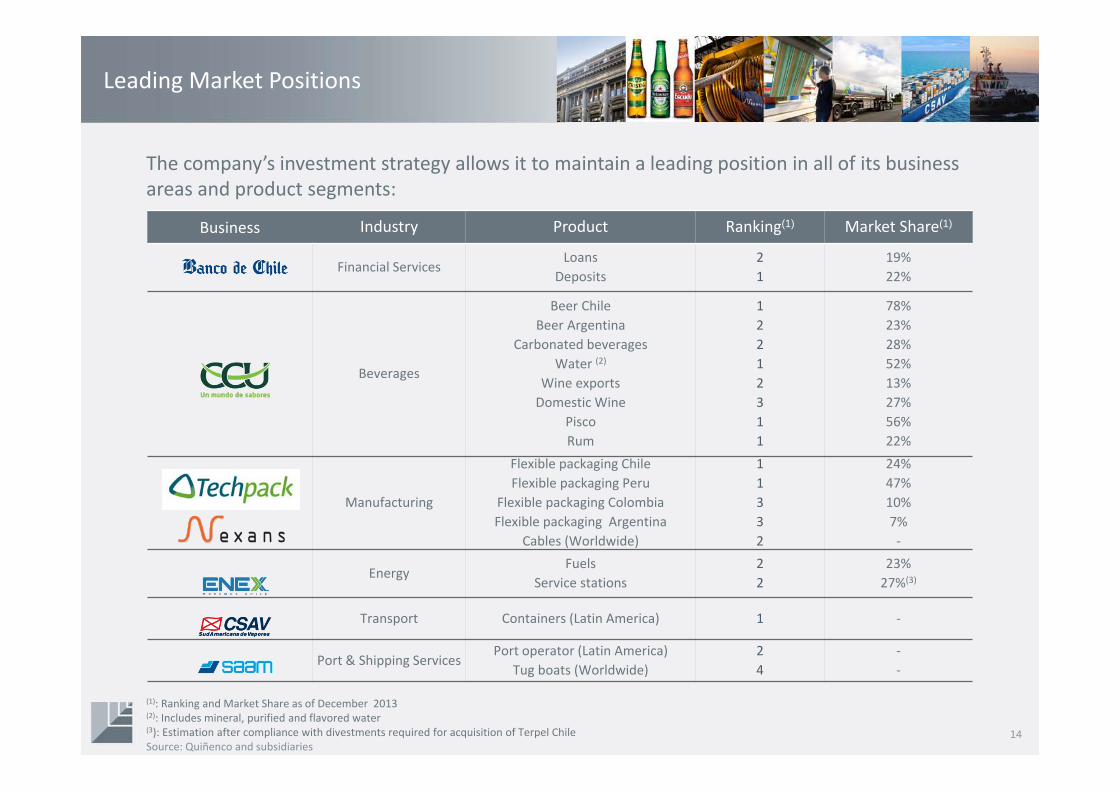
Leading Market Positions
The company’s investment strategy allows it to maintain a leading position in all of its business areas and product segments:
(1): Ranking and Market Share as of December 2013 (2): Includes mineral, purified and flavored water(3): Estimation after compliance with divestments required for acquisition of Terpel Chile Source: Quiñenco and subsidiaries
Business Industry Product Ranking(1) Market Share(1)
Financial ServicesLoans
Deposits2 1
19%22%
Beverages
Beer ChileBeer Argentina
Carbonated beveragesWater (2)
Wine exports Domestic Wine
PiscoRum
12212311
78%23%28%52%13%27%56%22%
Manufacturing
Flexible packaging ChileFlexible packaging Peru
Flexible packaging ColombiaFlexible packaging Argentina
Cables (Worldwide)
11332
24%47%10%7%‐
EnergyFuels
Service stations22
23%27%(3)
Transport Containers (Latin America) 1 ‐
Port & Shipping ServicesPort operator (Latin America)
Tug boats (Worldwide)24
‐‐
14

Diversified Investments
Quiñenco is one of the most diversified holding companies in Chile. During its history it has invested in sectors where it has a recognized track‐record and experience in the industry.
(1): Market Value of Quiñenco’s operating companies + Market Value of Financial Investments + Book value of other assets, net of other liabilities + Cash at the Corporate level ‐ Debt at the Corporate level.
Investments by Sector Net Asset Value(1) (NAV)
15
Financial Services29%
Beverage & Food10%
Manufacturing11%
Energy16%
Transport7%
Port & Shipping Serv.7%
Other1%
Cash19%
(US$ 5.4 billion as of June 30, 2014) (US$ 6.0 billion as of June 30, 2014)
Financial Services39%
Beverage & Food19%
Manufacturing5%
Energy12%
Transport4%
Port & Shipping Serv.5%
Other1%
Cash15%
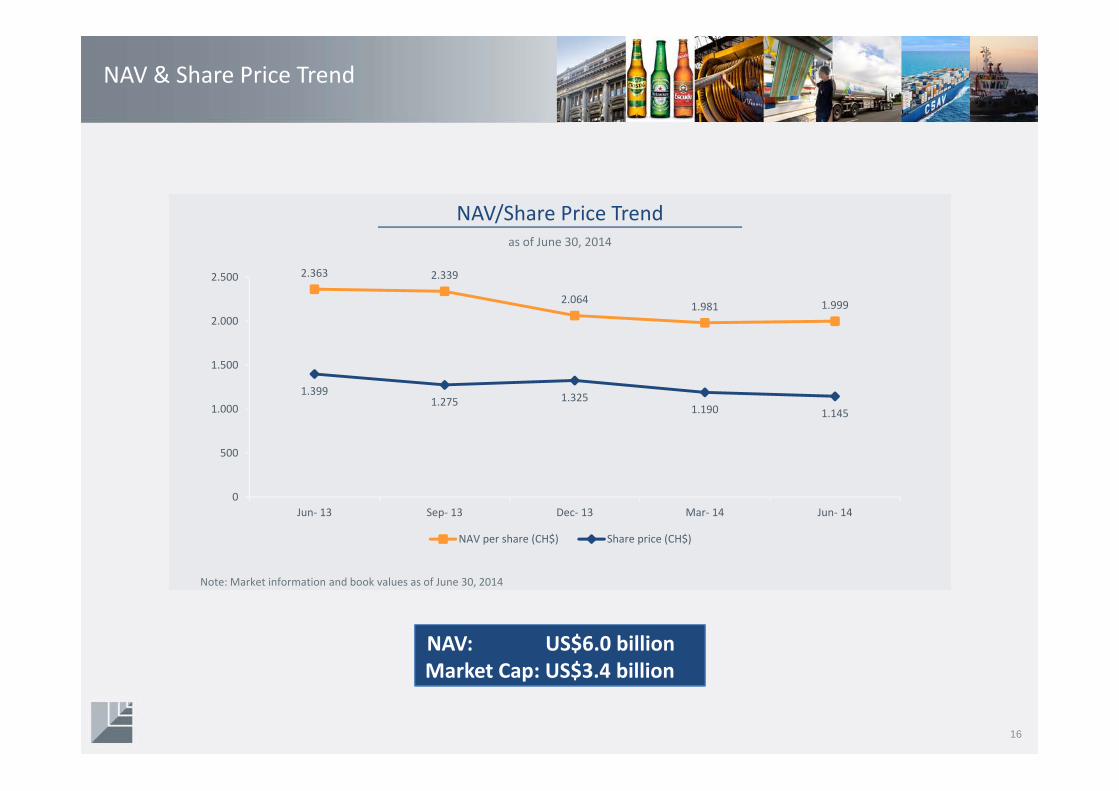
NAV & Share Price Trend
NAV/Share Price Trendas of June 30, 2014
Note: Market information and book values as of June 30, 2014
16
2.363 2.339
2.064 1.981 1.999
1.3991.275 1.325
1.190 1.145
0
500
1.000
1.500
2.000
2.500
Jun‐ 13 Sep‐ 13 Dec‐ 13 Mar‐ 14 Jun‐ 14
NAV per share (CH$) Share price (CH$)
NAV: US$6.0 billionMarket Cap: US$3.4 billion

Diversified Revenues and Results(2013)
Quiñenco has achieved diversified revenues and results, thus generating stable cash flows
(1) Quiñenco does not consolidate with CCU (Beverage & Food), CSAV ( Transport), SM SAAM (Port and Shipping Services) nor Nexans (Manufacturing).(2) Corresponds to the contribution of each segment to Quiñenco’s net income. (3) The Segment Others includes the contribution from CCU (US$72 million), SM SAAM (US$24 million), CSAV (‐US$71 million), and Quiñenco and others (‐US$1 million). Note: Figures translated at the exchange rate as of December 31, 2013: Ch$524.61= 1US$
Aggregate Revenues by Sector (1) Net Income (2)(Full year 2013) (Full year 2013, MUS$)
Financial Services13%
Beverage & Food11%
Manufacturing44%
Energy15%
Port & Shipping Serv.2%
Transport15%
17
‐59.1
236.6
36.2
24.3 238.0
Manufacturing FinancialServices
Energy Other (3) Total
CCU
SM SAAM
CSAV
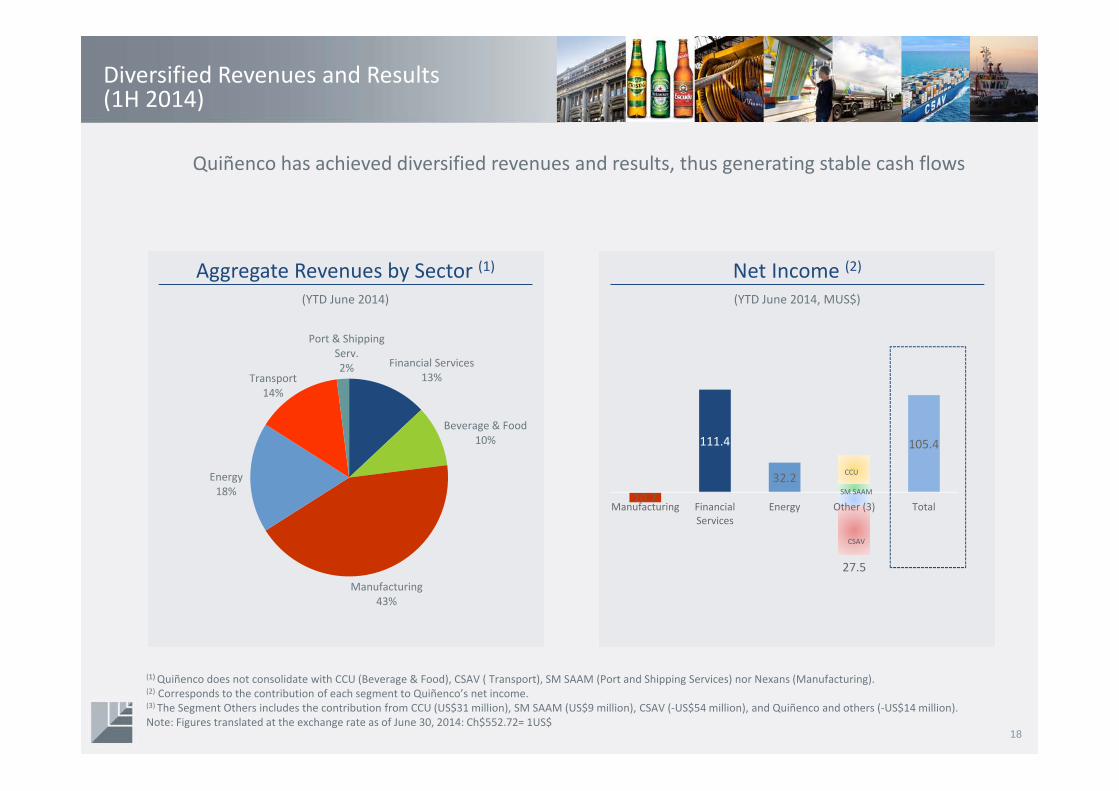
Diversified Revenues and Results(1H 2014)
Quiñenco has achieved diversified revenues and results, thus generating stable cash flows
Aggregate Revenues by Sector (1) Net Income (2)(YTD June 2014) (YTD June 2014, MUS$)
18
Financial Services13%
Beverage & Food10%
Manufacturing43%
Energy18%
Transport14%
Port & Shipping Serv.2%
10.7
111.4
32.2
27.5
105.4
Manufacturing FinancialServices
Energy Other (3) Total
(1) Quiñenco does not consolidate with CCU (Beverage & Food), CSAV ( Transport), SM SAAM (Port and Shipping Services) nor Nexans (Manufacturing).(2) Corresponds to the contribution of each segment to Quiñenco’s net income. (3) The Segment Others includes the contribution from CCU (US$31 million), SM SAAM (US$9 million), CSAV (‐US$54 million), and Quiñenco and others (‐US$14 million). Note: Figures translated at the exchange rate as of June 30, 2014: Ch$552.72= 1US$
CCU
SM SAAM
CSAV
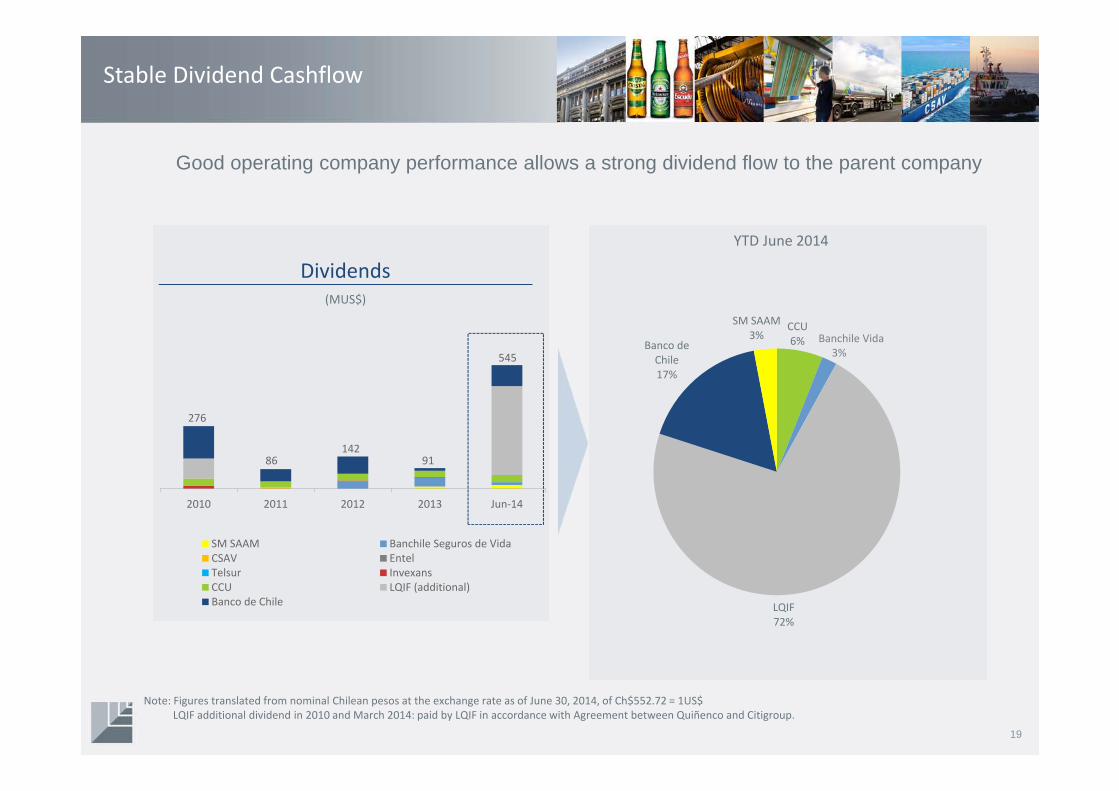
Stable Dividend Cashflow
Good operating company performance allows a strong dividend flow to the parent company
Dividends Composition of Dividends(MUS$) (YTD March 2012)
19
2010 2011 2012 2013 Jun‐14
SM SAAM Banchile Seguros de VidaCSAV EntelTelsur InvexansCCU LQIF (additional)Banco de Chile
CCU6%
LQIF72%
Banco de Chile17%
SM SAAM3%
Note: Figures translated from nominal Chilean pesos at the exchange rate as of June 30, 2014, of Ch$552.72 = 1US$LQIF additional dividend in 2010 and March 2014: paid by LQIF in accordance with Agreement between Quiñenco and Citigroup.
YTD June 2014
Banchile Vida3%
276
86142
91
545
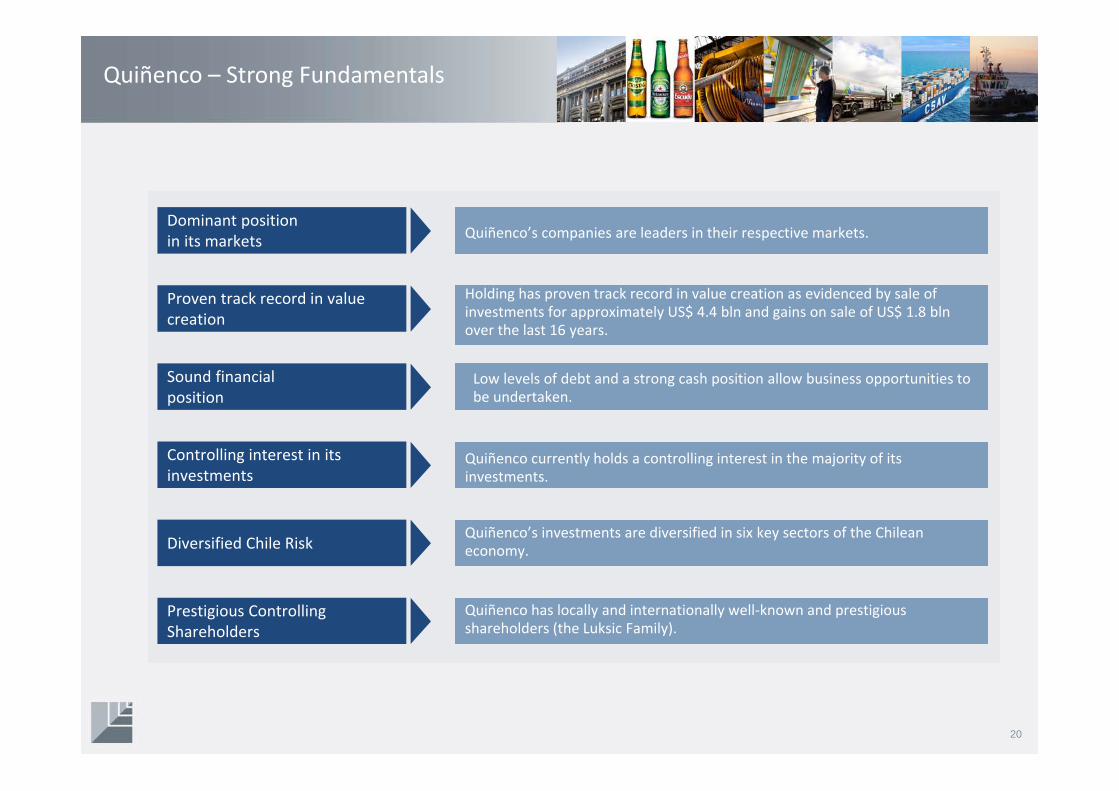
Quiñenco – Strong Fundamentals
Dominant positionin its markets
Proven track record in value creation
Sound financial position
Controlling interest in its investments
Diversified Chile Risk
Prestigious Controlling Shareholders
Quiñenco’s companies are leaders in their respective markets.
Holding has proven track record in value creation as evidenced by sale of investments for approximately US$ 4.4 bln and gains on sale of US$ 1.8 blnover the last 16 years.
Low levels of debt and a strong cash position allow business opportunities to be undertaken.
Quiñenco currently holds a controlling interest in the majority of its investments.
Quiñenco’s investments are diversified in six key sectors of the Chilean economy.
Quiñenco has locally and internationally well‐known and prestigious shareholders (the Luksic Family).
20

Recent EventsQuiñencoOverview
Financial Overview
Main Operating Companies
Conclusions
21

Quiñenco raises funds through debt and equity and increases number of Board members
Bond Issuance• In July 2013 and July 2014 Quiñenco successfully placed
UF 4,000,000 (approx. US$180 million) and UF 2,375,000 (approx. US$100 million) respectively, in bonds in the local market.
Capital Increase• In November 2013 Quiñenco successfully concluded its
capital increase, raising Ch$350 billion (approximately US$700 million) through the issuance of around 318 million shares at a price of Ch$1,100. During the Rights Offering period 99.98% of the total shares were subscribed.
Board of Directors• In April 2014, the Extraordinary Shareholders’ Meeting
approved increasing the number of Directors from 7 to 8 members, incorporating Andrónico Luksic Lederer.
22

Recent Events Operating Companies
23
Company Recent Events NAV (% of Total)
• Leadership in net income and profitability in the Chilean financial system.• High levels of efficiency with cost‐income ratio of 41%.• Diversification of its financing structure through the issuance of approximately US$785 million in
in Switzerland, US$168 million in Hong Kong, US$167 million in Japan, and US$400 million in commercial papers in the USA in 2013, and around US$460 million in bonds in Switzerland, Japan, and Hong Kong during 2014.
• In January 2014 LQIF carried out a secondary offering, equivalent to a 7.2% stake in the Bank, receiving approx. US$ 818 million. Thus the Bank’s free float increased from 17.6% to 24.8%. LQIF’s stake in the Bank decreased to 51%.
• Quiñenco received an extraordinary dividend of US$390 million corresponding to this transaction, and an increment in equity of US$156 million.
39%
Recent Events Operating Companies
24
Company Recent Events NAV (% of Total)
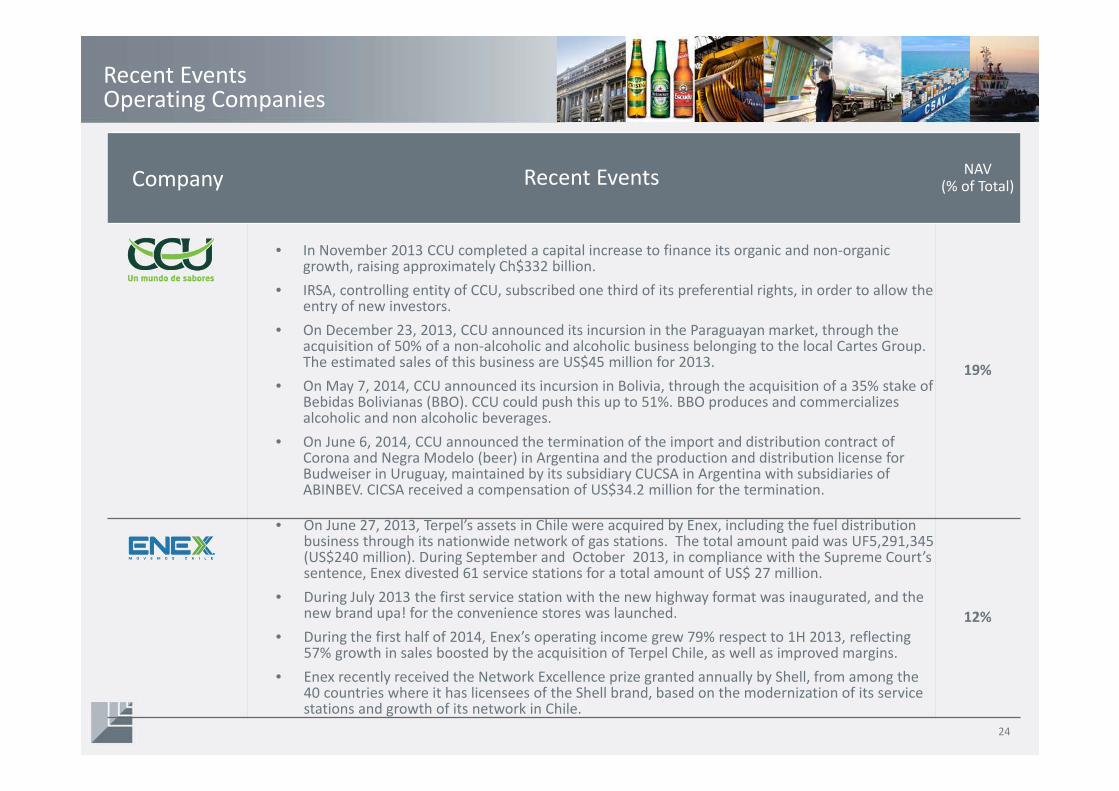
• In November 2013 CCU completed a capital increase to finance its organic and non‐organic growth, raising approximately Ch$332 billion.
• IRSA, controlling entity of CCU, subscribed one third of its preferential rights, in order to allow the entry of new investors.
• On December 23, 2013, CCU announced its incursion in the Paraguayan market, through the acquisition of 50% of a non‐alcoholic and alcoholic business belonging to the local Cartes Group. The estimated sales of this business are US$45 million for 2013.
• On May 7, 2014, CCU announced its incursion in Bolivia, through the acquisition of a 35% stake of Bebidas Bolivianas (BBO). CCU could push this up to 51%. BBO produces and commercializes alcoholic and non alcoholic beverages.
• On June 6, 2014, CCU announced the termination of the import and distribution contract of Corona and Negra Modelo (beer) in Argentina and the production and distribution license for Budweiser in Uruguay, maintained by its subsidiary CUCSA in Argentina with subsidiaries of ABINBEV. CICSA received a compensation of US$34.2 million for the termination.
19%
• On June 27, 2013, Terpel’s assets in Chile were acquired by Enex, including the fuel distribution business through its nationwide network of gas stations. The total amount paid was UF5,291,345 (US$240 million). During September and October 2013, in compliance with the Supreme Court’s sentence, Enex divested 61 service stations for a total amount of US$ 27 million.
• During July 2013 the first service station with the new highway format was inaugurated, and the new brand upa! for the convenience stores was launched.
• During the first half of 2014, Enex’s operating income grew 79% respect to 1H 2013, reflecting 57% growth in sales boosted by the acquisition of Terpel Chile, as well as improved margins.
• Enex recently received the Network Excellence prize granted annually by Shell, from among the 40 countries where it has licensees of the Shell brand, based on the modernization of its service stations and growth of its network in Chile.
12%
Recent Events Operating Companies
25
Company Recent Events NAV (% of Total)
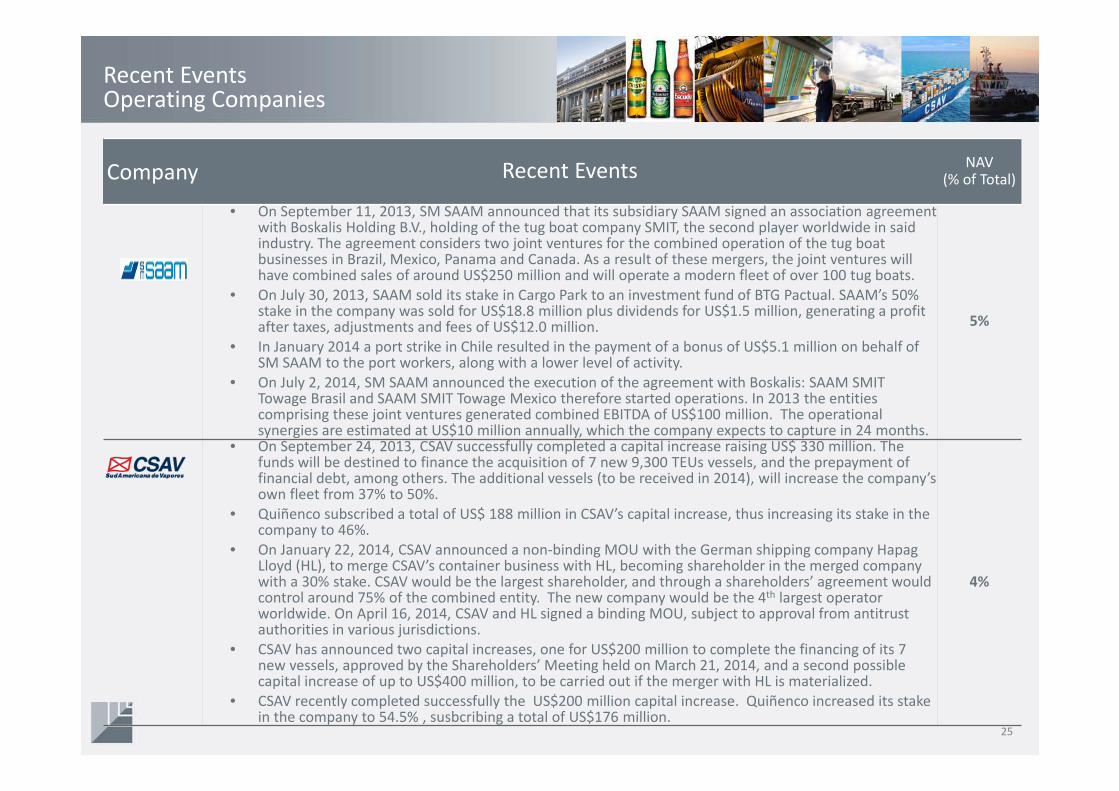
• On September 11, 2013, SM SAAM announced that its subsidiary SAAM signed an association agreement with Boskalis Holding B.V., holding of the tug boat company SMIT, the second player worldwide in said industry. The agreement considers two joint ventures for the combined operation of the tug boat businesses in Brazil, Mexico, Panama and Canada. As a result of these mergers, the joint ventures will have combined sales of around US$250 million and will operate a modern fleet of over 100 tug boats.
• On July 30, 2013, SAAM sold its stake in Cargo Park to an investment fund of BTG Pactual. SAAM’s 50% stake in the company was sold for US$18.8 million plus dividends for US$1.5 million, generating a profit after taxes, adjustments and fees of US$12.0 million.
• In January 2014 a port strike in Chile resulted in the payment of a bonus of US$5.1 million on behalf of SM SAAM to the port workers, along with a lower level of activity.
• On July 2, 2014, SM SAAM announced the execution of the agreement with Boskalis: SAAM SMIT Towage Brasil and SAAM SMIT Towage Mexico therefore started operations. In 2013 the entities comprising these joint ventures generated combined EBITDA of US$100 million. The operational synergies are estimated at US$10 million annually, which the company expects to capture in 24 months.
5%
• On September 24, 2013, CSAV successfully completed a capital increase raising US$ 330 million. The funds will be destined to finance the acquisition of 7 new 9,300 TEUs vessels, and the prepayment of financial debt, among others. The additional vessels (to be received in 2014), will increase the company’s own fleet from 37% to 50%.
• Quiñenco subscribed a total of US$ 188 million in CSAV’s capital increase, thus increasing its stake in the company to 46%.
• On January 22, 2014, CSAV announced a non‐binding MOU with the German shipping company HapagLloyd (HL), to merge CSAV’s container business with HL, becoming shareholder in the merged company with a 30% stake. CSAV would be the largest shareholder, and through a shareholders’ agreement would control around 75% of the combined entity. The new company would be the 4th largest operator worldwide. On April 16, 2014, CSAV and HL signed a binding MOU, subject to approval from antitrust authorities in various jurisdictions.
• CSAV has announced two capital increases, one for US$200 million to complete the financing of its 7 new vessels, approved by the Shareholders’ Meeting held on March 21, 2014, and a second possible capital increase of up to US$400 million, to be carried out if the merger with HL is materialized.
• CSAV recently completed successfully the US$200 million capital increase. Quiñenco increased its stake in the company to 54.5% , susbcribing a total of US$176 million.
4%

Recent Events Operating Companies
26
Company Recent Events NAV (% of Total)
• Invexans increased its stake in Nexans to 26.6%, following the French company’s capital increase during October, 2013. It has further increased to 28.5%.
• Nexans raised approximately €284 million in its rights offering, intended to strengthen the company’s financial structure, sustain its credit profile, and grant flexibility to the group’s strategic initiatives.
• Invexans completed a capital increase of US$270 million , in order to increase its stake in Nexans and reduce the company’s liabilities, including a long term debt of US$30 million. Quiñenco increased its stake in Invexans from 65.9% to 80.5% following the capital increase.
• On May 22, 2014, Invexans and Nexans announced the termination of the agreement signed in 2011, due to the fact that its main objective of establishing Invexans as a relevant shareholder had been achieved. Invexans stated that it does not intend to increase its stake above 30% or reduce its stake partially or completely.
• As part of its strategic development plan, during the last quarter of 2013 Madeco announced the closure of its brass mills operations in Chile and Argentina, due to the loss of competitiveness of this business unit, due to higher production costs, lack of economies of scale and market changes, with cheaper PVC pipes. Thus the company will focus en the flexible packaging business.
• Furthermore, on March 10 2014, Madeco announced the closure of its profile’s subsidiary Indalum, due to a sustained loss of competitiveness.
• In April 2014, Madeco’s Shareholders’ Meeting approved changing the company’s name to Techpack. • On June 10, 2014, Techpack announced the acquisition of the Chilean packaging company HYC
Packaging, specialized in the manufacture of flexible packages, for US$34.3 million. With this addition Techpack consolidates its position as regional leader in flexible packaging in the region and increases its installed capacity to 80,000 tons a year.
• Towards the end of September Techpack launched a US$150 million capital increase, approved by its shareholders last April, in order to finance the company’s strategic plan focused on flexible packaging, which contemplates investments in companies that Techpack has in Chile, Peru, Argentina and Colombia (including a new plant), and the potential acquisition of new companies in these and other markets in the region, as well as a partial prepayment of liabilities. During the rights offering period Quiñencosubscribed its pro rata share amounting to US$ 98.7 million.
5%
Financial OverviewQuiñencoOverview
Recent Events Main Operating Companies
Conclusions
27

Sound Results
Quiñenco has reported increasing revenues and strong bottom line results
Revenues(1) Net Income(2)(MUS$) (MUS$)
28
2,284
3,902
4,714
5,919
2,532
3,448
2010 2011 2012 2013 Jun‐13 Jun‐14
528
159
253226
135105
2010 2011 2012 2013 Jun‐13 Jun‐14
Note: Figures translated from nominal Chilean pesos at the exchange rate as of June 30, 2014, of Ch$552.72 = 1US$(1): Consolidated revenues under IFRS = Total Revenues (Industrial Sector) + Total Net Operating Income (Banking Sector)(2): Net Income = Net income attributable to equity holders of the controller

Quiñenco Holding: Conservative Financial Structure
Long term investments are financed with equity and long term debt in Chilean pesos
Assets Liabilities and Equity
29
US$ 5.4 billion as of June 2014 US$ 5.4 billion as of June 2014
LT Assets 80%
Cash19%
Other1%
SH Equity85%
LT Debt12%
Other Liabilities1%
ST Debt2%
Note: Figures translated from nominal Chilean pesos at the exchange rate as of June 30, 2014, of Ch$552.72 = 1US$
Low Financial Corporate Debt
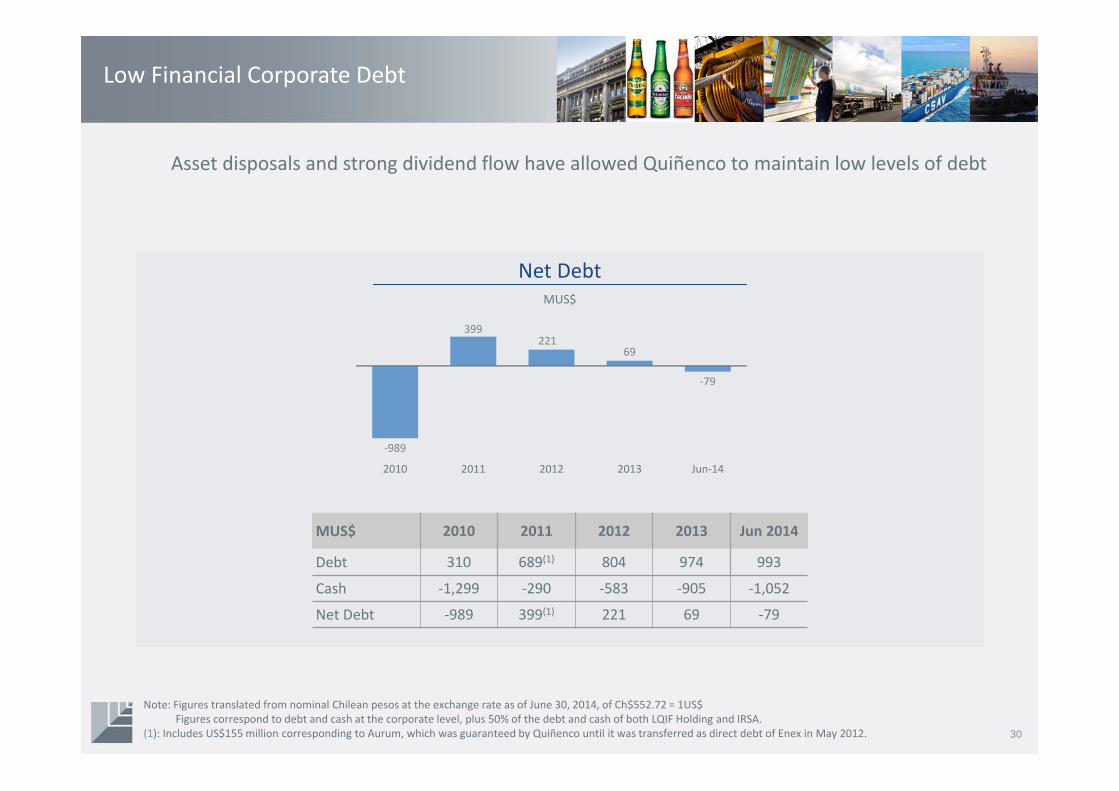
Asset disposals and strong dividend flow have allowed Quiñenco to maintain low levels of debt
Net DebtMUS$
30
MUS$ 2010 2011 2012 2013 Jun 2014
Debt 310 689(1) 804 974 993
Cash ‐1,299 ‐290 ‐583 ‐905 ‐1,052
Net Debt ‐989 399(1) 221 69 ‐79
Note: Figures translated from nominal Chilean pesos at the exchange rate as of June 30, 2014, of Ch$552.72 = 1US$Figures correspond to debt and cash at the corporate level, plus 50% of the debt and cash of both LQIF Holding and IRSA.
(1): Includes US$155 million corresponding to Aurum, which was guaranteed by Quiñenco until it was transferred as direct debt of Enex in May 2012.
‐989
399221
69
‐79
2010 2011 2012 2013 Jun‐14
Main Operating CompaniesQuiñencoOverview
Recent Events Financial Overview
Conclusions
31
Banco de Chile
Ownership Structure Net Income(1) Contribution by Business Area(December 2013)
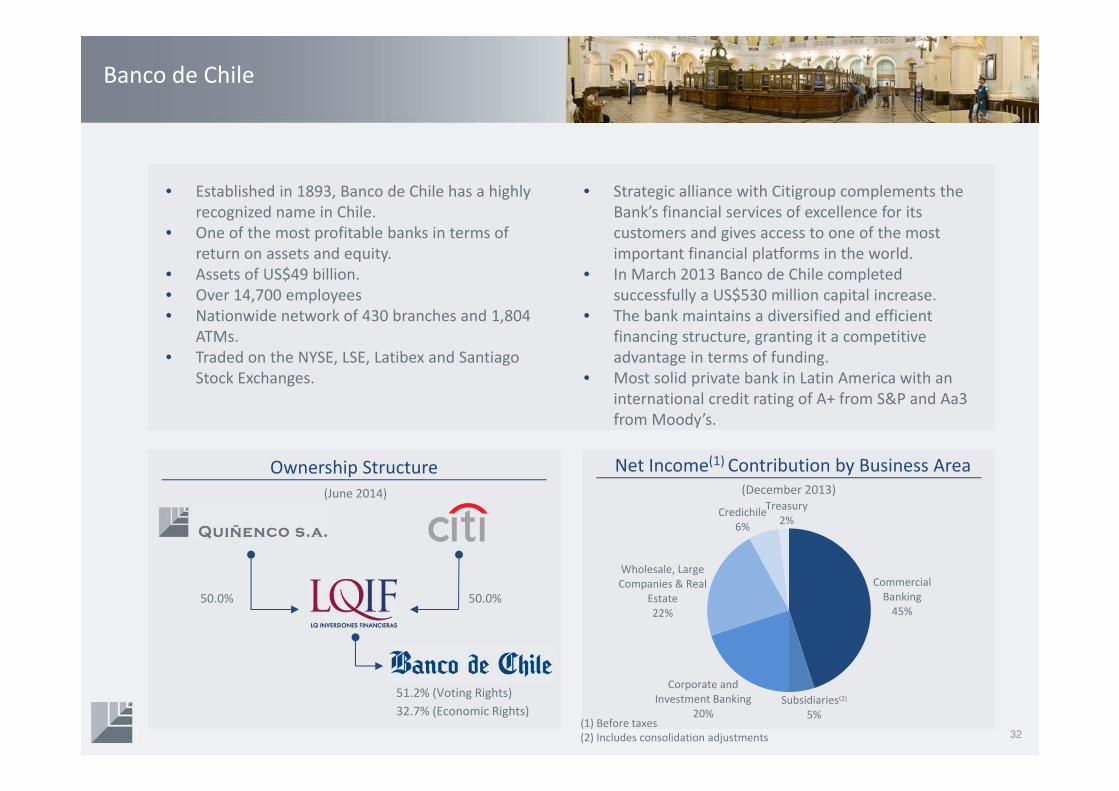
• Established in 1893, Banco de Chile has a highly recognized name in Chile.
• One of the most profitable banks in terms of return on assets and equity.
• Assets of US$49 billion.• Over 14,700 employees• Nationwide network of 430 branches and 1,804
ATMs. • Traded on the NYSE, LSE, Latibex and Santiago
Stock Exchanges.
• Strategic alliance with Citigroup complements the Bank’s financial services of excellence for its customers and gives access to one of the most important financial platforms in the world.
• In March 2013 Banco de Chile completed successfully a US$530 million capital increase.
• The bank maintains a diversified and efficient financing structure, granting it a competitive advantage in terms of funding.
• Most solid private bank in Latin America with an international credit rating of A+ from S&P and Aa3 from Moody’s.
51.2% (Voting Rights)32.7% (Economic Rights)
50.0%50.0%
32
Commercial Banking45%
Subsidiaries(2)5%
Corporate and Investment Banking
20%
Wholesale, Large Companies & Real
Estate22%
Credichile6%
Treasury2%
(June 2014)
(1) Before taxes(2) Includes consolidation adjustments

Banco de Chile
Operating Revenues(MUS$)
Net Income(MUS$)
ROAE• In 2013 the bank’s net operating revenues grew 10.1%, based on higher loans to customers and a higher balance of demand deposits and current accounts, mitigated by higher loan provisions. In 1H 2014 revenues grew 20.0%
• Net income in 2013 wasMUS$929, 9.8% above 2012 results, the highest in the Chilean financial system. In 1H 2014 net income continued growing, up 25.0% from 1Q 2013.
• ROAE = 25.6%, the highest in the Chilean financial system.
33
27.0%24.7% 23.2% 22.5%
25.6%
2010 2011 2012 2013 Jun‐14
2,115 2,2142,392
2,634
1,2361,483
2010 2011 2012 2013 Jun‐13 Jun‐14
685776
846929
440550
2010 2011 2012 2013 Jun‐13 Jun‐14
Note: Figures translated from nominal Chilean pesos at the exchange rate as of June 30, 2014, of Ch$552.72 = 1US$

CCU
Ownership Structure Market Share(December 2013)
• Founded in 1850, CCU is the largest brewery and beverage producer in Chile, and the second brewery in Argentina.
• Assets of US$3.3 billion.• Over 6,800 employees.• 14 facilities in Chile with more than 591,000 m2. • 8 facilities in Rio de la Plata (Argentina & Uruguay)
with over 266,000 m2.
• 9 wine facilities with over 150,000 m2.• Extensive distribution network reaching over
115,000 sales points throughout Chile & 152,000 in Argentina.
• Jointly controlled with Heineken, 2nd largest brewery worldwide.
• Traded on NYSE and Santiago Stock Exchanges.• Affiliate Foods participates in sweet snack
business.• Entered purified water segment through joint
venture with Nestlé S.A.• In 2012 expands to mineral water and soft drinks
businesses in Uruguay, and acquires 51% of Manantial in Chile, dedicated to HOD.
• In December 2013 CCU acquired a 50% stake in an alcoholic and non‐alcoholic beverage business in Paraguay.
• In May 2014, CCU entered the Bolivian market through the acquisition of 35% of BebidasBolivianas.
50.0%50.0%Inv. y Rentas
60.0%
Ranking Mkt. Share
Beer Chile 1 78%
Beer Argentina 2 23%
Carbonated Beverages 2 28%
Water (1) 1 52%
Domestic Wine 3 27%
Export Wine 2 13%
Pisco 1 56%
Rum 1 22%
34
(June 2014)
(1) Water includes mineral, purified and flavored water

CCU
Sales(MUS$)
EBITDA by Business Segment• Sales grew by 11.3% in 2013 to MUS$2,166,
reflecting growth in all segments. In 1H 2014 this positive trend continued.
• EBITDA was MUS$457 in 2013 increasing by 7.0%from 2012, boosted by the non‐alcoholic beverage segment, followed by Beer Chile, Río de la Plata and Wine. In 1H 2014 EBITDA increased 12% mainly due to the compensation received in Argentina that mitigated higher distribution and marketing costs.
• Net income in 2013 reached MUS$223, 7.5% above 2012, mainly due to positive operating performance of the business units. In 1H 2014 net income reached MUS$116.
EBITDA(MUS$)
Net Income(MUS$)
35
Chile63%
Río de la Plata18%
Wine13%
Other6%
1,5171,754
1,9462,166
991 1,083
2010 2011 2012 2013 Jun‐13 Jun‐14
375435
427457
201 225
2010 2011 2012 2013 Jun‐13 Jun‐14
200222
207223
101116
2010 2011 2012 2013 Jun‐13 Jun‐14
Note: Figures translated from nominal Chilean pesos at the exchange rate as of June 30, 2014, of Ch$552.72 = 1US$
(June 2014)
Invexans
36
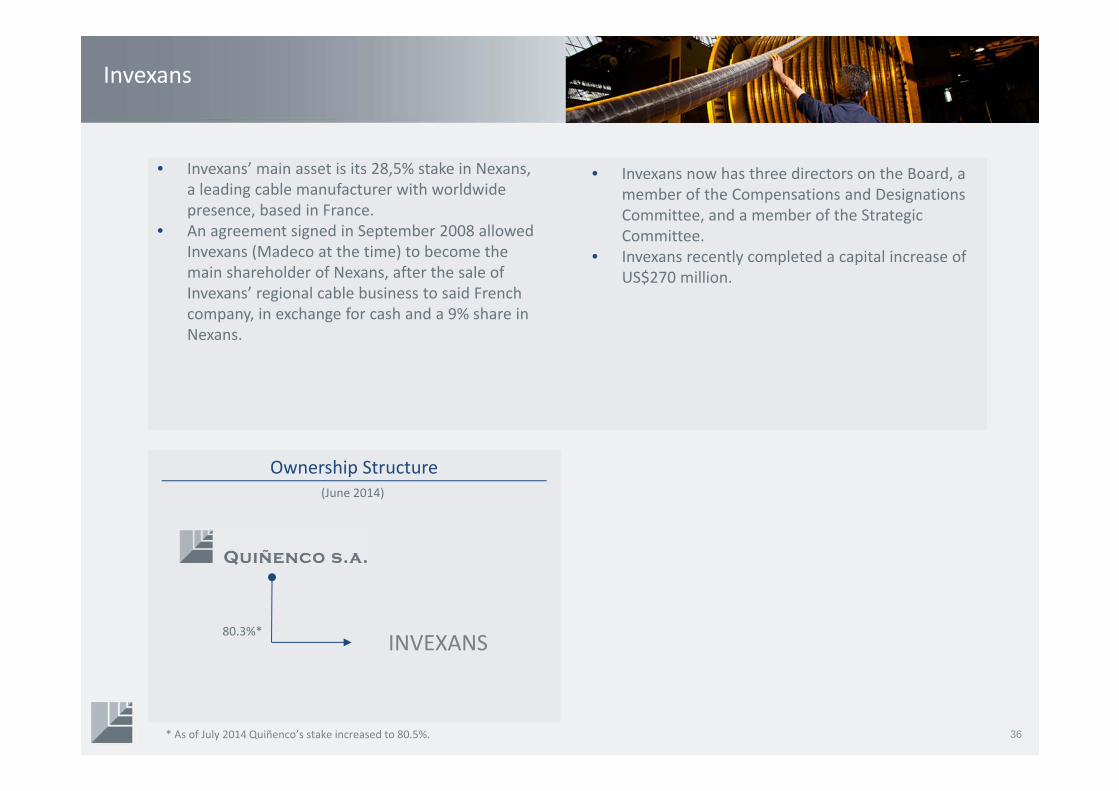
• Invexans’ main asset is its 28,5% stake in Nexans, a leading cable manufacturer with worldwide presence, based in France.
• An agreement signed in September 2008 allowed Invexans (Madeco at the time) to become the main shareholder of Nexans, after the sale of Invexans’ regional cable business to said French company, in exchange for cash and a 9% share in Nexans.
• Invexans now has three directors on the Board, a member of the Compensations and Designations Committee, and a member of the Strategic Committee.
• Invexans recently completed a capital increase of US$270 million.
Ownership Structure(June 2014)
INVEXANS80.3%*
* As of July 2014 Quiñenco’s stake increased to 80.5%.

Nexans
June 2014 Sales by Key‐end Markets
• Nexans is a worldwide leader in the cable industry with presence in 40 countries and commercial activities worldwide, after over a century of progress.
• Headquartered in Paris, France, Nexansproduces cables and cabling systems at more than 90 production sites across 5 continents.
• 26,000 employees • Nexans is listed on Euronext Paris.
Transmission, Distribution & Operators
42%
Industry27%
Distributors & Installers25%
Others6%
37
EUR (millions) 2011 2012 2013 Jun-13 Jun-14
Sales 6,920 7,178 6,711 3,412 3,216
Operatingmargin 261 202 171 75 77
Net income (178) 27 (333) (145) 25
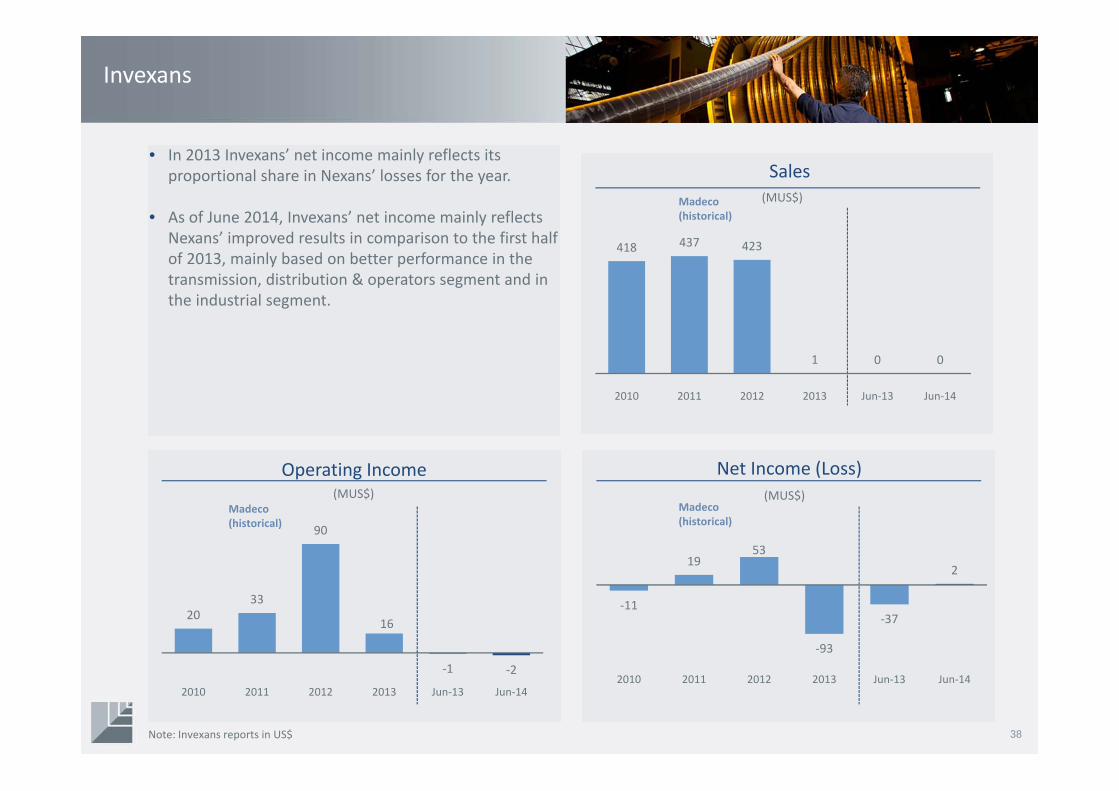
2033
90
16
‐1 ‐2
2010 2011 2012 2013 Jun‐13 Jun‐14
Invexans
38
Sales
Operating Income Net Income (Loss)
Note: Invexans reports in US$
418 437 423
1 0 0
2010 2011 2012 2013 Jun‐13 Jun‐14
‐11
1953
‐93
‐37
2
2010 2011 2012 2013 Jun‐13 Jun‐14
Madeco(historical)
Madeco(historical)
Madeco(historical)
• In 2013 Invexans’ net income mainly reflects its proportional share in Nexans’ losses for the year.
• As of June 2014, Invexans’ net income mainly reflects Nexans’ improved results in comparison to the first half of 2013, mainly based on better performance in the transmission, distribution & operators segment and in the industrial segment.
(MUS$)
(MUS$)
(MUS$)
Techpack (ex‐Madeco)
39
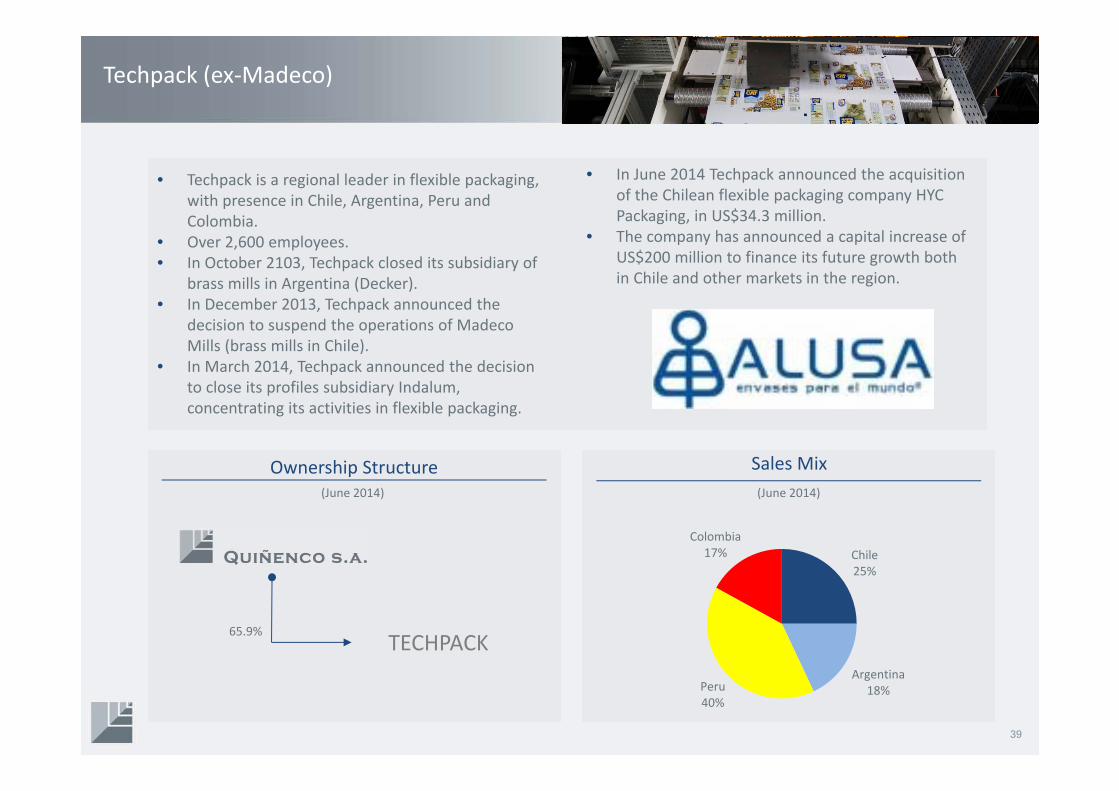
• Techpack is a regional leader in flexible packaging, with presence in Chile, Argentina, Peru and Colombia.
• Over 2,600 employees.• In October 2103, Techpack closed its subsidiary of
brass mills in Argentina (Decker).• In December 2013, Techpack announced the
decision to suspend the operations of MadecoMills (brass mills in Chile).
• In March 2014, Techpack announced the decision to close its profiles subsidiary Indalum, concentrating its activities in flexible packaging.
Sales Mix
Chile25%
Argentina18%Peru
40%
Colombia17%
• In June 2014 Techpack announced the acquisition of the Chilean flexible packaging company HYC Packaging, in US$34.3 million.
• The company has announced a capital increase of US$200 million to finance its future growth both in Chile and other markets in the region.
Ownership Structure(June 2014)
TECHPACK65.9%
(June 2014)

69
51
8
2013 Jun‐13 Jun‐14
Techpack
40
Sales
Operating Income Net Income
Note: Techpack reports in US$
416
171 177
2013 Jun‐13 Jun‐14
2
19
‐20
2013 Jun‐13 Jun‐14
• Techpack’s operating income in 2013 includes negative goodwill of MUS$30 related to Peruplast, and the contribution from flexible packaging.
• Techpack’s net income in 2013 was MUS$2, boosted by the negative goodwill mentioned above, and mostly offset by financial costs, tax expense, and the loss from discontinued operations (brass mills).
• In 1H 2014 Techpack reported a net loss of MUS$20, mainly due to lower operating income, which included negative goodwill related to Peruplast, and the loss from discontinued operations.
(MUS$)
(MUS$)
(MUS$)
Enex
Service Stations(December 2013)
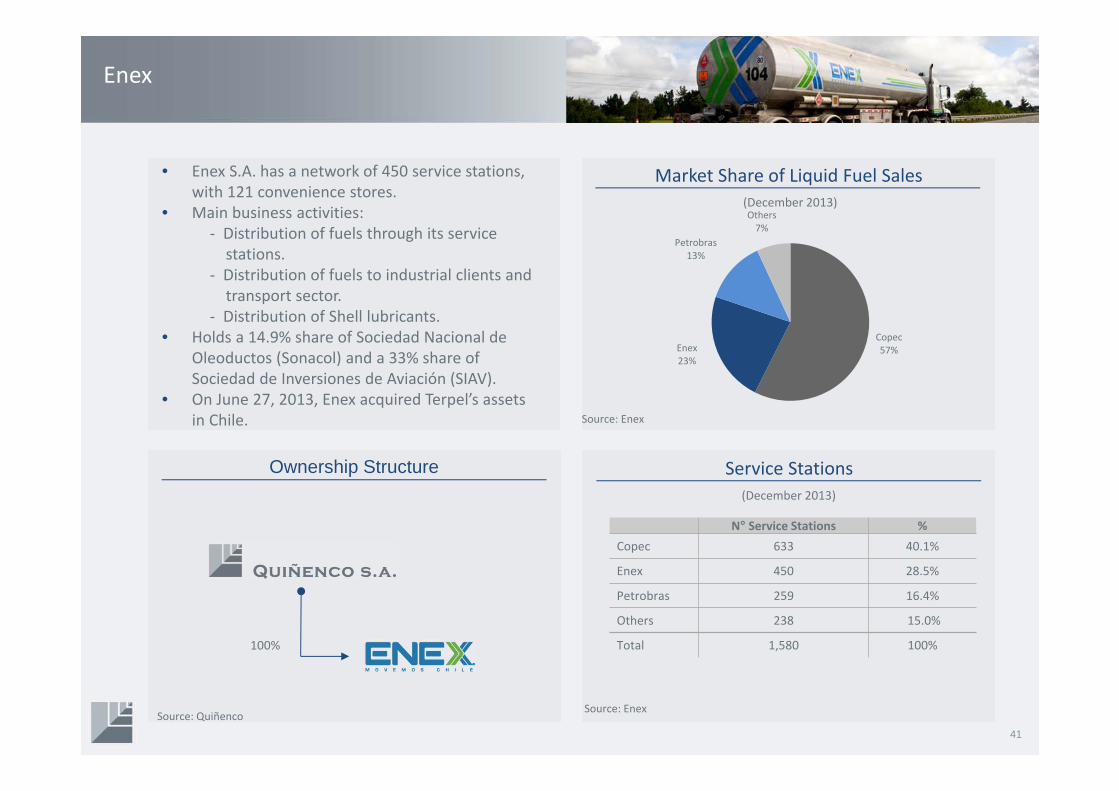
Market Share of Liquid Fuel Sales• Enex S.A. has a network of 450 service stations, with 121 convenience stores.
• Main business activities:‐ Distribution of fuels through its servicestations.
‐ Distribution of fuels to industrial clients and transport sector.
‐ Distribution of Shell lubricants.• Holds a 14.9% share of Sociedad Nacional de
Oleoductos (Sonacol) and a 33% share of Sociedad de Inversiones de Aviación (SIAV).
• On June 27, 2013, Enex acquired Terpel’s assets in Chile.
Source: Quiñenco
(December 2013)
Ownership Structure
100%
Source: Enex
Source: Enex
N° Service Stations %Copec 633 40.1%
Enex 450 28.5%
Petrobras 259 16.4%
Others 238 15.0%
Total 1,580 100%
41
Copec57%Enex
23%
Petrobras13%
Others7%

Enex
Net Income(MUS$)
Sales(MUS$)
Operating Income(MUS$)
42
• Sales in 2013 reached MUS$3,180, mainly corresponding to fuels, boosted by the acquisition of Terpel Chile in June 2013. 1H 2014 sales also reflect this acquisition.
• Operating income more than tripled to MUS$45 in 2013, mainly reflecting the favorable effect of the addition of Terpel Chile’s operations. 1H 2014 operating income is up 79% over the previous period.
• Net income in 2013 amounted to MUS$34, lower than 2012 despite the strong growth in operating income, due to a non recurring gain reported the year before. Net income in 1H 2014 reached MUS$32, as a result of growth in operating income.
1,324
2,426
3,180
1,249
1,963
2011 2012 2013 Jun‐13 Jun‐14
12 14
45
23
40
2011 2012 2013 Jun‐13 Jun‐14
5
51
34
16
32
2011 2012 2013 Jun‐13 Jun‐14
Note: Figures translated from nominal Chilean pesos at the exchange rate as of June 30, 2014, of Ch$552.72 = 1US$

CSAV
Ownership Structure Sales Mix(June 2014)
• CSAV, founded in 1872, is one of the oldest shipping companies in the world.
• Its activities include overseas transport of containerized cargo, liquid and solid bulk, refrigerated cargo, and vehicles.
• At year end 2013 had a total operated fleet of 50 vessels for containers.
• Total assets as of December 2013 of US$2.4 billon.• In January 2014, CSAV announced a non‐binding
agreement with the German shipping company Hapag Lloyd (HL) to merge CSAV’s container business with HL, becoming shareholder of the merged entity with a 30% stake.
• CSAV would be the main shareholder and through a shareholders’ agreement would control around 75%. The merged HL would be the fourth largest shipping company worldwide.
• In April 2014 CSAV and HL signed a binding MOU, which is currently subject to approvals in various jurisdictions from antitrust authorities.
• In August 2014 CSAV completed a US$200 million capital increase. Quiñenco increased its stake to 54.5%
Source: Quiñenco
54.0%46.0%*
Source: CSAV
Container Shipping Services
91%
Other Shipping Services
9%
43
Others
(June 2014)
* As of August 2014 Quiñenco’s stake increased to 54.5%.

CSAV
EBITDA(MUS$)
Net Income/Loss(MUS$)
Sales• In 2013 CSAV’s sales reached MUS$3,206 6.6% below 2012, mainly as a result of lower freight rates and to a lesser extent a lower sales volume. The drop in 1Q 2014 is due to lower rates.
• Net income in 2013 was a loss of MUS$169, improving 46.1% over 2012, mainly reflecting the absence in the current year of losses from discontinued operations, related to the restructuring process completed in 2012. Also, a net favorable effect was reported in 2013 based on prepayment of financial debt and the merger of foreign subsidiaries, partially offset by a provision for an antitrust investigation. In 1H 2014 the net loss was double that of 1H 2013, due to lower freight rates in 2014 as well as non‐recurring gains in 2013.
(MUS$)
44Note: CSAV reports in US$
5,2154,796
3,432 3,206
1,652 1,455
2010 2011 2012 2013 Jun‐13 Jun‐14
326
‐1,024
‐137 ‐174‐54 ‐87
2010 2011 2012 2013 Jun‐13 Jun‐14
171
‐1,250
‐314‐169 ‐62 ‐124
2010 2011 2012 2013 Jun‐13 Jun‐14
SM SAAM
Ownership Structure EBITDA Mix1(June 2014)
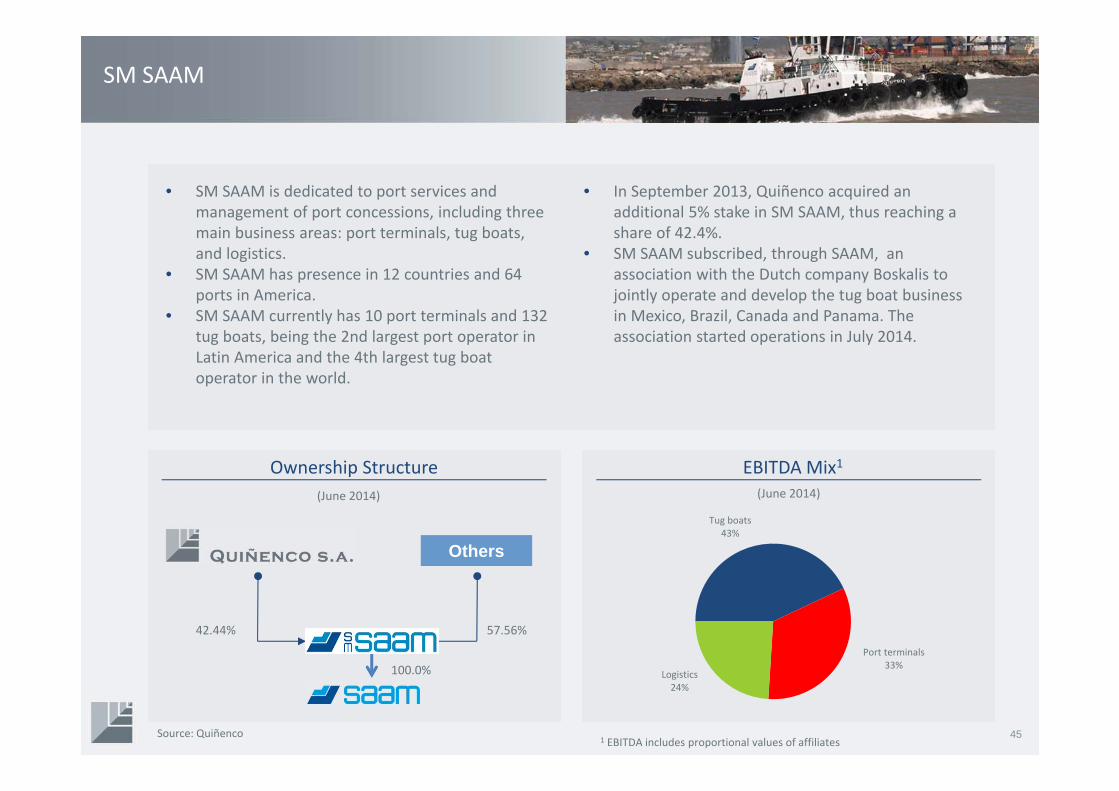
• SM SAAM is dedicated to port services and management of port concessions, including three main business areas: port terminals, tug boats, and logistics.
• SM SAAM has presence in 12 countries and 64 ports in America.
• SM SAAM currently has 10 port terminals and 132 tug boats, being the 2nd largest port operator in Latin America and the 4th largest tug boat operator in the world.
• In September 2013, Quiñenco acquired an additional 5% stake in SM SAAM, thus reaching a share of 42.4%.
• SM SAAM subscribed, through SAAM, an association with the Dutch company Boskalis to jointly operate and develop the tug boat business in Mexico, Brazil, Canada and Panama. The association started operations in July 2014.
Source: Quiñenco
57.56%42.44%
45
Others
1 EBITDA includes proportional values of affiliates
100.0%
Tug boats43%
Port terminals33%
Logistics24%
(June 2014)

SM SAAM
46
Net Income(MUS$)
Sales(MUS$)
Operating Income(MUS$)
Note: SM SAAM reports in US$
• SM SAAM’s consolidated sales in 2013 reached MUS$479, up 6.9% over the last quarter, reflecting improved performance in tug boats and ports. Sale in 1Q 2014 were affected by the port strike in Chile.
• SM SAAM obtained net income of MUS$74 in 2013, 23.6% higher than the previous period based on sound performance of its business units and equity investments, and boosted by a gain after taxes of MUS$12 on the sale of its stake in Cargo Park. Net income in 1H 2014 was negatively affected by the port strike, which implied a direct payment of MUS$5.1 for SAAM, as well as by lower income in logistics.
448479
241 249
2012 2013 Jun‐13 Jun‐14
5966
3125
2012 2013 Jun‐13 Jun‐14
60
74
3326
2012 2013 Jun‐13 Jun‐14

ConclusionsQuiñencoOverview
Recent Events Financial Overview
Main Operating Companies
47
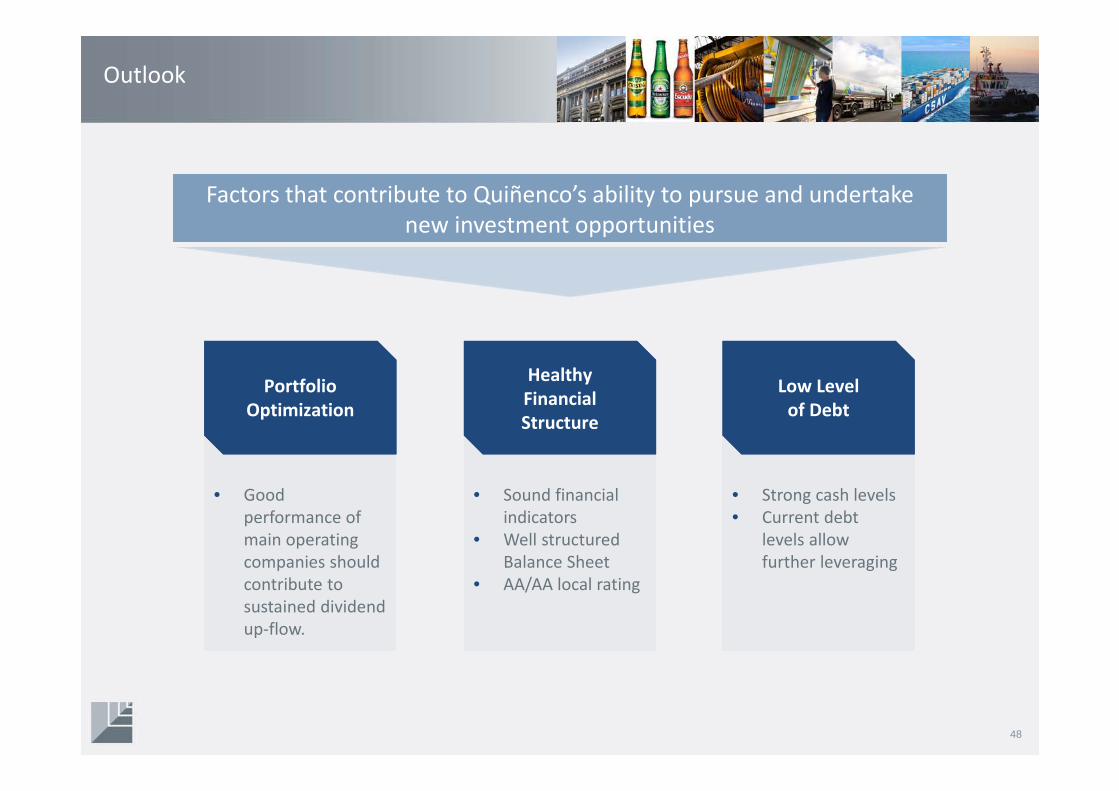
Outlook
PortfolioOptimization
Healthy Financial Structure
Low Level of Debt
• Good performance of main operating companies should contribute to sustained dividend up‐flow.
• Sound financial indicators
• Well structured Balance Sheet
• AA/AA local rating
• Strong cash levels• Current debt
levels allow further leveraging
Factors that contribute to Quiñenco’s ability to pursue and undertake new investment opportunities
48
49


![Presentation Quiñenco March 2012.ppt [Modo de compatibilidad]](https://static.fdocuments.net/doc/165x107/6262e6656dc59a78b777d93b/presentation-quienco-march-2012ppt-modo-de-compatibilidad.jpg)


