
Company Overall Rubric for: C45449: Andrews: 2014: Round...
15
Company Overall Rubric for: C45449: Andrews: 2014: Round 3 COMPANY RUBRIC Points (0..3) Margins & Profitability Asset Utilization ROS (Profits/Sales) 0 Asset turnover (Sales/Assets) 0 EPS (Earnings Per Share) 0 Sales to Current Assets 0 Contribution Margin 2 Overall plant utilization 3 Change in Stock Price 0 Total (Max 9) 3 Total (Max 12) 2 Ability to raise growth capital Forecasting Leverage 2 Stock outs 1 Stock price 1 Bloated inventories 2 Bond rating 1 Overall Actual vs. Potential Demand 3 Total (Max 9) 4 Total (Max 9) 6 Sound Fiscal Policies Competitive Advantage Emergency loans 3 Cost leadership 2 Leverage 2 Product breadth 2 Current Ratio 1 Market share 1 Inventory reserves 1 Overall Awareness 1 Plant purchases funded 3 Overall Accessibility 0 Accounts Receivable 2 Overall Design 1 Accounts Payable 2 Asset Base 3 Total (Max 21) 14 Total (Max 21) 10 PRODUCT RUBRIC Able Acre Adam Aft Agape Ahead Aim NA Overall Primary Segment Trad Low High Pfmn Size Positioning 1 3 0 1 1 0 0 0 1 Age 0 0 0 1 2 0 0 0 1 Reliability 1 0 1 2 2 0 0 0 1 Price Percentile 0 2 0 0 0 0 0 0 0 Awareness 1 1 1 0 0 0 0 0 1 Accessibility 0 0 0 0 0 0 0 0 0 CustomerSurveyScore 0 1 0 0 0 0 0 0 0 PotentialShare/Avg 0 1 0 1 0 0 0 0 0 ActualShare/Potential 3 3 3 3 3 0 0 0 3 PlantUtilization 0 0 0 0 1 0 0 0 0 Automation 1 0 2 0 0 0 0 0 1 Contribution Margin 0 2 3 1 2 0 0 0 2 Days of Inventory 0 3 0 0 0 0 0 0 1 Promotion Budget 2 3 2 1 1 0 0 0 2 Sales Budget 2 2 1 1 1 0 0 0 1 R&D Utilization 0 0 2 0 2 0 0 0 1 Total (Max 48) 11 21 15 11 15 0 0 0 3 KEY Excellent 3 Satisfactory 2 Poor 1 Trouble 0
Transcript of Company Overall Rubric for: C45449: Andrews: 2014: Round...

Company Overall Rubric for: C45449: Andrews: 2014: Round 3
COMPANY RUBRIC Points (0..3)Margins & Profitability Asset Utilization ROS (Profits/Sales) 0 Asset turnover (Sales/Assets) 0 EPS (Earnings Per Share) 0 Sales to Current Assets 0 Contribution Margin 2 Overall plant utilization 3 Change in Stock Price 0 Total (Max 9) 3 Total (Max 12) 2
Ability to raise growth capital Forecasting Leverage 2 Stock outs 1 Stock price 1 Bloated inventories 2 Bond rating 1 Overall Actual vs. Potential Demand 3 Total (Max 9) 4 Total (Max 9) 6
Sound Fiscal Policies Competitive Advantage Emergency loans 3 Cost leadership 2 Leverage 2 Product breadth 2 Current Ratio 1 Market share 1 Inventory reserves 1 Overall Awareness 1 Plant purchases funded 3 Overall Accessibility 0 Accounts Receivable 2 Overall Design 1 Accounts Payable 2 Asset Base 3 Total (Max 21) 14 Total (Max 21) 10
PRODUCT RUBRIC Able Acre Adam Aft Agape Ahead Aim NA OverallPrimary Segment Trad Low High Pfmn SizePositioning 1 3 0 1 1 0 0 0 1Age 0 0 0 1 2 0 0 0 1Reliability 1 0 1 2 2 0 0 0 1Price Percentile 0 2 0 0 0 0 0 0 0Awareness 1 1 1 0 0 0 0 0 1Accessibility 0 0 0 0 0 0 0 0 0CustomerSurveyScore 0 1 0 0 0 0 0 0 0PotentialShare/Avg 0 1 0 1 0 0 0 0 0ActualShare/Potential 3 3 3 3 3 0 0 0 3PlantUtilization 0 0 0 0 1 0 0 0 0Automation 1 0 2 0 0 0 0 0 1Contribution Margin 0 2 3 1 2 0 0 0 2Days of Inventory 0 3 0 0 0 0 0 0 1Promotion Budget 2 3 2 1 1 0 0 0 2Sales Budget 2 2 1 1 1 0 0 0 1R&D Utilization 0 0 2 0 2 0 0 0 1Total (Max 48) 11 21 15 11 15 0 0 0 3
KEYExcellent 3Satisfactory 2Poor 1Trouble 0

Company Rubric Detail for: C45449: Andrews: 2014: Round 3
(Page Courier Excellent Satisfactory Poor Trouble Value PtsNum) Available Point(s) 3 2 1 0(1) ROS >8% 4%..8% 0%..4% <0% -6.2% 0(1) Turnover >1.3 1.0..1.3 0.8..1.0 < 0.8 0.62 0(1) Leverage 1.8..2.5 1.6..1.8,2.5..2.8 1.4..1.6,2.8..3.2 <1.4,>3.2 2.58 2(1) Emergency Loan $0 $0..$1M $1M..$8M >$8M $0 3(1) Contrib. Margin >35% 27%..35% 22%..27% <22% 32.8% 2
(1) Market Sharetimes ave. share >1.5 0.9..1.5 0.6..0.9 <0.6 0.61 1
(2) Stock PriceR = Round: 1..8 >$40 + 5*R >$25 + 5*R >$10 + 5*R <$10 + 5*R $26.97 1
(2) Stock PriceChange >$20 >$7 >-$5 <-$5 -$18.65 0
(2) EPSR = Round: [1..8] >$2 + R >(2 + R) / 3 $0..(2 + R) / 3 < $0 -$2.72 0
(2) Bond Rating AAA,AA,A BBB,BB,B CCC,CC,C DDD CC 1
(3) Inv. FluctuationReserves (days) 75..105 55..75, or
105..13530..55, or135..160 <30 or >160 145 1
(3)Plant
Improvement$ Investment
$12M..$24M $6..12M or$12M..$24M
$0..$6M or$31..$36M <$0M or >$36M -$41,267K 0
(3) Plant purchasesfunded
Fully funded>0
Within $4M>-$4M
Within $8M>-$8M <=-$8M $0 3
(3) Sales toCurrent Assets Ratio: 3.5..4.5 Ratio 3.0..3.5 or
4.5..5.0Ratio 2.5..3.0 or
5.0..5.5Ratio <2.5 or
>5.5 2.44 0
(3)
Current Ratio(Curr. Assets
overCurr. Liab)
Ratio 1.8..2.2 Ratio 1.6..1.8 or2.2..2.4
1.3..1.6 or2.4..2.7 <1.3 or >2.7 1.32 1
(3) Total Assets >($84M + 20*R) >($84M + 16*R) >($84M + 12*R) <($84M + 12*R) $140,150K 3
(4)
OverallPlant Utilization
(Total Prod/TotalCap)
>1.7 >1.3 >0.9 <0.9 0.65 0
(4) AutomationSpread < 2.0 < 3.0 < 4.0 > 4 3.3 1
(4) Product count >7 products >=4 products <4 products <4 products 5 2(4) Stock outs None 1 stockout 2 stockouts 3 or more 2 1
(4) Big Inventories>4 Mnths Sales No Products <=2 products <=4 products 5+ products 2 2
--- AR credit terms 45-60 days 30-45 or60-75 days
20-30 or75-90 days
<20 or>90 days 30 2
--- AP credit terms 0-15 days 15-30 days 30-45 days >45 days 22 2
(10)Overall Actual
vsPotential Demand
Met Demand Met 98% ofpotential demand
Met 96% ofpotential demand
<96% of potentialdemand 129.00% 3
--- Average UnitCost <$18-R/4 <$20-R/4 <$22-R/4 >$22-R/4 $17.53 2
Total (Max 75) 33

Product Rubric Detail for: C45449: Andrews: 2014: Round 3
(Points) Excellent (3) Satisfactory (2) Poor (2) Trouble (0)1 Positioning < 0.5 < 1.0 < 1.5 > 1.52 Age < 0.5 < 1.0 < 1.5 > 1.53 Reliability < 1000 < 2500 < 4000 < 40004 Price Percentile < 50% < 75% < 90% > 90% of the range5 Awareness > 90% > 75% > 50% <= 50%6 Accessibility > 75% > 60% > 50% <= 50%
7 CustomerSurvey Score > 45 > 30 > 15 <15
8 PotentialShare (Avg)
> 1.5 *Average Share > Average Share > 0.5 *
Average Share< 0.5 *
Average Share
9 ActualShare / Potential > 0.999 > 0.949 > 0.899 Unit Sales <=
0.89910 Plant Utilization >=150% >=100% >=90% <90%
11 Automation by Seg(T, L, H, P, S) >= (8,9,6,7,7) >= (6,7,5,6,6) >= (5,6,4,5,5) < (5,6,4,5,5)
12 Contribution Margin >=36% >=30% >=25% <25%13 Days of Inventory 1..45 days 45..90 days 90..120 days >120 days or stock out14 Promotion Budget $1.4M..2.0M 1.0M..1.4M, 2.0M..2.5M 0.7M..1.0M, 2.5M..3M <0.7M or >3.0M15 Sales Budget $2.2M..3.0M 1.5M..2.2M 0.7M..1.5M <0.7M or >3.0M
16 R&D UtilizationProject ends in December in November in October before October
Able Acre Adam Aft Agape Ahead Aim NA OverallVal Pts Val Pts Val Pts Val Pts Val Pts Val Pts Val Pts Val Pts Val Pts
1 Positioning 1.43 1 0.22 3 3.68 0 1.99 1 1.53 1 0.00 0 0.00 0 0.00 0 1.8 12 Age 4.2 0 5.2 0 3.4 0 2.2 1 2.1 2 0.0 0 0.0 0 0.0 0 3.4 13 Reliability 16000 1 13000 0 21500 1 25000 2 18700 2 0 0 0 0 0 0 18,840 14 Price Percentile 95% 0 70% 2 95% 0 95% 0 95% 0 0% 0 0% 0 0% 0 90% 05 Awareness 71% 1 72% 1 63% 1 45% 0 45% 0 0% 0 0% 0 0% 0 59% 16 Accessibility 44% 0 35% 0 33% 0 22% 0 25% 0 0% 0 0% 0 0% 0 32% 0
7 CustomerSurvey Score 4 0 18 1 2 0 11 0 13 0 0 0 0 0 0 0 10 0
8 PotentialShare (Avg) 16% 0 70% 1 26% 0 74% 1 32% 0 0% 0 0% 0 0% 0 44% 0
9 ActualShare / Potential 107% 3 110% 3 290% 3 106% 3 220% 3 0% 0 0% 0 0% 0 167% 3
10 Plant Utilization 39% 0 81% 0 55% 0 74% 0 99% 1 0% 0 0% 0 0% 0 70% 011 Automation 5.8 1 5.9 0 5.8 2 3.0 0 3.0 0 2.6 0 2.6 0 0.0 0 5.7 1
12 ContributionMargin 15.0% 0 35.1% 2 41.3% 3 28.4% 1 30.4% 2 0.0% 0 0.0% 0 0.0% 0 30.0% 2
13 Days ofInventory 918 0 22 3 0 0 0 0 186 0 0 0 0 0 0 0 225 1
14 Promo Budget $1,300 2 $1,500 3 $1,200 2 $900 1 $900 1 $0 0 $0 0 $0 0 $1,160 215 Sales Budget $1,500 2 $1,500 2 $1,000 1 $900 1 $900 1 $0 0 $0 0 $0 0 $1,160 116 R&D Utilization Aug 0 Apr 0 Nov 2 Jun 0 Nov 2 --- 0 --- 0 --- 0 Aug 1
Total (Max 48) --- 11 --- 21 --- 15 --- 11 --- 15 --- 0 --- 0 --- 0 --- 15
Company Overall Rubric for: C45449: Baldwin: 2014: Round 3
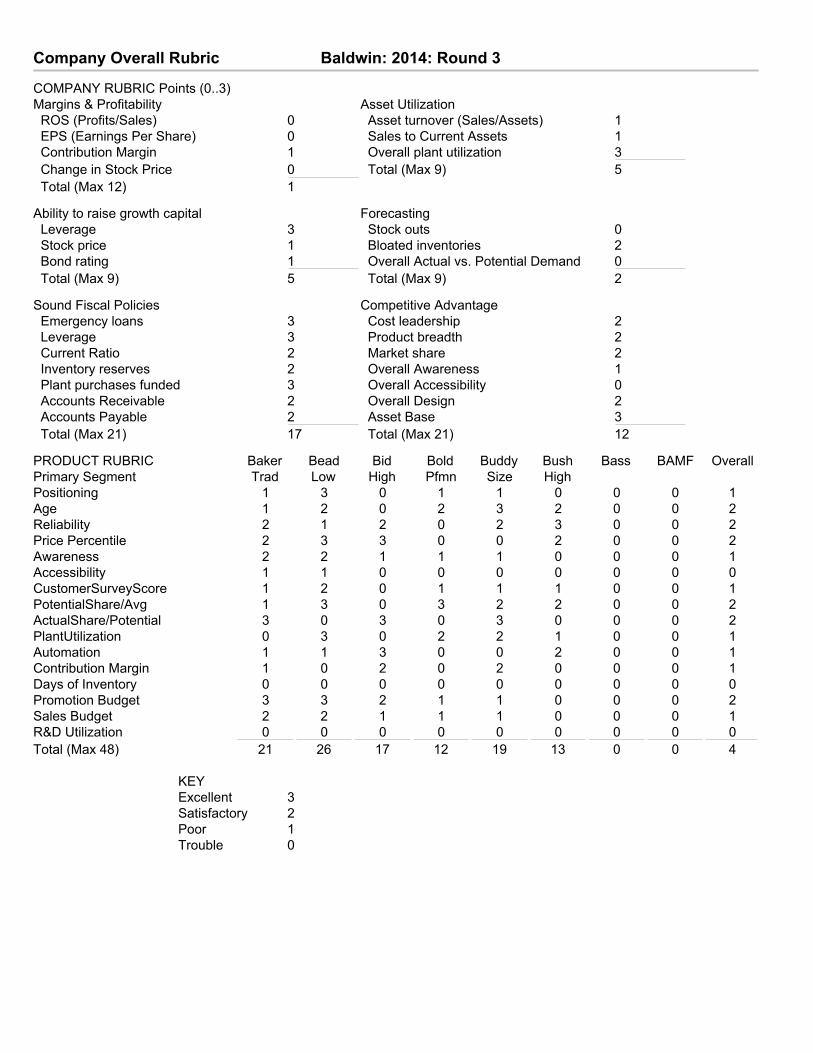
COMPANY RUBRIC Points (0..3)Margins & Profitability Asset Utilization ROS (Profits/Sales) 0 Asset turnover (Sales/Assets) 1 EPS (Earnings Per Share) 0 Sales to Current Assets 1 Contribution Margin 1 Overall plant utilization 3 Change in Stock Price 0 Total (Max 9) 5 Total (Max 12) 1
Ability to raise growth capital Forecasting Leverage 3 Stock outs 0 Stock price 1 Bloated inventories 2 Bond rating 1 Overall Actual vs. Potential Demand 0 Total (Max 9) 5 Total (Max 9) 2
Sound Fiscal Policies Competitive Advantage Emergency loans 3 Cost leadership 2 Leverage 3 Product breadth 2 Current Ratio 2 Market share 2 Inventory reserves 2 Overall Awareness 1 Plant purchases funded 3 Overall Accessibility 0 Accounts Receivable 2 Overall Design 2 Accounts Payable 2 Asset Base 3 Total (Max 21) 17 Total (Max 21) 12
PRODUCT RUBRIC Baker Bead Bid Bold Buddy Bush Bass BAMF OverallPrimary Segment Trad Low High Pfmn Size HighPositioning 1 3 0 1 1 0 0 0 1Age 1 2 0 2 3 2 0 0 2Reliability 2 1 2 0 2 3 0 0 2Price Percentile 2 3 3 0 0 2 0 0 2Awareness 2 2 1 1 1 0 0 0 1Accessibility 1 1 0 0 0 0 0 0 0CustomerSurveyScore 1 2 0 1 1 1 0 0 1PotentialShare/Avg 1 3 0 3 2 2 0 0 2ActualShare/Potential 3 0 3 0 3 0 0 0 2PlantUtilization 0 3 0 2 2 1 0 0 1Automation 1 1 3 0 0 2 0 0 1Contribution Margin 1 0 2 0 2 0 0 0 1Days of Inventory 0 0 0 0 0 0 0 0 0Promotion Budget 3 3 2 1 1 0 0 0 2Sales Budget 2 2 1 1 1 0 0 0 1R&D Utilization 0 0 0 0 0 0 0 0 0Total (Max 48) 21 26 17 12 19 13 0 0 4
KEYExcellent 3Satisfactory 2Poor 1Trouble 0
Company Rubric Detail for: C45449: Baldwin: 2014: Round 3
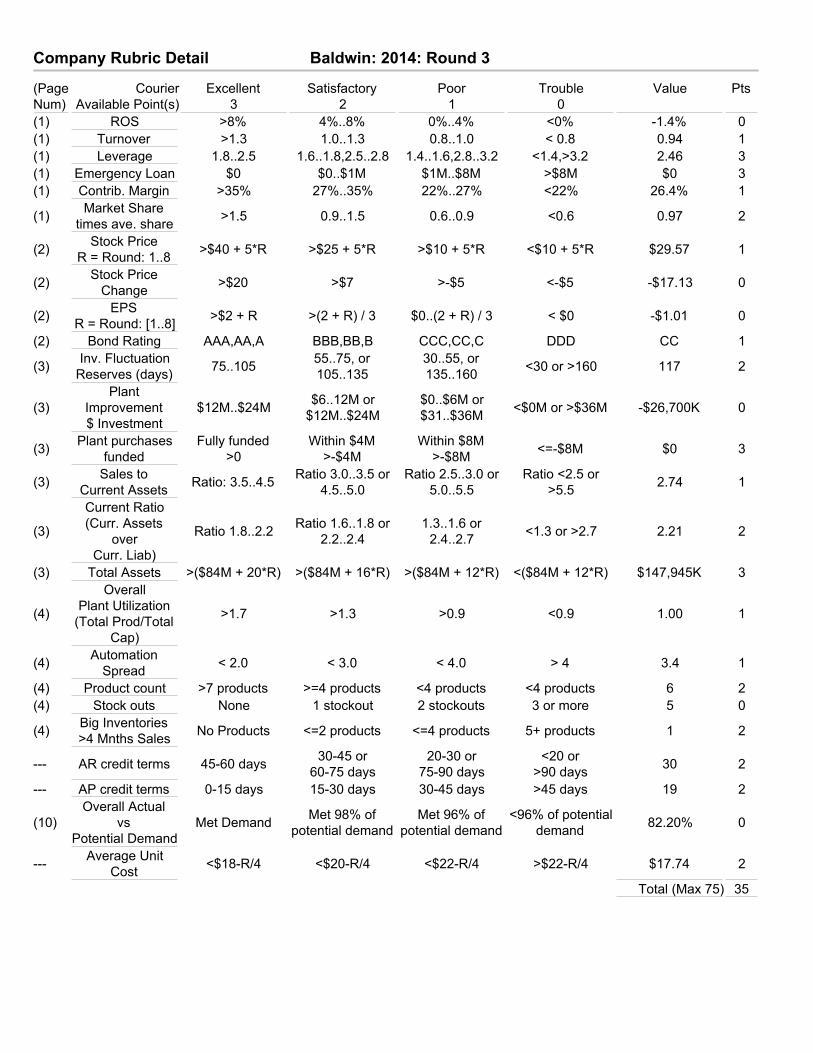
(Page Courier Excellent Satisfactory Poor Trouble Value PtsNum) Available Point(s) 3 2 1 0(1) ROS >8% 4%..8% 0%..4% <0% -1.4% 0(1) Turnover >1.3 1.0..1.3 0.8..1.0 < 0.8 0.94 1(1) Leverage 1.8..2.5 1.6..1.8,2.5..2.8 1.4..1.6,2.8..3.2 <1.4,>3.2 2.46 3(1) Emergency Loan $0 $0..$1M $1M..$8M >$8M $0 3(1) Contrib. Margin >35% 27%..35% 22%..27% <22% 26.4% 1
(1) Market Sharetimes ave. share >1.5 0.9..1.5 0.6..0.9 <0.6 0.97 2
(2) Stock PriceR = Round: 1..8 >$40 + 5*R >$25 + 5*R >$10 + 5*R <$10 + 5*R $29.57 1
(2) Stock PriceChange >$20 >$7 >-$5 <-$5 -$17.13 0
(2) EPSR = Round: [1..8] >$2 + R >(2 + R) / 3 $0..(2 + R) / 3 < $0 -$1.01 0
(2) Bond Rating AAA,AA,A BBB,BB,B CCC,CC,C DDD CC 1
(3) Inv. FluctuationReserves (days) 75..105 55..75, or
105..13530..55, or135..160 <30 or >160 117 2
(3)Plant
Improvement$ Investment
$12M..$24M $6..12M or$12M..$24M
$0..$6M or$31..$36M <$0M or >$36M -$26,700K 0
(3) Plant purchasesfunded
Fully funded>0
Within $4M>-$4M
Within $8M>-$8M <=-$8M $0 3
(3) Sales toCurrent Assets Ratio: 3.5..4.5 Ratio 3.0..3.5 or
4.5..5.0Ratio 2.5..3.0 or
5.0..5.5Ratio <2.5 or
>5.5 2.74 1
(3)
Current Ratio(Curr. Assets
overCurr. Liab)
Ratio 1.8..2.2 Ratio 1.6..1.8 or2.2..2.4
1.3..1.6 or2.4..2.7 <1.3 or >2.7 2.21 2
(3) Total Assets >($84M + 20*R) >($84M + 16*R) >($84M + 12*R) <($84M + 12*R) $147,945K 3
(4)
OverallPlant Utilization
(Total Prod/TotalCap)
>1.7 >1.3 >0.9 <0.9 1.00 1
(4) AutomationSpread < 2.0 < 3.0 < 4.0 > 4 3.4 1
(4) Product count >7 products >=4 products <4 products <4 products 6 2(4) Stock outs None 1 stockout 2 stockouts 3 or more 5 0
(4) Big Inventories>4 Mnths Sales No Products <=2 products <=4 products 5+ products 1 2
--- AR credit terms 45-60 days 30-45 or60-75 days
20-30 or75-90 days
<20 or>90 days 30 2
--- AP credit terms 0-15 days 15-30 days 30-45 days >45 days 19 2
(10)Overall Actual
vsPotential Demand
Met Demand Met 98% ofpotential demand
Met 96% ofpotential demand
<96% of potentialdemand 82.20% 0
--- Average UnitCost <$18-R/4 <$20-R/4 <$22-R/4 >$22-R/4 $17.74 2
Total (Max 75) 35

Product Rubric Detail for: C45449: Baldwin: 2014: Round 3
(Points) Excellent (3) Satisfactory (2) Poor (2) Trouble (0)1 Positioning < 0.5 < 1.0 < 1.5 > 1.52 Age < 0.5 < 1.0 < 1.5 > 1.53 Reliability < 1000 < 2500 < 4000 < 40004 Price Percentile < 50% < 75% < 90% > 90% of the range5 Awareness > 90% > 75% > 50% <= 50%6 Accessibility > 75% > 60% > 50% <= 50%
7 CustomerSurvey Score > 45 > 30 > 15 <15
8 PotentialShare (Avg)
> 1.5 *Average Share > Average Share > 0.5 *
Average Share< 0.5 *
Average Share
9 ActualShare / Potential > 0.999 > 0.949 > 0.899 Unit Sales <=
0.89910 Plant Utilization >=150% >=100% >=90% <90%
11 Automation by Seg(T, L, H, P, S) >= (8,9,6,7,7) >= (6,7,5,6,6) >= (5,6,4,5,5) < (5,6,4,5,5)
12 Contribution Margin >=36% >=30% >=25% <25%13 Days of Inventory 1..45 days 45..90 days 90..120 days >120 days or stock out14 Promotion Budget $1.4M..2.0M 1.0M..1.4M, 2.0M..2.5M 0.7M..1.0M, 2.5M..3M <0.7M or >3.0M15 Sales Budget $2.2M..3.0M 1.5M..2.2M 0.7M..1.5M <0.7M or >3.0M
16 R&D UtilizationProject ends in December in November in October before October
Baker Bead Bid Bold Buddy Bush Bass BAMF OverallVal Pts Val Pts Val Pts Val Pts Val Pts Val Pts Val Pts Val Pts Val Pts
1 Positioning 1.98 1 0.28 3 4.67 0 1.22 1 1.35 1 2.26 0 0.00 0 0.00 0 2.0 12 Age 3.1 1 7.6 2 3.7 0 2.0 2 1.6 3 0.5 2 0.0 0 0.0 0 3.1 23 Reliability 17500 2 14000 1 23000 2 28000 0 19000 2 25000 3 0 0 0 0 21,083 24 Price Percentile 75% 2 45% 3 45% 3 95% 0 105% 0 65% 2 0% 0 0% 0 72% 25 Awareness 82% 2 80% 2 56% 1 50% 1 50% 1 32% 0 0% 0 0% 0 58% 16 Accessibility 52% 1 54% 1 37% 0 23% 0 24% 0 37% 0 0% 0 0% 0 38% 0
7 CustomerSurvey Score 15 1 38 2 3 0 25 1 16 1 21 1 0 0 0 0 20 1
8 PotentialShare (Avg) 58% 1 160% 3 31% 0 203% 3 102% 2 102% 2 0% 0 0% 0 109% 2
9 ActualShare / Potential 107% 3 85% 0 100% 3 67% 0 125% 3 15% 0 0% 0 0% 0 83% 2
10 Plant Utilization 49% 0 195% 3 25% 0 124% 2 116% 2 99% 1 0% 0 0% 0 101% 111 Automation 5.0 1 6.5 1 6.0 3 3.2 0 3.1 0 5.0 2 6.0 0 5.0 0 6.6 1
12 ContributionMargin 27.7% 1 24.4% 0 33.0% 2 21.5% 0 32.6% 2 23.2% 0 0.0% 0 0.0% 0 27.1% 1
13 Days ofInventory 172 0 0 0 0 0 0 0 0 0 0 0 0 0 0 0 29 0
14 Promo Budget $1,400 3 $1,400 3 $1,000 2 $900 1 $900 1 $500 0 $0 0 $0 0 $1,017 215 Sales Budget $1,600 2 $1,600 2 $1,000 1 $900 1 $900 1 $500 0 $0 0 $0 0 $1,083 116 R&D Utilization Apr 0 May 0 Mar 0 Jun 0 Jul 0 Jun 0 --- 0 --- 0 May 0
Total (Max 48) --- 21 --- 26 --- 17 --- 12 --- 19 --- 13 --- 0 --- 0 --- 19
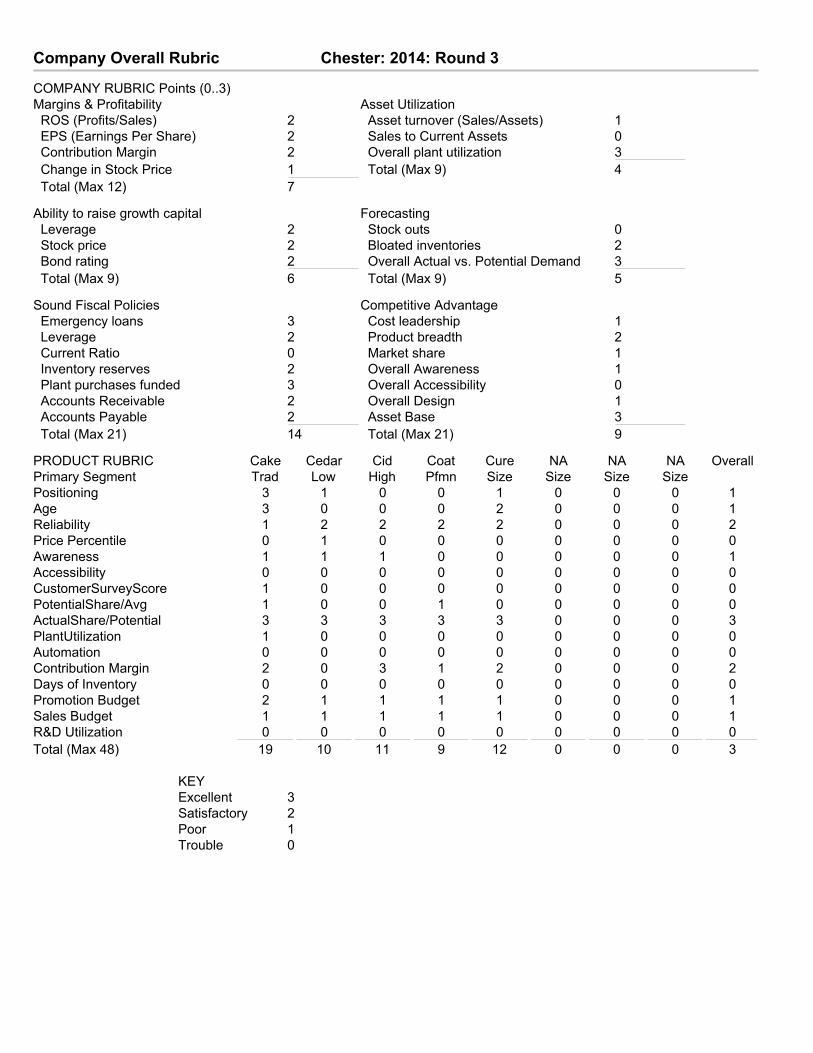
Company Overall Rubric for: C45449: Chester: 2014: Round 3
COMPANY RUBRIC Points (0..3)Margins & Profitability Asset Utilization ROS (Profits/Sales) 2 Asset turnover (Sales/Assets) 1 EPS (Earnings Per Share) 2 Sales to Current Assets 0 Contribution Margin 2 Overall plant utilization 3 Change in Stock Price 1 Total (Max 9) 4 Total (Max 12) 7
Ability to raise growth capital Forecasting Leverage 2 Stock outs 0 Stock price 2 Bloated inventories 2 Bond rating 2 Overall Actual vs. Potential Demand 3 Total (Max 9) 6 Total (Max 9) 5
Sound Fiscal Policies Competitive Advantage Emergency loans 3 Cost leadership 1 Leverage 2 Product breadth 2 Current Ratio 0 Market share 1 Inventory reserves 2 Overall Awareness 1 Plant purchases funded 3 Overall Accessibility 0 Accounts Receivable 2 Overall Design 1 Accounts Payable 2 Asset Base 3 Total (Max 21) 14 Total (Max 21) 9
PRODUCT RUBRIC Cake Cedar Cid Coat Cure NA NA NA OverallPrimary Segment Trad Low High Pfmn Size Size Size SizePositioning 3 1 0 0 1 0 0 0 1Age 3 0 0 0 2 0 0 0 1Reliability 1 2 2 2 2 0 0 0 2Price Percentile 0 1 0 0 0 0 0 0 0Awareness 1 1 1 0 0 0 0 0 1Accessibility 0 0 0 0 0 0 0 0 0CustomerSurveyScore 1 0 0 0 0 0 0 0 0PotentialShare/Avg 1 0 0 1 0 0 0 0 0ActualShare/Potential 3 3 3 3 3 0 0 0 3PlantUtilization 1 0 0 0 0 0 0 0 0Automation 0 0 0 0 0 0 0 0 0Contribution Margin 2 0 3 1 2 0 0 0 2Days of Inventory 0 0 0 0 0 0 0 0 0Promotion Budget 2 1 1 1 1 0 0 0 1Sales Budget 1 1 1 1 1 0 0 0 1R&D Utilization 0 0 0 0 0 0 0 0 0Total (Max 48) 19 10 11 9 12 0 0 0 3
KEYExcellent 3Satisfactory 2Poor 1Trouble 0

Company Rubric Detail for: C45449: Chester: 2014: Round 3
(Page Courier Excellent Satisfactory Poor Trouble Value PtsNum) Available Point(s) 3 2 1 0(1) ROS >8% 4%..8% 0%..4% <0% 4.5% 2(1) Turnover >1.3 1.0..1.3 0.8..1.0 < 0.8 0.90 1(1) Leverage 1.8..2.5 1.6..1.8,2.5..2.8 1.4..1.6,2.8..3.2 <1.4,>3.2 1.69 2(1) Emergency Loan $0 $0..$1M $1M..$8M >$8M $0 3(1) Contrib. Margin >35% 27%..35% 22%..27% <22% 31.8% 2
(1) Market Sharetimes ave. share >1.5 0.9..1.5 0.6..0.9 <0.6 0.66 1
(2) Stock PriceR = Round: 1..8 >$40 + 5*R >$25 + 5*R >$10 + 5*R <$10 + 5*R $46.05 2
(2) Stock PriceChange >$20 >$7 >-$5 <-$5 $1.98 1
(2) EPSR = Round: [1..8] >$2 + R >(2 + R) / 3 $0..(2 + R) / 3 < $0 $2.12 2
(2) Bond Rating AAA,AA,A BBB,BB,B CCC,CC,C DDD BBB 2
(3) Inv. FluctuationReserves (days) 75..105 55..75, or
105..13530..55, or135..160 <30 or >160 111 2
(3)Plant
Improvement$ Investment
$12M..$24M $6..12M or$12M..$24M
$0..$6M or$31..$36M <$0M or >$36M -$4,500K 0
(3) Plant purchasesfunded
Fully funded>0
Within $4M>-$4M
Within $8M>-$8M <=-$8M $0 3
(3) Sales toCurrent Assets Ratio: 3.5..4.5 Ratio 3.0..3.5 or
4.5..5.0Ratio 2.5..3.0 or
5.0..5.5Ratio <2.5 or
>5.5 2.31 0
(3)
Current Ratio(Curr. Assets
overCurr. Liab)
Ratio 1.8..2.2 Ratio 1.6..1.8 or2.2..2.4
1.3..1.6 or2.4..2.7 <1.3 or >2.7 4.93 0
(3) Total Assets >($84M + 20*R) >($84M + 16*R) >($84M + 12*R) <($84M + 12*R) $105,936K 3
(4)
OverallPlant Utilization
(Total Prod/TotalCap)
>1.7 >1.3 >0.9 <0.9 0.77 0
(4) AutomationSpread < 2.0 < 3.0 < 4.0 > 4 1.9 3
(4) Product count >7 products >=4 products <4 products <4 products 5 2(4) Stock outs None 1 stockout 2 stockouts 3 or more 3 0
(4) Big Inventories>4 Mnths Sales No Products <=2 products <=4 products 5+ products 2 2
--- AR credit terms 45-60 days 30-45 or60-75 days
20-30 or75-90 days
<20 or>90 days 30 2
--- AP credit terms 0-15 days 15-30 days 30-45 days >45 days 22 2
(10)Overall Actual
vsPotential Demand
Met Demand Met 98% ofpotential demand
Met 96% ofpotential demand
<96% of potentialdemand 140.00% 3
--- Average UnitCost <$18-R/4 <$20-R/4 <$22-R/4 >$22-R/4 $19.28 1
Total (Max 75) 41
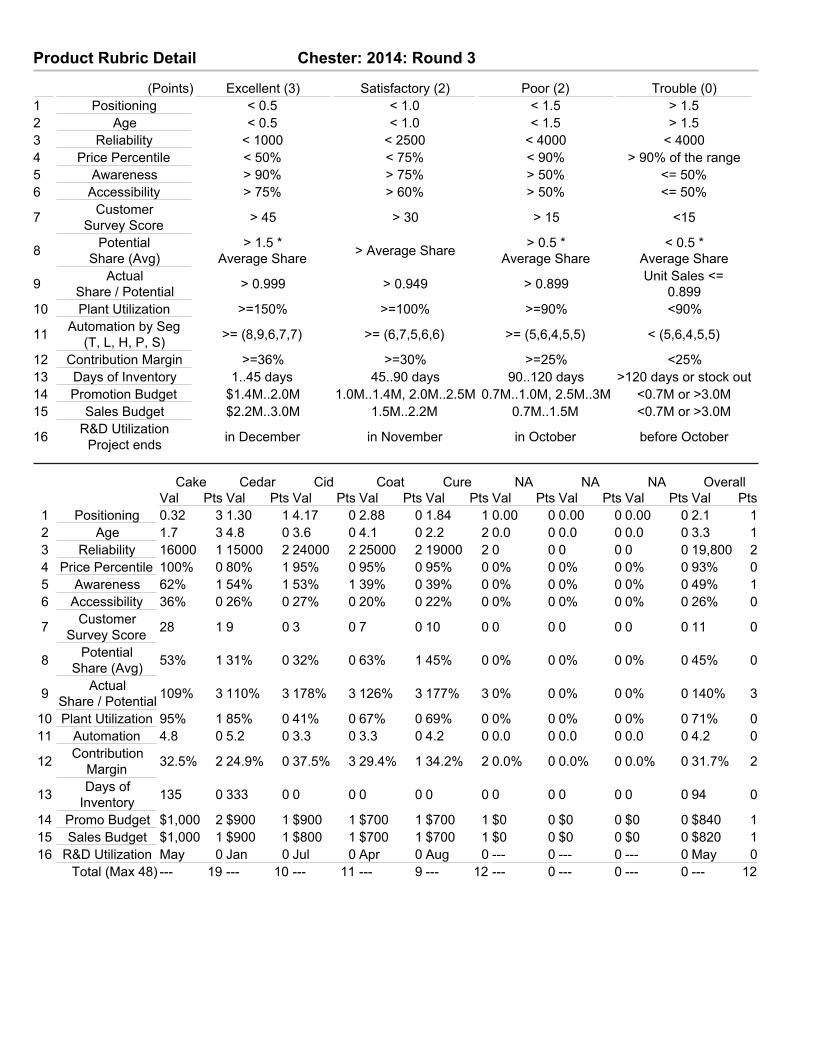
Product Rubric Detail for: C45449: Chester: 2014: Round 3
(Points) Excellent (3) Satisfactory (2) Poor (2) Trouble (0)1 Positioning < 0.5 < 1.0 < 1.5 > 1.52 Age < 0.5 < 1.0 < 1.5 > 1.53 Reliability < 1000 < 2500 < 4000 < 40004 Price Percentile < 50% < 75% < 90% > 90% of the range5 Awareness > 90% > 75% > 50% <= 50%6 Accessibility > 75% > 60% > 50% <= 50%
7 CustomerSurvey Score > 45 > 30 > 15 <15
8 PotentialShare (Avg)
> 1.5 *Average Share > Average Share > 0.5 *
Average Share< 0.5 *
Average Share
9 ActualShare / Potential > 0.999 > 0.949 > 0.899 Unit Sales <=
0.89910 Plant Utilization >=150% >=100% >=90% <90%
11 Automation by Seg(T, L, H, P, S) >= (8,9,6,7,7) >= (6,7,5,6,6) >= (5,6,4,5,5) < (5,6,4,5,5)
12 Contribution Margin >=36% >=30% >=25% <25%13 Days of Inventory 1..45 days 45..90 days 90..120 days >120 days or stock out14 Promotion Budget $1.4M..2.0M 1.0M..1.4M, 2.0M..2.5M 0.7M..1.0M, 2.5M..3M <0.7M or >3.0M15 Sales Budget $2.2M..3.0M 1.5M..2.2M 0.7M..1.5M <0.7M or >3.0M
16 R&D UtilizationProject ends in December in November in October before October
Cake Cedar Cid Coat Cure NA NA NA OverallVal Pts Val Pts Val Pts Val Pts Val Pts Val Pts Val Pts Val Pts Val Pts
1 Positioning 0.32 3 1.30 1 4.17 0 2.88 0 1.84 1 0.00 0 0.00 0 0.00 0 2.1 12 Age 1.7 3 4.8 0 3.6 0 4.1 0 2.2 2 0.0 0 0.0 0 0.0 0 3.3 13 Reliability 16000 1 15000 2 24000 2 25000 2 19000 2 0 0 0 0 0 0 19,800 24 Price Percentile 100% 0 80% 1 95% 0 95% 0 95% 0 0% 0 0% 0 0% 0 93% 05 Awareness 62% 1 54% 1 53% 1 39% 0 39% 0 0% 0 0% 0 0% 0 49% 16 Accessibility 36% 0 26% 0 27% 0 20% 0 22% 0 0% 0 0% 0 0% 0 26% 0
7 CustomerSurvey Score 28 1 9 0 3 0 7 0 10 0 0 0 0 0 0 0 11 0
8 PotentialShare (Avg) 53% 1 31% 0 32% 0 63% 1 45% 0 0% 0 0% 0 0% 0 45% 0
9 ActualShare / Potential 109% 3 110% 3 178% 3 126% 3 177% 3 0% 0 0% 0 0% 0 140% 3
10 Plant Utilization 95% 1 85% 0 41% 0 67% 0 69% 0 0% 0 0% 0 0% 0 71% 011 Automation 4.8 0 5.2 0 3.3 0 3.3 0 4.2 0 0.0 0 0.0 0 0.0 0 4.2 0
12 ContributionMargin 32.5% 2 24.9% 0 37.5% 3 29.4% 1 34.2% 2 0.0% 0 0.0% 0 0.0% 0 31.7% 2
13 Days ofInventory 135 0 333 0 0 0 0 0 0 0 0 0 0 0 0 0 94 0
14 Promo Budget $1,000 2 $900 1 $900 1 $700 1 $700 1 $0 0 $0 0 $0 0 $840 115 Sales Budget $1,000 1 $900 1 $800 1 $700 1 $700 1 $0 0 $0 0 $0 0 $820 116 R&D Utilization May 0 Jan 0 Jul 0 Apr 0 Aug 0 --- 0 --- 0 --- 0 May 0
Total (Max 48) --- 19 --- 10 --- 11 --- 9 --- 12 --- 0 --- 0 --- 0 --- 12

Company Overall Rubric for: C45449: Digby: 2014: Round 3
COMPANY RUBRIC Points (0..3)Margins & Profitability Asset Utilization ROS (Profits/Sales) 0 Asset turnover (Sales/Assets) 2 EPS (Earnings Per Share) 0 Sales to Current Assets 1 Contribution Margin 0 Overall plant utilization 3 Change in Stock Price 0 Total (Max 9) 6 Total (Max 12) 0
Ability to raise growth capital Forecasting Leverage 2 Stock outs 2 Stock price 1 Bloated inventories 2 Bond rating 1 Overall Actual vs. Potential Demand 3 Total (Max 9) 4 Total (Max 9) 7
Sound Fiscal Policies Competitive Advantage Emergency loans 3 Cost leadership 0 Leverage 2 Product breadth 2 Current Ratio 2 Market share 2 Inventory reserves 2 Overall Awareness 1 Plant purchases funded 3 Overall Accessibility 1 Accounts Receivable 2 Overall Design 2 Accounts Payable 2 Asset Base 3 Total (Max 21) 16 Total (Max 21) 11
PRODUCT RUBRIC Daze Dell Dixie Dot Dune DASHA DUMMY NA OverallPrimary Segment Trad Low High Pfmn Size Size Size SizePositioning 3 3 2 0 1 0 0 0 2Age 3 0 1 0 1 0 0 0 1Reliability 2 2 2 2 3 0 0 0 2Price Percentile 1 3 1 1 2 0 0 0 2Awareness 2 1 2 1 1 0 0 0 1Accessibility 1 1 1 0 0 0 0 0 1CustomerSurveyScore 2 1 2 0 0 0 0 0 1PotentialShare/Avg 1 1 3 2 3 0 0 0 2ActualShare/Potential 3 3 3 3 3 0 0 0 3PlantUtilization 2 3 3 3 3 0 0 0 3Automation 1 1 2 1 0 0 0 0 1Contribution Margin 0 0 1 0 0 0 0 0 0Days of Inventory 0 2 0 3 3 0 0 0 2Promotion Budget 3 3 3 2 2 0 0 0 3Sales Budget 3 3 3 2 1 0 0 0 2R&D Utilization 3 1 3 0 0 0 0 0 1Total (Max 48) 30 28 32 20 23 0 0 0 6
KEYExcellent 3Satisfactory 2Poor 1Trouble 0
Company Rubric Detail for: C45449: Digby: 2014: Round 3
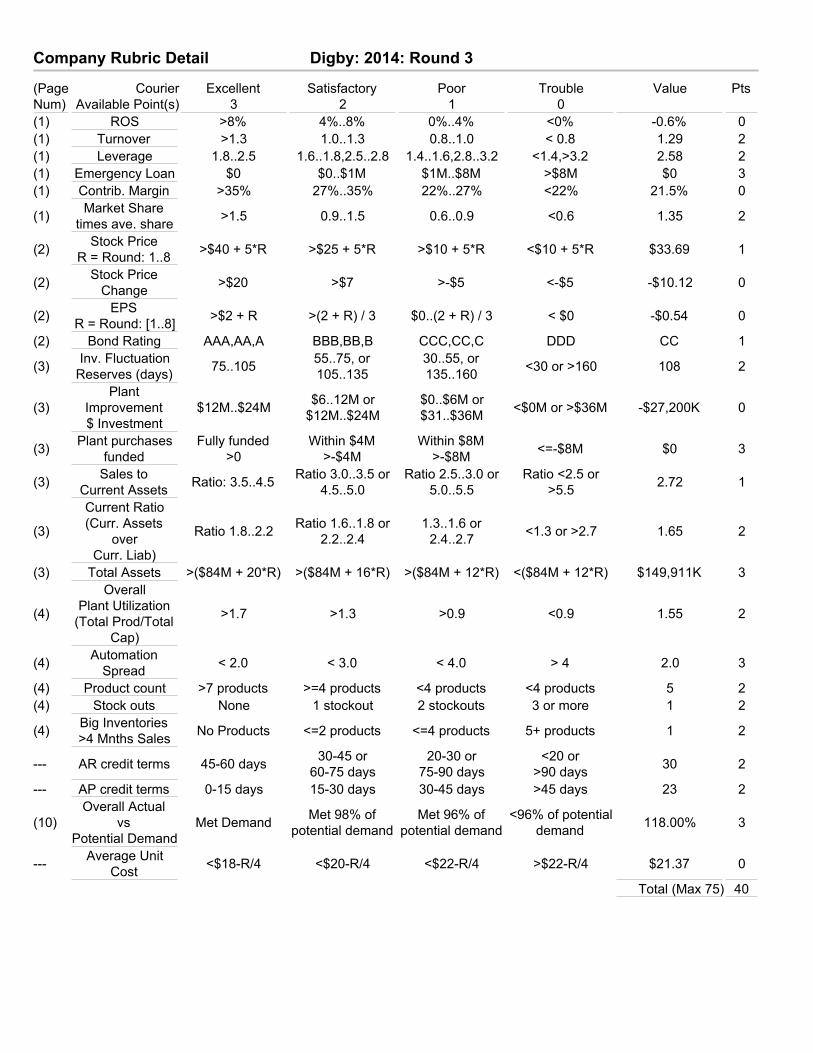
(Page Courier Excellent Satisfactory Poor Trouble Value PtsNum) Available Point(s) 3 2 1 0(1) ROS >8% 4%..8% 0%..4% <0% -0.6% 0(1) Turnover >1.3 1.0..1.3 0.8..1.0 < 0.8 1.29 2(1) Leverage 1.8..2.5 1.6..1.8,2.5..2.8 1.4..1.6,2.8..3.2 <1.4,>3.2 2.58 2(1) Emergency Loan $0 $0..$1M $1M..$8M >$8M $0 3(1) Contrib. Margin >35% 27%..35% 22%..27% <22% 21.5% 0
(1) Market Sharetimes ave. share >1.5 0.9..1.5 0.6..0.9 <0.6 1.35 2
(2) Stock PriceR = Round: 1..8 >$40 + 5*R >$25 + 5*R >$10 + 5*R <$10 + 5*R $33.69 1
(2) Stock PriceChange >$20 >$7 >-$5 <-$5 -$10.12 0
(2) EPSR = Round: [1..8] >$2 + R >(2 + R) / 3 $0..(2 + R) / 3 < $0 -$0.54 0
(2) Bond Rating AAA,AA,A BBB,BB,B CCC,CC,C DDD CC 1
(3) Inv. FluctuationReserves (days) 75..105 55..75, or
105..13530..55, or135..160 <30 or >160 108 2
(3)Plant
Improvement$ Investment
$12M..$24M $6..12M or$12M..$24M
$0..$6M or$31..$36M <$0M or >$36M -$27,200K 0
(3) Plant purchasesfunded
Fully funded>0
Within $4M>-$4M
Within $8M>-$8M <=-$8M $0 3
(3) Sales toCurrent Assets Ratio: 3.5..4.5 Ratio 3.0..3.5 or
4.5..5.0Ratio 2.5..3.0 or
5.0..5.5Ratio <2.5 or
>5.5 2.72 1
(3)
Current Ratio(Curr. Assets
overCurr. Liab)
Ratio 1.8..2.2 Ratio 1.6..1.8 or2.2..2.4
1.3..1.6 or2.4..2.7 <1.3 or >2.7 1.65 2
(3) Total Assets >($84M + 20*R) >($84M + 16*R) >($84M + 12*R) <($84M + 12*R) $149,911K 3
(4)
OverallPlant Utilization
(Total Prod/TotalCap)
>1.7 >1.3 >0.9 <0.9 1.55 2
(4) AutomationSpread < 2.0 < 3.0 < 4.0 > 4 2.0 3
(4) Product count >7 products >=4 products <4 products <4 products 5 2(4) Stock outs None 1 stockout 2 stockouts 3 or more 1 2
(4) Big Inventories>4 Mnths Sales No Products <=2 products <=4 products 5+ products 1 2
--- AR credit terms 45-60 days 30-45 or60-75 days
20-30 or75-90 days
<20 or>90 days 30 2
--- AP credit terms 0-15 days 15-30 days 30-45 days >45 days 23 2
(10)Overall Actual
vsPotential Demand
Met Demand Met 98% ofpotential demand
Met 96% ofpotential demand
<96% of potentialdemand 118.00% 3
--- Average UnitCost <$18-R/4 <$20-R/4 <$22-R/4 >$22-R/4 $21.37 0
Total (Max 75) 40

Product Rubric Detail for: C45449: Digby: 2014: Round 3
(Points) Excellent (3) Satisfactory (2) Poor (2) Trouble (0)1 Positioning < 0.5 < 1.0 < 1.5 > 1.52 Age < 0.5 < 1.0 < 1.5 > 1.53 Reliability < 1000 < 2500 < 4000 < 40004 Price Percentile < 50% < 75% < 90% > 90% of the range5 Awareness > 90% > 75% > 50% <= 50%6 Accessibility > 75% > 60% > 50% <= 50%
7 CustomerSurvey Score > 45 > 30 > 15 <15
8 PotentialShare (Avg)
> 1.5 *Average Share > Average Share > 0.5 *
Average Share< 0.5 *
Average Share
9 ActualShare / Potential > 0.999 > 0.949 > 0.899 Unit Sales <=
0.89910 Plant Utilization >=150% >=100% >=90% <90%
11 Automation by Seg(T, L, H, P, S) >= (8,9,6,7,7) >= (6,7,5,6,6) >= (5,6,4,5,5) < (5,6,4,5,5)
12 Contribution Margin >=36% >=30% >=25% <25%13 Days of Inventory 1..45 days 45..90 days 90..120 days >120 days or stock out14 Promotion Budget $1.4M..2.0M 1.0M..1.4M, 2.0M..2.5M 0.7M..1.0M, 2.5M..3M <0.7M or >3.0M15 Sales Budget $2.2M..3.0M 1.5M..2.2M 0.7M..1.5M <0.7M or >3.0M
16 R&D UtilizationProject ends in December in November in October before October
Daze Dell Dixie Dot Dune DASHA DUMMY NA OverallVal Pts Val Pts Val Pts Val Pts Val Pts Val Pts Val Pts Val Pts Val Pts
1 Positioning 0.41 3 0.32 3 0.85 2 2.44 0 1.78 1 0.00 0 0.00 0 0.00 0 1.2 22 Age 1.5 3 1.7 0 1.2 1 2.9 0 2.6 1 0.0 0 0.0 0 0.0 0 2.0 13 Reliability 17000 2 15000 2 23000 2 25000 2 21000 3 0 0 0 0 0 0 20,200 24 Price Percentile 85% 1 50% 3 80% 1 85% 1 75% 2 0% 0 0% 0 0% 0 75% 25 Awareness 79% 2 75% 1 77% 2 58% 1 62% 1 0% 0 0% 0 0% 0 70% 16 Accessibility 63% 1 64% 1 56% 1 31% 0 29% 0 0% 0 0% 0 0% 0 49% 1
7 CustomerSurvey Score 39 2 21 1 38 2 11 0 15 0 0 0 0 0 0 0 25 1
8 PotentialShare (Avg) 84% 1 91% 1 171% 3 116% 2 168% 3 0% 0 0% 0 0% 0 126% 2
9 ActualShare / Potential 108% 3 110% 3 133% 3 154% 3 105% 3 0% 0 0% 0 0% 0 122% 3
10 Plant Utilization 127% 2 177% 3 165% 3 165% 3 165% 3 0% 0 0% 0 0% 0 160% 311 Automation 5.0 1 6.0 1 5.0 2 5.0 1 4.0 0 0.0 0 0.0 0 0.0 0 5.0 1
12 ContributionMargin 22.0% 0 17.0% 0 26.7% 1 19.7% 0 19.4% 0 0.0% 0 0.0% 0 0.0% 0 21.0% 0
13 Days ofInventory 197 0 68 2 0 0 4 3 17 3 0 0 0 0 0 0 57 2
14 Promo Budget $1,500 3 $1,500 3 $1,500 3 $1,200 2 $1,300 2 $0 0 $0 0 $0 0 $1,400 315 Sales Budget $2,250 3 $2,400 3 $2,200 3 $1,500 2 $1,100 1 $0 0 $0 0 $0 0 $1,890 216 R&D Utilization Dec 3 Oct 1 Dec 3 Jan 0 Jan 0 --- 0 --- 0 --- 0 Jul 1
Total (Max 48) --- 30 --- 28 --- 32 --- 20 --- 23 --- 0 --- 0 --- 0 --- 27

Company Overall Rubric for: C45449: Ferris: 2014: Round 3
COMPANY RUBRIC Points (0..3)Margins & Profitability Asset Utilization ROS (Profits/Sales) 3 Asset turnover (Sales/Assets) 1 EPS (Earnings Per Share) 3 Sales to Current Assets 3 Contribution Margin 3 Overall plant utilization 3 Change in Stock Price 3 Total (Max 9) 7 Total (Max 12) 12
Ability to raise growth capital Forecasting Leverage 3 Stock outs 0 Stock price 3 Bloated inventories 2 Bond rating 1 Overall Actual vs. Potential Demand 0 Total (Max 9) 7 Total (Max 9) 2
Sound Fiscal Policies Competitive Advantage Emergency loans 3 Cost leadership 3 Leverage 3 Product breadth 3 Current Ratio 3 Market share 2 Inventory reserves 0 Overall Awareness 2 Plant purchases funded 3 Overall Accessibility 1 Accounts Receivable 2 Overall Design 1 Accounts Payable 2 Asset Base 3 Total (Max 21) 16 Total (Max 21) 15
PRODUCT RUBRIC Fast Feat Fist Foam Fume Fester Fool Fibb OverallPrimary Segment Trad Low Trad Pfmn Size High Trad TradPositioning 1 3 1 0 2 3 2 2 2Age 2 2 3 0 3 2 1 1 2Reliability 0 0 0 3 2 0 0 0 1Price Percentile 0 1 0 0 0 0 0 0 0Awareness 3 3 3 3 3 1 1 1 2Accessibility 2 1 2 0 0 1 2 2 1CustomerSurveyScore 1 1 2 1 2 2 0 0 1PotentialShare/Avg 1 2 1 2 3 3 0 0 2ActualShare/Potential 3 1 3 0 0 0 0 0 1PlantUtilization 2 3 2 2 3 3 3 3 3Automation 3 3 3 0 0 2 3 3 2Contribution Margin 3 3 3 0 1 3 3 3 2Days of Inventory 0 0 2 0 0 0 0 0 0Promotion Budget 3 3 3 3 3 3 3 3 3Sales Budget 2 3 2 0 2 3 0 0 2R&D Utilization 0 0 0 2 0 2 0 0 1Total (Max 48) 26 29 30 16 24 28 18 18 4
KEYExcellent 3Satisfactory 2Poor 1Trouble 0

Company Rubric Detail for: C45449: Ferris: 2014: Round 3
(Page Courier Excellent Satisfactory Poor Trouble Value PtsNum) Available Point(s) 3 2 1 0(1) ROS >8% 4%..8% 0%..4% <0% 9.7% 3(1) Turnover >1.3 1.0..1.3 0.8..1.0 < 0.8 0.99 1(1) Leverage 1.8..2.5 1.6..1.8,2.5..2.8 1.4..1.6,2.8..3.2 <1.4,>3.2 2.36 3(1) Emergency Loan $0 $0..$1M $1M..$8M >$8M $0 3(1) Contrib. Margin >35% 27%..35% 22%..27% <22% 45.8% 3
(1) Market Sharetimes ave. share >1.5 0.9..1.5 0.6..0.9 <0.6 1.37 2
(2) Stock PriceR = Round: 1..8 >$40 + 5*R >$25 + 5*R >$10 + 5*R <$10 + 5*R $80.82 3
(2) Stock PriceChange >$20 >$7 >-$5 <-$5 $26.87 3
(2) EPSR = Round: [1..8] >$2 + R >(2 + R) / 3 $0..(2 + R) / 3 < $0 $9.52 3
(2) Bond Rating AAA,AA,A BBB,BB,B CCC,CC,C DDD CC 1
(3) Inv. FluctuationReserves (days) 75..105 55..75, or
105..13530..55, or135..160 <30 or >160 29 0
(3)Plant
Improvement$ Investment
$12M..$24M $6..12M or$12M..$24M
$0..$6M or$31..$36M <$0M or >$36M -$45,620K 0
(3) Plant purchasesfunded
Fully funded>0
Within $4M>-$4M
Within $8M>-$8M <=-$8M $0 3
(3) Sales toCurrent Assets Ratio: 3.5..4.5 Ratio 3.0..3.5 or
4.5..5.0Ratio 2.5..3.0 or
5.0..5.5Ratio <2.5 or
>5.5 3.58 3
(3)
Current Ratio(Curr. Assets
overCurr. Liab)
Ratio 1.8..2.2 Ratio 1.6..1.8 or2.2..2.4
1.3..1.6 or2.4..2.7 <1.3 or >2.7 1.89 3
(3) Total Assets >($84M + 20*R) >($84M + 16*R) >($84M + 12*R) <($84M + 12*R) $197,113K 3
(4)
OverallPlant Utilization
(Total Prod/TotalCap)
>1.7 >1.3 >0.9 <0.9 1.54 2
(4) AutomationSpread < 2.0 < 3.0 < 4.0 > 4 7.0 0
(4) Product count >7 products >=4 products <4 products <4 products 8 3(4) Stock outs None 1 stockout 2 stockouts 3 or more 6 0
(4) Big Inventories>4 Mnths Sales No Products <=2 products <=4 products 5+ products 1 2
--- AR credit terms 45-60 days 30-45 or60-75 days
20-30 or75-90 days
<20 or>90 days 30 2
--- AP credit terms 0-15 days 15-30 days 30-45 days >45 days 20 2
(10)Overall Actual
vsPotential Demand
Met Demand Met 98% ofpotential demand
Met 96% ofpotential demand
<96% of potentialdemand 79.00% 0
--- Average UnitCost <$18-R/4 <$20-R/4 <$22-R/4 >$22-R/4 $15.56 3
Total (Max 75) 51
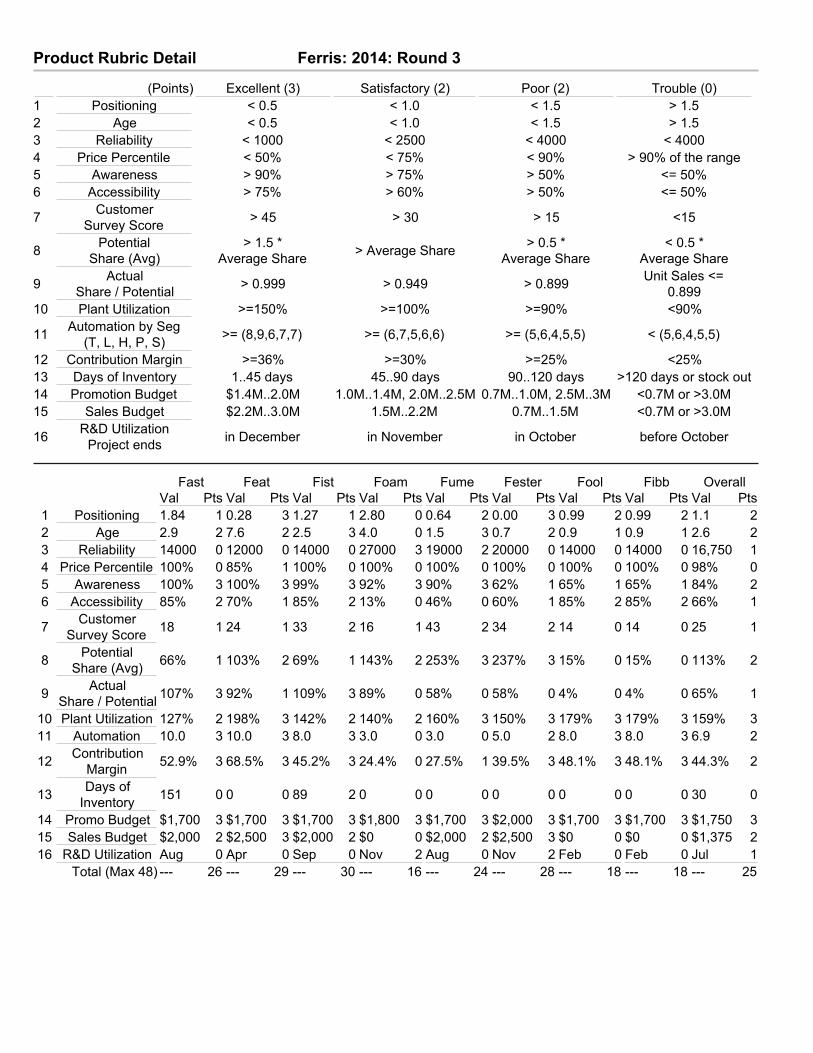
Product Rubric Detail for: C45449: Ferris: 2014: Round 3
(Points) Excellent (3) Satisfactory (2) Poor (2) Trouble (0)1 Positioning < 0.5 < 1.0 < 1.5 > 1.52 Age < 0.5 < 1.0 < 1.5 > 1.53 Reliability < 1000 < 2500 < 4000 < 40004 Price Percentile < 50% < 75% < 90% > 90% of the range5 Awareness > 90% > 75% > 50% <= 50%6 Accessibility > 75% > 60% > 50% <= 50%
7 CustomerSurvey Score > 45 > 30 > 15 <15
8 PotentialShare (Avg)
> 1.5 *Average Share > Average Share > 0.5 *
Average Share< 0.5 *
Average Share
9 ActualShare / Potential > 0.999 > 0.949 > 0.899 Unit Sales <=
0.89910 Plant Utilization >=150% >=100% >=90% <90%
11 Automation by Seg(T, L, H, P, S) >= (8,9,6,7,7) >= (6,7,5,6,6) >= (5,6,4,5,5) < (5,6,4,5,5)
12 Contribution Margin >=36% >=30% >=25% <25%13 Days of Inventory 1..45 days 45..90 days 90..120 days >120 days or stock out14 Promotion Budget $1.4M..2.0M 1.0M..1.4M, 2.0M..2.5M 0.7M..1.0M, 2.5M..3M <0.7M or >3.0M15 Sales Budget $2.2M..3.0M 1.5M..2.2M 0.7M..1.5M <0.7M or >3.0M
16 R&D UtilizationProject ends in December in November in October before October
Fast Feat Fist Foam Fume Fester Fool Fibb OverallVal Pts Val Pts Val Pts Val Pts Val Pts Val Pts Val Pts Val Pts Val Pts
1 Positioning 1.84 1 0.28 3 1.27 1 2.80 0 0.64 2 0.00 3 0.99 2 0.99 2 1.1 22 Age 2.9 2 7.6 2 2.5 3 4.0 0 1.5 3 0.7 2 0.9 1 0.9 1 2.6 23 Reliability 14000 0 12000 0 14000 0 27000 3 19000 2 20000 0 14000 0 14000 0 16,750 14 Price Percentile 100% 0 85% 1 100% 0 100% 0 100% 0 100% 0 100% 0 100% 0 98% 05 Awareness 100% 3 100% 3 99% 3 92% 3 90% 3 62% 1 65% 1 65% 1 84% 26 Accessibility 85% 2 70% 1 85% 2 13% 0 46% 0 60% 1 85% 2 85% 2 66% 1
7 CustomerSurvey Score 18 1 24 1 33 2 16 1 43 2 34 2 14 0 14 0 25 1
8 PotentialShare (Avg) 66% 1 103% 2 69% 1 143% 2 253% 3 237% 3 15% 0 15% 0 113% 2
9 ActualShare / Potential 107% 3 92% 1 109% 3 89% 0 58% 0 58% 0 4% 0 4% 0 65% 1
10 Plant Utilization 127% 2 198% 3 142% 2 140% 2 160% 3 150% 3 179% 3 179% 3 159% 311 Automation 10.0 3 10.0 3 8.0 3 3.0 0 3.0 0 5.0 2 8.0 3 8.0 3 6.9 2
12 ContributionMargin 52.9% 3 68.5% 3 45.2% 3 24.4% 0 27.5% 1 39.5% 3 48.1% 3 48.1% 3 44.3% 2
13 Days ofInventory 151 0 0 0 89 2 0 0 0 0 0 0 0 0 0 0 30 0
14 Promo Budget $1,700 3 $1,700 3 $1,700 3 $1,800 3 $1,700 3 $2,000 3 $1,700 3 $1,700 3 $1,750 315 Sales Budget $2,000 2 $2,500 3 $2,000 2 $0 0 $2,000 2 $2,500 3 $0 0 $0 0 $1,375 216 R&D Utilization Aug 0 Apr 0 Sep 0 Nov 2 Aug 0 Nov 2 Feb 0 Feb 0 Jul 1
Total (Max 48) --- 26 --- 29 --- 30 --- 16 --- 24 --- 28 --- 18 --- 18 --- 25


