
Company Reportimg3.gelonghui.com/pdf201511/pdf20151125105325157.… · · 2015-11-25Company...
9
Tuesday, November 24, 2015 Company Report China Merchants Securities (HK) Co. Ltd. Hong Kong Equity Research Please see penultimate page for additional important disclosures. China Merchants Securities (CMS) is a foreign broker-dealer unregistered in the USA. CMS research is prepared by research analysts who are not registered in the USA. CMS research is distributed in the USA pursuant to Rule 15a-6 of the Securities Exchange Act of 1934 solely by Rosenblatt Securities, an SEC registered and FINRA-member broker-dealer. 1 3SBio (1530 HK) One step at a time ■ Much anticipated acquisition is accretive to 3SBio’s earnings ■ Fast and stable bottom line growth supported by recent acquisition ■ Earnings and Target price lifted to reflect the recent development Long-speculated acquisition in CP Guojian unveiled The company announced a major acquisition of further equity interest in Shanghai CP Guojian, a biopharmaceutical powerhouse with special focus on mAb therapeutics in China. After the transaction, 3SBio increased its equity interest in CP Guojian from c.6.96% to 28.64%, and became a controlling shareholder with 53.6% voting rights to the company. The total consideration was RMB6.2bn, corresponding to c.24x FY15E P/E and c.21x FY16E P/E. The acquisition is accretive to 3SBio’s earnings. The acquisition brings about products and synergies Besides two products – Yisaipu and Xenopax, the company will also acquire a pipeline of monoclonal antibody product. 3SBio also shares manufacturing platform on the phase I monoclonal antibody anti-TNF alpha product. At the same time, 3SBio will also be able to integrate its existing oncology sales team with the CP Guojian’s rheumatology sales team; as well as strengthen its research and development capabilities for monoclonal antibody products through this integration. We expect the acquisition to favor 3SBio in the long-run. We expect fast and stable growth in FY15E-17E We maintain our 51%/40%/24% revenue growth in FY15E/16E/17E while gross margin to narrow amid the recent acquisition. We lift bottom-line growth to 53%/26% in FY16E/17E to reflect the recent acquisition. Our diluted EPS forecasts are 0.6%/5.2%/5.8% vs. the market consensus. Reiterate BUY with DCF-based TP raised to HK$12.00 3SBio is currently trading at 24x 2016E P/E compared with industry average of c.18x. Our target price of HK$12.00 suggests +20% upside potential to the current price which implies 28.8x 2016E P/E and 1.0x 16E PEG. Risks: price cut from the tendering; uncertainties from the M&As and competition from the peers. Financials RMB mn 2013A 2014A 2015E 2016E 2017E Revenue 875 1,131 1,706 2,394 2,957 Growth (%) 33.4% 29.2% 50.9% 40.3% 23.5% Net profit 96 292 554 850 1,073 Growth (%) -5.7% 204.2% 90.1% 53.4% 26.2% EPS (RMB) - 0.15 0.25 0.34 0.43 DPS (RMB) - 0.34 0.00 0.00 0.00 P/E (x) - 53.7 33.0 23.9 18.9 P/B (x) - n.m 3.4 3.3 2.8 ROE (%) 8.9% 30.9% 10.2% 13.7% 14.9% Source: Company data, CMS (HK) estimates Milo Liu (852) 3189 6711 Hayden Zhang (852) 3189 6754 [email protected] [email protected] WHAT’S NEW Earnings and TP upgraded BUY Previous BUY Price HK$10.02 12-month Target Price (Potential upside) HK$12.0 (+20%) Previous HK$11.1 Price Performance since IPO Source: Bigdata % 1m 6m 12m 1530 HK 10.6 5.2 5.2 HSI (1.0) (17.5) (2.5) Pharmaceutical & Healthcare Hang Seng Index 22,666 HSCEI 10,229 Key Data 52-week range (HK$) 6.9-10.68 Market cap (HK$ mn) 25,405 Avg. daily volume (mn) 6.89 BVPS (HK$) 2.99 Shareholdings Structure CS Sunshine Investment Ltd 28.32% Decade Sunshine Ltd 26.21% Mr. Tan Bo 4.59% Free float 32.9% Related Research 3SBio (1530 HK) - Satisfactory 1H15 results; promising LT prospects, Aug. 24, 2015 3SBio (1530 HK) - Biotech powerhouse in the emerging industry; Initiate with BUY, July 31. 2015 -30 -20 -10 0 10 20 Jun/15 Sep/15 (%) 1530 HSI Index
Transcript of Company Reportimg3.gelonghui.com/pdf201511/pdf20151125105325157.… · · 2015-11-25Company...

Tuesday, November 24, 2015
Company Report China Merchants Securities (HK) Co. Ltd.
Hong Kong Equity Research
Please see penultimate page for additional important disclosures. China Merchants Securities (CMS) is a foreign broker-dealer unregistered in the
USA. CMS research is prepared by research analysts who are not registered in the USA. CMS research is distributed in the USA pursuant to Rule
15a-6 of the Securities Exchange Act of 1934 solely by Rosenblatt Securities, an SEC registered and FINRA-member broker-dealer. 1
3SBio (1530 HK) One step at a time ■ Much anticipated acquisition is accretive to 3SBio’s earnings
■ Fast and stable bottom line growth supported by recent acquisition
■ Earnings and Target price lifted to reflect the recent development
Long-speculated acquisition in CP Guojian unveiled The company announced a major acquisition of further equity interest in Shanghai CP Guojian, a biopharmaceutical powerhouse with special focus on mAb therapeutics in China. After the transaction, 3SBio increased its equity interest in CP Guojian from c.6.96% to 28.64%, and became a controlling shareholder with 53.6% voting rights to the company. The total consideration was RMB6.2bn, corresponding to c.24x FY15E P/E and c.21x FY16E P/E. The acquisition is accretive to 3SBio’s earnings.
The acquisition brings about products and synergies Besides two products – Yisaipu and Xenopax, the company will also acquire a pipeline of monoclonal antibody product. 3SBio also shares manufacturing platform on the phase I monoclonal antibody anti-TNF alpha product. At the same time, 3SBio will also be able to integrate its existing oncology sales team with the CP Guojian’s rheumatology sales team; as well as strengthen its research and development capabilities for monoclonal antibody products through this integration. We expect the acquisition to favor 3SBio in the long-run.
We expect fast and stable growth in FY15E-17E We maintain our 51%/40%/24% revenue growth in FY15E/16E/17E while gross margin to narrow amid the recent acquisition. We lift bottom-line growth to 53%/26% in FY16E/17E to reflect the recent acquisition. Our diluted EPS forecasts are 0.6%/5.2%/5.8% vs. the market consensus.
Reiterate BUY with DCF-based TP raised to HK$12.00 3SBio is currently trading at 24x 2016E P/E compared with industry average of c.18x. Our target price of HK$12.00 suggests +20% upside potential to the current price which implies 28.8x 2016E P/E and 1.0x 16E PEG. Risks: price cut from the tendering; uncertainties from the M&As and competition from the peers.
Financials
RMB mn 2013A 2014A 2015E 2016E 2017E
Revenue 875 1,131 1,706 2,394 2,957
Growth (%) 33.4% 29.2% 50.9% 40.3% 23.5%
Net profit 96 292 554 850 1,073
Growth (%) -5.7% 204.2% 90.1% 53.4% 26.2%
EPS (RMB) - 0.15 0.25 0.34 0.43
DPS (RMB) - 0.34 0.00 0.00 0.00
P/E (x) - 53.7 33.0 23.9 18.9
P/B (x) - n.m 3.4 3.3 2.8
ROE (%) 8.9% 30.9% 10.2% 13.7% 14.9%
Source: Company data, CMS (HK) estimates
Milo Liu
(852) 3189 6711
Hayden Zhang
(852) 3189 6754
[email protected] [email protected]
WHAT’S NEW Earnings and TP upgraded
BUY
Previous
BUY
Price HK$10.02
12-month Target Price (Potential upside)
HK$12.0 (+20%)
Previous HK$11.1
Price Performance since IPO
Source: Bigdata
% 1m 6m 12m
1530 HK 10.6 5.2 5.2 HSI (1.0) (17.5) (2.5)
Pharmaceutical & Healthcare
Hang Seng Index 22,666
HSCEI 10,229
Key Data
52-week range (HK$) 6.9-10.68
Market cap (HK$ mn) 25,405
Avg. daily volume (mn) 6.89
BVPS (HK$) 2.99
Shareholdings Structure CS Sunshine Investment Ltd 28.32%
Decade Sunshine Ltd 26.21%
Mr. Tan Bo 4.59%
Free float 32.9%
Related Research
3SBio (1530 HK) - Satisfactory 1H15 results; promising LT prospects, Aug. 24, 2015 3SBio (1530 HK) - Biotech powerhouse in the emerging industry; Initiate with BUY, July 31. 2015
-30
-20
-10
0
10
20
Jun/15 Sep/15
(%) 1530 HSI Index

Tuesday, November 24, 2015
To access our research reports on the Bloomberg terminal, type CMHK <GO> 2
Focus charts
Figure 1: Total sales breakdown (RMB mn) Figure 2: Indicative revenue growth breakdown (RMB mn)
Source: Company, CMS (HK) Source: Company, CMS (HK)
Figure 3: CP Guojian's shareholders as of end-2014 Figure 4: CP Guojian's shareholders after the deal
Source: Company, CMS (HK) Source: Company, CMS (HK)
Figure 5: Margin trends Figure 6: CAPEX and forecasts (RMB mn)
Source: Company, CMS (HK) estimates Note: Gross margin narrowed in 1H15 was due to acquisition. Operating margin shrank mainly due to one-off listing expense. Net margin dipped in FY13 was due to privatization.
Source: Company, CMS (HK) estimates Note: The increase in CAPEX in FY15E/16E/17E will primarily be used for the maintenance of the existing facilities as well as continued expansion and upgrade plans, according to the company.
0
500
1,000
1,500
2,000
2,500
3,000
3,500
2012 2013 2014 2015E 2016E 2017E
Zhejiang
WanshengSirton
Sciprogen
Export sales
Others
Inleusin
Intefen
Iron Surcrose
TPIAO
EPIAO56.8%
EPIAO52.5%
TPIAO32.1%
TPIAO39.3%
Iron Sucrose (5.2%)
Iron Sucrose5.7%
Others (5.9%)
Others 2.4%
EPIAO(+46.6%)
TPIAO(+49.3%)
IV Iron Sucrose (+6.4%)
Others(-2.3%)
0
200
400
600
800
1,000
1,200
2012 EPIAO TPIAO Iron Sucrose Others 2014
CITIC, 43.4%
Lansheng Guojian, 41.7%
3SBio, 7.0%
Pudong Lingyu, 2.2%
Mianyang Fund, 1.9%
Jianweida, 1.8%
Jianyikang, 1.3%
Shanghai Lansheng, 0.7%
Other, 3.8%
CITIC, 43.4%
3SBio, 28.8%
Pudong Lingyu
24.9% Shanghai Lansheng
2.2%
Shanghai Lansheng
0.7%
89% 90% 92%90%
86% 86%
19%23%
30%
38% 38% 39%
15%11%
26%
32%36% 36%
0%
10%
20%
30%
40%
50%
60%
70%
80%
90%
100%
2012 2013 2014 2015E 2016E 2017E
Gross Margin Operating Margin Net Margin
48
39
20
100
120 125
7.3%
4.5%
1.8%
6.2% 6.0%
5.0%
0%
2%
4%
6%
8%
-
20
40
60
80
100
120
140
2012 2013 2014 2015E 2016E 2017E
CAPEX CAPEX as a % of sales

Tuesday, November 24, 2015
To access our research reports on the Bloomberg terminal, type CMHK <GO> 3
What we think about the transaction
The acquisition is in-line with our expectation. The deal is long-awaited after the company entered into a
strategic cooperation with CP Guojian in Dec 2014. We expect the transaction to further strengthen its leading
position in the biotech industry.
The acquisition brings two new products to the product portfolio. The two products are Yisaipu (also generally
known as etanercept) and Xenopax (also generally known as daclizumab). YiSaiPu is indicated for the treatment of
rheumatoid arthritis, plague psoriasis and ankylosing spondylitis and according to IMS data, had a dominant market
share of 61.0% by sales in 2013. Xenopax targets the treatment of acute cellular rejection after solid organ
transplantation. The company will also acquire a pipeline of monoclonal antibody product candidates for which new
drug applications have been filed.
Synergy effect down the road. CP Guojian will provide a manufacturing platform for the company’s phase I
monoclonal antibody anti-TNF alpha candidates for the treatment of rheumatoid arthritis. Such platform will also
enable 3SBio to develop, manufacture and market a wide range of medicines within its therapeutic areas. At the
same time, 3SBio will also be able to integrate its existing oncology sales team with the CP Guojian’s rheumatology
sales team; as well as strengthen its research and development capabilities for monoclonal antibody products
through this integration.
About CP Guojian
CP Guojian is the industry leader in R&D, manufacturing and marketing mAb therapeutics in China. The
company is currently marketing its two core products – YiSaiPu and Xenopax, together with other mAb pipeline
products with significant market potential in oncology and rheumatology, including: Ipterbin designed for the
treatment of HER2 over-expressing metastatic breast cancer, Jiantuoxi designed for the treatment of CD20-positive
B-cell non-Hodgkin’s lymphoma and Yilairui designed for the treatment of auto-immune diseases such as
rheumatoid arthritis.
3SBio entered into a strategic cooperation agreement with CP Guojian in Dec 2014. Under this agreement,
3SBio intended to share synergies in manufacturing, marketing, R&D and product registration; as well as taking
advantage on CP Guojian’s manufacturing capabilities for future mAb therapeutics to avoid high upfront investment.
In FY14, CP Guojian booked c.RMB780mn in revenue and c.RMB213mn in net profit. 3SBio was the 3rd
largest
shareholder with 7% shareholdings to the company before this transaction.
Figure 7: CP Guojian's shareholders as of end-2014 Figure 8: CP Guojian's shareholders after the deal
Source: Company, CMS (HK) Source: Company, CMS (HK)
CITIC, 43.4%
Lansheng Guojian, 41.7%
3SBio, 7.0%
Pudong Lingyu, 2.2%
Mianyang Fund, 1.9%
Jianweida, 1.8%
Jianyikang, 1.3%
Shanghai Lansheng, 0.7%
Other, 3.8%
CITIC, 43.4%
3SBio, 28.8%
Pudong Lingyu
24.9% Shanghai Lansheng
2.2%
Shanghai Lansheng
0.7%

Tuesday, November 24, 2015
To access our research reports on the Bloomberg terminal, type CMHK <GO> 4
Figure 9: Changes to our model
Source: Company, CMS (HK) estimates
2014
RMB '000 Actual Before After Delta % change Before After Delta % change Before After Delta % change
EPIAO 594,056 712,867 712,867 0 0% 819,797 819,797 0 0% 942,767 942,767 0 0%
TPIAO 444,676 600,313 600,313 0 0% 804,419 804,419 0 0% 1,069,877 1,069,877 0 0%
Others 92,122 408,626 408,626 0 0% 769,508 769,508 0 0% 944,351 944,351 0 0%
Total Revenue 1,130,854 1,721,806 1,721,806 0 0% 2,393,724 2,393,724 0 0% 2,956,995 2,956,995 0 0%
Cost of sales (87,481) (176,241) (176,241) 0 0% (324,011) (324,011) 0 0% (415,039) (415,039) 0 0%
Gross profit 1,043,373 1,545,564 1,545,564 0 0% 2,069,713 2,069,713 0 0% 2,541,956 2,541,956 0 0%
SG&A ex penses (602,202) (771,858) (771,858) 0 0% (985,041) (985,041) 0 0% (1,172,478) (1,172,478) 0 0%
Selling costs (431,432) (648,277) (648,277) 0 0% (877,324) (877,324) 0 0% (1,054,198) (1,054,198) 0 0%
General and Admin ex penses (ex . R&D) (170,770) (123,581) (123,581) 0 0% (107,718) (107,718) 0 0% (118,280) (118,280) 0 0%
Research and dev elopment (96,375) (120,526) (120,526) 0 0% (167,561) (167,561) 0 0% (206,990) (206,990) 0 0%
Operating income 344,796 653,180 653,180 0 0% 917,112 917,112 0 0% 1,162,489 1,162,489 0 0%
Other income (net) 45,953 37,192 37,192 0 0% 51,706 51,706 0 0% 63,873 63,873 0 0%
Other income and gains 47,763 34,436 34,436 0 0% 47,874 47,874 0 0% 59,140 59,140 0 0%
Other ex penses and losses (1,810) 2,756 2,756 0 0% 3,831 3,831 0 0% 4,733 4,733 0 0%
Finance costs (29,182) (29,182) (29,182) 0 0% 0 0 0 n.m 0 0 0 n.m
Share of losses of associates (1,383) 0 0 0 0% 0 0 0 n.m 0 0 0 n.m
EBITDA 422,856 736,659 736,659 0 0% 1,023,936 1,023,936 0 0% 1,293,363 1,293,363 0 0%
Profit Before Taxes 360,184 661,190 661,190 0 0% 968,817 968,817 0 0% 1,226,361 1,226,361 0 0%
Income Tax (68,456) (119,014) (119,014) 0 0% (174,387) (174,387) 0 0% (220,745) (220,745) 0 0%
Tax rate 19% 18% 18% 0 0% 18% 18% 0 0% 18% 18% 0 0%
Zhejiang Wansheng 0 12,294 12,294 0 0% 43,906 43,906 0 0% 52,688 52,688 0 0%
CP Guojian 0 0 0 0 0% 0 87,043 87,043 n.m 0 104,452 104,452 n.m
Net income 291,728 554,469 554,469 0 0% 763,278 850,322 87,043 11% 968,234 1,072,686 104,452 11%
Basic EPS 0.15 0.25 0.25 0 0% 0.31 0.34 0.03 10% 0.39 0.43 0.04 10%
Diluted Net Income 291,728 554,469 554,469 0 0% 763,278 850,322 87,043 11% 968,234 1,072,686 104,452 11%
Diluted EPS 0.15 0.25 0.25 0 0% 0.31 0.34 0 10% 0.39 0.43 0 10%
Basic Weighted Av erage Shares ('000) 1,939,519 2,262,910 2,262,910 0 0% 2,515,314 2,515,314 0 0% 2,515,314 2,515,314 0 0%
Diluted Weighted Av erage Shares ('000) 1,939,519 2,262,910 2,262,910 0 0% 2,515,314 2,515,314 0 0% 2,515,314 2,515,314 0 0%
2015E 2016E 2017E
Tuesday, November 24, 2015
To access our research reports on the Bloomberg terminal, type CMHK <GO> 5
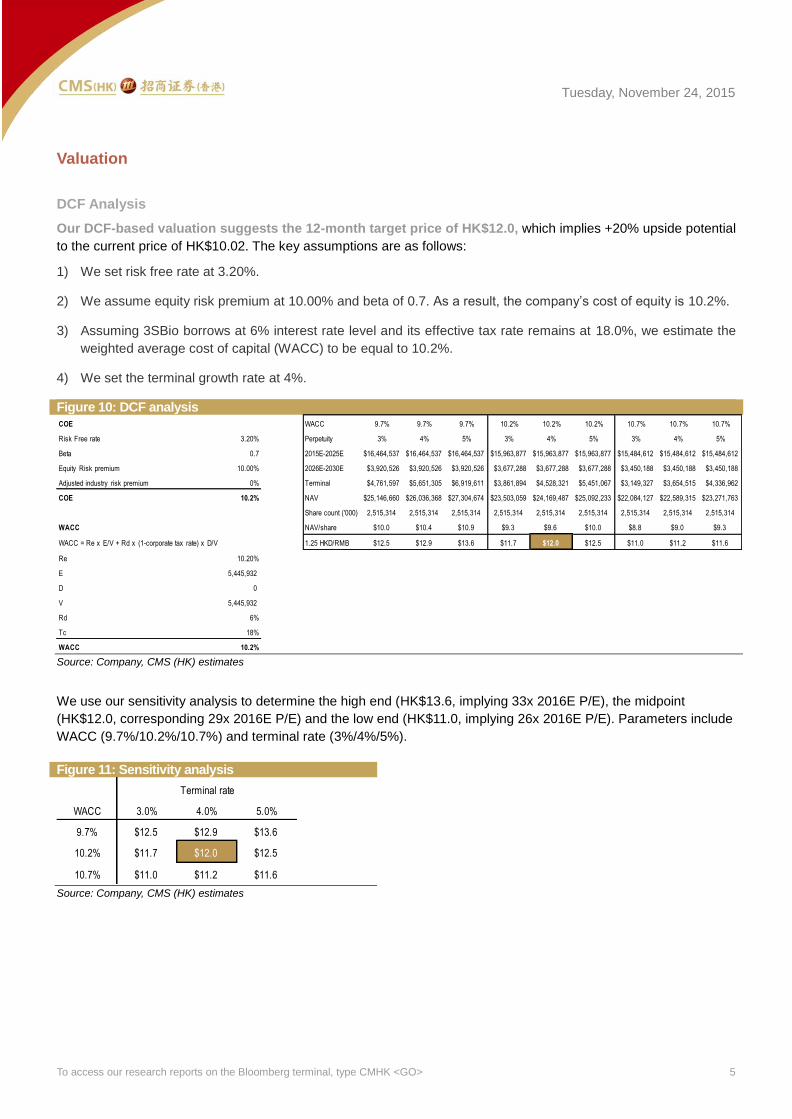
Valuation
DCF Analysis
Our DCF-based valuation suggests the 12-month target price of HK$12.0, which implies +20% upside potential
to the current price of HK$10.02. The key assumptions are as follows:
1) We set risk free rate at 3.20%.
2) We assume equity risk premium at 10.00% and beta of 0.7. As a result, the company’s cost of equity is 10.2%.
3) Assuming 3SBio borrows at 6% interest rate level and its effective tax rate remains at 18.0%, we estimate the
weighted average cost of capital (WACC) to be equal to 10.2%.
4) We set the terminal growth rate at 4%.
Figure 10: DCF analysis
Source: Company, CMS (HK) estimates
We use our sensitivity analysis to determine the high end (HK$13.6, implying 33x 2016E P/E), the midpoint
(HK$12.0, corresponding 29x 2016E P/E) and the low end (HK$11.0, implying 26x 2016E P/E). Parameters include
WACC (9.7%/10.2%/10.7%) and terminal rate (3%/4%/5%).
Figure 11: Sensitivity analysis
Source: Company, CMS (HK) estimates
COE WACC 9.7% 9.7% 9.7% 10.2% 10.2% 10.2% 10.7% 10.7% 10.7%
Risk Free rate 3.20% Perpetuity 3% 4% 5% 3% 4% 5% 3% 4% 5%
Beta 0.7 2015E-2025E $16,464,537 $16,464,537 $16,464,537 $15,963,877 $15,963,877 $15,963,877 $15,484,612 $15,484,612 $15,484,612
Equity Risk premium 10.00% 2026E-2030E $3,920,526 $3,920,526 $3,920,526 $3,677,288 $3,677,288 $3,677,288 $3,450,188 $3,450,188 $3,450,188
Adjusted industry risk premium 0% Terminal $4,761,597 $5,651,305 $6,919,611 $3,861,894 $4,528,321 $5,451,067 $3,149,327 $3,654,515 $4,336,962
COE 10.2% NAV $25,146,660 $26,036,368 $27,304,674 $23,503,059 $24,169,487 $25,092,233 $22,084,127 $22,589,315 $23,271,763
Share count ('000) 2,515,314 2,515,314 2,515,314 2,515,314 2,515,314 2,515,314 2,515,314 2,515,314 2,515,314
WACC NAV/share $10.0 $10.4 $10.9 $9.3 $9.6 $10.0 $8.8 $9.0 $9.3
WACC = Re x E/V + Rd x (1-corporate tax rate) x D/V 1.25 HKD/RMB $12.5 $12.9 $13.6 $11.7 $12.0 $12.5 $11.0 $11.2 $11.6
Re 10.20%
E 5,445,932
D 0
V 5,445,932
Rd 6%
Tc 18%
WACC 10.2%
WACC 3.0% 4.0% 5.0%
9.7% $12.5 $12.9 $13.6
10.2% $11.7 $12.0 $12.5
10.7% $11.0 $11.2 $11.6
Terminal rate

Tuesday, November 24, 2015
To access our research reports on the Bloomberg terminal, type CMHK <GO> 6
PE & PEG Analysis
We cross-checked our TP with P/E valuation which implied 28.8x 2016E P/E. We compare it with three sets of
comparables: 1) A-share leading biosimilar names, such as Hualan Bio (002007 CH) which is currently trading at
32x 2016E PE; 2) Hong Kong listed comparables, such as Fudan Zhangjiang (1349 HK), which is currently trading
at 32x; and 3) International biotech peers such as Baxter (BAX US) which is trading at 27x.
Our TP corresponds to 1.0x 2016E PEG valuation. Similar to the P/E method, we use the same sets of
comparables, which suggest that both A-share as well as H-share names are c.1.0x 2016E PEG while international
peers are currently trading at 2.1x. We believe the PEG valuation is more convincing, given the clear visibility of the
company’s promising long-term growth prospects.
Figure 12: Peers valuation comparison Name 中文名 Stock
Code Mkt Cap –––––––P/E––––––– –––––––P/B––––––– –––––PEG–––––– Gross Margin (%)
(HK$mn) 14A 15E 16E 14A 15E 16E 14A 15E 16E 14A 15E 16E
3SBio 三生制药 1530 HK 25,203 44.0 28.0 21.8 n.m 2.8 2.7 1.3 1.1 0.8 92.3 90.8 90.3
A-share peers
HUADONG MEDICI-A 华东医药 000963 CH 41,578 30.2 30.4 23.9 10.1 10.8 7.5 1.38 1.38 1.09 21.6 23.1 24.4
DONG E-E-JIAO-A 东阿阿胶 000423 CH 38,593 17.9 19.4 16.3 4.1 4.3 3.5 0.93 1.01 0.85 65.1 66.7 66.6
HUALAN BIOLOGI-A 华兰生物 002007 CH 30,453 35.9 38.2 31.9 5.7 6.4 5.5 1.69 1.80 1.51 61.6 63.1 63.2
BEIJING SL -A 双鹭药业 002038 CH 28,322 26.1 29.3 24.6 5.7 6.2 5.3 0.54 0.61 0.51 69.6 74.0 75.0
BEIJING TIAN-A 天坛生物 600161 CH 19,484 103.2 33.3 31.5 6.9 na na 6.01 1.94 1.83 57.4 na na
SHENZ NEPTUNUS-A 海王生物 000078 CH 18,142 300.6 na 47.3 5.0 8.0 4.0 na na na 14.3 14.8 10.8
Simple average
85.7 30.1 29.3 6.2 7.1 5.2 2.1 1.3 1.2
Weighted average
63.7 26.4 27.0 6.4 6.4 4.7 1.6 1.2 1.0
Hong Kong peers
SINO BIOPHARM 中国生物制药 1177 HK 51,070 23.0 28.8 23.0 5.3 6.1 5.0 0.94 1.19 0.95 76.4 76.7 76.4
CSPC PHARMACEUTI 石药集团 1093 HK 42,559 31.9 25.3 20.3 5.0 4.6 4.0 1.09 0.86 0.69 38.2 43.6 45.9
LUYE PHARMA GROU 绿叶制药 2186 HK 22,550 39.6 22.4 18.2 5.4 3.2 2.8 1.54 0.87 0.71 84.7 84.8 84.1
SHANGHAI FUDAN-H 复旦张江 1349 HK 6,895 40.6 41.1 31.6 7.4 7.2 5.8 1.06 1.07 0.82 92.2 na na
LEE'S PHARM 李氏大药厂 950 HK 5,314 31.9 21.6 18.4 6.6 4.4 3.7 2.54 1.72 1.46 70.2 69.0 67.0
Simple average 33.4 27.8 22.3 5.9 5.1 4.3 1.4 1.1 0.9
Weighted average 30.1 26.9 21.5 5.4 5.1 4.3 1.2 1.0 0.8
International peers
ROCHE HLDG-GENUS 罗氏 ROG VX 1,777,018 24.6 19.3 17.6 11.7 9.9 8.3 3.90 3.06 2.80 71.8 75.6 76.2
PFIZER INC 辉瑞制药 PFE US 1,539,536 16.8 14.7 13.6 2.8 3.0 2.9 nm nm nm 80.7 81.1 78.5
MERCK & CO 默克 MRK US 1,171,278 28.0 15.2 14.4 3.3 3.7 3.7 4.18 2.27 2.15 60.3 75.4 75.7
SANOFI 赛诺菲安万特公司 SAN FP 939,714 21.9 15.9 15.0 4.7 4.4 4.0 2.62 1.89 1.79 78.0 85.3 86.0
AMGEN INC 安进 AMGN US 883,680 22.7 14.6 14.5 1.8 1.9 1.8 5.76 3.71 3.68 67.7 68.8 68.6
CSL LTD CSL 有限公司 CSL AU 257,142 22.8 23.9 24.0 9.4 11.4 11.3 1.72 1.80 1.81 52.7 52.6 52.7
BAXTER INTL INC 百特 BAX US 162,413 17.2 30.5 27.0 4.9 1.5 1.5 1.97 3.48 3.09 48.9 42.6 42.4
GRIFOLS SA 基立福公司 GRF SM 111,140 24.2 23.8 22.1 4.3 4.8 4.5 2.45 2.41 2.25 na 48.7 49.0
Simple average
22.3 19.7 18.5 5.4 5.1 4.8 3.1 2.6 2.3
Weighted average 22.5 17.0 15.9 5.7 5.2 4.8 2.9 2.5 2.1
Source: Bloomberg, CMS (HK), as of 23 November 2015

Tuesday, November 24, 2015
To access our research reports on the Bloomberg terminal, type CMHK <GO> 7
Financial Summary
Balance Sheet
RMB million FY13 FY14 2015E 2016E 2017E
Cash and ST investments 615 362 3,421 4,201 5,408
Inventories 50 100 204 355 361
Other current assets 14 108 108 108 108
Total current assets 926 943 4,283 5,378 6,713
Property. Plant & Equipment 248 374 437 528 612
Other assets 16 251 251 251 251
Intangible other assets 42 406 403 400 398
Deferred tax assets 4 12 12 12 12
Total non-current asset 342 1,364 2,175 2,264 2,344
Total Assets 1,268 2,306 6,458 7,641 9,058
Trade and other payables 7 26 40 81 74
Bank loans 0 617 0 0 0
Tax payable 2 4 6 8 10
Other current liabilities 81 605 605 605 605
Total current liabilities 90 1,252 651 694 689
Deferred income 20 17 17 17 17
Deferred taxes liabilities 65 74 74 74 74
Other liabilities 12 20 20 20 20
Total non-current liabilities 97 111 342 342 342
Total liabilities 187 1,363 993 1,036 1,031
Reserves 479 566 1,120 1,971 3,043
Minority interest 11 11 11 -64 -154
Total equity 1,082 944 5,443 6,218 7,200
Total liabilities & equity 1,268 2,306 6,435 7,253 8,231
Cashflow Statement
RMB million FY13 FY14 2015E 2016E 2017E
PBT 209 360 661 969 1,226
Depreciation and amortization 40 33 46 55 67
Interest income -18 -24 -57 -114 -144
Working capital -71 26 -265 -272 -133
Cash generated from operations 266 520 450 984 1,431
Cash from operating activities 217 358 302 810 1,210
Capital expenditure -39 -20 -107 -144 -148
Interest received 22 33 57 114 144
Cash from investing activities 481 -289 -570 -29 -4
Issue of shares 2 0 3,944 0 0
Dividends paid to the owners -490 -659 0 0 0
Cash from financing activities -588 -222 3,327 0 0
Effect of FX rate changes -3 -8 0 0 0
Net change in Cash 110 -153 3,059 780 1,207
Net cash - beginning balance 160 268 108 3,166 3,947
Net cash - ending balance 268 108 3,166 3,947 5,153
Profit & Loss Statement RMB million FY13 FY14 2015E 2016E 2017E
Revenue 875 1,131 1,722 2,394 2,957
Cost of sales -83 -87 -176 -324 -415
Gross profit 792 1,043 1,546 2,070 2,542
Other income 14 46 37 52 64
Selling expenses -341 -431 -648 -877 -1,054
Admin expenses (ex. R&D) -159 -171 -124 -108 -118
Research and development -94 -96 -121 -168 -207
Operating profit 199 345 653 917 1,162
EBITDA 249 423 737 1,024 1,293
PBT 209 360 661 969 1,226
Income tax -113 -68 -119 -174 -221
Net profit 96 292 554 850 1,073
EPS (RMB) - Basic - 0.15 0.25 0.34 0.43
EPS (RMB) - Diluted - 0.15 0.25 0.34 0.43
DPS (RMB) - 0.34 0.00 0.00 0.00
Dividend yield - 4.2% 0.0% 0.0% 0.0%
Financial Ratios
FY13 FY14 2015E 2016E 2017E
Growth (YoY)
Revenue 33.4% 29.2% 52.3% 39.0% 23.5%
Gross profit 18.0% 5.2% 48.1% 33.9% 22.8%
Operating profit 58.4% 73.4% 89.4% 40.4% 26.8%
Net profit -5.7% 204.2% 90.1% 53.4% 26.2%
EPS - - 62.9% 38.0% 26.2%
Margin
Gross margin 90.5% 92.3% 89.8% 86.5% 86.0%
Operating margin 22.7% 30.5% 37.9% 38.3% 39.3%
Net profit margin 11.0% 25.8% 32.2% 35.5% 36.3%
Efficiency
Inventory days 188 315 315 315 315
Trade receivable days 84 93 93 93 93
Account payable days 24 68 68 68 68
Financial Ratio
Current ratio (x) 10.3 0.8 6.6 7.8 9.7
Quick ratio (x) 9.4 0.6 6.1 7.0 9.0
Net debt/equity -56.9% 27.1% -62.9% -67.6% -75.1%
Dividend payout ratio 0.0% 0.0% 0.0% 0.0% 0.0%
ROA 7.6% 12.6% 8.6% 11.1% 11.8%
ROE 8.9% 30.9% 10.2% 13.7% 14.9%
Valuation Comparison
P/B (x) - n.m 3.4 3.3 2.8
P/E (x) - 53.7 33.0 23.9 18.9
Source: Company data, CMS (HK) estimates

Tuesday, November 24, 2015
To access our research reports on the Bloomberg terminal, type CMHK <GO> 8
Investment Ratings
Industry Rating Definition
OVERWEIGHT Expect sector to outperform the market over the next 12 months
NEUTRAL Expect sector to perform in-line with the market over the next 12 months
UNDERWEIGHT Expect sector to underperform the market over the next 12 months
Company Rating Definition
BUY Expect stock to generate 10%+ return over the next 12 months
NEUTRAL Expect stock to generate +10% to -10% over the next 12 months
SELL Expect stock to generate loss of 10%+ over the next 12 months
Analyst Disclosure
The analysts primarily responsible for the preparation of all or part of the research report contained herein hereby certify that: (i) the views expressed in this research report accurately reflect the
personal views of each such analyst about the subject securities and issuers; and (ii) no part of the analyst’s compensation was, is, or will be directly or indirectly, related to the specific
recommendations or views expressed in this research report.
Regulatory Disclosure
Please refer to the important disclosures on our website http://www.newone.com.hk/cmshk/en/disclosure.html.
Disclaimer
This document is prepared by China Merchants Securities (HK) Co., Limited (CMS HK). CMS HK is a licensed corporation to carry on Type 1 (dealing in securities), Type 2 (dealing in futures),
Type 4 (advising on securities), Type 6 (advising on corporate finance) and Type 9 (asset management) regulated activities under the Securities and Futures Ordinance (Chapter 571). This
document is for information purpose only. Neither the information nor opinion expressed shall be construed, expressly or impliedly, as an advice, offer or solicitation of an offer, invitation,
advertisement, inducement, recommendation or representation of any kind or form whatsoever to buy or sell any security, financial instrument or any investment or other specific product. The
securities, instruments or strategies discussed in this document may not be suitable for all investors, and certain investors may not be eligible to participate in some or all of them. Certain
services and products are subject to legal restrictions and cannot be offered worldwide on an unrestricted basis and/or may not be eligible for sale to all investors. CMS HK is not registered as a
broker-dealer in the United States and its products and services are not available to U.S. persons except as permitted under SEC Rule 15a-6.
The information and opinions, and associated estimates and forecasts, contained herein have been obtained from or are based on sources believed to be reliable. CMS HK, its holding or
affiliated companies, or any of its or their directors, officers or employees (CMS Group) do not represent or warrant, expressly or impliedly, that it is accurate, correct or complete and it should
not be relied upon. CMS Group will not accept any responsibility or liability whatsoever for any use of or reliance upon this document or any of the content thereof. The contents and information
in this document are only current as of the date of their publication and will be subject to change without prior notice. Past performance is not indicative of future performance. Estimates of
future performance are based on assumptions that may not be realized. The analysis contained herein is based on numerous assumptions. Different assumptions could result in materially
different results. Opinions expressed herein may differ or be contrary to those expressed by other business divisions or other members of CMS Group as a result of using different assumptions
and/or criteria.
This document has been prepared without regard to the individual financial circumstances and investment objectives of the persons who receive it. Use of any information herein shall be at the
sole discretion and risk of the user. Investors are advised to independently evaluate particular investments and strategies, take financial and/or tax advice as to the implications (including tax) of
investing in any of the securities or products mentioned in this document, and make their own investment decisions without relying on this publication.
CMS Group may have a long or short position, make markets, act as principal or agent, or engage in transactions in securities of companies referred to in this document and may also perform
or seek to perform investment banking services or provide advisory or other services for those companies. This document is for the use of intended recipients only and this document may not
be reproduced, distributed or published in whole or in part for any purpose without the prior consent of CMS Group. CMS Group will not be liable for any claims or lawsuits from any third parties
arising from the use or distribution of this document. This document is for distribution only under such circumstances as may be permitted by applicable law. This document is not directed at you
if CMS Group is prohibited or restricted by any legislation or regulation in any jurisdiction from making it available to you. In particular, this document is only made available to certain US
persons to whom CMS Group is permitted to make available according to US securities laws, but cannot otherwise be made available, distributed or transmitted, whether directly or indirectly,
into the US or to any US person. This document also cannot be distributed or transmitted, whether directly or indirectly, into Japan and Canada and not to the general public in the People’s
Republic of China (for the purpose of this document, excluding Hong Kong, Macau and Taiwan).

Tuesday, November 24, 2015
To access our research reports on the Bloomberg terminal, type CMHK <GO> 9
Important Disclosures for U.S. Persons
This research report was prepared by CMS HK, a company authorized to engage in securities activities in Hong Kong. CMS HK is not a registered broker-dealer in the United States and,
therefore, is not subject to U.S. rules regarding the preparation of research reports and the independence of research analysts. This research report is provided for distribution solely to major
U.S. institutional investors in reliance on the exemption from registration provided by Rule 15a-6 of the U.S. Securities Exchange Act of 1934, as amended (the Exchange Act).
Any U.S. recipient of this research report wishing to effect any transaction to buy or sell securities or related financial instruments based on the information provided in this research report
should do so only through Rosenblatt Securities Inc, 20 Broad Street 26th Floor, New York NY 10005, a registered broker dealer in the United States. Under no circumstances should any
recipient of this research report effect any transaction to buy or sell securities or related financial instruments through CMS HK. Rosenblatt Securities Inc. accepts responsibility for the contents
of this research report, subject to the terms set out below.
The analyst whose name appears in this research report is not registered or qualified as a research analyst with the Financial Industry Regulatory Authority (FINRA) and may not be an
associated person of Rosenblatt Securities Inc. and, therefore, may not be subject to applicable restrictions under FINRA Rules on communications with a subject company, public appearances
and trading securities held by a research analyst account.
Ownership and Material Conflicts of Interest
Rosenblatt Securities Inc. or its affiliates does not ‘beneficially own,’ as determined in accordance with Section 13(d) of the Exchange Act, 1% or more of any of the equity securities mentioned
in the report. Rosenblatt Securities Inc, its affiliates and/or their respective officers, directors or employees may have interests, or long or short positions, and may at any time make purchases
or sales as a principal or agent of the securities referred to herein. Rosenblatt Securities Inc. is not aware of any material conflict of interest as of the date of this publication.
Compensation and Investment Banking Activities
Rosenblatt Securities Inc. or any affiliate has not managed or co-managed a public offering of securities for the subject company in the past 12 months, nor received compensation for
investment banking services from the subject company in the past 12 months, neither does it or any affiliate expect to receive, or intends to seek compensation for investment banking services
from the subject company in the next 3 months.
Additional Disclosures
This research report is for distribution only under such circumstances as may be permitted by applicable law. This research report has no regard to the specific investment objectives, financial
situation or particular needs of any specific recipient, even if sent only to a single recipient. This research report is not guaranteed to be a complete statement or summary of any securities,
markets, reports or developments referred to in this research report. Neither CMS HK nor any of its directors, officers, employees or agents shall have any liability, however arising, for any
error, inaccuracy or incompleteness of fact or opinion in this research report or lack of care in this research report’s preparation or publication, or any losses or damages which may arise from
the use of this research report.
CMS HK may rely on information barriers, such as Chinese Walls to control the flow of information within the areas, units, divisions, groups, or affiliates of CMS HK.
Investing in any non-U.S. securities or related financial instruments (including ADRs) discussed in this research report may present certain risks. The securities of non-U.S. issuers may not be
registered with, or be subject to the regulations of, the U.S. Securities and Exchange Commission. Information on such non-U.S. securities or related financial instruments may be limited.
Foreign companies may not be subject to audit and reporting standards and regulatory requirements comparable to those in effect within the United States.
The value of any investment or income from any securities or related financial instruments discussed in this research report denominated in a currency other than U.S. dollars is subject to
exchange rate fluctuations that may have a positive or adverse effect on the value of or income from such securities or related financial instruments.
Past performance is not necessarily a guide to future performance and no representation or warranty, express or implied, is made by CMS HK with respect to future performance. Income from
investments may fluctuate. The price or value of the investments to which this research report relates, either directly or indirectly, may fall or rise against the interest of investors. Any
recommendation or opinion contained in this research report may become outdated as a consequence of changes in the environment in which the issuer of the securities under analysis
operates, in addition to changes in the estimates and forecasts, assumptions and valuation methodology used herein.
No part of the content of this research report may be copied, forwarded or duplicated in any form or by any means without the prior consent of CMS HK and CMS HK accepts no liability
whatsoever for the actions of third parties in this respect.
Hong Kong
China Merchants Securities (HK) Co., Ltd.
Address: 48/F, One Exchange Square, Central, Hong Kong
Tel: +852 3189 6888Fax: +852 3101 0828

![Corporate Governance Report · [Principle 1.4] Strategic holdings (cross-shareholdings) 1. Policy on strategic holdings (cross-shareholdings) In the course of its business activities,](https://static.fdocuments.net/doc/165x107/605827e2f5babc5b1d755847/corporate-governance-report-principle-14-strategic-holdings-cross-shareholdings.jpg)


