Compaction of Sand-Processed Clay Soil · PDF fileJennifer L. Howell, 1 Charles D....
16
Jennifer L. Howell, 1 Charles D. Shackelford, 2 Nabil H. Amer, 3 and Roslyn T. Stern, 4 Compaction of Sand-Processed Clay Soil Mixtures REFERENCE: Howell, J. L., Shackelford, C. D., Amer, N. H., and Stem, R. T. "Compaction of Sand-Processed Clay Soil Mixtures" Geotechnical Testing Journal, GTJODJ, Vol. 20, No. 4, December 1997, pp. 443--458. ABSTRACT: The effects of type of processed clay soil, curing period, and mixing procedure on laboratory compaction of sand-attapulgite clay (S-AC), sand-granular bentonite (S-GB), sand-powdery bentonite (S-PB), and sand-attapulgite clay-granular bentonite (S-AC-GB) mix- tures are evaluated. Compaction is evaluated for total clay soil contents of 10, 15, and 20%. Different trends in optimum water content, Wopt, and maximum dry unit weight, Tamax,versus clay soil content among the S-AC, S-GB, and S-PB mixtures are attributed, in part, to (l) the greater water sorptivity and lower swelling potential of attapulgite clay relative to the bentonites, (2) the larger particle sizes of the granular bentonite in the air-dried condition relative to the powdery bentonite, and (3) the possible correlation between the Woptand the plasticity index of the sand-bentonite mixtures. The Awopt values and ATdmax values resulting from one-day versus seven-day curing periods before compaction of the S-GB and S-PB mixtures are --0.5 percentage points and --<0.08 kN/m3 (--<0.5pcf), respectively, and result in different trends in '~dmax Versus bentonite content for the two types of sand-bentonite mixtures. Also, mixing the sand and bentonite in a dry condition before adding water consistently results in greater Wop t arid "Ydmax values than mixing the sand with the appropriate amount of water before adding the bentonite regardless of the type of bentonite. Finally, mixing the attapolgite clay and granular bentonite together in small amounts for each individual compaction point for the S-AC-GB mixtures consis- tently results in higher "~dmaxand Wop t values relative to mixing the attapulgite clay and granular bentonite together in large amounts suffi- cient to cover all compaction points. KEYWORDS: activity, attapuigite, Atterberg limits, bentonite, com- paction, curing, granular bentonite, powdery bentonite, sand-attapulgite clay mixtures, sand-bentonite mixtures, sand-clay soil mixtures Compaction control has a dominating influence on the hydrau- lic conductivity of compacted clayey soils used as low-permeabil- ity liners and covers for waste disposal (Lambe 1958; Bjerrum and Huder 1957; Mitchell et al. 1965). For example, Mitchell 1Geotechnical engineer, Shepherd Miller, Inc., 3801 Automation Way, Suite 100, Fort Collins, CO 80525; formedy graduate student, Geotechnical Engineering Program, Department of Civil Engineering, Colorado State University, Fort Collins, CO 80523. 2Associate professor, Geotechnical Engineering Program, Department of Civil Engineering, Colorado State University, Fort Collins, CO 80523. 3Lecturer, Civil Engineering Department, Military Technical College, Kobry El-Kobba, Cairo, Egypt; formerly graduate student, Geotechnical Engineering Program, Department of Civil Engineering, Colorado State University, Fort Collins, CO 80523. 4Staff engineer, Golder Assoc., Inc., 200 Union Blvd, Suite 500, Lake- wood, CO 80228; formerly graduate student, Geotechnical Engineering Program, Department of Civil Engineering, Colorado State University, Fort Collins, CO 80523. © 1997 by the American Society for Testing and Materials 443 et al. (1965) illustrated that the laboratory-measured hydraulic conductivity of a compacted silty clay (liquid limit = 37%, plastic limit = 23%) was more than two orders of magnitude lower when the soil was compacted wet of optimum water content, Wopt, versus dry of Wopt. As a result of these and other studies, typical specifications for the construction of compacted clay liners and covers require that the field soil be compacted wet of wopt or wet of the line of optimum water contents to achieve the lowest possible hydraulic conductivity (Daniel and Benson 1990). In some cases, natural clayey soils suitable for use as com- pacted clay liners and covers are not readily or economically available. In such cases, compacted sand-bentonite mixtures typically are considered for use primarily due to the abundance and availability of processed bentonite, typically sodium benton- ite, and the ability of the compacted mixture to achieve a relatively low hydraulic conductivity (e.g.,--<10 -7 cm/s) upon permeation with water using only relatively small quantities (e.g., -<20% by dry weight) of the bentonite admixture (Daniel 1987; Garlanger et al. 1987; Chapuis et al. 1992; O'Sadnick et al. 1995; Gleason et al. 1997; Howell and Shackelford 1997). The low hydraulic conductivity values for compacted sand- bentonite mixtures are attributed primarily to the high swelling potential of sodium bentonites in the presence of water, resulting in the formation of a relatively "tight" soil matrix. However, studies also have shown that the hydraulic conductiv- ity of compacted sand-bentonite mixtures permeated with an actual or simulated liquid waste or leachate can be significantly higher than the hydraulic conductivity of the same mixtures permeated with water (Gipson 1985, Shackelford 1994; Gleason et al. 1997). As a result, the use of other processed clay soils as admixture materials for waste containment applications has been investigated. In particular, attapulgite clay, also known as attapulgus, has been considered for use as a substitute for bentonite in vertical cutoff walls as welt as in compacted clay liners (Tobin and Wild 1986; Ryan 1987; Broderick and Daniel 1990; and Day 1994). These studies have shown that the hydraulic conductivity of compacted attapulgite clay and attapulgite clay slurries is relatively unaffected when permeated with several different waste liquids. The purpose of this paper is to present the results of a compaction study aimed at identifying the trends in Wopt and maximum dry unit weight, ~/dmax, for compacted mixtures containing sand and either sodium bentonite or attapulgite clay. In addition, compaction of sand-clay soil mixtures in which the clay soil admixture consists of mixtures of the bentonite and the attapulgite clay also are evaluated. Copyright by ASTM Int'l (all rights reserved); Wed Jun 17 14:35:14 EDT 2009 Downloaded/printed by Colorado State Univ pursuant to License Agreement. No further reproductions authorized.
Transcript of Compaction of Sand-Processed Clay Soil · PDF fileJennifer L. Howell, 1 Charles D....

Jennifer L. Howell, 1 Charles D. Shackelford, 2 Nabil H. Amer, 3 and Roslyn T. Stern, 4
Compaction of Sand-Processed Clay Soil Mixtures
REFERENCE: Howell, J. L., Shackelford, C. D., Amer, N. H., and Stem, R. T. "Compaction of Sand-Processed Clay Soil Mixtures" Geotechnical Testing Journal, GTJODJ, Vol. 20, No. 4, December 1997, pp. 443--458.
ABSTRACT: The effects of type of processed clay soil, curing period, and mixing procedure on laboratory compaction of sand-attapulgite clay (S-AC), sand-granular bentonite (S-GB), sand-powdery bentonite (S-PB), and sand-attapulgite clay-granular bentonite (S-AC-GB) mix- tures are evaluated. Compaction is evaluated for total clay soil contents of 10, 15, and 20%. Different trends in optimum water content, Wopt, and maximum dry unit weight, Tamax, versus clay soil content among the S-AC, S-GB, and S-PB mixtures are attributed, in part, to (l) the greater water sorptivity and lower swelling potential of attapulgite clay relative to the bentonites, (2) the larger particle sizes of the granular bentonite in the air-dried condition relative to the powdery bentonite, and (3) the possible correlation between the Wopt and the plasticity index of the sand-bentonite mixtures. The Awopt values and ATdmax values resulting from one-day versus seven-day curing periods before compaction of the S-GB and S-PB mixtures are --0.5 percentage points and --<0.08 kN/m 3 (--<0.5 pcf), respectively, and result in different trends in '~dmax Versus bentonite content for the two types of sand-bentonite mixtures. Also, mixing the sand and bentonite in a dry condition before adding water consistently results in greater Wop t arid "Ydmax values than mixing the sand with the appropriate amount of water before adding the bentonite regardless of the type of bentonite. Finally, mixing the attapolgite clay and granular bentonite together in small amounts for each individual compaction point for the S-AC-GB mixtures consis- tently results in higher "~dmax and Wop t values relative to mixing the attapulgite clay and granular bentonite together in large amounts suffi- cient to cover all compaction points.
KEYWORDS: activity, attapuigite, Atterberg limits, bentonite, com- paction, curing, granular bentonite, powdery bentonite, sand-attapulgite clay mixtures, sand-bentonite mixtures, sand-clay soil mixtures
Compaction control has a dominating influence on the hydrau- lic conductivity of compacted clayey soils used as low-permeabil- ity liners and covers for waste disposal (Lambe 1958; Bjerrum and Huder 1957; Mitchell et al. 1965). For example, Mitchell
1Geotechnical engineer, Shepherd Miller, Inc., 3801 Automation Way, Suite 100, Fort Collins, CO 80525; formedy graduate student, Geotechnical Engineering Program, Department of Civil Engineering, Colorado State University, Fort Collins, CO 80523.
2Associate professor, Geotechnical Engineering Program, Department of Civil Engineering, Colorado State University, Fort Collins, CO 80523.
3Lecturer, Civil Engineering Department, Military Technical College, Kobry El-Kobba, Cairo, Egypt; formerly graduate student, Geotechnical Engineering Program, Department of Civil Engineering, Colorado State University, Fort Collins, CO 80523.
4Staff engineer, Golder Assoc., Inc., 200 Union Blvd, Suite 500, Lake- wood, CO 80228; formerly graduate student, Geotechnical Engineering Program, Department of Civil Engineering, Colorado State University, Fort Collins, CO 80523.
© 1997 by the American Society for Testing and Materials 443
et al. (1965) illustrated that the laboratory-measured hydraulic conductivity of a compacted silty clay (liquid limit = 37%, plastic limit = 23%) was more than two orders of magnitude lower when the soil was compacted wet of optimum water content, Wopt, versus dry of Wopt. As a result of these and other studies, typical specifications for the construction of compacted clay liners and covers require that the field soil be compacted wet of wopt or wet of the line of optimum water contents to achieve the lowest possible hydraulic conductivity (Daniel and Benson 1990).
In some cases, natural clayey soils suitable for use as com- pacted clay liners and covers are not readily or economically available. In such cases, compacted sand-bentonite mixtures typically are considered for use primarily due to the abundance and availability of processed bentonite, typically sodium benton- ite, and the ability of the compacted mixture to achieve a relatively low hydraulic conductivity (e.g.,--<10 -7 cm/s) upon permeation with water using only relatively small quantities (e.g., -<20% by dry weight) of the bentonite admixture (Daniel 1987; Garlanger et al. 1987; Chapuis et al. 1992; O'Sadnick et al. 1995; Gleason et al. 1997; Howell and Shackelford 1997). The low hydraulic conductivity values for compacted sand- bentonite mixtures are attributed primarily to the high swelling potential of sodium bentonites in the presence of water, resulting in the formation of a relatively "tight" soil matrix.
However, studies also have shown that the hydraulic conductiv- ity of compacted sand-bentonite mixtures permeated with an actual or simulated liquid waste or leachate can be significantly higher than the hydraulic conductivity of the same mixtures permeated with water (Gipson 1985, Shackelford 1994; Gleason et al. 1997). As a result, the use of other processed clay soils as admixture materials for waste containment applications has been investigated. In particular, attapulgite clay, also known as attapulgus, has been considered for use as a substitute for bentonite in vertical cutoff walls as welt as in compacted clay liners (Tobin and Wild 1986; Ryan 1987; Broderick and Daniel 1990; and Day 1994). These studies have shown that the hydraulic conductivity of compacted attapulgite clay and attapulgite clay slurries is relatively unaffected when permeated with several different waste liquids.
The purpose of this paper is to present the results of a compaction study aimed at identifying the trends in Wopt and maximum dry unit weight, ~/dmax, for compacted mixtures containing sand and either sodium bentonite or attapulgite clay. In addition, compaction of sand-clay soil mixtures in which the clay soil admixture consists of mixtures of the bentonite and the attapulgite clay also are evaluated.
Copyright by ASTM Int'l (all rights reserved); Wed Jun 17 14:35:14 EDT 2009Downloaded/printed byColorado State Univ pursuant to License Agreement. No further reproductions authorized.

444 GEOTECHNICAL TESTING JOURNAL
Materials
Soils
The soils used as mixture constituent materials in this study are attapulgite clay, granular bentonite, powdery bentonite, and sand. A qualitative comparison of the properties of attapulgite clay and bentonite is provided in Table 1. The physical and chemical proper- ties of the constituent materials used in the soil mixtures in this study are summarized in Tables 2 and 3, respectively. The proce-
TABLE t--Qualitative comparison of attapulgite and bentonite clay soils (after Tobin and Wild 1986).
Clay Soil Characteristic
Type of Clay Soil
Attapulgite Bentonite
Principal mineral attapulgite Crystal structure chain Particle shape needle Surface area high Swell potential low Cation exchange capacity low Effect of electrolytes slight Sorptivity high
montmorillonite three-layer sheet
plate medium
high high
flocculates medium
dures used to measure the soil chemical properties are described by Shackelford and Redmond (1995).
In general, attapulgite crystals are needle-like, resulting in aggre- gates that form a "hay stack" structure. The attractive forces between the needles within a particle are considerable, and there- fore attapulgite is not particularly susceptible to swelling. However, attapulgite is a highly sorptive material in terms of absorption of water into the channels between the crystals. Attapulgite clay also appears to be stable in high concentrations of electrolytes and, therefore, is not as susceptible as the plate-like clay minerals to dramatic changes in hydraulic conductivity after exposure to liquid waste (Tobin and Wild 1986). As a result, attapulgite clay may be used as a soil additive to help stabilize an otherwise unstable soil (Broderick and Daniel 1990). However, since the high swelling potential evident in sodium bentonite is not evident in attapulgite clay due to the difference in mineralogical composition of the soil, the primary concern with the use of attapulgite clay as a liner material is the ability to achieve a relatively low hydraulic conduc- tivity when permeated with water (Howell and Shackelford 1997).
Panicle-size distributions of the soil constituents are shown in Fig. 1. For the clay soils, the results of both hydrometer analyses (ASTM D 421) 5 and mechanical sieve analyses (ASTM D 422) 6 performed on the unaltered, air-dried soil constituents are shown
TABLE 2--Physical properties of soil constituents used in sand-clay soil mixtures.
Soil Constituent
ASTM Test Attapulgite Granular Property/Characteristic Standard Clay Bentonite Powdery Bentonite Sand
Source NA Floridin Co., Wyo-Ben, Inc., Quality Drilling, Colorado Lien Co., Quincy, FL Billings, MT Greeley, CO LaPorte, CO
Trade name NA Microsorb-ES BigHorn CH 10 Quality Bentonite 40--140 Silca Sand Liquid limit, LL (%) D 4318 305 405 413 --" Plasticity index, PI (%) D 4318 209 367 378 NP Specific gravity, Gs D 854 2.71 2.87 2.81 2.66 Percent sand, 0.074--4.75 mm D 421 6.5 5.0 0 100 Percent silt, 0.002-0.074 mm D 422 29.0 20.0 16.0 0 Percent clay, <2 ~m D 422 64.5 75.0 84.0 0 Classification (USCS) D 2487 CH CH CH SP
TABLE 3--Chemical properties of soil constituents.
Soil Constituent
Attapulgite Granular Powdery Property Clay Bentonite Bentonite Sand
Cation exchange capacity, CEC (meq/100 g) 18.1 63.9 72.3 0
Exchangeable metals (meql I00 g):
Ca 5.9 18.6 26.6 .-. Mg 11.1 7.4 4.2 ... Na 0.1 29.8 36.3 -" K 0.3 1.3 0.9 --- AI <0. l <0.1 0.2 .-- Si 0.2 1.0 1.3 .'. Sum 17.6 58.1 69.5 ...
Soluble salts (mg/kg): Ca 80.2 140 80.2 381 Mg 110 48.8 18.3 97.6 Na 23.0 2820 4200 299 K 19.6 19.6 19.6 19.6
Soil pH 9.7 9.1 8.9 8.5 Soil EC, mS/cm @ 25°C 0.3 2.5 3.3 0.7
to distinguish individual particle sizes from the clod sizes that occur at the natural (gravimetric) water contents ranging from 5 to 6.5%.
The classifications of the soils based on the Unified Soil Classifi- cation System (ASTM D 2487) 7, USCS, also are shown in Fig. 1. The attapulgite clay and powdery bentonite are classified as CH regardless of whether the distribution is based on the hydrometer analysis or the mechanical sieve analysis of the air-dried clay soil. However, the granular bentonite classifies as a clayey sand, SC, according to the USCS based on the results of the mechanical sieve analysis. Thus, the initial particle-size distribution of the granular bentonite (i.e., before compaction) is similar to that of a clayey sand in that the particles actually represent small clods. This difference in initial particle-size distributions for the granular bentonite may affect the performance of the granular bentonite in the sand-clay soil mixtures since no attempt is made during speci-
5ASTM Practice for Dry Preparation of Soil Samples for Particle-Size Analysis and Determination of Soil Constants.
6ASTM Test Method for Particle-Size Analysis of Soils. 7Classification of Soils for Engineering Purposes (Unified Soil Classifi-
cation System).
Copyright by ASTM Int'l (all rights reserved); Wed Jun 17 14:35:14 EDT 2009Downloaded/printed byColorado State Univ pursuant to License Agreement. No further reproductions authorized.
100
90
80
70 C~ t , -
"~ 60 f,o
a. 50 o- lD
~ 40 Q .
30
20
10
0 10'
L, Sand ~ l ~ Silt ~_1_~ r--~ ~i TM ~,Vl~
HOWELL lET AL ON CLAY SOIL MIXTURES
Clay ~
10 ° 10" 10 .2 10 .3 10 4 10 "s
Particle Diameter (mm) FIG. l--Particle-size distributions for soil constituents used in the sand-clay soil mixtures.
10"
445
men preparation to destroy the intact clods of the granular bentonite.
Index Properties of Soil Mixtures
Four soil mixtures were used in this study: sand mixed with granular bentonite (S-GB), sand mixed with powdery bentonite (S-PB), sand mixed with attapulgite clay (S-AC), and sand mixed with attapulgite clay and granular bentonite (S-AC-GB). The total clay soil contents (i.e., AC, GB, PB, or AC + GB) in the sand- clay soil mixtures are. 10, 15, and 20% of the dry weight of the soil mixture. The clay soil content differs from the clay particle content (i.e., % < 2 I~m) in that the clay soil content is the amount of attapulgite clay and/or bentonite added to the sand-clay soil mixture and, therefore, includes particle sizes > 2 I.tm as indicated in Fig. 1. The use of clay soil content is in accordance with practical applications where the amount of the processed clay soil added to the sand is the primary interest (e.g., amount of bentonite in a sand-bentonite mixture). The clay soil content of the sand-clay soil mixtures containing both bentonite and attapulgite clay was composed of equal amounts of the two processed clay soils (i.e., 50% each by dry weight of the clay soil admixture).
The minimum clay soil content of 10% was based primarily on the study by Kenney et al. (1992), who found that many void spaces did not contain bentonite due to inadequate distribution for bentonite contents <--7.4%. Instead, Kenney et al. (t992) found that adequate distribution of the bentonite in the mixture occurred for bentonite contents >-9%. This lower limit on the bentonite content also is consistent with the bentonite contents based on field mixing criteria reported by Lundgren (1981), Garlanger et al. (1987), and O'Sadnick et al. (1995). Clay soil contents greater than 20% were considered unreasonable from a practical viewpoint due to the likelihood of excessive cost.
The measured and calculated properties of the soil mixtures are
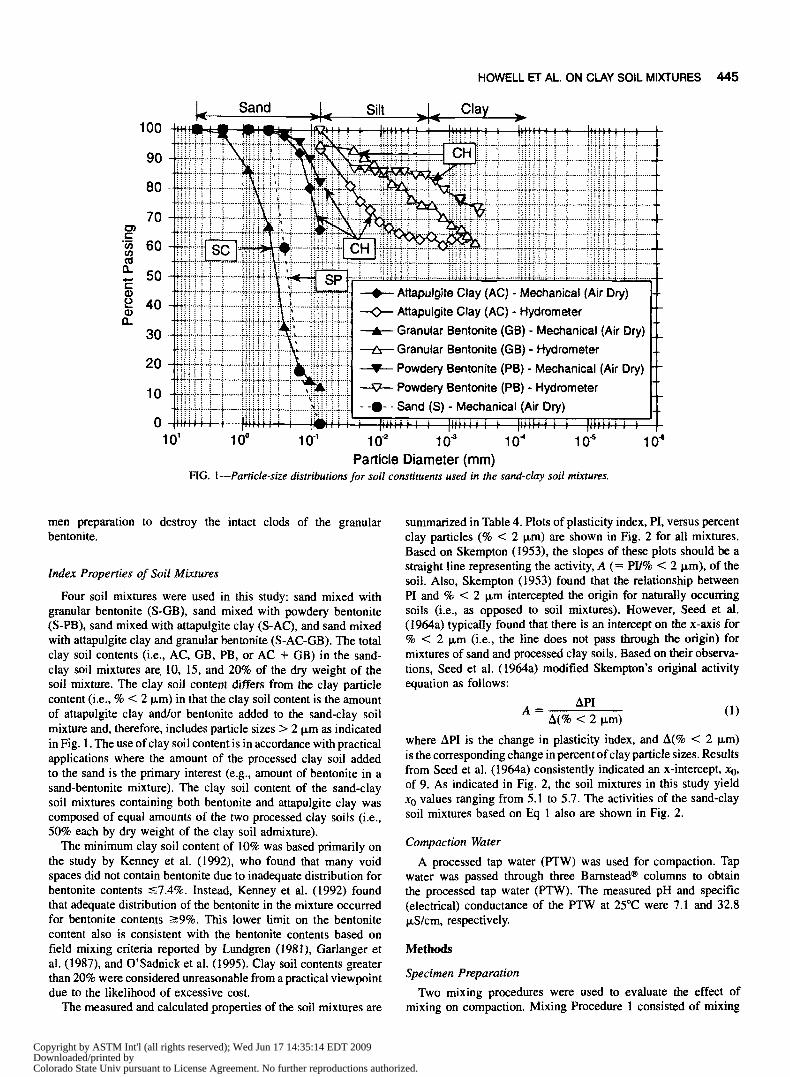
summarized in Table 4. Plots of plasticity index, PI, versus percent clay particles (% < 2 I~m) are shown in Fig. 2 for all mixtures. Based on Skempton 0953), the slopes of these plots should be a straight line representing the activity, A (= PI/% < 2 i~m), of the soil. Also, Skempton (t953) found that the relationship between PI and % < 2 ~m intercepted the origin for naturally occurring soils (i.e., as opposed to soil mixtures). However, Seed et al. (1964a) typically found that there is an intercept on the x-axis for % < 2 ~m (i.e., the line does not pass through the origin) for mixtures of sand and processed clay soils. Based on their observa- tions, Seed et al. (1964a) modified Skempton's original activity equation as follows:
API A = (1)
A(% < 2 I~m)
where API is the change in plasticity index, and A(% < 2 I~m) is the corresponding change in percent of clay particle sizes. Results from Seed et al. (1964a) consistently indicated an x-intercept, Xo, of 9. As indicated in Fig. 2, the soil mixtures in this study yield x 0 values ranging from 5.1 to 5.7. The activities of the sand-clay soil mixtures based on Eq 1 also are shown in Fig. 2.
Compaction Water
A processed tap water (PTW) was used for compaction. Tap water was passed through three Barnstead ® columns to obtain the processed tap water (PTW). The measured pH and specific (electrical) conductance of the PTW at 25°C were 7.1 and 32.8 l~S/cm, respectively.
Methods
Specimen Preparation
Two mixing procedures were used to evaluate the effect of mixing on compaction. Mixing Procedure 1 consisted of mixing
Copyright by ASTM Int'l (all rights reserved); Wed Jun 17 14:35:14 EDT 2009Downloaded/printed byColorado State Univ pursuant to License Agreement. No further reproductions authorized.
4 4 6 GEOTECHNICAL TESTING JOURNAL
TABLE 4---Physical properties of soil mixtures.
Attcrberg Limits b
Percent by Dry Weight of Clay Soil Mixture in Sand-Clay Soil Mixture a Liquid Plasticity Specific
Limit, LL Index, PI Gravity, No. AC GB PB Total (%) (%) Gs c
Particle Sizes c
Sand (0.074-4.75
mm), %
Silt (0.002-0.074
mm), %
Clay (<2 0,m),
%
1 10 . . . . . . 10 27 4 2.67 90.7 2 15 . . . . . . 15 37 10 2.67 86.0 3 20 . . . . . . 20 50 25 2.67 81.3 4 .-. 10 ... 10 35 9 2.68 90.5 5 ... 15 ".. 15 56 32 2.69 85.6 6 ".. 20 "- 20 72 50 2.70 81.0 7 . . . . . . l0 10 39 14 2.67 90.0 8 . . . . . . 15 15 54 31 2.68 85.0 9 . . . . . . 20 20 75 53 2.69 80.0
10 5 5 ..- l0 34 10 2.67 90.6 11 7.5 7.5 "" 15 55 30 2.68 85.9 12 10 10 "- 20 72 50 2.69 81.2
2.9 4.4 5.8 2.0 3.0 4.0 1.5 2.2 3.0 2.4 3.7 4.9
6.4 9.6
12.9 7.5
11.3 15.0 8.5
12.8 17.0 7.0
10.4 13.9
aAC = attapulgite clay; GB = granular bentonite; PB = powdery bentonite. bMeasured according to ASTM D 4318. cCalculated from individual soil constituents.
A
o~
(D "O C
._O o~
a .
90
80
70
60-
.... I ! I ! I ' t ! J ! t ' ..... I ' I ' Activityl x-intercept, Coefficient of i;::::::::
Mixture A Xo Determination, r 2 ~i!iiii= S-AC a2 $5 0945 [iiiiiiiii S-GB 5.4 5.7 0.996 E!!L. " S-PB 4.2 5.1 0.999 ~;::::::::
S-AC-GB 5.8 5.3 1.000 r:;=:::=
. . . . . . ÷
. . . . . . . 4,.
. . . . . T
0 5 10 15 20 25 30 35 40 Clay Particle Content (% < 2 Ixm)
FIG. 2--Activities of sand-clay soil mixtures.
45
the sand with the appropriate amount of water before adding the clay soil in stages and thoroughly mixing by hand using a spoon after each addition of clay soil. Mixing Procedure 2 involved mixing the dry sand and clay soil before adding the appropriate amount of water with a spray bottle and mixing frequently by hand using a spoon. After the sand, clay soil, and water were adequately distributed using either mixing procedure, the mixture was placed in double Zip-Loc ® plastic bags and cured for either one day or seven days to evaluate the effect of the curing period on the compaction properties of the soil mixtures.
For samples containing both clay soils, two different variations of Mixing Procedure 1 also were evaluated considering only a one- day curing period: the batch mixing procedure and the individual mixing procedure. The batch mixing procedure involved mixing a large batch of equal amounts by dry weight of attapulgite clay and granular bentonite and taking the appropriate amount of clay soil mixture from the batch to add at arbitrary intervals to the wet sand. The individual mixing procedure involved weighing out the desired amounts of attapulgite clay and granular bentonite for each individual compaction test, mixing the two clay soils into a
Copyright by ASTM Int'l (all rights reserved); Wed Jun 17 14:35:14 EDT 2009Downloaded/printed byColorado State Univ pursuant to License Agreement. No further reproductions authorized.
HOWELL ET AL. ON CLAY SOIL MIXTURES 447
combined clay soil mixture, and then adding that clay soil mixture at arbitrary intervals to the wet sand.
Specimen Compaction
Specimens for each soil mixture were compacted in accordance with standard compaction procedures (ASTM D 698) 8. The opti- mum water content, Wopt, and the maximum dry unit weight, ~/dmax, for the resulting compaction data were determined by regressing the measured data with a third-order polynomial equation of the following form:
~ld = Aw3 + B w2 + Cw + D (2)
where ~a is the dry unit weight, kN/m 3, w is the corresponding molding (compaction) water content, %, and A, B, C, and D are constants resulting from the fitting process. Both second-order and fourth-order polynomial equations also were considered. However, a second-order polynomial equation does not allow for the possibil- ity of an increase in "Yd with a decrease in w that can occur when the molding water content is significantly dry of Wopt (Hausmann 1990), whereas a fourth-order polynomial equation fits four data points exactly and does not provide significantly greater accuracy relative to a third-order polynomial equation for more than four data points, Thus, a third-order polynomial equation is reasonable.
The local maximum and minimum of a third-order polynomial fit can be ascertained by setting the derivative of Eq 2 with respect to w equal to zero, or
d~l_...aa = 3Aw2 + 2Bw + C = 0 (3) dw
and solving the resulting quadratic equation for the two roots of w, or
B + - i 2 A C w = -3"A - 6A (4)
The value of w corresponding to ~/araax is Wop t, and ~/amax is determined by substituting Wopt into Eq 2, or:
"~amax = aw3pt + Bw~opt + Cwopt + D (5)
Since most software plotting packages provide for third-order polynomial fitting, and the roots of the fitted curve (Eq 4) can be determined using a hand-held calculator, the above analysis for Wop t and ~/arnax is straightforward, yet provides a consistent and rational basis for evaluating the differences among different com- paction curves. A summary of the resulting fitting parameter values and corresponding Wop t and "Yamax values for the compaction tests performed in this study is provided in Table 5. Presentation of the measured data and discussion of the results follows.
Results and Discussion
Effect of Clay Soil Type
The standard compaction curves (ASTM D 698) for Test Nos. 1-12 (Table 5) performed to distinguish the type of processed clay soil in the sand-clay soil mixtures on Wopt and ~dmax are shown in Fig. 3. The shape of the third-order polynomial fit to the mea- sured data for powdery bentonite (Fig. 3e) may be due to the
8Test Method for Laboratory Compaction Characteristics of Soil Using Standard Effort (12,400 ft-lbf/ft 3 (600 kN-m/m3)).
arching effect that results from compaction at molding water con- tents that are significantly dry of Wop t as described by Hausmann (1990), or simply may be the result of scatter in the data on the dry side of W~pt.
The trends in Wop t and ~/amax with clay soil content for the compaction curves in Fig. 3 are shown in Fig. 4. As expected, Wop t increased and 'Ydmax decreased as the amount of attapulgite clay in the mixture increased from 10 to 20%. These trends are expected since clay soils typically have lower "Ydmax values and higher Wopt values than sands; thus, an increase in clay soil content is expected to decrease ~/dmax and to increase Wop t. However, the same trends in Wopt and ~/amax are not evident for the mixtures containing bentonite.
For example, "Ydmax for the sand-granular bentonite (S-GB) mix- tures is relatively insensitive to the clay soil content, whereas ~/dmax for the sand-powdery bentonite (S-PB) mixtures increases as the powdery bentonite content increases from 10 to 20%. The relative insensitivity of the ~/dmax values tO the clay soil content for the S-Giq mixtures may be attributed, in part, to the similarity between the particle-size distribution for the sand and the particle- size distribution for the granular bentonite based on the mechanical (sieve) analysis of the air-dried soil as shown in Fig. 1.
The trend in "Ydmax versus clay soil content for the S-PB mixtures is somewhat consistent with Kenney et al. (1992), who reported an increase in ~dmax until about 16% bentonite content followed by a decrease in ~/amax with increasing bentonite content. In this case, the smaller panicles of the powdery bentonite fill the void spaces between the larger sand particles. The difference between the results reported by Kenney et al. (1992) and those reported for the powdery bentonite mixtures in this study may be due, in part, to the differences between the sand and bentonites used in both studies. For example, the sand used by Kenney et aL (1992) contained 2% fines (% < 0.075 ram), whereas the sand used in this study contained no fines (Table 2).
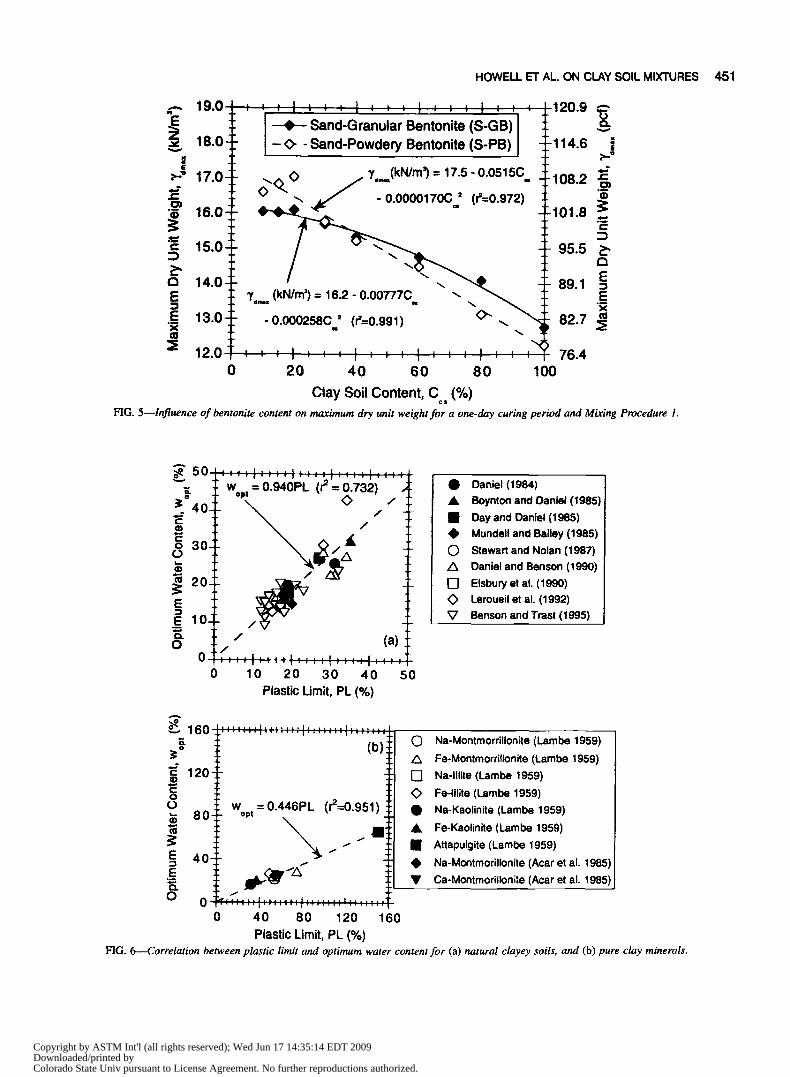
Since the "Yarnax values for the granular and powdery bentonites are both lower than the ~amax values reported in Table 5 and shown in Figs. 3 and 4 for the S-GB and S-PB mixtures, the ~/amax values for the sand-bentonite mixtures should decrease eventually as the bentonite content increases towards 100%. In the case of the S- PB mixtures, a peak 3'amax value at a clay soil content past 20% also would be consistent with the trends reported by Kenney et al. (1992). Thus, additional compaction curves were generated for bentonite contents of 30, 40, 60, and 80% to investigate this expected trend. The resulting ~amax values for these compaction curves are plotted together with the previously reported ~/amax values for bentonite contents of 10, 15, 20, and 100% as a function of bentonite content in Fig. 5.
The data in Fig. 5 for both the S-GB and S-PB mixtures indicate the expected trend. The data in Fig. 5 also indicate that the differ- ences in ~/amax values, or A'Yamax, for bentonite contents ranging from 10 to 20% are small relative to the overall A~/dma x for benton- ite contents ranging from 10 to 100%. For example, the maximum A~/ama x values for bentonite contents between 10 and 20% are only 2.1 and 9.2% of the maximum A'Ydma x values for bentonite contents between l0 and 100% for the S-GB and S-PB mix- tures, respectively.
As shown in Fig. 4, there is no significant peak in the trend of "/dmax versus bentonite content for the sand-granular bentonite (S- GB) mixtures, whereas the peak "Ydmax value occurs for the benton- ite content of 20% for the sand-powdery bentonite (S-PB) mixtures. However, the second-order polynomial fit to the data for the S- PB mixtures is essentially a straight line (i.e., third term in equation
Copyright by ASTM Int'l (all rights reserved); Wed Jun 17 14:35:14 EDT 2009Downloaded/printed byColorado State Univ pursuant to License Agreement. No further reproductions authorized.

448 GEOTECHNICAL TESTING JOURNAL
TABLE 5---Compaction properties based on third order polynomial fits to measured compaction data for sand-clay soil mixtures.
Compaction Properties a
Dry Weight Percent of Clay Values for Constants in Fitted Polynomial Expression and ~/dmax Soil in Mixture a Curing Corresponding Coefficient of Determination c
Test Mixing Period, w~t, No. AC GB PB Total Procedure b days A B C D r 2 N kN/m 3 ib/ft 3
1 100 . . . . . . 100 1 I 2.70 × 10 -6 -0.00207 0.217 2.61 1.000 5 59.3 8.75 55.7 2 10 . . . . . . 10 1 1 0.000395 -0 .0344 0.765 1 1 . 1 0.966 10 15.0 16.20 103.1 3 15 . . . . . . 15 1 1 0.000379 -0.0327 0.753 10.4 0.987 11 15.9 15.66 99.7 4 20 . . . . . . 20 1 1 0.000346 -0 .0324 0.787 9.78 0.955 11 16.5 15.51 98.7 5 --. 100 ... 100 1 1 0.000262 -0.0283 0.974 1.93 0.903 6 28.4 12.76 81.2 6 --- 10 ... 10 1 1 -0.000496 0.0186 -0 .200 16.5 0.988 10 17.0 16.06 102.2 7 "" 15 ... 15 1 1 -0.000143 0.000668 0.0754 15.2 0.961 8 14.9 16.03 102.0 8 ".. 20 ... 20 1 1 0.000261 -0.0201 0.407 13.6 0.997 6 13.9 16:10 102.5 9 . . . . . . 100 100 1 1 -0.000937 0.0901 -2 .84 41.6 0.984 5 35.9 12.25 78.0
10 . . . . . . 10 10 1 1 -0.00115 0.0416 -0 .447 17.8 0.999 6 16.2 16.61 105.7 11 . . . . . . 15 15 1 1 -0.000524 0.00839 0.0961 15.3 0.999 5 14.8 16.84 107.2 12 . . . . . . 20 20 1 1 -0.000188 -0 .0104 0.419 13.7 0.989 7 14.5 17.05 108.5 13 "-- 10 -.. 10 1 7 -0.000506 0.0189 -0 .198 16.4 0.999 6 17.3 16.01 101.0 14 --. 15 ... 15 1 7 0.000143 -0.0145 0.336 13.8 0.992 6 14.8 16.09 102.4 15 ... 20 "" 20 1 7 -0.000177 5.96 × 10 -6 0.1200 14.9 0.996 6 15.0 16.11 102.5 16 . . . . . . 10 10 1 7 -0.000868 0.0297 -0.287 17.1 0.898 7 15.9 16.57 105.5 17 . . . . . . 15 15 1 7 -0.00142 0.0507 -0.553 18.6 1.000 5 15.4 16.89 107.5 18 . . . . . . 20 20 1 7 -0.000144 -0.0131 0.468 13.4 0.994 6 14.4 16.97 108.0 19 "-- 10 --. 10 2 7 -0.00115 0.0483 -0 .626 18.6 0.988 7 17.8 16.27 103.6 20 "-- 15 --- 15 2 7 -0.000129 -0.00315 0.186 14.6 0.997 5 15.3 16.28 103.6 21 "-" 20 --- 20 2 7 -0.000673 0.0221 -0 .169 1 6 . 1 0.968 5 16.9 t6.30 103.7 22 . . . . . . 10 10 2 7 -0.00264 0.108 -1.41 22.4 0.999 5 16.5 16.75 106.6 23 . . . . . . 15 15 2 7 -0.00184 0.0708 -0 .867 20.2 0.995 5 15.5 16.91 107.6 24 . . . . . . 20 20 2 7 -0.00481 0.144 - 1.25 19.5 1.000 4 13.7 17.13 109.0 25 5 5 --- 10 Batch 1 -0.000349 0.0122 -0 .108 16.1 0.999 5 17.3 16.05 102.2 26 7.5 7.5 --- 15 Batch 1 3.86 × 10 -5 -0 .0114 0.334 13.3 0.999 6 15.9 15.92 101.3 27 10 10 --- 20 Batch 1 0.00186 -0 .106 1.93 4.32 0.976 5 15.5 15.86 100.9 28 5 5 --- 10 Individual 1 -0.00771 0.388 -6 .44 51.4 0.717 6 18.6 16.32 103.9 29 7.5 7.5 --- 15 Individual 1 -0.00246 0.115 -1 .72 24.2 0.971 6 18.6 16.07 102.3 30 l0 10 --. 20 Individual 1 -0.000487 0.0113 0.0303 14.6 0.900 7 16.7 15.97 101.6
~,prAC = attapulgite clay; GB = granular bentonite; PB = powdery bentonite. ocedure 1 = add water to sand before mixing with clay soil; Procedure 2 = mix sand and clay soil before adding water; Batch = add water to
sand before mixing with clay soil mixtures taken from a large batch of mixed clay soil; Individual = add water to sand before mixing with clay soil mixtures based on individual mixtures of clay soil.
CA, B, C, and D are constants in the third-order polynomial expression ~td = Aw3 + Bw2 + Cw + D, where 3'a is dry unit weight (kN/m3), and w is molding water content (%); r 2 = coefficient of determination; N = No. of compaction tests.
dwop t = optimum water content and ~/dmax = maximum dry unit weight based on ASTM D 698.
is negligible), indicat ing that the '~/dmax values for bentoni te con- tents of 10, 15, and 20% are interpreted essentially as scatter in the data in terms of the regression analysis (i.e., no t rend is indicated between 10 and 20% clay soil contents). Thus, accurate trends in ~/dmax values versus bentoni te contents associated with relatively low bentoni te contents typical of practice (i.e., <--20%) may be difficult to obta in due to the relatively small differences in these
"Ydmax values. As shown in Fig. 4, wopt for both types o f sand-bentoni te mix-
tures decreases with increasing bentoni te content regardless of the type of bentonite . This trend is not consis tent with the sand- attapulgite clay (S-AC) mixtures, nor wi th Kenney et al. (1992), who found an increase in Wopt with increasing bentoni te content. Also, the trend o f decreasing Wopt with increasing bentoni te content is not due to the two different types of bentoni te considered in this study since the same trend is observed for bo th types of sand- bentoni te mixtures.
The difference in the trend of Wopt versus bentoni te content for the sand-bentoni te mixtures relative to the S-AC mixtures may be due, in part, to the greater sorptivity and lower swell ing potential of the attapulgite clay relative to the bentonite, as indicated in Table 1. As a result, attapulgite clay absorbs water wi thout significant
swelling. This h igher water holding capacity for attapulgite clay is ref lected by a Wop t for attapulgite clay of 59.3%, whereas the Wopt values for the granular and powdery bentoni tes are only 28.4 and 35.9%, respectively (Table 5).
The t rend of decreasing Wopt versus increasing bentoni te content also may be related to the correlat ion between Wop t and PL pre- viously noted by Leroneil et al. (1992), and the correlat ion between the PL and clay particle content (% < 2 p,m) for sand-clay soil mixtures previously noted by Seed et al. (1964a, b). In terms o f a correlat ion between Wop t and PL, Leroueil et al. (1992) indicated that Wop t ~- PL for natural clay soils (i.e., as opposed to sand- bentoni te mixtures). As shown by the data plotted in Fig. 6a, the correlat ion between Wop t and PL for several compacted clay soils is close to l : l , but there is s ignif icant scatter in the data ( r 2 = 0,732). Also, as alluded to by Leroueil et al. (1992), Lambe (1959) had cri t icized the assumption that Wop t ~ PL on the basis that the correlat ion be tween Wop t and PL is not unity for pure clay minerals. This cri t icism is supported by the data in Fig. 6b that indicate Wop t
0.5PL for pure clay minerals, a l though there is less scatter in the data in Fig. 6b (r 2 = 0.951) relative to Fig. 6a. Thus, there appears to be a correlat ion between Wop t and PL, but this correlat ion is not consis tent be tween natural clay soils and pure clay minerals,
Copyright by ASTM Int'l (all rights reserved); Wed Jun 17 14:35:14 EDT 2009Downloaded/printed byColorado State Univ pursuant to License Agreement. No further reproductions authorized.

HOWELL ET AL. ON CLAY SOIL MIXTURES 449
(a) Attapulgite Clay (AC) 9 ~ I . . . . I + , , , I , , , , I , , , , I , , , , I , , ,
" ~ ' , ' ÷ + + ' , - + - ; - + ' , . . F . ~ ¥ ~ , - + - , - . + - + - - i . + + . + ~ _ . ^ ~ : i . ÷ . , + | . + . ! ' ~ + ~ ~ . ~ : ~ . + ~ | . ~ . |
l= 00"~. ' * ' ) ' * '~ '÷ ' .~ .~ . :~ '~"~.~ .+k-~.~ . .~-~ . -~ .~- - )+-~ • : . -~-~+÷+-H-++..-+-" .:. '+-:.** ".:..:.:-.;+=: + • • ~+÷.+-+- +'+- $.+.+4- -+-&~-4+'.;
• a b - - , . . . . . . , o ' + . ~ " +.°, . . . . •
u-~.÷.,.+.,.+.,.~:i:#.,+.,.~.+ ~= -I-+.=..**..~ . * * . + . ; + . ~ , ~ ~ p ÷.+~.i.÷.Ir+~.;+.=.. • t k + ; - ÷ - ' - ÷ + " . i 411+++ " ~ " .L .~..+~+.+~..;.:..: ";+
o~ : t - ! - t - . % + + ! - + ~ ~ + ,- .~.+: -,.~+-+4~-;•~-+ "$ ,,: ~ + : : : + : ÷ : ~ : ~ : : . ; . ~ + + - * * o . +. ; . ÷ . ..p..+L÷.~ • " •~+ - P < . • k += 8 2 : ~ + . , . ~ . + + : + ~ + : + ~ + . + . ,
;= : +:~:+:÷ "'~. "t:':
t - -=-e-:+-.: .*t . ÷ . t . - ~ - ¢ - 1 . + - . . : . ÷ . . L " 7 ~:_ I - " ° l ' f ' * ) ' ÷ * l ' 4 " ' | * ÷ ' t * 4 + ° l ' ÷ ° l " ) ' < " | ' ¢ ' ° l + ~ ! i ' ; ' " ' . = . 4 - ' 4 * . : . . ' . | . . % 4 . * * . . ' . ; + . . . . . . •
, . v ' ~ ' ' I ' ' ' ' I ' ' ' ' I ' ' ' ' I ' ' ' ' I ' ' ' '
3 0 4 0 5 0 6 0 7 0 8 0 9 0 Molding Water Content, w (%)
(b) Sand-Attapulgite Clay (S-AC) ! 5 7 . 3 1 , +w.~.~.L:.,., ~.u,+.~.L~•p..,.L~•~.~.H.~•+.~•L:.~N" • v,+.,.,
+ + + +
;-i-+-÷+-+•;-" " ' ' 41-;•<-+.;-~-i-+.+•;.i•i-;-++•+-i-+-' i ; ~ t +++-,~;.~, +.;.+.~+.;.+.+.;.++.;.+.~ 0 1 . 9
,.., .+.L+%.~.~+..i:+':i:.t..i.I:i:P.L+:J:+=:P..t.+
+:.i-+ - '+. . ' -÷÷'++,.~÷-+•:- ' - i -'..~" + i - i -÷÷÷- : - i •÷ i " t~ . . - ~ ~ ~ : ~ + . , ......... +.,.+~ . ~ :• .-" L : . :+÷÷ .H,+ . : .= . -+÷ . . . . • ,.,.;.:.:J..L-.:.:+~ ,,.= ~ ' ~ ~ + : + - + - - + . , - + - + :;~, +-
. ~ 1 4 - 1 + + ' ~ ' : ~ ' i ' * : ~ J ~ +-.L+~÷÷-+-':-+: , ,.,-~ 9 m+ ".,t I : + ~ " i".,'~tl~:~..t.":+:b;+"l . . . . +
i 2 . 2 ~ +.: - : ~ " .~ .+ ".=-++.+,~ . . . . . . +3 = + " ~+, +I - - = - ~n~ ~ - i : ~ - t ¢ r + :++ +2.8 .= Z : : ; ! + 1 0 % At,,.; [ , : ] : ÷ : [ : : : : : l l ~ : , : ; : ' . ' ~ ¢
1 . 0 ~ +;'+~ ~ -,+o,_ - , - , H-,.,+.m.;++4.;.~+'+ :~ ~+-'.' i ' l l - 1 0 7 0 / '~,~, ":-.:'÷+'."-F÷÷÷'.L'-.;+I
~+.7 ~ i ~ I t,.,++.,.,+++.+~?+ 4 ~, - +i:[ ~ - - ~ - - 20% AC +j:~t~,:i:j:.~+~,~:~ =t " O .:..; . . . . . . . . . .+.÷÷÷.:++:-÷÷.,L+:.+..~
~ i i ~ + . , . + . + + , . . . . . . i . , .+.<. . '~
48 .4 5 1 0 1 5 2 0 2 5 3 0 3 5 4 0 Molding Water Content, w (%)
(c) Granular Bentonite (GB) l " : l " J + l , , , , l , , , , l , , , , I , , , , I , , , ,
~ e ~ l l I t a I I I I I I I I i T I I i i + ~ i i I r
:..;+.:..;.•:•.= .~.,:,..,:..L•L.z.•L-.L.+L+...~ : • ' . _ : ; • . ;.•Li-.~.'..•'..LL..'..L .:..; • =..'•z_. ' . . . . . -.LI':
+."--~•'--i--~--~.~.-'~.i.-~-" " : +--'•~ ~+++"'-~.-~4. ~ 3.0~.'-+-+-+-+.-~-+..+--+-.~.~%-+.~" ;':+.:~.+.+. + .l..p+..+~.H.+_~.•::tt,~j+. += . .~ :+~p~ .+..+: ..: .+..+b+•+
v 1 - ! - p . ! ! l - [ . . t • l , , + , , ~ r +..~...~(~p+tp ;.•+.++..+.~.4+++ • o 1--!--!-+•-!--p~••v--+-.c,..p+.--<+-÷•~-.+.+.÷.+++,,•÷-.~,.;.•+•
~-- +, .. ,,+-i-.,--P. -;--,•-~•+-+.-,.-+-+--+-.+-+-+-+.+-+..+•+.-•+[+...;. . ] z.B-l~.~+•,•.+..i-i•~ti.+.+.+.+•+.+++.+:.+.+:...;~4•
' *" + + - ~ : - i . • i - L . L L • : .+. .L: . . .+.•$. .L, . .L+. .L.L . ' • , " : . : : : . . . . . . . . . . . . -~ ,
• , ,.: --r-r•T-:.T--TT= 7 • }¢ 1 2 . .-;- +.-+.+++-+-+-.
:5 + + - + ~ • . + • + - + ~ - I - - I . . . . . . l - - l • • l . . l . . i , - , l I 4 4 , '{+, + ÷ + + + + ) ) • . | | . , , , , , ' + , " , ' • , • • - , * , * , - , - . - • . , • • 0 • • ~ 12 a - T ~ : : , . ~ . + ' ~ + • . , . + . ÷ •
r. .- • " 4 . . i . . | . ~ . ~4.+.~,~.L.L4• o ÷ - + - - t - ~ . +++4- . .~ .+ .
• -. ' -=- "-.+-;+.+..+.." ;+.=-.+.+L.: ."-.~.~+.L : . 3 ~ . : .
2 0 2 5 3 0 3 5 4 0 4 5 Molding Water Content, w (%)
(d) Sand-Granular Bentonite (S-GB) 84.1 ~= ~ ~ . . . . ~ . . . . ~ . . . . ~ . . . . ~ . . . . ~ . . . . ~ . . . . ~ ~ , ~
. • v . ~ , ~ • [ • ~ . L • [ • ~ . . ~ . ~ . [ . [ . ~ . . ~ . i . [ . I • ~ + ~ , . [ . I . ] • + ~ • [ . I . I . . ~ . : ~ , , ~ . ,
~,, "'E ++.-.+++.+..:'•.;++.i.~.+.~++..'.~.~.+.+++'•i.i.+.+++'.i.+.+.~+~ ~,= :em.e -~ _ - I - t - ~ - . : ~ H - ' + - ~ ' ' ' : •'-'--= "+ ++-+~++-H+~÷+,'-+-::
+ , .+ v l•+~+ 4 - l - + 4 . - k - l . l t . l • o 4 . + - l + I - I - ÷ ~
+
. t,,- ;•'~++.H•i.'~++•';.i.+.# - : ' 81 .5 . ~ ~ -+.-+.:.+.,'.--÷" •k.+.+•+++•;.. ".~--•L~i.z z -.+.'.'•-z: +" : = + : : : t i + : : : = : : : : i : : [ : : ! [ + : t t + i i = 1 5 . ~ ~ ~ - - - • , . - : . - - . . T'-r-- .+-+ . . ~ 9 8 . 7
+o+ + "+ + ~ , -I- ~ + . ; . ~ - + ~ + L ; + ; - ' : ! ~ $ 4 . i . ; . ~ + $ +.~++++.;.+L;-I- > . l . '~+.+.++.io+•+.+.i . .~i i• i++•+. .~+.u-
'~ -~ ~ . . . . . . ::-+"_'+_+R+•+.+.+,:-'+.+-+-+-++~- ::) :~ 1 5 . 0 ~ + I 0 % G B ~+'1"+"++'H'+"+,.--.:.~..~95.5
. 7 9 . 0 ~ ~ , -~I ~ " 1 5 % G B |-.'.'.e.+.j.t.+~.i.j.t.p++ 0 44 .++~o/~_o l+z+•H-+•++:+-;•++++.~-I -
- 1 4 + a r - ,~u /o , .+u t.++-;++.+•'~+~,.+•+.~-~+-~-~L 7 7 . 7 + , , F_ I ' , , , , , , , + + , , , + + , , , , , ' , ; ; ; ; I ; ; ; ; t ; ; ; ; I , ~ ¢ ~ +
5 10 15 20 25 30 35 40 Molding Water Content, w (%)
(e) Powdery Bentonite (PB)
+ i t . . " l r I I I I I I I I I I I I I I I I I I I I -I-., ........ +..( ....... ,..,..+ . . . . . . . . . +-J,&+,'4- ' . ."+,. +•Fi.-H••p.+..+•.+..;-+.+..+..+.+.~++,++~m+.
• -.i-•~-- -•=.. --i.-i+'. .$.;-•+.." " + + ÷ + + E ~ , . ~ . . . . + • ' " • " ' • " " " " " - " _ t : i ........ ,..,••,••,..,..,..+.,•+..~ .~ . •~- i :~:~:L • ~ 1 2 -"'I++I~--I-I--I-':--I'-'--I•-L'---L'~--"S+=-'L-L-L-L~-~--I-+t- " ~ "-4.. i . .L**'••+ .I.+| . : . . L L + . . L • L L L .:,+' ; .~ .~ : :
"~ +-I-+,;--:-.:--,+..:-:+.:+-;..:.+;+.:++;+•£.:.+ " :+;•.".=++L-.-:+.+ P - ~ + +.- =•- L L :'-+ L-+++•-:.. -*+-. +" • ~- £ • £ +: -: .~.~.+'.'•3..L., _.,+.
• + . . . . . . . . + . . . . . . . . . . ~t " ' ,.~ ~. " ' ' " • : : , : : +•1"~ "'': '•:'" T" .•'.":"+='••[" ~, T:I ........ ,-•~,-•,..,-+,.+•,+-~'+4":~+ .......... , .... ~..i.•i••i•.i.•|.'ti.•+..i..i..Z.•i+q•.;.. ; . •$.$. $ .4.3,•$•.;.4•4.+ i .
+: 1 2 1- ~:..;..;..,.++..t.+.•z+.L~. +.+..+..+ +. =
. • , , , + + , • . . . . . ++
"C; I.+.:•.;.-;+.+..=..:.:+..:+++.~.:+.L+&..L~.~..~+~.-:U•.:• : . : 3_
:o l : : h : : + : : i : ~ : , ' : ~ : + . . - +.::-.~ - ~, 12.o. H + + - i - ~ . . . - : ' ~ - - ~ - + : : . " : : : ' : : : ' :
" F i : i - i . - ~ ~ ~ : ~ . . ~ . . ~ . . ~ - r + . , - - r - ; - - t - ~ ~ + . . + . - ~ . - ~ . + - . ; -
, •H--*--<-•'--i--i--+--+..'--+•-;+.+~+;..'-+•+--;.+• •.+•44+++-
(t) Sand-Powdery Bentonite (S-PB) 7 9 . 0 . . . . 1 7 . 5 t . . . . I . . . . I , . , , . . . . l . . . . l . . . . I . . . . l 4 t 4 = L~.~ : +, I.L., .,./.LL,.! I , , , IIP : !1 ! " ' " ~' : ' " " ".'+'
~ ' o - H . - - : ' - ! - I * ; - - ' . ' . H • [ o " I " ~ ' T * "++" ++ " + , " l q l T " : ":+". ~" , 0 • 78 .4 ~ 17.0- . . . . . ~•~:, .~=~ ~ - 1 0 8 . 3 • .+.;.+..~+•~.; .+.~.'•+•, -- A- - 20 ~ PB
= . . . . . . . . . . . .
o ) 1 6 . 5 - - { .+ .~ , "~- - . j - l - { -~- '4 - ioW4-~- i • { - { •~ l .~-~1-105.1
:.77.1 -+-= : .-+-i-+-++.:-+-+-}-i++~+:'+:'-i-+-i•;+-~-+ .+•. + •H•+.++ ++.H++÷+.;.+.+.++ + "~ "~ .+.~-++. +:+-+-+÷+>+-!.,-+, H'+-++++.-H.i.++++-H+++" "~ o ,+1 ,+
7 6 . 4 ~ O •!•~•a.'-.'..:.u-.'..:.~..=.=..ii~i[ {!i~!!{
4 5 0 GEOTECHNICAL TESTING JOURNAL
Sand-At tapu lg i te C l a y ( S - A C ) _ - ~ - S a n d - G r a n u l a r Benton i te ( S - G B }
- S a n d - P o w d e r y Benton i te ( S - P B )
Z .=
C
C 0 0
E E tn
0
5 10 15 20 25
Clay Soil Content (%)
.'-" 17.5 ' ' ' = I , , i , 111.4 I i i E , w i i ~ I ~ I T ~ I i'"'~ !.L, E P'-~.-~-,+-~~ ~ . ~ - - + - - - ~ - ~ - - : : i ~ • " : . " : ,
z iii I_...L J - _ ! ~ E i " i i i, | ~ " " i _
J e, 1 7 . 0 . 1 - - I - + - - + . . . . . . . . . . . . . . . . . . -~--'--~-~.'-,--4-:"'~4~.-4--~---~- " - - 1 0 8 . 2
i ~ i i ,," i I i i ,, i i i i ! I-.--' _L . . . . . . . . . . . ~ - l ~ . i ' ~ . . . . . - 4 - . . . . . . . ' -
t"-l~-t--~'--!""~ i.--'~ ~..t---4----i---~. .-,,~.~. .4---~-----4----I-.--i-.--.~----i ....... ~: 16.5- " . . . . . . . . . . . . 105.0 - - , , f - - i . . . . + - - - . ~ - - ~--~ - - - - t - - , - - ~ - - - ~ . . . . . - - l - @ - . . . . . . . . . . ; "
L.....L_! i ~ I i ~ i i I i i i i i i i l : : : : ) t " t - - t ' , ' - ~ ! - - - ~ : - - t - . ~ ~.-.~-., .----+-~-~ ............... t--1-""r .....
I l i i t i i " k i i i t t i I i i i ! t ~ 1 E~I rP"-1 ~ ' / ' ' ' ' 1 - - f - ' ' I ; i " " ~ i - - - ~ - . , t - - - - ~ - . , t - . - - - l - - - i "~.d .." i t i t t # i:" .-t-.4-----.-=,----i-i i i -" . . . . E • ,~ " - " - - t - f - i - - i ~ , , --4,--,'---,.'~-+-:=--4-~--'---:'---~"---÷------÷""--~ ~-,i. ~ i ~ ~ ~ , ~ ~ ...... "-x
" " ' ~ " " - C ' ' ~ - - ~ . . . . "~ - - - - t . . - - ~ . * ~ + . - - . - . . ~ . i . ~ . . ~ . . . . . . . . . . i . . . . . .. i . . . . . .+.t..-.-. ( l i
i ! i l I ,~ i ; ~ i i ; i l ;
I 15.5 ! ! ! ! # ~ ! ~ I ÷ ~ ~ i ! ! 98 .7 5 10 1 5 2 0 2 5
Clay Soil Content (%)
FIG. 4---Influence of clay soil content on (a) optimum water content and (b) maximum dry unit weight for a one-day curing period and Mixing Procedure 1.
and no such correlation between Wopt and PL has been established for sand-clay soil mixtures.
In terms of a correlation between PL and clay particle content, Seed et al. (1964b) evaluated measured plastic limits of various mixtures of a washed sand and several processed clay soils (benton- ite, kaolinite/bentonite, and illite/bentonite) at several clay particle contents (% < 2 l~m). Seed et al. (1964b) found that the PL of the mixtures initially decreased with increasing clay particle con- tents to a minimum PL of approximately 20 at clay particle contents ranging from ~30 to ~40% after which the PL of the mixtures increased and ultimately approached the limiting PL value associ- ated with the processed clay soil. The initial decline in PL with increasing clay particle content was explained by Seed et at.
(1964b) as due to the dominance of the nonclay fraction of the
mixture at relatively low clay particle contents (i.e., -<40%) wherein the clay particles are filling the void spaces between the load-bearing sand matrix. As the clay particle contents increased, the sand particles are displaced such that the mixture consists of sand embedded in clay, and the PL of the mixture accordingly increases with increasing clay particle contents.
An evaluation of these concepts for the compacted sand-bentonite mixtures considered in this study is represented by the data shown in Fig. 7, wherein the PL and Wol~ values are plotted as a function of bentonite content for all sand-bentonite mixtures, including the additional mixtures corresponding to bentonite contents of 30, 40, 60, and 80% that were developed to evaluate the 3'amax trends previously
Copyright by ASTM Int'l (all rights reserved); Wed Jun 17 14:35:14 EDT 2009Downloaded/printed byColorado State Univ pursuant to License Agreement. No further reproductions authorized.
HOWELL ET AL. ON CLAY SOIL MIXTURES 451
1 9 . 0
1 8 . 0 .
P.'= 17.0- z: • ~ 16.0-
1 5 . 0 -
g 1 4 . 0 - E
E 1 3 . 0 - x m
1 2 . 0 0
, i : : : j . . . . t , , , t , , , 1209 ; ; " ! i • • • ! • • • I . . . .
I + S ~ l n d - G r a n u l a r B e n t o n i t e ( S - G B ) ]
- C~ - Sand-Powdery Bentonite ( S - P B ) ' 1 1 4 . 6
..,¢~ 0 ~ Y,~ (kN/m=) = 17.5 - 0.0515C 108.2
" ~ (r==0"972) -101.895.5
",. ~ 89.1 Y,m, (kN/m=) = 16.2 - 0.00777C "-.
-0.000258C ' (d=0.991) -~. 82.7
: : : | : : : ' . . . . . . . . I ' ' i t I i I 76.4 I 1 ' ' ' I ' '
20 40 60 80 100
C l a y Soi l C o n t e n t , C ° , ( % )
"6 o .
i E
e-
¢D
c-
a
E
E x
=E
FIG. 5--Influence of bentonite content on maximum dry unit weight for a one-day curing period and Mixing Procedure 1.
A 50
¢ . ° 4 0 -
o C o 30- (3 _=
20-
E E 10
• . . , I . , , ¢ I . . . . I . , , • I , • •
v/ap t = 0.940PL (r 2 = 0.732) 0
/ /
/ 4
/ (a) /
0 : : : : : : : : : : : : : : : : : : : : : : : : 0 10 20 30 40 50
Plastic Limit, PL (%)
Daniel (1984) A Boynton and Daniel (1985J • Day and Daniel (1985) • Mundell and Bailey (1985) O Stewart and Nolan (1987) A Daniel and Benson (1990) [ ] Elsbury et al. (1990) <~ Leroueil et al. (1992) ~7 Ben.son and Trast (1995)
160 ~°
120- E o (3
8 0
~ 40- .E_ 0
. . . . . . ' . . . . . . . ' . . . . . . .
w,p t = 0.446PL (r2=0.951)
0 : : : : : : : I : : : : . . . . : ; ; 0 40 80 120 160
Plastic Limit, PL (%)
O Na-Montmorrillonite (Lambe 1959) A Fe-Montmorrillonite (Lambe 1959) [ ] Na-Iltite (Lambe t959)
Fe-Iilite (Lambe 1959) • Na-Kaolinite (Lambe 1959) ,&, Fe-Kaolinite (Lambe 1959) [ ] Attapulgite (Lambe 1959) • Na-Montmorillonite (Acar et al. 1985 V Ca-Montmoritlonite (Acar et al. 1985
FIG. 6--Correlation between plastic limit and optimum water content for ( a ) natural clayey soils, and ( b ) pure clay minerals.
Copyright by ASTM Int'l (all rights reserved); Wed Jun 17 14:35:14 EDT 2009Downloaded/printed byColorado State Univ pursuant to License Agreement. No further reproductions authorized.

4 5 2 GEOTECHNICAL TESTING JOURNAL
4O
~ . ¢ g 35- 0 .....T . j c a . ~ 30-
-~ e 2 5 ! .__.
0
1 0 0
: : i : : ; ~ : : : ~ : ; , t ' :
--1~-PL ] (a )~
PL = 30.9- 0.55,C= + o.ooe2,cd (: = 09r2) / i
qoE -o - o - -
, . w,p,= 17.5 - 0.166C== + 0.002660~2 (r = = 0.920)
. . . 2 , , , , I ; : : : . : : I 0 4 0 6 0 8 0 100 Clay Soil Content, C (%)
40
,. ~ g 3 5 . O ,,..r
30 .
~ 25-
E ~= 15- O
10 0
: : " ~ = : : : : : I , I I I ,
PL ] (b)
-E::} - Wop t / /
0.3~c= + 0.00429c~ (~ = o . 9 7 2 ) / PL 28.0- / /
El"
w =19.2-0 .321C +0.00473C 2 (i,2=0.961) : : , I ~ , , , , i ' ~ I = ,, ,, , , , , , : ; ', ,,
20 4'0 60 80 Clay Soil Content, C c ~ (%)
O0
FIG. 7--Influence of bentonite content on plastic limit and optimum water content of (a) sand-granular bentonite (S-GB) mixtures, and (b) sand-powdery bentonite (S-PB) mixtures for a one-day curing period and Mixing Procedure 1.
described. The trends in PL versus bentonite content for both the sand-granular bentonite (S-GB) mixtures and the sand-powdery ben- tonite (S-PB) mixtures follow closely the same trends described by Seed et al. (1964a, b). Also, based on second-order polynomial fits to the data in Fig. 7, a minimum PL of 18.5 occurs at a bentonite content of 44.7%, corresponding to a clay particle content of 33.5% for the S-GB mixtures (Fig. 7a), whereas a minimum PL of 20.3 occurs at a bentonite content of 42.3%, corresponding to a clay particle content of 35.5% for the S-PB mixtures (Fig. 7b). These minimum PL values and corresponding clay particle contents agree very closely with the values previously reported by Seed et al. (1964b) for similar sand-clay soil mixtures.
The Wop t data in Fig. 7 also exhibit a slight initial decrease with increasing bentonite content followed by an increase in Wop t as the bentonite content approaches 100%. Based on the second-order polynomial fits to the data shown in Fig. 7, a minimum Wop t of 15.1% occurs at a bentonite content of 21.8%, corresponding to a clay particle content of 16.4% for the S-GB mixtures (Fig. 7a), whereas a minimum Wop t of 13.8% occurs at a bentonite content of 33.9%, corresponding to a clay particle content of 28.5% for the S-PB mixtures (Fig. 7b). However, the general trend of decreas- ing Wopt with increasing bentonite contents from l0 to 20% is so slight relative to the overall trend in the Wop t data that any quantita-
tive conclusion regarding a correlation between PL and Wopt for bentonite contents between 10 and 20% is premature. For example, the regressed minimum Wopt value for the S-GB mixtures of 15.1% is greater than the ,/neasured wo0t values for the same mixtures containing either 10 or 15% of granular bentonite.
Finally, the measured Wopt values for the S-GB and the S-PB mixtures are plotted as a function of the corresponding measured PL values in Fig. 8. As expected, most of the data are between the regression lines based on natural clay soils (Fig. 6a) and the pure clay minerals (Fig. 6b). However, no simple linear correlation passing through the origin is apparent. Thus, even though there appears to be some correlation between Wopt and PL that may explain partially the initial decrease in Wopt for the sand-bentonite mixtures evaluated in this study, no quantifiable conclusion can be made in this regard from the results of this study.
Effect of Curing Period
The standard compaction curves (ASTM D 698) for Test Nos. 13-18 (see Table 5), performed to evaluate the effect of curing period for the S-GB and the S-PB mixtures, are shown in Fig. 9. Curing period refers to the time allowed between mixing and compacting the sand-bentonite mixtures. The compaction results for the one-day curing period using Mixing Procedure 1 are repre- sented by Test Nos. 6-8 for the S-GB mixtures and Test Nos. 10-12 for the S-PB mixtures as previously presented. The compac- tion results for a seven-day curing period using Mixing Procedure 1 are represented by Test Nos. 13-15 for the S-GB mixtures and Test Nos. 16-18 for the S-PB mixtures. The trends in Wopt and "Ydmax values versus bentonite content for all of these tests are presented in Fig. 10.
As shown in Fig. 10a, the general trend of decreasing Wopt with increasing bentonite content for the seven-day curing period is the same as that for the one-day curing time. Also, except for the S-
40
30 Q.
e "
O 20
E E 0. 10 0
Regression Line-Natural Soils
. . . . . Regression Line - Pure Clay Minerals
[ ] Sand-Granular Bentonite (S-GB)
• Sand-Powdery Bentonite (S-PB) []
0 10 20 30 40 Plastic Limit, PL (%)
FIG. 8--Correlation between plastic limit and optimum water content for sand-granular bentonite (S-GB) and sand-powdery bentonite (S-PB) mixtures evaluated in this study for a one-day curing period and Mixing Procedure 1.
Copyright by ASTM Int'l (all rights reserved); Wed Jun 17 14:35:14 EDT 2009Downloaded/printed byColorado State Univ pursuant to License Agreement. No further reproductions authorized.

HOWELL ET AL, ON CLAY SOIL MIXTURES 453
(a) Mixing Procedure 1 with 7-day Curing Pedod
] - - - - 1 1 ~ I . = = , t . . . . I . . . . . I . . . . . I . . . . I ~ ~ /
~ 1 7 . 0 ~::,::~::::::~:.'r--~-~.~.-.:-.-:-I + 1 0 % G B ~ .................................... 108.3 ~ 1 6 . 8 - ~ . " .................................. ! E] 15% GB [L-~-107.0 _o ... 16.6-~-:-:.-:~:~iiiEi:='~iEi'::i:::~::lt - ~ 20 go GB_____~ 105 7 . . ~ ~ . +----:--- .,:--+ .,r • ~ . O . ~
13. ~+~̀+~-+~-̀ ~̀,+̀'~=+-++~+t..+~+~+-~+~̀'~-+'~++t+~̀ ~̀-̀~+++~'r+~.'~;'+~̀~.:L~+-+-+-+-+-+-+-~- 1 U R ' . D . ~ ° ~ - ' b - ~ + ~ * 4 " ~ ° i ~ + ~ ` ~ ' ` + b ~ ' 4 ` ~ 4 . ~ - ~ ` ' + * 4 ~ ` P + ~ + ~ h ~ ' ~ , + . - 1 6 2 . . . . . . . . . . . . . . . . . . . . . . . . . . . . . . . . . . . . . . . . . .............. ; ; ~ ................................... ~ ......... ,. 1 0 3 . 2 ~
- + - + - - - + - . . p + - f - + - - - ~ + . . . p - . p . p . . f - 1 . + . p + . p . . + . ~ + + . l . . . p . I . - - + . . + . - p . . p - + . . . . p . . . . . + . . + . . + . . . . + p . + . . - . + . . . p - - • = 1 6 . 0 - : ~ + + + i - - , - . + ~ + + .................. + ........... 101.9+.,,. ~ . . ' t . . . . . . . - ; - . . + . + ° . + p + . . . p . . . . . . . . . ,
1 5 8 ~ + ~ ~ + ~ . . . + . , - ' . - . . ' . . - ,.- 1 O 0 a
---_ 15 .6 " ~ j ~ i i ~ ~ " ' + ' * ...................................................... ................ r.: ~- 99 .4 = . , - . :~:::`1~:~+':~`~L+~-~`++`+~+`.~'-`'~..+.-~`...'~..~`.~++-~.~+.~.~."÷.~+~'...~.~`~ . . . . . . : : 3 | ."'I ~ + + " 1 ~ ' + " ~ - - + " - + t - - = + . - ~ - - ' t . . . 1 ~ . + - - + . ~ 1 . - - I . - - < + - - . ~ + * - 1 . - - ¢ + 4 . . . ~ o .....i...+.I++o..~. ++ _ ¢ . . ~ , . . . . :~::̀ ~+'~::~+.̀ .'̀ +-+..'~,-+ .̀++-.+ '̀-̀ ~+'.~+~+~+.~'~..+~-.~.:y~.+÷-~-'+...+.~- +d~. 1 .>.
k - - - - ~ + ` + ~ ` " ~ = " ` ` ~ + + ~ - ` ~ ` + ~ + + ' ~ . . ' + ` ~ ' ~ * ` ~ . ' ~ ' ~ ' ` { ~ + ~ ` + + ~ 4 P . ` ` k ` ` d ~ ' ° ` ~ t ` + ~ - ÷ + " , ' + . . . . . ~ -
c 15.2-~-p++,r.:-+r.+ + ....... ~--~: . . . . . . . . . . . . . . . . . . ~ . . . . . . . . . a a mc., , - + . . . . ~ . - p . . . . p + + + . . . p . + + ~ _ . + H . p . + ~ . . p _ ~ . + . ~ + . + _ . p . . . ~ i ~
- + - - + - . ~ + . . p - + - + * . * ; . - . p * * + + p + ~ . - p . + - p . + p + = p - + . . + . - + . . . . . ~ . . . . . . . . . ,
- ~ ! i ---~ = 95.5 15. o :::::::::::::::::::::::::::::::::: 1 ~t I=t ::::::::::::::::::::::::::::::::::::::::::::::::::::::::::::::::::::::::::: : ~aA ,'~ + - r ' ' s I . . . . I ' ' ' ' I . . . . I ' ' ' ' | ~ ' ' ' O 'H I ' . i d l
5 10 15 20 25 30 Molding W a t e r C o n t e n t , w (%)
(o) Mixing P r o c e d u r e 2 with
(b) Mixing Procedure 1 with
Molding Water Content, w (%)
109.5 108.3 107.0 o~ 105.7 104.5 pY 103.2 .~ 101.9 .~ 100.6R 99.4 -'=- c "
98 .1 :3 96,8 ~' 9 5 . 5 9 4 . 3
(d) Mixing Procedure 2 with 7-day Curing Period 7-day Curing Period
17 9 J . . . . i . . . . i . . . . t . . . . i . . . . , t n a ~ J . . . . i . . . . t . . . . . . , . . . . 1 9 5 17.2 ~. ............ +-+-;-'-.-,-.,~--÷;---::,.J.:-!~-L .............. ÷ ................ ~ 0 . :1:-,-.,..++...::1:-,-+.....+"~-,__,_. • -+ . . . . +'÷", .".-=:t: ........ -= . . . . . . . . . . . . . . . . . . ~ ...................................... + ...... . . . . . . . . . . . . . . . . . . . . , . . . . . . . . . . . . . . 1 7 0 ................................................................... 1 8 3 ,, 17 .0~.- ; ...... _,.,........-.= ............... I - - I - - 1 0 " / , G B 1 ~ 1 0 8 . 3 ~ .-~..~ .................. ~ ~ ........................................... ~ 0 .
. ~ - ' : : . ~ :E : . 'Z := : . . - . ' : : . ' ~ . ' : . = . . ~ . 7 ~ . ~ . - t - " " ~:" . E " " + : - + " " * - ' : " - • " ' ~ ' - ; " " " * ' " : " " " " " - " " - ' : " " ° * ~ " ~ " E 1 ..................... ~ . . . . . . . . . . * = 1 6 . 8 : : : : : : : : = . : : : : : : : . ~ : : . - " : : : : : : : . ~ : : ' : : : : : . ' : . ~ : : : : : : 1 0 7 . 0 o -,. 6.8~_.~_.~...+..~ ...................... l - E ] 15%GB~.:.~107.0 C 2 16.6 -L%'~--::::~==:--"z'--~: . . . . . . . [ 20*/0 G B ~L--~.. 105 7
:1:~ . . . . . . . . . . . . . . . . . . . . . . . . . . . . . . . . . . ~. : : : : : : : : : : : : : : : : : : : : : : : : : : : : : : : : : : : : : : : : : : : - - o. ' - " 16 :-T'~':-::::*::::::~-:l-d:::::*=:::::::*::~::::*'- '+::::=t - 105 7 "-"
. . . . . . . . . . . . . . . . . . . . . . :r- 16. 104 .5 ~ ~ ~ 2 ~ - - ~ 16 2- - , - . ~ : ' - ' : : ' = - ~ : - - ~ . . . . . . . . . . . . . . . . 1 0 3 . 2 16.2 -. ~..2~.-.~ ~ 103 .2 ~ "==- =:~--~:;::"~="-~:"" 1""
. . . . . . . . - ~ . --~:-=.:-~-~- . . . . . . . . . ~ u ~ , a) c , 16.O- ~ ;-'-.:--;!_::-'~.-".-i~.:-101.9"~ . . . . . . . . . . . . . . . . . . . . . . . . . . . ~ . . . . . . . . . . . . . . . . 15.8u ~ ' - ' ~ 7 . - ~ ] T l l : - ~ : : t : - + ~ , ~ - : = : : ~ : . ' r " - 1 0 0 . 6
_z - : . " ::::.::.~.~.-_._.::.:.."3+'~"~E-.--:--.'--:-.-~.--~--= ---. . . " ~ ' " ' " ~ ' - ' : - " "E~ .~ 15 .6 : : ~ - : ; : - - t - ~ : : : ~ - ~ < . = i ~ : - z : ~ . : : ~ : ; : ~ : 9 9 . 4 :~ 15 .6 - ~::E:E? ....................... -~-~::L-..--_--~"..~.=::-::~.z.:..-'ii~- ~ . 4 c , = , . . . . . I - - - I - - 1 0 % P B | . . . . . . . . . . . . . . ~ . . . . . . . . , , , :3 1 5 . 4 - - ~ _ ~ - - t = I - - - ~ . . . . . . . . . . . . . . . . . . . ~ . . . . 98 1 "~'-""~ , :==...~.=:::z:.r_-+.,z_.::::
:-~_.T_.~=- _~- - ~ - ~ . . . . . . . . . . . . . . . . . . . . . . . . . . , ~ , , : :.~::.=-,:1 - - [ 3 - - 15 '~ P B ~-±:±::-r.-,.L-=-m.~::: , , , , ,, ~ ' . _ . . . = . _ : . z ~ . _ ~ _ ~.z.~.:~_~...2_ . T _ . ~ . . . . , . . 3 . ~ . r . . ~ : : ~ : : ~ ~ ; J " ~ " ~ - , - + + " - ' ~ o - - + - - ~ " ~ " - + - - ~ - , ~ + - - ~ o
~" 15.2 - ~ - ~ : ~ - ~ ~ d _ ~ - - _ ~ . _ + . ~ - . ~ - ~ - ~ - 96 8 = o.¢- ....~-_~.~.~ - onoL ~g k ~ - ' - : - ~ . ~ - ~ : ~ . - UO.O
5 10 15 20 25 30 5 10 15 2 0 25 30 Molding Water Content, w (%) Molding Water Content, w (%)
FIG. 9- -S tandard compaction curves (ASTM D 698) for sand-bentonite mixtures based on two different mixing procedures [GB = granular bentonite; PB = powdery bentonite].
GB mixture at 20% bentonite content, the difference in Wop t resulting from the different euring periods for the same sand- bentonite mixture and bentonite content is less than ~0 .5 percent- age points.
The trends in the ~/dmax versus bentonite content for both the S-GB and the S-PB mixtures shown in Fig. 10b based on the seven-day curing period are essentially identical to those based on the one-day curing period. Also, the A~/dmax values resulting from the different curing periods for the same sand-bentonite mix- ture and bentonite content are -<0.08 kN/m 3 (---0.5 pc÷).
Based on the comparison of results for Test Nos. 13-18 relative to Test Nos. 6-8 and 10-12, the two different curing periods have a small effect on the Wopt and 3'dmax values for the S-GB and the S-PB mixtures at the same bentonite contents and for the same mixing procedure. Except for the trend in Wopt versus bentonite content for the S-GB mixtures prepared using a seven-day curing period, the trends in Wopt and ~/dmax with bentonite content for the two different sand-bentonite mixtures and the two different curing periods are essentially the same. Thus, the compaction results based on the seven-day curing period tend to support the previously reported compaction results based on the one-day curing period for the S-GB and the S-PB mixtures and the same mixing procedure.
Additional data attributing the difference in the trends in W o p t
versus bentonite content for the S-GB mixtures based on the two curing periods to the difference in curing periods is provided in the subsequent discussion.
Effect of Mixing Procedure
A second mixing procedure, Mixing Procedure 2, that involves mixing the dry sand and bentonite before adding the appropriate amount of water to the soil with a spray bottle also was evaluated for a seven-day curing period. The resulting standard compaction curves (ASTM D 698) based on Mixing Procedure 2 for the S- GB and the S-PB mixtures (Test Nos. 19-24, Table 5) also are shown in Fig. 9 for comparison with the compaction curves for Mixing Procedure 1 and a seven-day curing period (Test Nos. 13-18, Table 5).
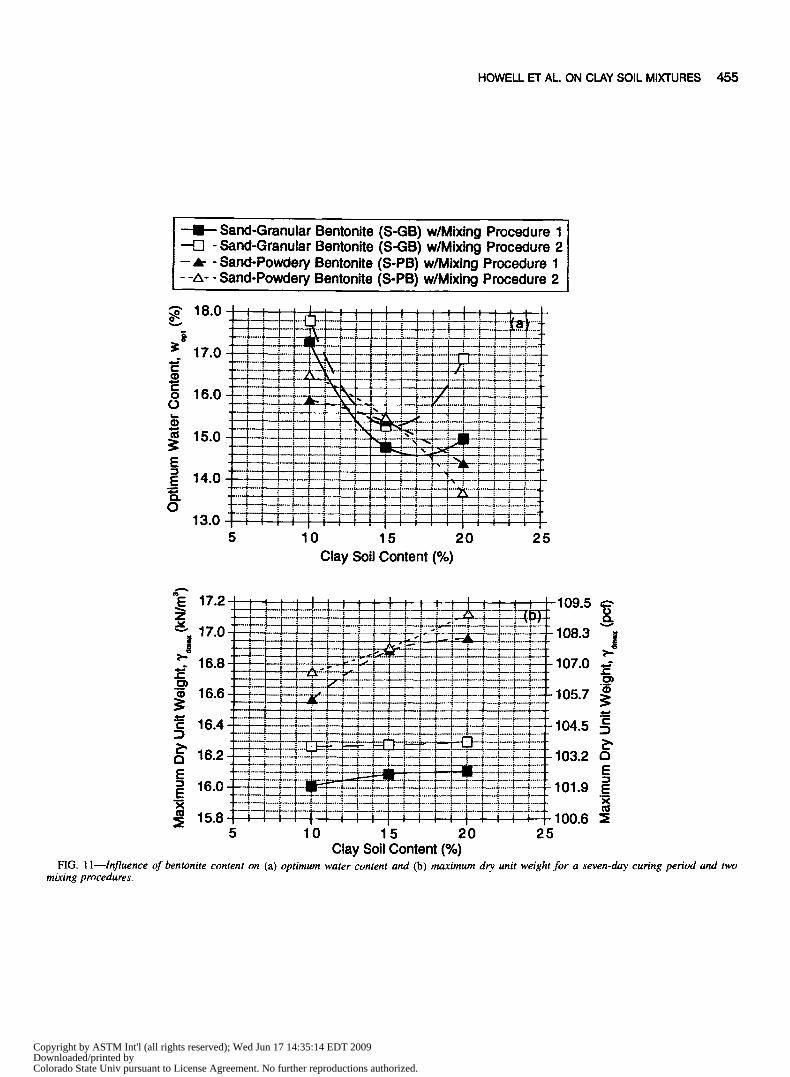
The trends in Woot and 'Ydmax values versus bentonite content based on all of the compaction curves in Fig. 9 are shown in Fig. 11. In general, the trends in the data for both the S-GB and S-PB mixtures are identical regardless of whether Mixing Procedure 1 or Mixing Procedure 2 is used in the compaction. Thus, the different trend in Wop t versus bentonite content obtained for the S-GB mix-
Copyright by ASTM Int'l (all rights reserved); Wed Jun 17 14:35:14 EDT 2009Downloaded/printed byColorado State Univ pursuant to License Agreement. No further reproductions authorized.

454 GEOTECHNICAL TESTING JOURNAL
---BI-- Sand-Granular Bentonite (S-GB) w/l-Day Curing Period I - -O - Sand-Granular Bentonite (S-GB) w/7-Day Curing Period I - A. - Sand-Powdery Bentonite (S-PB) w/l-Day Cudng Period - -z~-- Sand-Powdery Bentonite (S-PB) w/7-Day Cudng Period I
17.5
tg" 17.0
lO.5
16.0 0 15,5
15.0
14.5 ,E_ OK 14.0
13,5 b 10 15 20 25
Clay SO~I Content (%)
J J g g
e -
E E E E
5 10 15 20 25 Clay Soil Content (%)
FIG. lO---lnfluence of bentonite content on (a) optimum water content and (b) maximum dry unit weight for Mixing Procedure 1 and two cur- ing periods.
ture with a seven-day curing period relative to the one-day curing period previously illustrated in Fig. 10a is consistent with respect to the different mixing procedures and, therefore, can be attributed partially to the difference in the curing periods.
Although the trends in Wop t and 'Ydmax versus bentonite content shown in Fig. 11 are consistent regardless of the mixing procedure, some differences in the Wopt and 'Ydmax values based on the different mixing procedures are apparent. Except for the S-PB mixture at 20% bentonite content, the use of Mixing Procedure 2 consistently results in greater Wopt and ~/dmax values than when Mixing Proce- dure 1 is used regardless of the type of bentonite. In addition, the greatest differences in Wopt, or Awopt, of 1.9 percentage points for the S-GB mixture and 0.7 percentage points for the S-PB mixture occur at the highest bentonite content of 20%, whereas the greatest A~dmax values of 0.26 kN/m 3 (1.7 pcf) for the S-GB mixture and 0.18 kN/m 3 (1.0 pcf) for the S-PB mixture occur at the lowest bentonite content of 10%. Both of these relative differences are consistent with the expected effects of an increase in bentonite content on Wopt and 'Ydmax. However, the Awopt at 20% bentonite content and A~dma x at 10% bentonite content are greater for the S-GB mixtures than for the S-PB mixtures. Thus, the particle-size distribution of the bentonite in an air-dried condition apparently affects the results in Wopt and ~dmax at the relatively high and the
relatively low bentonite contents evaluated in this study, respectively.
Except for the S-GB mixture with a 20% bentonite content where the Awop t is 1.9 percentage points, the Awopt values due to the two different mixing procedures (<-0.7 percentage points) are approximately the same as the Awopt values due to the two curing periods (<-0.5 percentage points). Thus, the effects of the two different mixing procedures on Wopt are approximately the same as the effects of the two different curing periods on Wop t. However, the effect of mixing procedure on Wopt may be greater than the effect of the curing period when the initial particle sizes of the bentonite in the air-dried condition are relatively large and the bentonite content is relatively high (e.g., 20%).
Except for the S-PB mixture with a 15% bentonite content, the A~/dmax values based on the two mixing procedures [i.e., 0.16 kN/ m 3 (1.0 pef) <- A"/dma x --.< 0.26 kN/m 3 (1.7 pef)] tend to be greater than the A~dmax values based on the two curing periods [i.e., A'Ydmax <- 0.08 kN/m 3 (<---0.5 pcf)]. Thus, the effect of mixing procedure on ~/dmax of the sand-bentonite mixtures in this study tends to be more significant than the effect of the curing period on ~/dmax-
Sand-Attapuigite Clay-Granular Bentonite Mixtures
Mixing Procedure 1 with a one-day curing period was used to develop compaction curves (Test Nos. 25-30) for the sand- attapulgite clay-granular bentonite (S-AC-GB) mixtures. In this case, two variations in Mixing Procedure 1 were evaluated: (1) a large batch of equal amounts of attapulgite clay and granular bentonite were mixed by dry weight, and the appropriate amount of clay soil from the batch was added in intervals to the wet sand; and (2) appropriate amounts of attapulgite clay and bentonite for each compaction test were weighed individually, mixed together, and then added in intervals to the wet sand. The former procedure is termed the "batch mixing procedure" while the latter procedure is termed the "individual mixing procedure."
The standard compaction curves (ASTM D 698) for Test Nos. 25-30 (Table 5) are shown in Fig. 12, and the trends in the resulting Wopt and ~/amax values versus clay soil content are illustrated in Fig. 13. In general, both the batch mixing procedure and the individual mixing procedure result in the same trends of decreasing "Ydmax and decreasing Wopt with increasing clay soil content. The trend of decreasing Wop t with increasing clay soil content is similar to the same trend previously described for the S-GB mixtures, indicating that the granular bentonite has a dominating effect on Wopt in the S-AC-GB mixtures. However, the trend of decreasing ~/dmax with increasing clay soil content is similar to the same trend previously described for the S-AC mixtures, indicating that the attapulgite clay has a dominating effect on ~/amax for the S-AC- GB mixtures.
The individual mixing procedure results in consistently higher Wopt and ~/dmax values than the batch mixing procedure. Except for the lowest clay soil content of 10%, where A~/amax is 0.27 kN/ m 3 (1.7 pcf), the A'Ydmax values tend to be low [A~/dma x --< 0.05 kN/m 3 (<--0.3 pcf)]. This is consistent with the effect of the mixing procedure on the A~/dma x values for the S-GB and S-PB mixtures previously described. However, the Awop t values based on the individual mixing procedure and the batch mixing procedure are more significant, ranging from 1.2 percentage points to 2.7 percent- age points. Therefore, some consideration should be given to the potential effect on Wop t resulting from differences in mixing proce- dure when dealing with S-AC-GB mixtures.
Copyright by ASTM Int'l (all rights reserved); Wed Jun 17 14:35:14 EDT 2009Downloaded/printed byColorado State Univ pursuant to License Agreement. No further reproductions authorized.
H O W E L L E T A L . O N C L A Y S O I L M I X T U R E S 4 5 5
- - I - - S a n d - G r a n u l a r Bentonite ( S - G B ) w/Mix ing Procedure 1 - - E l - S a n d - G r a n u l a r Bentonite ( S - G B ) w/Mix ing Procedure 2 - i - - S a n d - P o w d e r y Bentonite (S -PB) w/Mix ing Procedure 1 - -zx- - S a n d - P o w d e r y Bentonite (S -PB) w/Mix ing Procedure 2
v
Q .
t,-
t,,,,. 0
0 L
E
E
0
1 8 . 0 ~ . . . . ~ . . . . , . . . . , , . f I ~ I ' I ! ' ! l I - t - - - , - . - e - - - - , - - l - r ' - ~ 4 - - i . - ~ . - - l - - ! - + - l - . ~ . - - - + - - i ~ o - t - A L ~ ] I I " ' ! ~ I I I 1 I I I I I I : I ~I~l T - ' T - - ' ~ , - 1 ~ - ' - l ~ - T - - - l - - - r - - i - - - - T - - - r - " T - . t ---T----T--r---~.---- . -r.-- ~ t - - . t . - l i ~ . l - - - . F - - i - - . . . i - . - , ~ _ . _ I . - . . i . _ _ . i . _ _ . ' _ . . ~ _ . . . f _ ~ . . ' .......=_._i .... + , . . - . + . ~ . - - . ~ t - ~ . . ~ . - i - - i - - 4 - - . ! - _ 4 - - b - . t - _ I - - - I _ _ . ! - _ ~ . _ .~._ I ....
1 7 . 0 - , ' - - - = - - ~ i - . . . . . . . • ~__i. , _ . ~ _ ~ . . . . ~ _ ~ . . . . _~ ~ . . . . . i ' i ~ [ ' i i -'~" - q " 4-4- ~-.!--+-I~-i--~ .-~-~-~:-~:..~L~: -~-+.-~:
t-~--.-b-.p.-~--.~-~.~÷-.+-+-+--!-.'..~ ,-!-q4_i--~.." .-..~....__p_
~ ; ; i i i i \ . ~ _ l t t I I - ' - ~ :. , 1 6 . 0 - ~ - - ~ - , - * - - - ~ - , . ~ - - * - - ~ - - ~ - ~ - - ~ - - ~ - - - ~ . . . . . ~- - ~ ' . . ~ . - = ~ . , = ~ - - ~ ~ F ~ - ~ - - ~ - ~ - - - - . - f - t ~ , , , - -7 - - i " " - - - a , - . , - ~ - : - ~ I , ' - ~ - - i i - - . i i t i i ! i i ~ ~ L ~ Z ~ J _ L . _ 4 - - ~ _ _ - - L - ~ _ . ' _ L _ L . _ . :
I : I f i i : ; : = l = : : : . . . . . . . . .
1 5 . 0 . . . . . . . . . . . . . . . . . i ~ - ~ - - - ~ - - . i - - - . , - - .,--- ; - 4 - - - ~ 4 - + - ~ , ~ - - ~ - I . . . . . . . . . . . . . . . . . . . . +-q--,' ~ . ~q--+- .-F-F-4-1~-+-~:{.~--p ............ ~--F~.---+--~-P..-.~-+.--~ ~ i ~ ~ - i i --~-~.--------: ~ ~ - , ~--~- ..... , .......
• .___L. i i i : : • . = , - r - : : • l - - - i - - - . k - - k - - F - - - i - - , , i i I ~ ' - - t ~ ' ¢- . . . . . . . . . . 1 4 . 0 , ~ . . . . i , , . ! , , . - b " + - ~ F - . ' -+--+--4- . . . . ' - -~ - - - ' ~ - , - - - - ~ + - ' - .-r',-T- . . . . . . . . . . . J , - - - L - - L ~ . L . _ : ~ : : = l : = ~ - - : . = = ~ :
~ ' L ~ f i t ~ i : i i i t t ; l ~ , . : : i / i i f ' 't : I i - - 7 7 " - ' ~ . i ! I i T l I - - ' : t ~ ! i . ~ i t i t i ! I t : : i ! i l :
13.0 1 ! ! ! - T - F - t ~ , , ! ! I ! t ! i ! I , i - - 5 1 0 1 5 2 0 2 5
C lay Soil Content (%)
I , , , , I , , , , i , • . , I , , , , I 1 7 . 2 , , , , ~ __~ ~ , , , ~ , , ~ , , I t 109 .5 ~--SS-._ _ ~ - ~ - l " - - , ~ - - ~ ' - - ' t - : ' t - -~ . . . . . . .; - ~ . : . " r - t ~ ' T u 1---i-T'T ..--I~= "i ~ "-'!".--" F- ~ r 7--I--~i • "-r--T--F-%~'tT -- ~ --n--- .--- . i i ~ -v--~---~--~-- .-r ----
• ~ . u ~ - " t - - T - ' ~ - T - - . - r - - , - - r - . , i ~ ' . 4 = i .~ .~ j~ - - - r - - -~ - - , , - - -~ r - - -T - ~ u o . o ~ I 1 i ! i '| l ) - " t ' ~ l - , A~-=~--I--I i = ~ : ; "-~ 1
, o . o ~ ~ . V - f - : ? + " ~ - + - ~ , - - t - - ~ - : - + - + I w . u . ~ ~ . - ! - ~ , - , , ~ : I ~ ~ - l - , - t ~ i ' - , - - ± ~ ~ - - - + - - + K l i .= ~ ,,. - I - - - - ; - - - f - - . - + - - ~ - - - r - - - F - - = . ', I "; I - - . 4 - - - .i. -4-----4-- ' ; ---- i- . . --I- ,, , . , , . . . . ,
m o . o ~ - ~ - . - - ~ - - ~ . ~ , ~ . 4 - . 4 . - - . ~ - - ~ + - - ~ , ~ - ~ - - i I -+--i---4--, .L.-. . t -- m u o . / ~ - , , i . . . . . . - ~ - - ~ - . ~ - . r ~ . . . . - p - - ~ . ' ~ i " " . . . . ~ . - -4 - . . -+ 1 i 1 i t .: ~ ~ i ~ ~ i l .,' .: i #
l - - - .+ - - l - -~ . . , -~ . . - - l - - - -~ - - e . . . . . t - . -+ -* - -~ - . . . . . - + ~ l.-.-----t-----t.----p.'--i.--.=...---+.'--~-.l.-.--~..-.i.--.--t---z--J...,, i . - . - i~ i - - i . . . . . . . . ~ b- . . .~ . . : , . . - -+- . . .~ .4- . . - - i .~ . i . . . - . ! . -a . - - . i . - -~- . . .~ . . t - - -~ . - . i - . -= . . - - .~- - l - - . . i - - j ~ . L . . . J , _ ~ . - . . . . ~ _ . = _ L . . . r q . _ L . . i = ! r L . . . i . _ . ~ _.~.....JL__. t - - V .-4---F--t-4_:.1-~-;-~--%--- ~ ~ - - t ~ - : 4 - - ~ - - i _ _ 4 .. . . i l . i | • : : • = : 1 : 1 - - - - - ; , = : . l . . - - . ~ , - - . . . r - . - - . r . . . . ~ - - . . + - - . . . ~ . - - . ~ _ . - + _ _ i . - - , . ~ . . b _ _ . . ~ . . . _ t - - . - - ÷ . _ _ . i - _ . . ~ _ . - - : . . . . . .
• l • = = • • = ~ . l I ~ t l : :
l - . - ~ - - . . ~ - 4 - . ~ ~ t - - ~ - ' . . ~ ' . ~ - - ~ - - ~ . . . . l : l • = l = ~ . l * ~ . ~ =
, - t - f . . . . . . ! . . . . . ' r i - i - ! q F f , F ~-i ...... - i - ] - [ -
, - 16.4
~ ' 16.2 Cl E = 16 .0 E
e -
" 1 0 4 . 5 D
103.2 a E ::3
101.9 E X
a i ¢0 : l 15.8 100.6 : i
5 1 0 1 5 2 0 2 5 Clay Soil Content ( % )
FIG. 1 l--Influence of bentonite content on ( a ) optimum water content and ( b ) maximum dry unit weight for a seven-day curing period and two mixing procedures.
Copyright by ASTM Int'l (all rights reserved); Wed Jun 17 14:35:14 EDT 2009Downloaded/printed byColorado State Univ pursuant to License Agreement. No further reproductions authorized.

4 5 6 GEOTECHNICAL TESTING JOURNAL
l ' n m l e s l S ignt f l csaee
The results of this study indicate that differences in Wop~ and 'y/max values based on laboratory compaction of sand-processed clay soil mixtures can occur due to differences in the amount and type of processed clay soil used in the mixture as well as differences in the curing period and the mixing procedure used with a given sand-clay soil mixture at a given clay soil content. Although the differences in Wopt and 'y/max values reported in this study are relatively small in most cases, the magnitudes of these differences may be significant in some practical applica- tions. For example, in the case of construction specifications for compacted clay liners and covers that require compaction at a field water content, w~ greater than or equal to the optimum water content based on laboratory compaction (i.e., wf >- WopO, a small difference in Wopt can have a significant effect on the resulting hydraulic conductivity of the compacted clay liner. However, this effect will depend on the sensitivity of the hydraulic conductivity to the compaction water content which, in the case of the use of sand-clay soil mixtures, may not be as significant as in the case of natural clay soils (e.g., Kraus
(a) Batch Mixing Procedure
--- " "Q-" 10% Clay Soil (5% AC + 5% GB) ~-]7-!'~- ' " 1 6 . 2 ' ~ --El - 15% Clay Soit (7.5% AC + 7.5% GB) _.~_
-- i t " "20% Clay Soil (10% AC + 10% GB) ;~L103 .2
~" 15 .9 -~-I1+4~. ' ~ ~ ~ ~ 4 + + - : 101.3 . ~ . ~ " ' -i- . ! - - ~ - * . + : .++~w. -H: -~ . ' - 4 - - .~ -~ - .
i ~ i[ : : : ; i : : ' i ~ . - i + ~ ~ " + " "- ~ . . ¢ 4 - ~ . " ~ + ~ - - , ~ . - ~ - ~ - ~ - "- 15.6 L -++-+-~-++.+-~.,-.~-+_~..~..~_',+5-V.:~-+~..+ .-~.4~.+..;_~ - 99.4 • ~ - + - ~ ~ - . ~ + .'s-H~ , - ~ ; - ~ - . ~ ~ - ~ - + -
t I t ! 1 i " i i ~ " ~ l " , i I . t . T ' ~ i i i i i i I i = . , ~ ~'-,+"r'r-i-r ,'1-1"~i--r'+'~*-~*" .'r-r-i-~"~-r-~-r-r'+'~-r~,+."*-'~ - ; 97.4 ca
~4---~~-~-~+. t + " - " + + - ~ ~ - + - - ~ ~++ - .-r-z', ~ ~ i i l I ~ ~ i ~ - - ~ ~ ' - ~ T
e ,
Z }
ca 15.3 '
15.0,' L95.5 10 12 14 16 18 20 22 24 26
Molding Water Content, w (%)
(b) Individual Mixing Procedure
g - . ,
~-" 3 5
. ~
Q
et al. 1997). Nonetheless, the potential significance of this effect must be evaluated on a case-by-case basis.
Surnnmry and Conclusions
The expected trends of increasing Wopt and decreasing 'ydrnax with increasing clay soil contents from 10 to 20% were observed for the sand-attapulgite clay (S-AC) mixtures. However, for clay soil contents ranging from 10 to 20%, Wopt decreased with increas- ing clay soil content for both the sand-granular bentonite (S-GB) mixtures and the sand-powdery bentonite (S-PB) mixtures, whereas 'ydmax increased for the S-PB mixtures and remained relatively constant for the S-GB mixtures. The relative differences in these trends are attributed, in part, to (1) the greater water sorptivity and lower swelling potential of attapulgite clay relative to the two bentonites, (2) the larger particle sizes of the granular bentonite in the air-dried condition relative to the powdery benton- ite, and (3) the possible correlation between the Wopt and the PI of the sand-bentonite mixtures.
In general, the two different curing periods (one-day and seven- day) considered in this study had a small effect on the Wopt and'y/max values for the S-GB and the S-PB mixtures at the same clay soil contents and for the same mixing procedure, For example, the Awopt values and A'ya~nax values resulting from the two different curing periods were ~0.5 percentage points and -<0.08 kN/m 3 (-<0.5 pef), respectively. However, the different curing periods did result in dif- ferent trends in'yamax versus bentonite content for the S-GB mixtures relative to the S-PB mixtures, possibly due to the different particle- size distributions of the two bentonites in the air-dried condition.
Mixing the sand and bentonite in a dry condition before adding water consistently resulted in greater Wopt and 'y/max values than mixing the sand with the appropriate amount of water before adding the bentonite regardless of the type of bentonite. However, the Awop t values tend to be the greatest at the 20% bentonite content, whereas the A'y/max values tend to be the greatest at the 10% bentonite content for a given sand- bentonite mixture. Also, the difference in Wop t at 20% bentonite content and "Y/max at 10% bentonite content are greater for the S-GB mixtures than for the S-PB mixture. This difference between the S-GB mixtures and the S-PB mixtures again is attributed, in part, to the different particle-size distributions of the two bentonites in the air-dried condition.
The mixing of the attapulgite clay and granular bentonite together in small amounts for each individual compaction point for the sand-attapulgite clay-granular bentonite (S-AC-GB) mixtures consistently resulted in higher 'ydmax and Wopt values relative to mixing the attapulgite clay and granular bentonite together in large amounts sufficient to cover all compaction points for the S-AC- GB mixtures. Whereas the A'ydmax values resulting from these two mixing procedures tend to be low [A'ydmax <--- 0.05 kN/m 3 (<--0.3 pcf)], the AWop t values are more significant, ranging from 1.2 percentage points to 2.7 percentage points. Therefore, some consid- eration should be given to the potential effect on Wopt resulting from differences in mixing procedure when dealing with the same or similar S-AC-GB mixtures.
10 12 14 16 18 2 0 2 2 2 4 2 6 Molding Water Content, w (%)
FIG. 12--Standard compaction curves (ASTM D 698)for sand-anapul- gite clay-granular bentonite (S-AC-GB) mixtures for a one.day curing period and two different mixing procedures [AC = attapulgite clay; GB = granular bentonite].
Acknowledgments
Financial support for this study was provided by the U.S, National Science Foundation (NSF) under Grant MSS-9257305 as part of a larger study devoted towards evaluating the properties of sand-processed clay soil mixtures. This support is gratefully
Copyright by ASTM Int'l (all rights reserved); Wed Jun 17 14:35:14 EDT 2009Downloaded/printed byColorado State Univ pursuant to License Agreement. No further reproductions authorized.
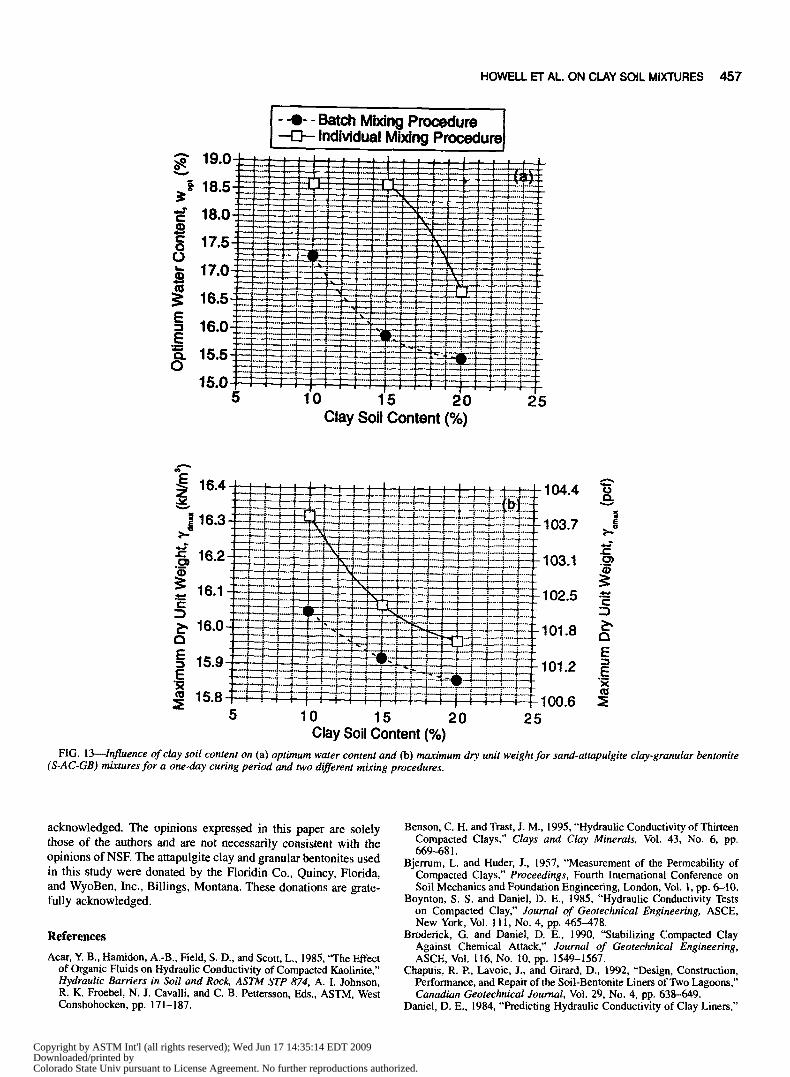
H O W E L L E T AL , O N C L A Y S O I L M I X T U R E S 4 5 7
[ l ~ ~ t ~ M~ P~U~ I Individual Mixing Procedure/
J ~ - ~ ..... ; r I ' ' -
" 4 ~ m , : : t ~ ~ | - - - . ,. -q.-- ] ~ . . . . .
.~*~ : 1 : : : ~ . . ~ , , t t ~-L-- 'P-_' ; l " k - I I 4 - - . P - ~ ........
1 7 5 .... , I ~ ; ' • ' . .....
I / . u . L L _ L I I I - 4 : 4 : 1 l , , l I 1 ; M x . T - ' 4 - - - : ~ r ~ : . - : - ' " .'LZ" P " " -
: - ' t - , . . . . . . . --+--
16 0 ' " ~ ~
%-Pz+ . : - T - : : ~ ~ ~ ~ : : : : : . h : :
Clay Soil C o n t e n t ( % )
2 5
a-"
,,I L'~, .a 1 , I t * I * : I I o . 4 ~ L L ~ I . | l I I l : I I t I I 1 1 3 4 . 4
= - , , , - , - , ' ~ - ' j : - ~ - i ' : - - - t - ~ . - - P - k - - - r - ~ : ! - 4 - - : : : - ~ - - - 4 - - ~ 1 0 3 . 7
1 6 . 2 . k ~ d . . . . _ ~ , _ ~ __i_ \ ~ t t t ! ; .--:- ~ -~-----,-----q.---4---+..~i:::~_~ ~ " 1 0 3 . 1 • - - ~ ~ + - - ~ - - - ~ - - i - - 4 - - - ~ , - ~ - - ~ - . . . 4 - - " ~ m I ~ ~ ~ ' f .'~g_..2.z_.d._.d_ ~ ~_._L_..2___L__: : : ID
• - • ~ , - - - ~ - ~ - ~ : =-r--~ . . , , ~--1 ' : ~ - - - + - ~ - 1 0 2 . 5 I 1 : I | : l : : : ~
• ~ 1 6 0 ~ ~ t - - h , ~ . . ~ - I - - P - P ; .--P--~---~--.--., ..... ~ . , ~ " • ~ .... 101.8
= : .... E
. ~ :-T'-. T ' - i ~ i ~ -.~.-k--k ~ -~ ~ "--~."II--P-+---: ~--~-- "-- 1 5 8 _ ~ , . T - - T - - r - - r - - t - ~ , - - r - - t - - r - r - ~ f - - - i - + - f . . . . . . p -
~_ . . . . . , . . . . , , , ' . . , . . . . 100.6 ~E 5 10 15 20 25
C l a y S o i l C o n t e n t ( % )
FIG. 13--Influence of clay soil content on (a) optimum water content and (b) maximum dry unit weight for sand-attapulgite clay-granular bentonite (S-AC-GB) mixtures for a one-day curing period and two different mixing procedures.
acknowledged. The opinions expressed in this paper are solely those of the authors and are not necessarily consistent with the opinions of NSE The attapulgite clay and granular bentonites used in this study were donated by the Floridin Co., Quincy, Florida, and WyoBen, Inc., Billings, Montana. These donations are grate- fully acknowledged.
R e f e r e n c e s
Acar, Y. B., Hamidon, A.-B, Field, S. D., and Scott, L., 1985, "The Effect of Organic Fluids on Hydraulic Conductivity of Compacted Kaolinite," Hydraulic Barriers in Soil and Rock, ASTM STP 874, A. I. Johnson, R. K. Froebet, N. J. Cavalli, and C. B. Pettersson, Eds., ASTM, West Conshohocken, pp. 171-187.
Benson, C. H. and Trast, J. M., 1995, "Hydraulic Conductivity of Thirteen Compacted Clays," Clays and Clay Minerals, Vol. 43, No. 6, pp. 669--681.
Bjerrum, L. and Huder, J., 1957, "Measurement of the Permeability of Compacted Clays," Proceedings, Fourth International Conference on Soil Mechanics and Foundation Engineering, London, Vol. I, pp. 6-10.
Boynton, S. S. and Daniel, D. E., 1985, "Hydraulic Conductivity Tests on Compacted Clay," Journal of Geotechnical Engineering, ASCE, New York, Vol. 111, No. 4, pp. 465-478.
Broderick, G. and Daniel, D. E., 1990, "Stabilizing Compacted Clay Against Chemical Attack," Journal of Geotechnical Engineering, ASCE, VoL 116, No. 10, pp. 1549--1567.
Chapuis, R. P, Lavoie, J., and Girard, D., 1992, "Design, Construction, Performance, and Repair of the Soil-Bentonite Liners of Two Lagoons," Canadian Geotechnical Journal, Vol. 29, No. 4, pp. 638-649.
Daniel, D. E., 1984, "Predicting Hydraulic Conductivity of Clay Liners,"
Copyright by ASTM Int'l (all rights reserved); Wed Jun 17 14:35:14 EDT 2009Downloaded/printed byColorado State Univ pursuant to License Agreement. No further reproductions authorized.

458 GEOTECHNICAL TESTING JOURNAL
Journal of Geotechnical Engineering, ASCE, New York, Vol. 110, No. 2, pp. 285-300.
Daniel, D. E., 1987, "Earthen Liners for Land Disposal Facilities," Geotechnical Practice for Waste Disposal, R. D. Woods, Ed., Geotechni- cal Special Publication No. 13, ASCE, New York, pp. 21-39.
Daniel, D. E. and Benson, C. H., 1990, "Water Content-Density Criteria for Compacted Soil Liners," Journal of Geotechnical Engineering, ASCE, Vol. 116, No. 12, pp. 1811-1830.
Day, S. R., 1994, "The Compatibility of Slurry Cutoff Wall Materials with Contaminated Groundwater," Hydraulic Conductivity and Waste Contaminant Transport in Soils, ASTM STP 1142, D. E. Daniel and S. J. Trautwein, Eds., ASTM, West Conshohocken, PA, pp. 284-299.
Day, S. R. and Daniel, D. E., 1985, "Hydraulic Conductivity of Two Prototype Clay Liners," Journal of Geotechnical Engineering, ASCE, New York, Vol. 111, No. 8, pp. 957-970.
Elsbury, B. R., Daniel, D. E., Sraders, G. A., and Anderson, D. C., 1990, "Lessons Learned from Compacted Clay Liner," Journal of Geotechni- cal Engineering, ASCE, New York, Vol. 116, No. 1l, pp. 1641-1660.
Garlanger, J. E., Cheung, E K., and Bishar, S. T., 1987, "Quality Control Testing for a Sand-Bentonite Liner," Geotechnical Practice for Waste Disposal '87, R. D. Woods, Ed., Geotechnical Special Publication No. 13, ASCE, New York, pp. 488--499.
Gipson, A. H., Jr., 1985, "Permeability Testing on Clayey Soil and Silty Sand-Bentonite Mixture Using Acid Liquor," Hydraulic Barriers in Soil and Rock, ASTM STP 874, A. I. Johnson, R. K. Froebel, N. J. Cavalli, and C. B. Pettersson, Eds., ASTM, West Conshohocken, PA, pp. 140-154.
Gleason, M. H., Daniel, D. E., and Eykhnlt, G. R., 1997, "Calcium and Sodium Bentonite for Hydraulic Containment Applications," Journal of Geotechnical and Geoenvironmental Engineering, ASCE, Vol. 123, No. 5, pp. 438-445.
Hausmann, M. R., 1990, Engineering Principles of Ground Modification, McGraw-Hill, Inc., New York.
Howell, J. L and Shackelford, C. D., 1997, "Hydraulic Conductivity of Sand Admixed with Processed Clay Mixtures," Proceedings, Fourteenth International Conference on Soil Mechanics and Foundation Engi- neering, Hamburg, 6-12 Sept. 1997, Balkema, Rotterdam, Vol. 1, pp. 307-310.
Kenney, T. C., van Veen, W. A., Swallow, M. A., and Sungaila, M. A., 1992, "Hydraulic Conductivity of Compacted Bentonite-Sand Mix- tures," Canadian Geotechnical Journal, Vol. 29, No. 3, pp. 364-374.
Kraus, J. E, Benson, C. H., Erickson, A. E., and Chamberlain, E. J., 1997, "Freeze-Thaw Cycling and Hydraulic Conductivity of Bentonitic Barriers," Journal of Geotechnical and Geoenvironmental Engineering, ASCE, Vol. 123, No. 3, pp. 229-238.
Lambe, T. W., 1958, "The Engineering Behavior of Compacted Clay," Journal of the Soil Mechanics and Foundations Division, ASCE, Vol. 84, No. SM2, pp. 1-35.
Lambe, T. W., 1959, "Closure to: The Engineering Behavior of Compacted Clay," Journal of the Soil Mechanics and Foundations Division, ASCE, Vol. 85, No. SM4, pp. 121-123.
Leroueil, S., Le Bihan, J. P., and Bouchard, R., 1992, "Remarks on the Design of Clay Liners Used in Lagoons as Hydraulic Barriers," Cana- dian Geotechnical Journal, Vol. 29, No~ 3, pp. 512-515.
Lundgren, T. A., 1981, "Some Bentonite Sealants in Soil Mixed Blankets," Proceedings, Tenth International Conference on Soil Mechanics and Foundation Engineering, Stockholm, 15-19 June, Balkema, Rotterdam, Vol. 2, pp. 349-354.
Mitchell, J. K., Hooper, D. R., and Campanella, R. G., 1965, "Permeability of Compacted Clay," Journal of the Soil Mechanics and Foundations Division, ASCE, Vol. 91, No. SM4, pp. 41-66.
Mundell, J. A. and Bailey, B., 1985, "The Design and Testing of a Com- pacted Clay Barrier Layer to Limit Percolation through Landfill Covers," Hydraulic Barriers in Soil and Rock, ASTM STP 874, A. I. Johnson, R. K. Froebel, N. J. Cavalli, and C. B. Pettersson, Eds., ASTM, West Conshohocken, pp. 246-262.
O'Sadnick, D. L., Simpson, B. E., and Kasel, G. K., 1995, "Evaluation and Performance of a Sand/Bentonite Liner," Geoenvironment 2000, Y. B. Acar and D. E. Daniel, Eds., Geotechnical Special Publication No. 46, ASCE, New York, pp. 688-701.
Ryan, C. R., 1987, "Vertical Barriers in Soil for Pollution Containment," Geotechnical Practice for Waste Disposal '87, R. D. Woods, Ed., Geotechnical Special Publication No. 13, ASCE, New York, pp. 182-204.
Seed, H. B., Woodward, R. J., Jr., and Lundgren, R., 1964a, "Clay Mineral- ogical Aspects of the Atterberg Limits," Journal of the Soil Mechanics and Foundations Division, ASCE, Vol. 90, No. SM4, pp. 107-131.
Seed, H. B., Woodward, R. J., Jr., and Lundgren, R., 1964b, "Fundamental Aspects of the Atterberg Limits," Journal of the Soil Mechanics and Foundations Division, ASCE, Vol, 90, No. SM6, pp. 75-105.
Shackelford, C. D., 1994, "Waste-Soil Interactions that Alter Hydraulic Conductivity," Hydraulic Conductivity and Waste Contaminant Trans- port in Soil ASTM STP 1142, D. E. Daniel and S. J. Trautwein, Eds., ASTM, West Conshohocken, pp. 111-168.
Shackelford, C. D. and Redmond, P. L., 1995, "Solute Breakthrough Curves for Processed Kaolin at Low Flow Rates," Journal of Geotechnical Engineering, ASCE, Vol. 121, No. 1, pp. 17-32.
Skempton, A. W., 1953, "The Colloidal Activity of Clays," Proceedings, Third International Conference on Soil Mechanics and Foundation Engi- neering, Zurich, Vol. I, pp. 57-61.
Stewart, J. P. and Nolan, T. W., 1987, "Infiltration Testing for Hydraulic Conductivity of Soil Liners," Geotechnical Testing Journal ASTM, West Conshohocken, Vol. 10, No. 2, pp. 41-50.
Tobin, W. R. and Wild, P. R., 1986, Attapulgite: A Clay Liner Solution? Ovil Engineering, ASCE, New York, Vol. 56, No. 2, pp. 56-58.
Copyright by ASTM Int'l (all rights reserved); Wed Jun 17 14:35:14 EDT 2009Downloaded/printed byColorado State Univ pursuant to License Agreement. No further reproductions authorized.